regression and arima hybrid model for new bug prediction · abstract—a multiple linear regression...
TRANSCRIPT
Madhur Srivastava et al. / (IJCSE) International Journal on Computer Science and Engineering Vol. 02, No. 08, 2010, 2622-2628
Regression and ARIMA hybrid model for new bug prediction
Madhur Srivastava Dept. Of Computer Science and
Application C.S.A.I.S.T.
Jhansi (U.P.), INDIA
Dr.Dharmendra Badal Dept. of Math.Sciences and
Computer Application Bundelkhand University,
Jhansi(U.P.), INDIA
Ratnesh Kumar Jain Dept. of Comp.Science and
Application Dr. H.S. Gaur Central University,
Sagar(M.P.), INDIA
Abstract—A multiple linear regression and ARIMA hybrid model is proposed for new bug prediction depending upon resolved bugs and other available parameters of the open source software bug report. Analysis of last five year bug report data of a open source software “worldcontrol” is done to identify the trends followed by various parameters. Bug report data has been categorized on monthly basis and forecast is also on monthly basis. Model accounts for the parameters such as resolved, assigned, reopened, closed and verified bugs respectively. Real time monthly data of these parameters from 2003 to 2007 is taken for multiple regression then hybrid model does monthly forecast for 2008. Model is basically hybrid of linear regression and ARIMA(p,0,p) where p = 1,2,3. Results show that monthly forecast of new bugs considering five predefined factors is far more accurate by hybrid model than just time series ARIMA forecast of new bugs. Hybrid of linear regression and ARIMA (3,0,3) gave best results.
Keywords-regression;hybrid;ARIMA
I. INTRODUCTION AND SCOPE
Software quality is of paramount importance to many projects. Quality Assurance (QA) plays an important role in the development of software project, especially in the reviewing and testing stages. The role of QA is to know how to identify fault-prone modules, how many faults have escaped from review and testing to the released products, the relationship between faults and failures, when to release software, and how good the quality of the shipped software is. Its always been very difficult to forecast new bugs which are going to appear in the software sometimes also because of unavailability of reliable data. Basically, open source refers to software in which the source code is available to the general public for use and/or modification from its original design, free of charge. This is a definition provided by webopedia [1]. As the open source initiative (OSI) [2] points out, open source does not just mean access to the source code and documents. It implies a global collaborative model for building quality software, with quick bug fixing and quick increments and changes of software features based on end-users’ requirements. As open source is a relatively novel software development approach differing significantly from proprietary software waterfall model, we do not yet have any mature or stable technique to assess open source software reliability. In the context of open source software, the users and the use patterns are diverse. The use profiles of the open source product determine its
reliability. Different groups of users use the open source software in different ways. Even if software rarely fails and thus demonstrates high reliability for most users, it may still perform poorly for some others. The software is of poor quality from the view-point of these unfortunate few users. But on average the software is of high reliability, as Bosio et al. [3] explained. So by open source software reliability, we refer to the average reliability among all users and all the use profiles of the products.
Open Source initiative Bugzilla to prepare a database of new (n) bugs reported , resolved (r1), verified (v), closed (c), assigned (a) and reopened (r2) has lead to greater transparency into the bugs analysis. Several software users report various bugs very month, some bugs are resolved, some are closed while some are assigned. Data regarding all these attributes are available in the bug reports of software provided by bugzilla. Hence the basic aim of this research work is to forecast new bugs which are identified every month by open source software users. This work proposes a new approach considering the factors which are present in the bug report to model new bugs reported each month. We have collected monthly data of various new, resolved, assigned, verified and closed bugs over last five years from jan-2003 to dec-2008. Data of various factors from 2003-2007 will be used for training the variables of the model while forecast is made for the year 2008 and is also graphically compared with it. Bug reports of the software “worldcontrol” [4] has been analyzed.
A. Landfill: THE BUGZILLA TEST SERVER
Bugzilla is a "Defect Tracking System" or "Bug-Tracking System". Defect Tracking Systems allow individual or groups of developers to keep track of outstanding bugs in their product effectively. Most commercial defect-tracking software vendors charge enormous licensing fees. Despite being "free", Bugzilla has many features its expensive counterpart’s lack. Consequently, Bugzilla has quickly become a favorite of hundreds of organizations across the globe. Main functions of bugzilla includes-
Track bugs and code changes Communicate with teammates Submit and review patches Manage quality assurance (QA)
ISSN : 0975-3397 2622

Madhur Srivastava et al. / (IJCSE) International Journal on Computer Science and Engineering Vol. 02, No. 08, 2010, 2622-2628
Bugzilla can help you get a handle on the software development process. Successful projects often are the result of successful organization and communication. Bugzilla is a powerful tool that will help your team get organized and communicate effectively.
Landfill is the home of test installations for Bugzilla. These are demo installations that you can use to "try out" Bugzilla. They're also useful if you are a developer and you want to try to reproduce a bug that somebody has reported.
B. TIME SERIES ANALYSIS AND ARIMA
Generally in research and practice, patterns of the data are unclear, individual observations involving considerable error, and we still need not only to uncover the hidden patterns in the data but also generate forecasts. The ARIMA methodology developed by Box and Jenkins (1976) allows us to do just that; it has gained enormous popularity in many areas and research practice confirms its power and flexibility (Hoff, 1983; Pankratz, 1983; Vandaele, 1983). However, because of its power and flexibility, ARIMA is a complex technique; it is not easy to use, it requires a great deal of experience, and although it often produces satisfactory results, those results depend on the researcher's level of expertise (Bails & Peppers, 1982).
Autoregressive Integrated moving average model (ARIMA):- The general model introduced by Box and Jenkins (1976) includes autoregressive as well as moving average parameters, and explicitly includes differencing in the formulation of the model. Specifically, the three types of parameters in the model are: the autoregressive parameters (p), the number of differencing passes (d), and moving average parameters (q). In the notation introduced by Box and Jenkins [5] , models are summarized as ARIMA (p, d, q); so, for example, a model described as (0, 1, 2) means that it contains 0 (zero) autoregressive (p) parameters and 2 moving average (q) parameters which were computed for the series after it was differenced once.
A series may be relatively homogeneous, looking pretty much the same at all time periods, but it may end up being non-stationary simply because it shows no permanent affinity for a particular level or mean [6] . Even though the original series of data may not be stationary, differences between successive observations may be stationary:
dt = yt - yt-1 = (1 - B)yt. -----(1)
Simply put, we can apply an ARMA model to the dt. When we do so, this is called an ARIMA model with the middle I referring to the fact that it is integrated. If the first differences are not stationary, the second differences might be, i. e
dt = dt - dt-1 = (1 - B)(1 - B)yt.-----(2)
The ARIMA(1,1,1) process, with the middle number referring to the number of differences that are taken can be described as
.)1(
)(
112111
1111
1111
ttttt
tttttt
tttt
eeyyy
eeyyyy
eedd
In general, during the parameter estimation phase a function minimization algorithm is used (the so-called quasi-Newton method, to maximize the likelihood (probability) of the observed series, given the parameter values. In practice, this requires the calculation of the (conditional) sums of squares (SS) of the residuals, given the respective parameters. Different methods have been proposed to compute the SS for the residuals: (1) the approximate maximum likelihood method according to McLeod and Sales (1983), (2) the approximate maximum likelihood method with backcasting, and (3) the exact maximum likelihood method according to Melard (1984).
C. LINEAR REGRESSION WITH ONE INDEPENDENT VARIABLE
Linear regression assumes a linear relationship between the dependent and independent variables
Yi = b0+b1X1+i, i = 1… n---(3)
Yi – dependent variable
b0 – intercept
b1X1 – slope times independent variable
i – error term
In the regression which contains one independent variable (X), the slope coefficient equals Cov(Y,X) / Var(X). Assumptions of linear regression:
1. The relationship between the dependent variable, Y, and the independent variable, X, is linear in the parameters b0 and b1. The requirement does not exclude X from being raised to a power other than 1.
2. The independent variable, X, is not random.
3. The expected value of the error term equals to 0.
4. The variance of the error term is the same for all observations (homoskedasticity assumption)
5. The error term is uncorrelated across observations.
6. The error term is normally distributed.
Regression analysis uses two principal types of data:
Cross-sectional: data, which involves many observations on X and Y for the same time period
Time series: data that use many observations from different time periods for the same company, assets class, investment fund, person, country etc.
In our case we are using time series data for performing the regression. This paper does linear regression with
ISSN : 0975-3397 2623

Madhur Srivastava et al. / (IJCSE) International Journal on Computer Science and Engineering Vol. 02, No. 08, 2010, 2622-2628
multiple independent variables which is not conceptually different from same using single independent variable.
II. PROBLEM DESCRIPTION AND SCOPE
Bug report data of the software “worldcontrol” has information about various factors related to software reliability and durability as reported by users over a period of time. Main problem faced in this case is of forecasting new bugs which are going to appear in the coming month. New bug discovery depends upon various factors like bugs resolved, verified, closed, reopened, assigned. So only time series analysis technique like ARIMA, will not solve the purpose of considering all the above mentioned factors. We require a new approach which could consider above mentioned factors as well as autoregressive effect which is capture by ARIMA models. Hence we require more innovative model to capture the desired effects.
III. HYBRID MODEL STRUCTURE
Linear regression analysis considering new (n) bugs obtained in a month as dependent variable and other five r1, r2, v, a, c are considered as independent variable Data taken for regression analysis is the last four year monthly data from 2003-2007 of an open source project Worldcontrol as provided in open source bug report database. By simulation values of various constants involved is obtained. The regression equation is of the form:- new = C0 + C1* assigned + C2 * reopened + C3 * resolved + C4 * verified + C5 * closed -------(4) C0, C1, C2, C3, C4, C5 all are constants. Now the five variable involved r1, r2, a, v, c are forecasted for next 12 observations using various ARIMA models depending upon their fit and seasonality. In this research work ARIMA(p,0,p) models are utilized to forecast the factors where p = 1,2,3. Hence , ARIMA(1,0,1), ARIMA(2,0,2) and ARIMA(3,0,3) has been used to forecast the factors for next twelve observations. Forecast of dependent variable new (n) for next 12 observations has been made using regression model and by putting forecasted values of independent variables (a,r1,r2,c,v) in the model generated in the first step . Comparison of forecasted and observed results has also been done which confirms better forecast.
IV. EVALUATION AND RESULTS
TABLE I. CORRELATIONS: NEW, ASSIGNED, REOPENED, RESOLVED, VERIFIED, CLOSED
Correl -ations
New Ass-igned
Reop-ened
Re-solve
d
Veri-fied
Assi gned
0.804 0.000
reopened 0.425 0.433 0.001 0.001
resolved 0.322 0.244 -0.032
0.014 0.065 0.812 verified 0.067 -0.028 0.344 0.142
0.618 0.835 0.008 0.288 closed 0.207 0.187 -0.039 0.402 -0.038
0.120 0.159 0.772 0.002 0.780 Cell Contents: Pearson correlation
P-Value
Figure 1. Variation of all five factors under
consideration over last four years
A. REGRESSION ANALYSIS RESULTS
The regression equation is
new = 1.69 + 2.96 assigned + 2.06 reopened + 0.514 resolved + 0.76 verified + 0.31 closed
S = 6.81546 R-Sq = 67.6% R-Sq(adj) = 64.5%
PRESS = 4435.66 R-Sq(pred) = 40.56%
TABLE II. TEST STATISTICS
Predictor Coef SE Coef T P Constant 1.692 1.525 1.11 0.272 assigned 2.9563 0.3910 7.56 0.000 reopened 2.058 1.894 1.09 0.282 resolved 0.5142 0.3430 1.50 0.140 verified 0.764 2.131 0.36 0.721 Closed 0.307 1.227 0.25 0.803
TABLE III. ANALYSIS OF VARIANCE
Source DF SS MS F PRegression 5 5046.8 1009.4 21.73 0.000 Residual
Error 52 2415.4 46.5
Total 57 7462.2 Assigned 1 4826.8
Reopened 1 53.9 Resolved 1 157.8 Verified 1 5.4 Closed 1 2.9
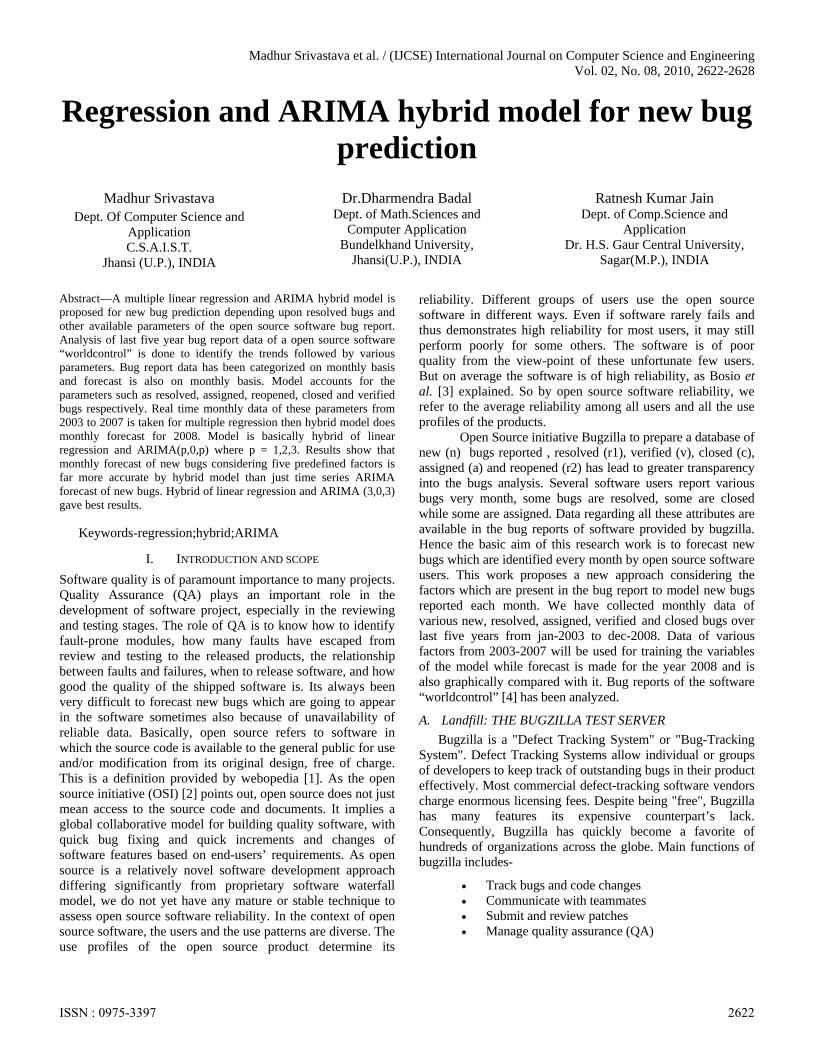
TABLE IV. UNUSUAL OBSERVATIONS
ISSN : 0975-3397 2624
Madhur Srivastava et al. / (IJCSE) International Journal on Computer Science and Engineering Vol. 02, No. 08, 2010, 2622-2628
Obs
assigned
new Fit SE Fit
Residual
St Resid
12 17.0 70.000 56.580 5.263 13.420 3.10RX17 1.0 14.000 12.347 4.615 1.653 0.33 X44 4.0 35.000 22.053 3.479 12.947 2.21R 45 8.0 14.000 29.251 2.185 -15.251 -2.36R48 8.0 19.000 33.199 3.981 -14.199 -2.57RX49 3.0 27.000 12.968 3.083 14.032 2.31R 57 2.0 8.000 15.820 5.144 -7.820 -1.75 X
R denotes an observation with a large standardized residual.
X denotes an observation whose X value gives it large influence.
B. ARIMA FORECAST RESULTS OF VARIOUS FACTORS
Figure 2. Assigned Forecast
Figure 3. Closed Forecast
Figure 4. Resolved Forecast
Figure 5. Verified Forecast
Above figures shows the ARIMA(p,0,p) forecast of various factors for each months in the year 2008 and black line in all above graphs represents the observed values.
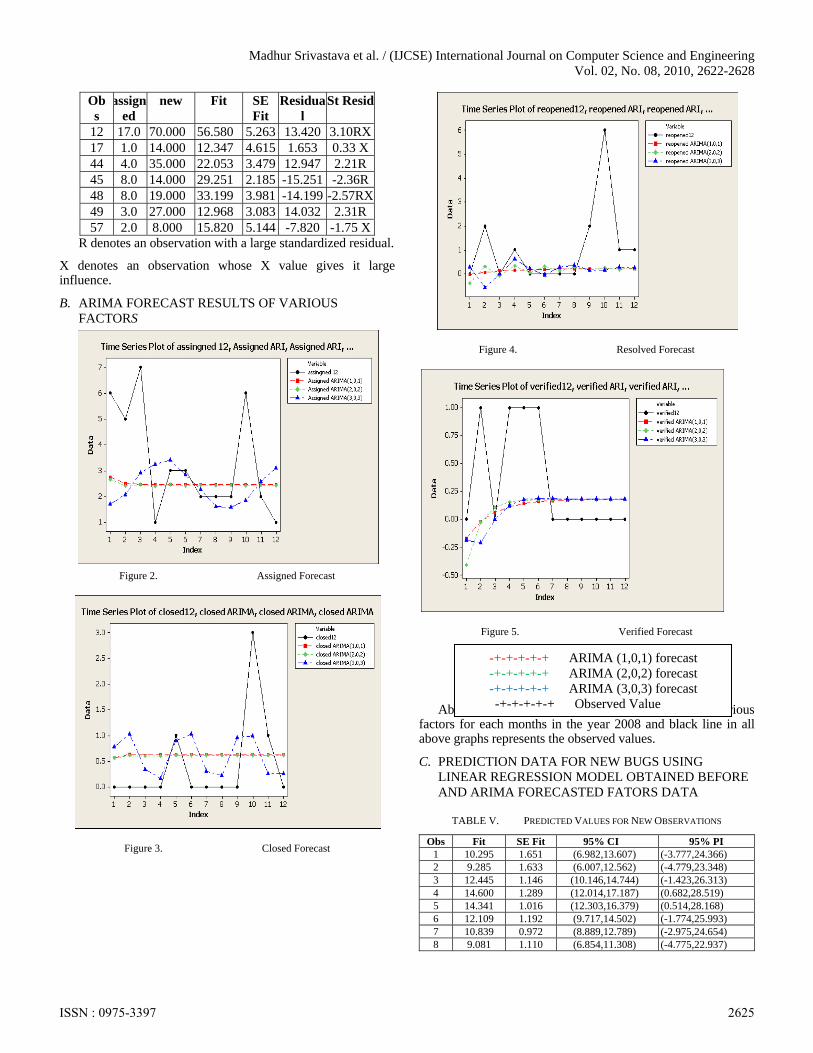
C. PREDICTION DATA FOR NEW BUGS USING LINEAR REGRESSION MODEL OBTAINED BEFORE AND ARIMA FORECASTED FATORS DATA
TABLE V. PREDICTED VALUES FOR NEW OBSERVATIONS
Obs Fit SE Fit 95% CI 95% PI 1 10.295 1.651 (6.982,13.607) (-3.777,24.366) 2 9.285 1.633 (6.007,12.562) (-4.779,23.348) 3 12.445 1.146 (10.146,14.744) (-1.423,26.313) 4 14.600 1.289 (12.014,17.187) (0.682,28.519) 5 14.341 1.016 (12.303,16.379) (0.514,28.168) 6 12.109 1.192 (9.717,14.502) (-1.774,25.993) 7 10.839 0.972 (8.889,12.789) (-2.975,24.654) 8 9.081 1.110 (6.854,11.308) (-4.775,22.937)
-+-+-+-+-+ ARIMA (1,0,1) forecast -+-+-+-+-+ ARIMA (2,0,2) forecast -+-+-+-+-+ ARIMA (3,0,3) forecast
-+-+-+-+-+ Observed Value
ISSN : 0975-3397 2625
Madhur Srivastava et al. / (IJCSE) International Journal on Computer Science and Engineering Vol. 02, No. 08, 2010, 2622-2628
9 8.752 1.053 (6.639,10.864) (-5.087,22.590) 10 9.555 1.050 (7.447,11.663) (-4.283,23.393) 11 11.757 0.996 (9.759,13.756) (-2.064,25.579) 12 13.255 1.027 (11.194,15.317) (-0.575,27.086)
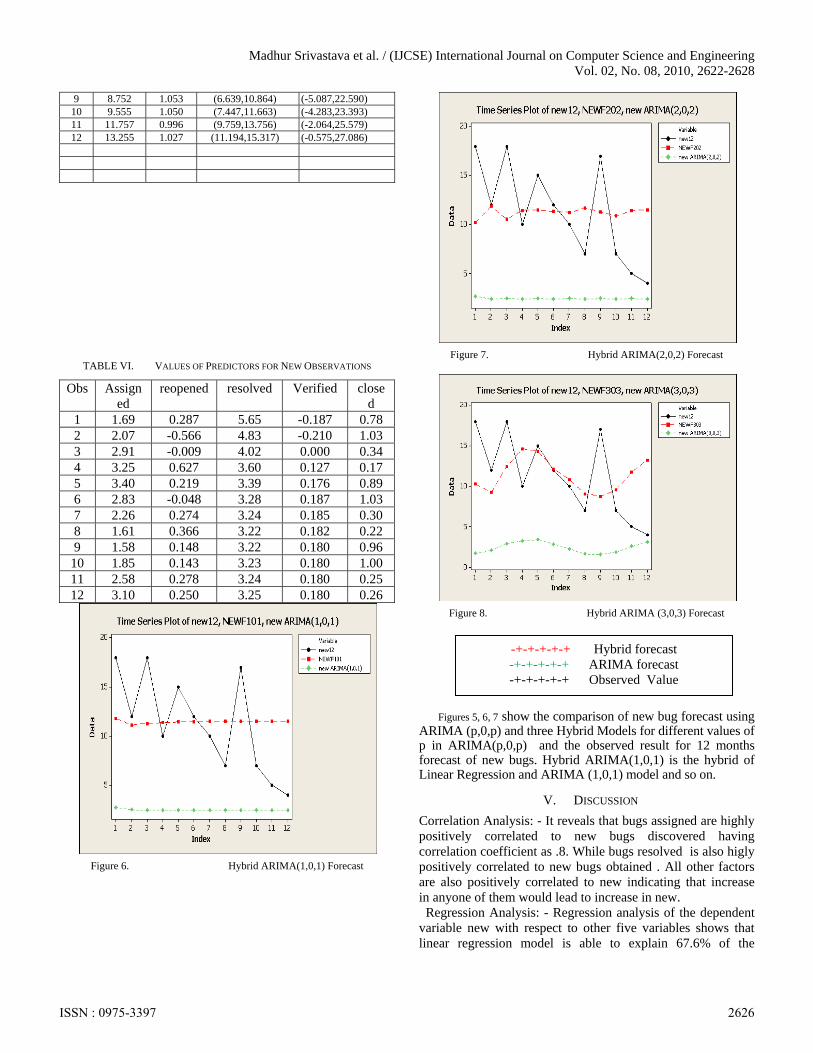
TABLE VI. VALUES OF PREDICTORS FOR NEW OBSERVATIONS
Obs Assigned
reopened resolved Verified closed
1 1.69 0.287 5.65 -0.187 0.78 2 2.07 -0.566 4.83 -0.210 1.03 3 2.91 -0.009 4.02 0.000 0.34 4 3.25 0.627 3.60 0.127 0.17 5 3.40 0.219 3.39 0.176 0.89 6 2.83 -0.048 3.28 0.187 1.03 7 2.26 0.274 3.24 0.185 0.30 8 1.61 0.366 3.22 0.182 0.22 9 1.58 0.148 3.22 0.180 0.96
10 1.85 0.143 3.23 0.180 1.00 11 2.58 0.278 3.24 0.180 0.25 12 3.10 0.250 3.25 0.180 0.26
Figure 6. Hybrid ARIMA(1,0,1) Forecast
Figure 7. Hybrid ARIMA(2,0,2) Forecast
Figure 8. Hybrid ARIMA (3,0,3) Forecast
Figures 5, 6, 7 show the comparison of new bug forecast using ARIMA (p,0,p) and three Hybrid Models for different values of p in ARIMA(p,0,p) and the observed result for 12 months forecast of new bugs. Hybrid ARIMA(1,0,1) is the hybrid of Linear Regression and ARIMA (1,0,1) model and so on.
V. DISCUSSION
Correlation Analysis: - It reveals that bugs assigned are highly positively correlated to new bugs discovered having correlation coefficient as .8. While bugs resolved is also higly positively correlated to new bugs obtained . All other factors are also positively correlated to new indicating that increase in anyone of them would lead to increase in new. Regression Analysis: - Regression analysis of the dependent variable new with respect to other five variables shows that linear regression model is able to explain 67.6% of the
-+-+-+-+-+ Hybrid forecast -+-+-+-+-+ ARIMA forecast -+-+-+-+-+ Observed Value
ISSN : 0975-3397 2626

Madhur Srivastava et al. / (IJCSE) International Journal on Computer Science and Engineering Vol. 02, No. 08, 2010, 2622-2628
variations in the data values as R-sqr value is 67.6%. This is the incidcation of the fact that only regression can not be used to predict the new bugs. Arima Forecasting of the Factors: - Other five factors r1, r2, a, v, c are forecasted using ARIMA(p,0,p) type of models for next twelve observations. All five time series taken into account in this case are considered stationary will little or no seasonality persent in them . Hence in ARIMA(p,q,r) q = 0. While autoregressive and moving average parts are considered equal in all the cases. Graphical comparision of the observed and forecasted results using ARIMA models in figures (3.1-3.5) shows that ARIMA(3,0,3) have been quite effective in capturing the local fluctuations in the data while other two models remained stable and varied little. Hybrid Model Forecast: - Three Hybrid Regression and ARIMA (p, 0, p) forecasts for p = 1,2,3 has been made which proved much better than simple ARIMA forecast as shown in figures (3.6,3.7,3.8). Among all models ARIMA (3,0,3) has shown best results and it has been able to forecast new bugs most effectively.
VI. RELATED WORK
Li and Herbsleb et al. [7] attempted to predict field defects of open source software by extending a Weibull model. They established from experiments that it is not possible to make meaningful field defect predictions by extending traditional proprietary software reliability growth models fitted to open source software defects (i.e. the Gamma models, the Logarithmic models, the exponential models, the Power models). Zhou and Davis [8] showed that along the development cycle, open source projects exhibit similar reliability growth pattern to that of closed source projects. They considered that it is possible to use the general Weibull distribution [9] to model the open source bug occurrence patterns. Li and Shaw et al. [10] examined user reported bug occurrence patterns across twenty-two releases of four widely deployed, open source software systems. They found that the Weibull model is flexible enough to capture defect-occurrence behavior across a wide range of systems.
Challet and Du [11] established a simplified analytical model of open source failure dynamics. This model aims to reveal the basic elements and the fundamental interactions among them that give rise to relevant bug phenomenology. The major point of previous research is that because of the lack of understanding of the failure dynamics of open source process, it is therefore difficult to establish an analytical software reliability model for open source software. An alternative as the previous research suggested is to apply flexible nonparametric models on the bug data from open source projects in the expectation that the flexibility may allow the models to capture the unknown nature of the open source failure dynamics. Studies have been done to analyze the features of bug occurrence data, and then apply appropriate nonparametric techniques such as generalized additive models (GAM) [12], generalized linear model (GLM) [13], the support vector
machine regression models (SVM) [14], and the moving average (MA) [15] and exponential smoothing (ES)[16] techniques to capture the unknown characteristics of the failure dynamics of open source software projects without making any a priori assumptions about the failure dynamics of the project.
VII. SUMMARY AND FURTHER WORK
This research project has proved that hybrid model’s bug prediction capability is far more better than the simple time series model predictability as this models takes into account various factors which are involved in the generation of new bugs in open source softwares. Further research can be done on generation and detection of various new parameters as hybrid models allows inclusion of various other factors for better forecast of new bugs. More over instead o ARIMA other time series conditional mena models and AI techniques can be applied to produce better results.
REFERENCES [1] Webopedia. What is open source?
http://www.webopedia.com/TERM/O/opensource.html, 2005
[2] Open Source Initiative. The open source definition. http://www.opensource.org/docs/definition plain.php, 2006.
[3] E. Raymond. The Halloween documents. http://www.catb.org/ ~esr/halloween, 1998.
[4] http://landfill.bugzilla.org/bugzillatip/report.cgi?x_axis_field=product&y_axis_field=bug_status&z_axis_field=&query_format=report-table&format=table&action=wrap
[5] Box, George E. P., Gwilym M. Jenkins (1976) Time Series Analysis. Revised Edition. Oakland, CA: Holden-Day.
[6] C. Chatfield. The Analysis of the Time Series. Chapman & Hall Rc, 1996.
[7] P. L. Li, J. Herbsleb, and M. Shaw. Finding predictors of field defects for open source software systems in commonly available data sources: a case study of openbsd. http://reportsarchive.adm.cs.cmu.edu/anon/isri2005/abstracts/05-121.html, 2005.
[8] Y. Zhou and J. Davis. Open source software reliability model: an empirical approach. In Proceedings of the fifth workshop on Open source software engineering, pages 1–6, 2005.
[9] N. Johnson, S. Kotz, and N.BalaKrishnan, Continuous univariate distributions, Second Ed. Wiley-Interscience, New York, 1994
[10] P. L. Li, M. Shaw, J. Herbsleb, B. Ray, and P. Santhanam. Empirical evaluation of defect projection models for widely-deployed production software systems. In Proceedings of ACM SIGSOFT twelfth international symposium on Foundations of software engineering, pages 263 – 272, 2004.
[11] A. Papoulis. Probability, Random Variables, and Stochastic Processes. McGraw-Hill, 1984.
[12] T.J. Hastie, R.J. Tibshirani. Generalized additive models. Chapman and Hall, London, 1990.
[13] P. McCullagh, J.A. Nelder. Generalized Linear Models. Chapman and Hall, London and New York, 1989.
[14] V. Vapnik. The nature of statistical learning. Springer- Verlag, New York, 2000.
[15] P. Brockwell, R. Davis, Time series: theory and methods, Second Ed. Springer-Verlag, New York, 1991
[16] G. Box, G. Jenkins, and G. Reinsel, Time series analysis: forecasting & control, third Ed., Prentice Hall, 1994.
ISSN : 0975-3397 2627

Madhur Srivastava et al. / (IJCSE) International Journal on Computer Science and Engineering Vol. 02, No. 08, 2010, 2622-2628
AUTHORS PROFILE
Madhur Srivastava is currently a research scholar at Department of Computer Science and Applications, Bundelkhand University,Jhansi U P, India. He completed his bachelor’s degree in Science (B. Sc.) in 1999 and master’s degree in computer applications (M.C.A.) in 2003 from Shivaji University. His field of study is Operating System, Data Structures, Data mining, and Software Engineering. He has presented more than 3 research papers.
Dr. Dharmendra Badal is currently University approved Guide for Ph.D. in Maths and Computerand working as a registrar in RawatPura Sarkar Institutions. He has done M.Sc. Maths(with Computer Programming), B.Ed., PGDCA, Ph.D. Mathematical Sciences Topic-An Analysis of Some Inventory Models He is Guide for Two students enrolled for Ph. D. Guide for Three students under R.D.C. process. Co-Guide for Three students under R.D.C. process. Area of Specialization : Operation Research
DBMS (Data Mining)
Fifteen Paper presented and Five under communication.
Ratnesh Kumar Jain is currently a research scholar at Department of Computer Science and Applications, Dr. H. S. Gour Central University (formerly, Sagar University) Sagar, M P, India. He completed his bachelor’s degree in Science (B. Sc.) with Electronics as special subject in 1998 and master’s degree in computer applications (M.C.A.) in 2001 from the same University. His field of study is Operating System, Data Structures, Web mining, and Information retrieval. He has published more than 4 research papers and has authored a book.
ISSN : 0975-3397 2628