a hybrid cellular automata model of multicellular tumour ... · update mts growth for one time step...
TRANSCRIPT

Hindawi Publishing CorporationJournal of Applied MathematicsVolume 2013, Article ID 519895, 10 pageshttp://dx.doi.org/10.1155/2013/519895
Research ArticleA Hybrid Cellular Automata Model of Multicellular TumourSpheroid Growth in Hypoxic Microenvironment
Yan Cai,1 Jie Wu,2 Shixiong Xu,3 and Zhiyong Li1
1 School of Biological Science and Medical Engineering, Southeast University, Nanjing 210096, China2 School of Naval Architecture, Ocean and Civil Engineering, Shanghai Jiaotong University, Shanghai 200240, China3Department of Mechanics and Engineering Science, Fudan University, Shanghai 200433, China
Correspondence should be addressed to Zhiyong Li; [email protected]
Received 19 November 2012; Accepted 22 January 2013
Academic Editor: Martin Weiser
Copyright © 2013 Yan Cai et al. This is an open access article distributed under the Creative Commons Attribution License, whichpermits unrestricted use, distribution, and reproduction in any medium, provided the original work is properly cited.
A three-dimensional hybrid cellular automata (CA) model is developed to study the dynamic process of multicellular tumourspheroid (MTS) growth by introducing hypoxia as an important microenvironment factor which influences cell migration and cellphenotype expression. The model enables us to examine the effects of different hypoxic environments on the growth history ofthe MTS and to study the dynamic interactions between MTS growth and chemical environments. The results include the spatialdistribution of different phenotypes of tumour cells and associated oxygen concentration distributions under hypoxic conditions.The discussion of the model system responses to the varied hypoxic conditions reveals that the improvement of the resistance oftumour cells to a hypoxic environment may be important in the tumour normalization therapy.
1. Introduction
Multicellular tumour spheroids (MTS) are three-dimensionalaggregates of malignant tumour cells, which can be grownin vitro under strictly controlled nutritional and mechanicalconditions to mimic microtumour growth and metastases[1]. Sutherland et al. [2, 3] were the first to use MTS for thesystematic study of tumour responses to therapy. Comparedto monolayer cultures, a significant advantage of the MTSmodel is that they can more closely represent the in vivomicroenvironment in solid tumours [4].
Hypoxia is one of the most important hallmarks of theabnormal metabolic microenvironment in solid tumours [5].The imbalance of pro- and antiangiogenic factors resultsin the formation of layered capillary network in tumoursand the abnormal structure and functions of tumour vessels[6]. Since the diffusion limit of oxygen in tissues is 100–200𝜇m [7], the regions far from the blood vessels becomechronically hypoxic. In addition, due to the heterogeneousand disorganized vessel network in tumours, there is no clearrelationship between the blood flow rate and oxygen tension
(pO2) [8], whichmay cause tumour tissue hypoxia despite the
presence of blood flow.Hypoxia can upregulate various angiogenic growth fac-
tors, including vascular endothelial growth factor (VEGF),thus triggering vascularization of tumours [9]. Furthermore,hypoxia also modulates the rate of progression through thecell cycle [10]. Whereas most normal cells undergo apoptosiswhen the hypoxic stress is too intense or persists for too long,tumour cells appear to have muchmore resistance to hypoxia[11]. One reason for this phenomenon is that the hypoxiainducible factor 1𝛼 (HIF 1𝛼) upregulates the protein p27 tocause the arrest of the G1/S transition in the tumour cell cycle[12].
MTS have often been regarded as aggregates of cellswith intimate cell-cell contacts; however, it demonstrated theexistence of extracellular matrix (ECM) in the spheroids [13].The ECM is a complex network composed of a variety ofproteins and polysaccharides such as fibronectin, collagen,laminin, hyaluronate, heparan sulfate, and elastin, that areproduced by the cells to form this matrix [14]. The role ofECM in the MTS growth has been investigated, including

2 Journal of Applied Mathematics
Update MTS growth for one time step
Cell death
Increase age
Sufficient space
Cell becomes quiescent
Reach proliferation
age
Resistance to hypoxia
MitosisPhenotype mutation
Initialization
Update chemicals distribution
(O2, MDE, and ECM)
Sufficient O2
Sufficient O2
No
No
No
No
No
Yes
Yes
YesYes
Yes
Figure 1: Flowchart of the hybrid CA model showing the differentphenotypes (proliferating, quiescent, necrosis, andmutation) underhypoxic microenvironment.
Table 1: Parameter values used in the simulation.
Parameter Value𝐷
a𝑚
10−9 cm2 s−1
𝛿b
1.3 × 102 cm3M−1 s−1
𝜇b𝑇
1.7 × 10⁻¹⁸Mcells−1 s−1
𝛽a
5.8 × 10⁻² cm−3 s−1
𝐷a𝑜
10−5 cm2 s−1
𝜆a
1.7 × 10⁻⁸ s−1
𝛾a
6.25 × 10⁻¹⁷Mcells−1 s−1
aPettet et al. [21].bMansury and Deisboeck [23].
the cell-matrix adhesion through integrins [15] and ECM-dependent cell survival [16]. Although few studies have beenconducted examining the cell-matrix interactions in MTS,the importance of these interactions in regulating cell growth,especially that in three-dimensional spheroids, should beaddressed.
To investigate the physiological phenomena and patho-logical characteristics ofMTS,mathematical models forMTSgrowth have been well developed in recent years [17–20].
Growth models for MTS are usually classified into threegroups: (a) continuum models, formulated through partialdifferential equations (PDEs) to describe the changes indistributions of certain substances [21]; (b) discrete models,often represented by cellular automata (CA) [22], agent-based[23], andMonte-Carlo inspiredmodels [24]; (c) hybrid mod-els, incorporating continuum models and discrete models[25]. CAmodels were originally introduced by vonNeumann[26] as a possible idealization of biological systems andtypically constructed by the setup of the transition rules(CA rules) generating the desired behaviour. In recent years,CA models for MTS growth have been studied to improvethe understanding of the dynamic process of MTS growthand the changes of microenvironments in MTS. The benefitof using CA models is that they provide a description andallow amore realistic stochastic approach at both cellular andsubcellular levels. However, one of the main disadvantagesof CA models is that they require very large amounts ofcomputational resources.
We have established a 2D coupled mathematical modelof tumour growth, angiogenesis, and blood perfusion in theprevious work [27], in which the simulation of the earlystage of tumour cell growth was simplified. At the avascularphase, the influence of hypoxic environment on the tumourgrowth is more significant than after angiogenesis process.Hypoxia is not only associated with the trigger of tumourangiogenesis, but also affects the tumour cell survival andproliferating. Moreover, some tumour cells can undergo aseries of mutations in a certain hypoxic environment tobecomemore aggressive andmore resistant to chemotherapyand radiotherapy. Therefore, a mathematical model focuseson the hypoxia microenvironment, and associated MTSgrowth will be helpful in improving our understanding of thedynamic processes in early tumour growth.
The main aim of this study is to develop a 3D hybrid CAmodel to investigate the dynamic growth ofMTS to the variedlevels of hypoxic microenvironment. We define a continuumdeterministic model (a system of conservation equations) tocontrol the chemicals dynamics and a discrete CA model(individual-based processes) to control the individual cellmigration and interactions. In addition, we focus on theinfluence of hypoxic microenvironment on the MTS growthby considering different cell phenotypes, which are causedby different hypoxia levels and may in turn induce differentresistances of tumour cells to hypoxia.
2. Method
2.1. The Conservation Equations for Chemicals. The model isdefined on a 3D region of 100 × 100 × 100 grids to covera 2mm × 2mm × 2mm space, for MTS cell proliferating,quiescent, and apoptosis. Each tumour cell occupies oneindividual element and competes for space and oxygen withothers. The interactions of cells with the microenvironmentare governed by the ECM concentration (denoted by 𝑐
𝑓)
and the oxygen concentration (denoted by 𝑐𝑜). The ECM
can be degraded by the matrix-degrading enzymes (MDEs)(denoted by 𝑐
𝑚) which are produced by the tumour cells. The

Journal of Applied Mathematics 3
0 20 40 60 80 100
0
50
1000
20
40
60
80
100
𝑧
𝑥𝑦 0 10 20 30 40 50 60 70 80 90 100
0102030405060708090
100
𝑦
𝑥𝑡 = 100
0 20 40 60 80 100
0
50
1000
20
40
60
80
100
𝑧
𝑥
𝑦 0 20 40 60 80 1000
102030405060708090
100
𝑦
𝑥𝑡 = 200
0 20 40 60 80 100
0
50
1000
20
40
60
80
100
𝑧
𝑥
𝑦 0 20 40 60 80 1000
102030405060708090
100
𝑦
𝑥𝑡 = 300
0 20 40 60 80 100
0
50
1000
20
40
60
80
100
𝑧
𝑥
𝑦 0 20 40 60 80 1000
102030405060708090
100
𝑦
𝑥𝑡 = 400
(a)
Figure 2: Continued.

4 Journal of Applied Mathematics
0 20 40 60 80 100
050
1000
20406080
100
𝑧
𝑥𝑦
0 20 40 60 80 1000
102030405060708090
100
𝑦
𝑥
0 20 40 60 80 100
050
1000
20
40
60
80
100
𝑧
𝑥𝑦 0 20 40 60 80 100
0102030405060708090
100
𝑦
𝑥
0 20 40 60 80 100
050
1000
20406080
100
𝑧
𝑥𝑦
0 20 40 60 80 1000
102030405060708090
100
𝑦
𝑥
0 20 40 60 80 100
050
1000
20406080
100
𝑧
𝑥𝑦 0 20 40 60 80 100
0102030405060708090
100
𝑦
𝑥
𝑡 = 500
𝑡 = 600
𝑡 = 700
𝑡 = 800
(b)
Figure 2:The growth histories ofMTS in hypoxic microenvironment and cross-sections at plane 𝑧 = 50. Different colours represent differentphenotypes of tumour cells (proliferating cells: blue; quiescent cells: green; necrotic cells: red; and mutated cells: yellow).

Journal of Applied Mathematics 5
100 200 300 400 500 600 700 8000
1
2
3
4
5
6
7
Time step
Tota
l cel
l num
ber
×104
(a)
100 200 300 400 500 600 700 8000
2
4
6
8
10
12
14
Time step
×107
Volu
me (𝜇
m3)
(b)
Figure 3: The growth curves of MTS in the model. The number of total cells (a) and the volume of spheroid (b) in time.
equations describing the interactions of tumour cells withECM, MDE, and oxygen are
𝜕𝑐𝑓
𝜕𝑡= −𝛿𝑐
𝑚𝑐𝑓⏟⏟⏟⏟⏟⏟⏟⏟⏟⏟⏟⏟⏟
degradation of ECMby MDE
,
𝜕𝑐𝑚
𝜕𝑡= 𝐷
𝑚∇2𝑐𝑚⏟⏟⏟⏟⏟⏟⏟⏟⏟⏟⏟⏟⏟⏟⏟
diffusion of MDE
+ 𝜇T𝑇𝑖,𝑗,𝑘⏟⏟⏟⏟⏟⏟⏟⏟⏟⏟⏟
production of MDEby TCs
− 𝜆𝑐𝑚⏟⏟⏟⏟⏟⏟⏟
decay of MDE
,
𝜕𝑐𝑜
𝜕𝑡= 𝐷
𝑜∇2𝑐𝑜⏟⏟⏟⏟⏟⏟⏟⏟⏟⏟⏟⏟⏟
diffusion of oxygen
− 𝛾𝑇𝑖,𝑗,𝑘⏟⏟⏟⏟⏟⏟⏟⏟⏟
consumption of oxygenby TCs
+ 𝛽𝑐𝑓⏟⏟⏟⏟⏟⏟⏟
production of oxygenby ECM
.
(1)
TheECMconcentration 𝑐𝑓is controlled by the degradation by
MDE, while the MDE is governed by diffusion, productionby the tumour cells, and decay of itself. Since we chooseto focus on the MTS growth, the vascularization inside thetumour is not included in the current model. Therefore, weassume that oxygen is produced by the macromolecules inthe ECM, transported by pure diffusion in interstitial space,and consumed by the tumour cells. For simplicity, oxygenproduction is assumed to be proportional to the ECMdensity[25].The𝑇
𝑖,𝑗,𝑘term represents a tumour cell located at a node
position (𝑖, 𝑗, 𝑘).The value is either 1 if a cell is present or 0 if itis not.𝐷
𝑚and𝐷
𝑜areMDE and oxygen diffusion coefficients,
respectively. 𝛿, 𝜇𝑇, 𝜆, 𝛾, and 𝛽 are positive constants. The
values of these parameters are shown in Table 1.
2.2. CA Model for an Individual Cell. Figure 1 shows aflowchart of the hybrid CA model under hypoxic microen-vironment. Four phenotypes of tumour cells are defined inthe model. Types P, Q, N, and M represent the proliferatingcells, the quiescent cells, the necrotic cells, and the mutated
Table 2: Parameters of the four different phenotypes.
Phenotypes MDEproduction
Oxygenconsumption 𝐴
𝑖
Proliferating cells (P) 𝜇𝑇
𝛾 2Quiescent cells (Q) 𝜇
𝑇/5 𝛾/2 4
Necrotic cells (N) 𝜇𝑇/10 𝛾/4 6
Mutated cells (M) 4/3𝜇𝑇
2𝛾 0
cells, respectively. Initially, all tumour cells are proliferatingcells. At each time step, a tumour cell will increase its ageand be checked to see if there is enough space and oxygen(𝑐o ≥ 𝑐thres n = 0.5) for its proliferation; (a) if there is, thecell will be divided by mitosis to two daughter cells which areproliferating cells; one daughter cell will replace the parentcell, and the other one will move to the neighbouring elementpossessing the highest ECM concentration; (b) if there isno space for proliferation, the cell will become quiescent;for every quiescent cell, if the oxygen is inadequate, the cellwill apoptose to become a necrotic cell with a predefinedprobability (0.1% × 𝑇age). Tumour cells have been found tobe able to survive in a very poorly oxygenated environment[9].Therefore, we assume a phenotype ofmutated cells, whichhas themost resistance to hypoxia. If the proliferating cell andquiescent cell have survived in a certain hypoxic environment(𝑐o ≤ 𝑐thres m = 0.8) for a long time (𝑡 ≥ 𝑇
𝑚= 200),
they are assumed to become mutated cells with a certainprobability (10%). Since the process of ECM regeneration andthe removal of dead tumour cells are not clear, the dead cellwill still occupy the space but will cease any interaction withthe environment. It needs to be mentioned here that there isno reverse change of cell from quiescent back to proliferatingin this model.
Different coefficients of the MDE production and theconsumption rate of oxygen are defined for different phe-notypes of tumour cells, as shown in Table 2. The mutatedtumour cells have the biggest production coefficients of

6 Journal of Applied Mathematics
0 10 20 30 40 500.94
0.95
0.96
0.97
0.98
0.99
1O
xyge
n co
ncen
trat
ion
Distance from the tumour centre−50 −40 −30 −20 −10
𝑡 = 100
0.86
0.88
0.9
0.92
0.94
0.96
0.98
0 10 20 30 40 50
1
Oxy
gen
conc
entr
atio
n
Distance from the tumour centre−50 −40 −30 −20 −10
𝑡 = 200
0.65
0.7
0.75
0.8
0.85
0.9
0.95
1
0 10 20 30 40 50Distance from the tumour centre
−40 −30 −20 −10
Oxy
gen
conc
entr
atio
n
𝑡 = 300
0.65
0.7
0.75
0.8
0.85
0.9
0.95
1
0 10 20 30 40 50Distance from the tumour centre
−40 −30 −20 −10
𝑡 = 400
0.7
0.75
0.8
0.85
0.9
0.95
1
0 10 20 30 40 50Distance from the tumour centre
−40 −30 −20 −10
Oxy
gen
conc
entr
atio
n
𝑡 = 500
0.75
0.8
0.85
0.9
0.95
1
0 10 20 30 40 50Distance from the tumour centre
−40 −30 −20 −10
Oxy
gen
conc
entr
atio
n
𝑡 = 600
0.75
0.8
0.85
0.9
0.95
1
0 10 20 30 40 50Distance from the tumour centre
−40 −30 −20 −10
Oxy
gen
conc
entr
atio
n
𝑡 = 700
0.75
0.8
0.85
0.9
0.95
1
0 10 20 30 40 50Distance from the tumour centre
−40 −30 −20 −10
Oxy
gen
conc
entr
atio
n
𝑡 = 800𝑐∗𝑜
Average 𝑐∗𝑜
𝑐∗𝑜
Average 𝑐∗𝑜
Oxy
gen
conc
entr
atio
n
Figure 4: Distribution of integrated oxygen concentration 𝑐∗o along 𝑥-axis at 𝑧 = 50 plane. 𝑥 = 0 is the centre of the simulation region andthe MTS. The green dotted line is the average value of 𝑐∗o . All values are normalized to be 0-1.

Journal of Applied Mathematics 7
MDE, which means they are more aggressive and more likelyto invade into surrounding tissues. Based on the work ofAnderson [25], each cell has its own internal adhesion value𝐴𝑖. Only if the number of external neighbours of the cell is
larger than 𝐴𝑖, the cell is allowed to migrate. The different
values of𝐴𝑖of different phenotypes are also shown in Table 2.
2.3. Simulation. The simulation was carried out on a 3Ddomain of 2mm × 2 mm × 2 mm, divided uniformly into100 × 100 × 100 grids. A no-flux boundary condition wasimposed on the square grid to restrict the tumour cells,MDE,ECM, and oxygen to the volume within the grid.
The initial distributions of oxygen and ECM were pre-defined as constant nondimensional values (they were 1 inthis study) in the simulation space. Initially, 50 proliferatingtumour cells were centered around grid element (50, 50, and50) with age one. The simulation step is set to be 45mins,according to the basic mitosis time for tumour cells [24].
The simulation process is as follows:at each major iteration,
(1) MTS growth according to the CA rules (described inSection 2.2);
(2) solve (1) and update the chemicals (oxygen,MDE, andECM) concentrations;
(3) update the distribution of tumour cells based on thechanged microenvironment.
3. Results
In the results presented here, the simulation starts from theinitial tumour and finishes at 800 time steps.
3.1.MTSGrowthHistory. Figure 2 shows the growth historiesof MTS under hypoxic microenvironment and the cross-section at the plane 𝑧 = 50. Different colours representdifferent cell phenotypes (proliferating cells: blue; quiescentcells: green; necrotic cells: red; and mutated cells: yellow). Atthe beginning, most of the tumour cells stay in proliferatingand quiescent. However, the necrotic cells arise after 𝑡 = 200and spread rapidly in the tumour interior, due to the limitedoxygen supply and high oxygen consumption of proliferatingcells. Once the necrotic core is formed at 𝑡 = 400 (seethe cross-section pictures more clearly), the quiescent cellsdecrease continually, and the hypoxic environment in theMTS is satisfied formutated cells. Eventually, some proliferat-ing cells have survived and formed finger-like invasions to thesurrounding matrix at the periphery area, while the mutatedcells, which are the most aggressive, are scattered inside theMTS (also see Figure 5(a)).
Figure 3 shows the growth curves of MTS in the model.The number of total cells and the spheroid volume first growexponentially at early days and then slow down after ∼600time steps (almost 18 days). The exponent growth and thesaturation size are consistent with experimental observationsby a series studies from Freyer et al. [29–31].
3.2. Oxygen Concentration Distribution. The integrated oxy-gen concentration 𝑐∗o along the 𝑥-axis at the plane 𝑧 = 50 isshown in Figure 4, where 𝑥 = 0 is the centre of the simulationregion and the MTS. The hypoxia inside the MTS becomesmore and more extensive with the growth: (a) the hypoxicregion is always at the MTS interior and spreads graduallyto surrounding tissue; (b) the lowest value and the averagevalue (shown as the green dotted line in Figure 3) of oxygenconcentration decrease simultaneously with the growth time.However, the lowest oxygen concentration occurs in thecentre area and may move towards the periphery of theMTS (especially at 𝑡 = 800), which is consistent with ourprevious work of coupled tumour growth model [27]. Thisis partly due to the fact that the quiescent and necrotic cellsconsume less oxygen than the proliferating ones. In addition,no assumptions about reverse changes from quiescent cellsback to proliferating cells in this model also contribute thisresult.
At the end of the simulation process, the lowest valueof oxygen concentration in the MTS is stable at around0.75, which is between the two thresholds for necrotic cells(𝑐thres n = 0.5) and mutated cells (𝑐thres m = 0.8). This impliesthat the mutated cells will increase with the MTS growthaccording to the assumptions used in the current model.
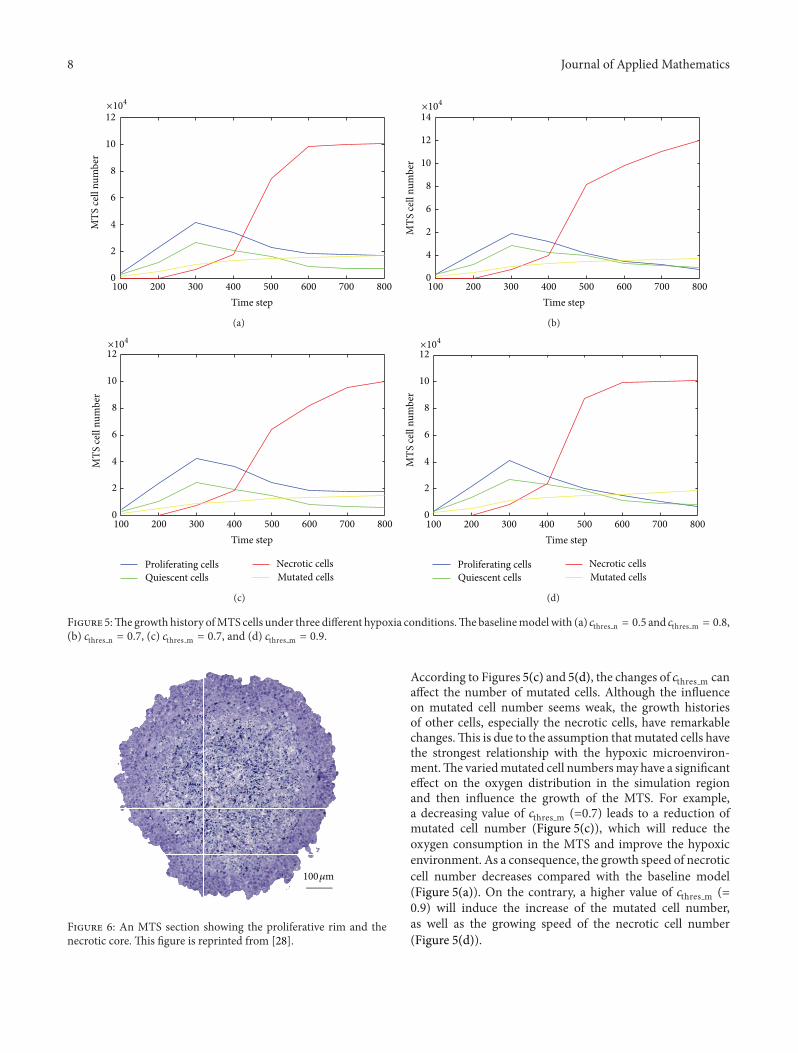
3.3. Sensitivity to Hypoxic Microenvironment. To assess thesensitivities to the oxygen thresholds in the model, wechanged the parameters 𝑐thres n, 𝑐thres m and performed threemore simulations, as shown in Figure 5. Figure 5(a) shows thebaseline model presented in the above sections.The numbersof proliferating cells and quiescent cells reach their peakvalues at 𝑡 = 300 and decrease gradually at the late period. Asa consequence, a rapid increase of necrotic cells appears after𝑡 = 300 due to the inadequate oxygen supply caused by theincreased proliferating cells and quiescent cells propagated atan earlier stage. At the end of the simulation (after 𝑡 = 600),all the MTS cells of four different phenotypes almost stopgrowing and tend towards stability, which is one of the signalsto stop the simulation.
The threshold for necrotic cells 𝑐thres n will influence thecell distribution by controlling the cell death in response tolow oxygen concentration. A higher value of 𝑐thres n (=0.7)will reduce the resistance of tumour cells to the hypoxicenvironment and increase the necrotic cell number at the endof the simulation, as shown in Figure 5(b). At the same time,the proliferating cell number decreases due to the rapidlyincreasing number of necrotic cells which occupymost of thevolume in the simulation region.This result suggests that theresistance of tumour cells to the hypoxic environment mayplay an important role in the development of MTS.
Another threshold defined in this model for cell pheno-type to local oxygen concentration is 𝑐thres m, which affects themutated cell number. We assumed a phenotype of mutatedcells to represent the most aggressive cells, which can survivein a very poorly oxygenated environment. The threshold formutated cells 𝑐thres m has been changed to be 0.7 and 0.9,respectively, to test the system responses to this threshold.
8 Journal of Applied Mathematics
100 200 300 400 500 600 700 8000
2
4
6
8
10
12
Time step
MTS
cell
num
ber
×104
(a)
100 200 300 400 500 600 700 8000
2
4
6
8
10
12
14
Time step
MTS
cell
num
ber
×104
(b)
100 200 300 400 500 600 700 8000
2
4
6
8
10
12
Time step
MTS
cell
num
ber
Proliferating cellsQuiescent cells
Necrotic cellsMutated cells
×104
(c)
100 200 300 400 500 600 700 8000
2
4
6
8
10
12
Time step
MTS
cell
num
ber
Proliferating cellsQuiescent cells
Necrotic cellsMutated cells
×104
(d)
Figure 5:Thegrowth history ofMTS cells under three different hypoxia conditions.Thebaselinemodelwith (a) 𝑐thres n = 0.5 and 𝑐thres m = 0.8,(b) 𝑐thres n = 0.7, (c) 𝑐thres m = 0.7, and (d) 𝑐thres m = 0.9.
100 𝜇m
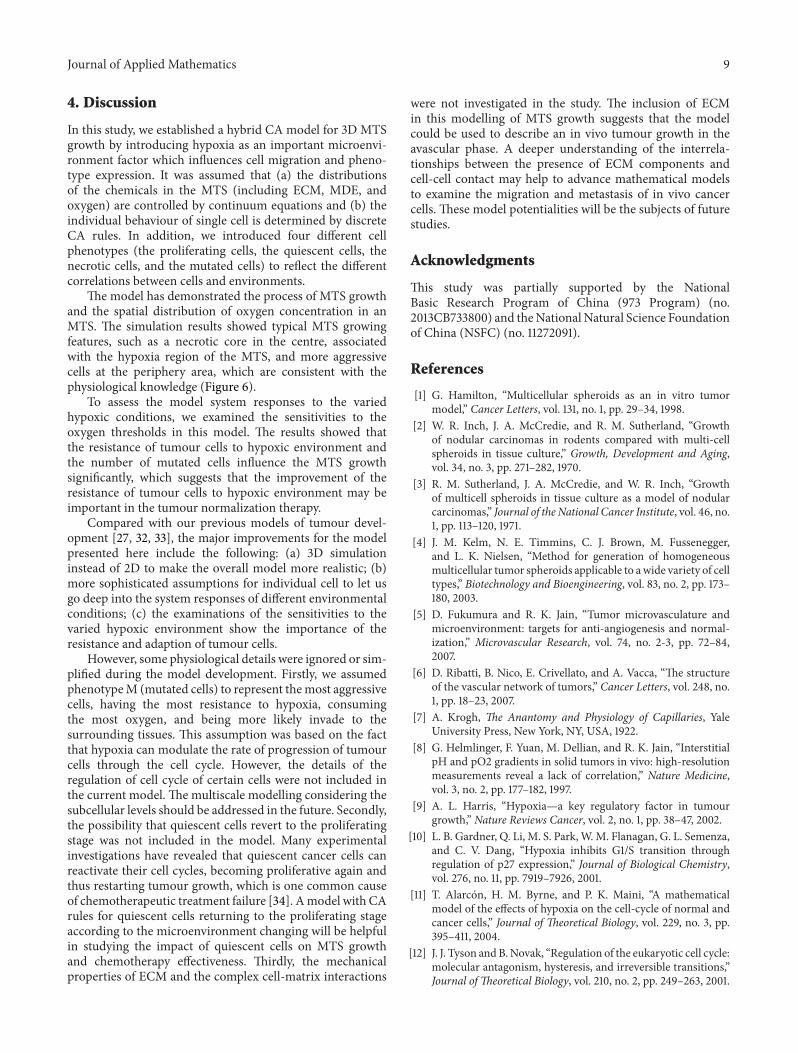
Figure 6: An MTS section showing the proliferative rim and thenecrotic core. This figure is reprinted from [28].
According to Figures 5(c) and 5(d), the changes of 𝑐thres m canaffect the number of mutated cells. Although the influenceon mutated cell number seems weak, the growth historiesof other cells, especially the necrotic cells, have remarkablechanges.This is due to the assumption thatmutated cells havethe strongest relationship with the hypoxic microenviron-ment.The variedmutated cell numbersmay have a significanteffect on the oxygen distribution in the simulation regionand then influence the growth of the MTS. For example,a decreasing value of 𝑐thres m (=0.7) leads to a reduction ofmutated cell number (Figure 5(c)), which will reduce theoxygen consumption in the MTS and improve the hypoxicenvironment. As a consequence, the growth speed of necroticcell number decreases compared with the baseline model(Figure 5(a)). On the contrary, a higher value of 𝑐thres m (=0.9) will induce the increase of the mutated cell number,as well as the growing speed of the necrotic cell number(Figure 5(d)).
Journal of Applied Mathematics 9
4. Discussion
In this study, we established a hybrid CA model for 3D MTSgrowth by introducing hypoxia as an important microenvi-ronment factor which influences cell migration and pheno-type expression. It was assumed that (a) the distributionsof the chemicals in the MTS (including ECM, MDE, andoxygen) are controlled by continuum equations and (b) theindividual behaviour of single cell is determined by discreteCA rules. In addition, we introduced four different cellphenotypes (the proliferating cells, the quiescent cells, thenecrotic cells, and the mutated cells) to reflect the differentcorrelations between cells and environments.
The model has demonstrated the process of MTS growthand the spatial distribution of oxygen concentration in anMTS. The simulation results showed typical MTS growingfeatures, such as a necrotic core in the centre, associatedwith the hypoxia region of the MTS, and more aggressivecells at the periphery area, which are consistent with thephysiological knowledge (Figure 6).
To assess the model system responses to the variedhypoxic conditions, we examined the sensitivities to theoxygen thresholds in this model. The results showed thatthe resistance of tumour cells to hypoxic environment andthe number of mutated cells influence the MTS growthsignificantly, which suggests that the improvement of theresistance of tumour cells to hypoxic environment may beimportant in the tumour normalization therapy.
Compared with our previous models of tumour devel-opment [27, 32, 33], the major improvements for the modelpresented here include the following: (a) 3D simulationinstead of 2D to make the overall model more realistic; (b)more sophisticated assumptions for individual cell to let usgo deep into the system responses of different environmentalconditions; (c) the examinations of the sensitivities to thevaried hypoxic environment show the importance of theresistance and adaption of tumour cells.
However, some physiological details were ignored or sim-plified during the model development. Firstly, we assumedphenotypeM (mutated cells) to represent themost aggressivecells, having the most resistance to hypoxia, consumingthe most oxygen, and being more likely invade to thesurrounding tissues. This assumption was based on the factthat hypoxia can modulate the rate of progression of tumourcells through the cell cycle. However, the details of theregulation of cell cycle of certain cells were not included inthe current model. The multiscale modelling considering thesubcellular levels should be addressed in the future. Secondly,the possibility that quiescent cells revert to the proliferatingstage was not included in the model. Many experimentalinvestigations have revealed that quiescent cancer cells canreactivate their cell cycles, becoming proliferative again andthus restarting tumour growth, which is one common causeof chemotherapeutic treatment failure [34]. Amodel with CArules for quiescent cells returning to the proliferating stageaccording to the microenvironment changing will be helpfulin studying the impact of quiescent cells on MTS growthand chemotherapy effectiveness. Thirdly, the mechanicalproperties of ECM and the complex cell-matrix interactions
were not investigated in the study. The inclusion of ECMin this modelling of MTS growth suggests that the modelcould be used to describe an in vivo tumour growth in theavascular phase. A deeper understanding of the interrela-tionships between the presence of ECM components andcell-cell contact may help to advance mathematical modelsto examine the migration and metastasis of in vivo cancercells. These model potentialities will be the subjects of futurestudies.
Acknowledgments
This study was partially supported by the NationalBasic Research Program of China (973 Program) (no.2013CB733800) and theNational Natural Science Foundationof China (NSFC) (no. 11272091).
References
[1] G. Hamilton, “Multicellular spheroids as an in vitro tumormodel,” Cancer Letters, vol. 131, no. 1, pp. 29–34, 1998.
[2] W. R. Inch, J. A. McCredie, and R. M. Sutherland, “Growthof nodular carcinomas in rodents compared with multi-cellspheroids in tissue culture,” Growth, Development and Aging,vol. 34, no. 3, pp. 271–282, 1970.
[3] R. M. Sutherland, J. A. McCredie, and W. R. Inch, “Growthof multicell spheroids in tissue culture as a model of nodularcarcinomas,” Journal of the National Cancer Institute, vol. 46, no.1, pp. 113–120, 1971.
[4] J. M. Kelm, N. E. Timmins, C. J. Brown, M. Fussenegger,and L. K. Nielsen, “Method for generation of homogeneousmulticellular tumor spheroids applicable to awide variety of celltypes,” Biotechnology and Bioengineering, vol. 83, no. 2, pp. 173–180, 2003.
[5] D. Fukumura and R. K. Jain, “Tumor microvasculature andmicroenvironment: targets for anti-angiogenesis and normal-ization,” Microvascular Research, vol. 74, no. 2-3, pp. 72–84,2007.
[6] D. Ribatti, B. Nico, E. Crivellato, and A. Vacca, “The structureof the vascular network of tumors,” Cancer Letters, vol. 248, no.1, pp. 18–23, 2007.
[7] A. Krogh, The Anantomy and Physiology of Capillaries, YaleUniversity Press, New York, NY, USA, 1922.
[8] G. Helmlinger, F. Yuan, M. Dellian, and R. K. Jain, “InterstitialpH and pO2 gradients in solid tumors in vivo: high-resolutionmeasurements reveal a lack of correlation,” Nature Medicine,vol. 3, no. 2, pp. 177–182, 1997.
[9] A. L. Harris, “Hypoxia—a key regulatory factor in tumourgrowth,” Nature Reviews Cancer, vol. 2, no. 1, pp. 38–47, 2002.
[10] L. B. Gardner, Q. Li, M. S. Park,W.M. Flanagan, G. L. Semenza,and C. V. Dang, “Hypoxia inhibits G1/S transition throughregulation of p27 expression,” Journal of Biological Chemistry,vol. 276, no. 11, pp. 7919–7926, 2001.
[11] T. Alarcon, H. M. Byrne, and P. K. Maini, “A mathematicalmodel of the effects of hypoxia on the cell-cycle of normal andcancer cells,” Journal of Theoretical Biology, vol. 229, no. 3, pp.395–411, 2004.
[12] J. J. Tyson andB.Novak, “Regulation of the eukaryotic cell cycle:molecular antagonism, hysteresis, and irreversible transitions,”Journal of Theoretical Biology, vol. 210, no. 2, pp. 249–263, 2001.

10 Journal of Applied Mathematics
[13] T. Nederman, B. Norling, B. Glimelius, J. Carlsson, and U.Brunk, “Demonstration of an extracellular matrix in multicel-lular tumor spheroids,”Cancer Research, vol. 44, no. 7, pp. 3090–3097, 1984.
[14] M. T. Santini, G. Rainaldi, and P. L. Indovina, “Apoptosis, celladhesion and the extracellular matrix in the three-dimensionalgrowth of multicellular tumor spheroids,” Critical Reviews inOncology/Hematology, vol. 36, no. 2-3, pp. 75–87, 2000.
[15] S. M. Frisch and E. Ruoslahti, “Integrins and anoikis,” CurrentOpinion in Cell Biology, vol. 9, no. 5, pp. 701–706, 1997.
[16] F. Hirschhaeuser, H. Menne, C. Dittfeld, J. West, W. Mueller-Klieser, and L. A. Kunz-Schughart, “Multicellular tumorspheroids: an underestimated tool is catching up again,” Journalof Biotechnology, vol. 148, no. 1, pp. 3–15, 2010.
[17] P. P. Delsanto, C. Guiot, P. G. Degiorgis, C. A. Condat, Y.Mansury, and T. S. Deisboeck, “Growth model for multicellulartumor spheroids,” Applied Physics Letters, vol. 85, no. 18, pp.4225–4227, 2004.
[18] G. Schaller and M. Meyer-Hermann, “Continuum versus dis-crete model: a comparison for multicellular tumour spheroids,”Philosophical Transactions of the Royal Society A, vol. 364, no.1843, pp. 1443–1464, 2006.
[19] C. A. Condat and S. A. Menchon, “Ontogenetic growth ofmulticellular tumor spheroids,” Physica A, vol. 371, no. 1, pp. 76–79, 2006.
[20] B. Brutovsky, D. Horvath, and V. Lisy, “Inverse geometricapproach for the simulation of close-to-circular growth. Thecase of multicellular tumor spheroids,” Physica A, vol. 387, no.4, pp. 839–850, 2008.
[21] G. J. Pettet, C. P. Please,M. J. Tindall C.P., andD. L. S.McElwain,“Themigration of cells inmulticell tumor spheroids,” Bulletin ofMathematical Biology, vol. 63, no. 2, pp. 231–257, 2001.
[22] M. Aubert, M. Badoual, S. Fereol, C. Christov, and B. Gram-maticos, “A cellular automaton model for the migration ofglioma cells,” Physical Biology, vol. 3, no. 2, pp. 93–100, 2006.
[23] Y. Mansury and T. S. Deisboeck, “Simulating ’structure-function’ patterns of malignant brain tumors,” Physica A, vol.331, no. 1-2, pp. 219–232, 2004.
[24] Y. Jiang, J. Pjesivac-Grbovic, C. Cantrell, and J. P. Freyer,“A multiscale model for avascular tumor growth,” BiophysicalJournal, vol. 89, no. 6, pp. 3884–3894, 2005.
[25] A. R. A. Anderson, “A hybrid mathematical model of solidtumour invasion: the importance of cell adhesion,”Mathemati-cal Medicine and Biology, vol. 22, no. 2, pp. 163–186, 2005.
[26] J. von Neumann,Theory of Self-Reproducing Automata, Univer-sity of Illinois Press, 1966.
[27] Y. Cai, S. Xu, J.Wu, andQ. Long, “Coupledmodelling of tumourangiogenesis, tumour growth and blood perfusion,” Journal ofTheoretical Biology, vol. 279, no. 1, pp. 90–101, 2011.
[28] T. Roose, S. J. Chapman, and P. K.Maini, “Mathematical modelsof avascular tumor growth,” SIAMReview, vol. 49, no. 2, pp. 179–208, 2007.
[29] J. P. Freyer and R. M. Sutherland, “Regulation of growth satu-ration and development of necrosis in EMT6/Ro multicellularspheroids by the glucose and oxygen supply,” Cancer Research,vol. 46, no. 7, pp. 3504–3512, 1986.
[30] J. P. Freyer and R. M. Sutherland, “Proliferative and clonogenicheterogeneity of cells from EMT6/Ro multicellular spheroidsinduced by the glucose and oxygen supply,” Cancer Research,vol. 46, no. 7, pp. 3513–3520, 1986.
[31] J. P. Freyer, “Role of necrosis in regulating the growth saturationof multicellular spheroids,” Cancer Research, vol. 48, no. 9, pp.2432–2439, 1988.
[32] Y. Cai, K. Gulnar, H. Zhang, J. Cao, S. Xu, and Q. Long,“Numerical simulation of tumor-induced angiogenesis influ-enced by the extra-cellular matrix mechanical environment,”ActaMechanica Sinica/Lixue Xuebao, vol. 25, no. 6, pp. 889–895,2009.
[33] Y. Cai, J. Wu, S. X. Xu et al., “Numerical simulation of inhibitingeffects on solid tumour cells in anti-angiogenic therapy: appli-cation of coupled mathematical model of angiogenesis withtumour growth,” Applied Mathematics and Mechanics, vol. 32,no. 10, pp. 1287–1296, 2011.
[34] S. A.Menchon andC. A. Condat, “Quiescent cells: a natural wayto resist chemotherapy,” Physica A, vol. 390, no. 20, pp. 3354–3361, 2011.

Submit your manuscripts athttp://www.hindawi.com
Hindawi Publishing Corporationhttp://www.hindawi.com Volume 2014
MathematicsJournal of
Hindawi Publishing Corporationhttp://www.hindawi.com Volume 2014
Mathematical Problems in Engineering
Hindawi Publishing Corporationhttp://www.hindawi.com
Differential EquationsInternational Journal of
Volume 2014
Applied MathematicsJournal of
Hindawi Publishing Corporationhttp://www.hindawi.com Volume 2014
Probability and StatisticsHindawi Publishing Corporationhttp://www.hindawi.com Volume 2014
Journal of
Hindawi Publishing Corporationhttp://www.hindawi.com Volume 2014
Mathematical PhysicsAdvances in
Complex AnalysisJournal of
Hindawi Publishing Corporationhttp://www.hindawi.com Volume 2014
OptimizationJournal of
Hindawi Publishing Corporationhttp://www.hindawi.com Volume 2014
CombinatoricsHindawi Publishing Corporationhttp://www.hindawi.com Volume 2014
International Journal of
Hindawi Publishing Corporationhttp://www.hindawi.com Volume 2014
Operations ResearchAdvances in
Journal of
Hindawi Publishing Corporationhttp://www.hindawi.com Volume 2014
Function Spaces
Abstract and Applied AnalysisHindawi Publishing Corporationhttp://www.hindawi.com Volume 2014
International Journal of Mathematics and Mathematical Sciences
Hindawi Publishing Corporationhttp://www.hindawi.com Volume 2014
The Scientific World JournalHindawi Publishing Corporation http://www.hindawi.com Volume 2014
Hindawi Publishing Corporationhttp://www.hindawi.com Volume 2014
Algebra
Discrete Dynamics in Nature and Society
Hindawi Publishing Corporationhttp://www.hindawi.com Volume 2014
Hindawi Publishing Corporationhttp://www.hindawi.com Volume 2014
Decision SciencesAdvances in
Discrete MathematicsJournal of
Hindawi Publishing Corporationhttp://www.hindawi.com
Volume 2014
Hindawi Publishing Corporationhttp://www.hindawi.com Volume 2014
Stochastic AnalysisInternational Journal of