a high-density, high-channel count, multiplexed µ ecog...
TRANSCRIPT

doi:10.1152/jn.00179.2013 112:1566-1583, 2014. First published 11 June 2014;J NeurophysiolCohenJan, Yonggang Huang, Ming Li, Jian Wu, John A. Rogers, Brian Litt and Yale E. Burke, Matthew Campisi, Yun-Soung Kim, Andrew E. Avrin, Van der SpiegelC. Higgins, Douglas A. Storace, Andrew S. K. Liu, Adam M. Gifford, John F. Monty A. Escabí, Heather L. Read, Jonathan Viventi, Dae-Hyeong Kim, NathanECoG array for auditory-cortex recordings
µA high-density, high-channel count, multiplexed
You might find this additional info useful...
63 articles, 30 of which can be accessed free at:This article cites /content/112/6/1566.full.html#ref-list-1
including high resolution figures, can be found at:Updated information and services /content/112/6/1566.full.html
can be found at:Journal of Neurophysiologyabout Additional material and information http://www.the-aps.org/publications/jn
This information is current as of September 17, 2014.
American Physiological Society. ISSN: 0022-3077, ESSN: 1522-1598. Visit our website at http://www.the-aps.org/.(monthly) by the American Physiological Society, 9650 Rockville Pike, Bethesda MD 20814-3991. Copyright © 2014 by the
publishes original articles on the function of the nervous system. It is published 12 times a yearJournal of Neurophysiology
on Septem
ber 17, 2014D
ownloaded from
on Septem
ber 17, 2014D
ownloaded from

Innovative Methodology
A high-density, high-channel count, multiplexed �ECoG array forauditory-cortex recordings
Monty A. Escabí,1,2,3* Heather L. Read,1,2* Jonathan Viventi,4,5 Dae-Hyeong Kim,6
Nathan C. Higgins,1 Douglas A. Storace,1 Andrew S. K. Liu,7 Adam M. Gifford,8 John F. Burke,8
Matthew Campisi,5 Yun-Soung Kim,9 Andrew E. Avrin,10 Jan Van der Spiegel,10 Yonggang Huang,12
Ming Li,13 Jian Wu,14 John A. Rogers,9 Brian Litt,11,15 and Yale E. Cohen11,16,17
1Department of Psychology, University of Connecticut, Storrs, Connecticut; 2Department of Biomedical Engineering,University of Connecticut, Storrs, Connecticut; 3Department of Electrical Engineering, University of Connecticut, Storrs,Connecticut; 4Center for Neural Science, New York University, New York, New York; 5Department of Electrical andComputer Engineering, Polytechnic Institute of New York University, Brooklyn, New York; 6Center for Nanoparticle Researchof Institute for Basic Science, School of Chemical and Biological Engineering, Seoul National University, Seoul, Republic ofKorea; 7Bioengineering Graduate Group, University of Pennsylvania, Philadelphia, Pennsylvania; 8Neuroscience GraduateGroup, University of Pennsylvania, Philadelphia, Pennsylvania; 9Department of Materials Science and Engineering, BeckmanInstitute for Advanced Science and Technology and Frederick Seitz Materials Research Laboratory, University of Illinois atUrbana-Champaign, Urbana, Illinois; 10Department of Electrical and Systems Engineering, University of Pennsylvania,Philadelphia, Pennsylvania; 11Department of Bioengineering, University of Pennsylvania, Philadelphia, Pennsylvania;12Departments of Mechanical Engineering and Civil and Environmental Engineering, Northwestern University, Evanston,Illinois; 13State Key Laboratory of Structural Analysis for Industrial Equipment, Dalian University of Technology, Dalian,China; 14Department of Engineering Mechanics, Tsinghua University, Beijing, China; 15Department of Neurology, PerelmanSchool of Medicine, University of Pennsylvania, Philadelphia, Pennsylvania; 16Department of Neuroscience, Perelman Schoolof Medicine, University of Pennsylvania, Philadelphia, Pennsylvania; and 17Department of Otorhinolaryngology, PerelmanSchool of Medicine, University of Pennsylvania, Philadelphia, Pennsylvania
Submitted 11 March 2013; accepted in final form 6 June 2014
Escabí MA, Read HL, Viventi J, Kim DH, Higgins NC, StoraceDA, Liu AS, Gifford AM, Burke JF, Campisi M, Kim YS, AvrinAE, Van der Spiegel J, Huang Y, Li M, Wu J, Rogers JA, Litt B,Cohen YE. A high-density, high-channel count, multiplexed �ECoGarray for auditory-cortex recordings. J Neurophysiol 112: 1566–1583,2014. First published June 11, 2014; doi:10.1152/jn.00179.2013.—Our understanding of the large-scale population dynamics of neuralactivity is limited, in part, by our inability to record simultaneouslyfrom large regions of the cortex. Here, we validated the use of alarge-scale active microelectrode array that simultaneously records196 multiplexed micro-electrocortigraphical (�ECoG) signals fromthe cortical surface at a very high density (1,600 electrodes/cm2). Wecompared �ECoG measurements in auditory cortex using a custom“active” electrode array to those recorded using a conventional “pas-sive” �ECoG array. Both of these array responses were also comparedwith data recorded via intrinsic optical imaging, which is a standardmethodology for recording sound-evoked cortical activity. Customactive �ECoG arrays generated more veridical representations of thetonotopic organization of the auditory cortex than current commer-cially available passive �ECoG arrays. Furthermore, the corticalrepresentation could be measured efficiently with the active arrays,requiring as little as 13.5 s of neural data acquisition. Next, wegenerated spectrotemporal receptive fields from the recorded neuralactivity on the active �ECoG array and identified functional organi-zational principles comparable to those observed using intrinsic met-abolic imaging and single-neuron recordings. This new electrodearray technology has the potential for large-scale, temporally precise
monitoring and mapping of the cortex, without the use of invasivepenetrating electrodes.
electrocorticography; �ECoG; auditory cortex; topography; tonotopy
FUTURE LARGE-SCALE BRAIN RECORDINGS in humans and experi-mental-animal models require methodologies that yield hightemporal and spatial precision of recordings across large cor-tical surface areas in a minimally invasive manner. Theseapplications also could benefit from techniques that allow forrapid simultaneous, continuous data acquisition from largecortical surface areas. However, the resolution and coverage ofall current electrode arrays in development for such applica-tions has been limited by the constraint that each electrode isindividually connected to external systems. The volume andbulk of these connections typically limit implanted arrays totens of electrodes in small animals covering a relatively smallarea.
Emerging new technologies for recording subdural electricalpotentials [micro-electrocortigraphical (�ECoG)] could in the-ory accommodate the above application problem. However, toscale surface arrays to hundreds of electrodes, conventionalelectrode designs require extremely fine pitch wires, which arenot reliably reproducible. Furthermore, as the number of wiresincreases, chronic implantation becomes increasingly difficult,if not impossible, due to the size, weight and bulk of theconnectors and wiring. In principle, multiplexed electrodearrays can scale to higher channel counts with only a smallincrease in the number of required interface wires.
* M. A. Escabí and H. L. Read contributed equally to this work.Address for reprint requests and other correspondence: Y. E. Cohen, Dept.
of Otorhinolaryngology, Perelman School of Medicine, Univ. of Pennsylvania,3400 Spruce-5 Ravdin, Philadelphia, PA 19104 (e-mail: [email protected]).
J Neurophysiol 112: 1566–1583, 2014.First published June 11, 2014; doi:10.1152/jn.00179.2013.
1566 0022-3077/14 Copyright © 2014 the American Physiological Society www.jn.org
on Septem
ber 17, 2014D
ownloaded from
Here, we validated and demonstrated the utility of a newflexible, multiplexed electrode array that enables practicalinterfaces with hundreds to potentially thousands of electrodesusing a small number of external connections, feasible forchronic implantation. Configuration differences between ourcustom active, multiplexed electrode �ECoG array and com-parable arrays used previously are summarized in Table 1.Prior studies have exclusively used passive electrodes, withlimited numbers of electrodes (�100) and limited cortical areacoverage (�4 mm2). In contrast, this custom active electrodearray was designed to record �ECoG potentials with fine pitchspacing (250 �m) and large area coverage (12.3 mm2) in a
design that can be readily scaled to cover larger areas. Thisarray provides similar cortical area coverage with higher spa-tial resolution mapping than our laboratory’s previously dem-onstrated devices (Viventi et al. 2011).
This improvement was enabled by a novel flexible tran-sistor design (Fig. 1A, first panel). Importantly, by integrat-ing active circuitry directly into the subdural array, we wereable to buffer and multiplex the signal outputs, whichimproved the signal quality and dramatically reduced thenumber of required interface wires: in this work, we inter-faced 196 electrodes using only 29 wires. This small numberof wires will be critical for future applications, including
Table 1. Comparison of prior �ECoG and �ECoG investigations of auditory cortex
Study Electrode TypeNo. of
ElectrodesNo. ofWires
Cortical SurfaceResolution, �m
Approximate SampledCortical Area
Ogawa et al. 2011 Penetrating 64 64 450 2 mm � 1 mmTakahashi et al. 2003 Surface �ECoG 69 69 250 2 mm � 2 mmOwens et al. 1995 Surface �ECoG 25 25 210 1 mm � 1 mmBesle et al. 2011 Surface �ECoG 127 127 10,000 Up to 127 cm2
Pasley et al. 2012 Surface �ECoG 64 64 4,000 10 cm2
Present study Surface �ECoG 196 29 250 3.5 mm � 3.5 mm
�ECoG, micro-electrocortigraphical.
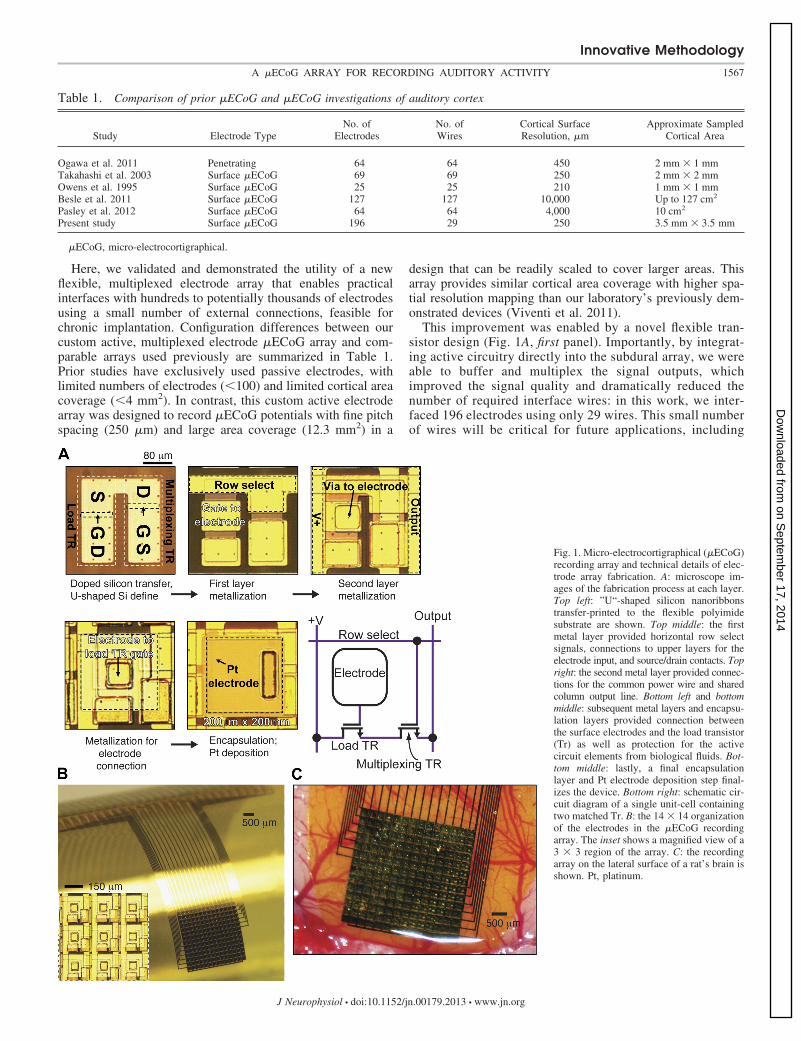
Fig. 1. Micro-electrocortigraphical (�ECoG)recording array and technical details of elec-trode array fabrication. A: microscope im-ages of the fabrication process at each layer.Top left: ”U“-shaped silicon nanoribbonstransfer-printed to the flexible polyimidesubstrate are shown. Top middle: the firstmetal layer provided horizontal row selectsignals, connections to upper layers for theelectrode input, and source/drain contacts. Topright: the second metal layer provided connec-tions for the common power wire and sharedcolumn output line. Bottom left and bottommiddle: subsequent metal layers and encapsu-lation layers provided connection betweenthe surface electrodes and the load transistor(Tr) as well as protection for the activecircuit elements from biological fluids. Bot-tom middle: lastly, a final encapsulationlayer and Pt electrode deposition step final-izes the device. Bottom right: schematic cir-cuit diagram of a single unit-cell containingtwo matched Tr. B: the 14 � 14 organizationof the electrodes in the �ECoG recordingarray. The inset shows a magnified view of a3 � 3 region of the array. C: the recordingarray on the lateral surface of a rat’s brain isshown. Pt, platinum.
Innovative Methodology
1567A �ECoG ARRAY FOR RECORDING AUDITORY ACTIVITY
J Neurophysiol • doi:10.1152/jn.00179.2013 • www.jn.org
on Septem
ber 17, 2014D
ownloaded from

chronic implantation and recording from high-resolutionarrays in freely behaving animals.
Current methodologies fail to record continuous corticalresponses with a high degree of spatial and temporal resolutionover a large cortical surface area; thus here we explore thepossibility that �ECoG recording technologies can fill thismethodological gap. Fourier intrinsic optical imaging (IOI)methodologies successfully measure metabolic responses totones with a high degree of spatial resolution across a largecortical area; however, due to the slow time course of themetabolic response, IOI is not ideal for measuring corticalresponses with high stimulus evoked timing precision(Kalatsky et al. 2005; Kalatsky and Stryker 2003). Further-more, despite its high spatial resolution, data acquisition forIOI is relatively slow, requiring tens of minutes to generatecortical response maps. Six tonotopically organized auditorycortical fields have been identified with IOI in the rat temporalcortex (Kalatsky et al. 2005; Polley et al. 2007). Metabolic andspike rate-based tone-frequency responses obtained with IOIand penetrating electrode multiunit recordings are correlatedand have a similar spatial resolution for topographic organiza-tion (i.e., tonotopy) (Kalatsky et al. 2005; Storace et al. 2011).In the present study, utilizing our custom �ECoG array, wefind average pure-tone evoked �ECoG responses are corre-lated with IOI pure-tone responses, and the two methodol-ogies yield similar response spatial resolution and tono-topies in multiple rat auditory cortical fields. Furthermore,we demonstrate that the tonotopic organization can bemeasured quickly at high spatial resolution, with as little as13.5 s of data acquisition time.
Primary (A1) and ventral nonprimary auditory cortical fieldshave unique ascending glutamatergic pathways that could alterthe timing precision of their responses to dynamic sounds(Storace et al. 2012). Here, we used active �ECoG array torecord continuous cortical responses to dynamically modulatedsounds and demonstrated novel differences in response timingprecision in A1 vs. ventral nonprimary auditory cortical fieldsof the rat. Temporally precise responses of auditory pathwayneurons can be quantified by playing continuous 10-min-longsegments of dynamic moving ripple (DMR) noise sounds andreconstructing the spectrotemporal response field (STRF) (Es-cabi and Read 2005). A similar approach has been used torecord STRFs in A1 of rodents previously (Geffen et al. 2011;Linden et al. 2003; Machens et al. 2004). This approach alsohas been adapted to quantify temporally precise A1 local fieldpotential responses with �ECoG arrays (Owens et al. 1995;Takahashi et al. 2003). Here, we assess temporally precise andreliable �ECoG STRFs in A1, ventral auditory field (VAF),and a region dorsal to A1. Significant STRFs were obtainedwith �ECoG in A1 and the region dorsal to A1, indicating ahigh degree of temporally precise (synchronized) responses toDMR. In contrast, few significant STRFs were evident in VAF.Thus there is a higher timing precision of responses in A1 thanVAF as predicted based on glutamateric pathway differences.These findings suggest that this new �ECoG array technologyhas the potential for large-scale, temporally precise continuousmonitoring and functional mapping of sound responses inmultiple cortical fields, without the use of invasive penetratingelectrodes.
MATERIALS AND METHODS
Animals and Surgical Procedures
Surgeries and brain recordings were carried out in a total of sixadult male rats (Brown Norwegian). Responses were recorded withour custom active �ECoG array in three of these rats and with acommercially available passive �ECoG array (NeuroNexus Technol-ogies, Ann Arbor, MI) in the remaining three animals. Anesthesia wasinduced with a cocktail of ketamine (12–60 mg/kg), xylazine (1.25–7mg/kg), and acepromazine (0.25–0.5 mg/kg) and was maintained in astage III, plane II of general anesthesia with pentobarbital sodium(20–50 mg/kg intraperitoneally) for surgical and experimental proce-dures. Anesthesia was supplemented as needed to maintain areflexia,and anesthetic depth was monitored periodically via pedal reflex andheart rate (electrocardiogram; GE Healthcare, Waukesha, WI). Oncethe rats were anesthetized, we performed a tracheotomy and cistern-magnum puncture. To minimize respiratory secretions and cerebraledema, respectively, atropine sulfate (0.1 mg/kg) and dexamethasone(0.25 mg/kg) were administered. The skull and dura were removed toexpose the temporal cortex in the right cerebral hemisphere. For theintrinsic optical-imaging studies, the exposed brain was covered withagar and sealed with a glass coverslip. Following the imaging studies,the coverslip and agar were removed, and the �ECoG electrode arraywas placed directly on the cortical surface. All housing and experi-mental procedures were done according to the approved guidelines ofthe Institutional Animal Care And Use Committee at the University ofConnecticut and in accordance with National Institutes of Health andAmerican Veterinary Medical Association guidelines.
Auditory-Stimulus Delivery and Design
Auditory stimuli were delivered binaurally with a closed calibratedaudio system. The stimuli were generated off-line with custom C��
or MATLAB (The Mathworks) software at a rate of 98 kHz or 96kHz, 24-bit resolution, and delivered with a dynamic drive (Beyer DT880, custom housing). The closed-speaker system was calibrated atthe rat’s ear with a 400-sample finite-impulse response inverse filterthat was implemented on a RX6 multifunction processor (Tucker-Davis Technologies). The close-field system was linear (input-outputcoherence �0.95) and had a flat frequency response between 1 and 47kHz (�3 dB). During the �ECoG-array recordings, auditory stimuliwere delivered at 96 kHz with a DIGI 9652 (RME) professional audiocard connected optically to an ADI-8 DS digital-to-analog converter(RME). When the optical-imaging data were collected, auditorystimuli were delivered with a Lynx Studio Technology audio card at98 kHz.
Auditory Stimuli
To assess tone responses with IOI, auditory stimuli deliveredincluded 16 pure-tone pips (5-ms rise time, 50-ms duration, a 250-msintertone interval). All tones were presented at a single sound level [45dB, sound pressure level (SPL)]. Pure-tone pip sequences werepresented as ascending (2–32 kHz) or descending (32–2 kHz) (0.25-octave steps) sequences that repeated for continuous acquisition ofIOIs. The responses from the pure-tone stimuli were used to calculatethe best frequency (BF; see below).
To assess pure-tone responses with �ECoG potentials, auditorystimuli delivered included pure-tone pips (5-ms rise time, 50-msduration). Tone pip frequency and sound level were varied between1.4 and 45 kHz (1⁄8-octave steps) and 5 and 85 dB SPL (10-dB steps),respectively. Each frequency and level combination was delivered sixtimes in a random interleaved order at a rate of 3.3 Hz (300-msintertone interval). The responses from the tone-pip stimuli were usedto calculate the frequency response area (FRA), BF, and bandwidth(BW, see below).
Innovative Methodology
1568 A �ECoG ARRAY FOR RECORDING AUDITORY ACTIVITY
J Neurophysiol • doi:10.1152/jn.00179.2013 • www.jn.org
on Septem
ber 17, 2014D
ownloaded from
To assess �ECoG STRFs, the auditory stimulus was a continuous(10-min duration) DMR noise (Escabí and Schreiner 2002). The DMRwas generated digitally at a sampling rate of 96 kHz with 24-bitresolution in MATLAB. The DMR was a continuous time-varyingbroadband sound that covered the frequency range between 1 and 48kHz. At any instant of time, the DMR had a sinusoidal spectrum; thedensity of the spectral peaks was determined by the spectral-modu-lation frequency (0–4 cycles/octave). The peak-to-peak amplitude ofthe ripple was 30 dB. The DMR also contained temporal modulationsthat were controlled by varying the temporal-modulation frequency(0–25 Hz). Both the spectral and temporal parameters varied ran-domly and dynamically; the maximum rate of change for theseparameters was 0.25 Hz and 1 Hz, respectively. This variability in thespectral and temporal properties provided an opportunity to probe thetemporal and spectral acoustic space in an unbiased manner. DMRwas delivered binaurally at 80 dB SPL (65 dB spectrum level per 1⁄3octave), twice (20 min total) during each recording session.
Brain Recordings
Below, we discuss 1) the construction of and recording methodol-ogy for our ”active“ multiplexed �ECoG array; 2) the recordingmethodology for a conventional technology ”passive“ NeuroNexus�ECoG array; and 3) the recording techniques for the IOI.
Active �ECoG array. To enable a high-resolution interface withlarge areas of the rodent brain, we developed an array of cortical-surface electrodes using flexible silicon electronics technology (Fig.1). Active electrode arrays were fabricated using a multilayer process(Fig. 1A). Doped silicon nano-ribbons (�260 nm) were located in thefirst layer through the use of transfer-printing technology. The arraywas composed of 392 silicon nanomembrane transistors. A unique”u-shaped“ silicon nanomembrane (Fig. 1A, first panel) allowed thesource of the buffer transistor to be connected to the drain of themultiplexing transistor through a continuous doped region, withoutusing the metal layers above. This enabled the row-select signal (Fig.1A, first layer metal) to pass over the oxide-insulated source and drainregions. Because this u-shape efficiently used the available space, wecould design an electrode that had a dense packing of electrodes (Fig.1B, inset), while maintaining large feature sizes that were easier tofabricate. The active matrix circuit design contained two transistorsper unit-cell (Fig. 1A, bottom right). The buffer transistor, which wasconnected to the electrode, buffered the �ECoG signals. The multi-plexing transistor allowed all of the electrodes in the same column toshare a single output wire (Fig. 1A, second layer metal). Flexibletransistors were fabricated using high-quality single-crystal silicon,enabling high-speed multiplexing (�5 �s) and sampling rates (�10kS/s) (Viventi et al. 2010) and very low multiplexer cross talk (lessthan �65 dB) (Viventi et al. 2011).
Subsequent horizontal and vertical metal interconnect layers wereinsulated using layers of polyimide (�1.2 �m, Sigma Aldrich).Additional polymeric encapsulation layers (Fig. 1A, metallization forelectrode connection; polymide and epoxy, �1.2 �m and �4 �m)with an offset vertical interconnect-access structure prevented electri-cal-leakage currents when the device was immersed in highly con-ductive media. As a final step, platinum (�50 nm) was evaporated anddeposited onto the electrodes’ surface to reduce their impedance (Fig.1A, encapsulation and Pt deposition) (�45 k at 1 kHz). Detailedfabrication procedures have been described previously (Viventi et al.2010, 2011).
We manufactured a �ECoG-recording array with 196 electrodesthat were organized into a 14 � 14 matrix (Fig. 1, B and C). Eachsurface electrode was 200 � 200 �m, with 50-�m spacing betweeneach recording site, yielding a center-to-center distance of 250 �m.The total size of the recording area was �3.5 � 3.5 mm. The overallthickness of the multilayer structure composing the electrode arraywas �25 �m. Using multiplexing circuitry, each recording site wassampled discretely; the 196-channel recording array required only 29
interface wires. These wires were connected to a custom data acqui-sition system (Viventi et al. 2011) through a flexible anisotropicconductive film (Elform).
The multiplexed analog signals from the �ECoG array weresynchronously sampled at 125 kS/s using a custom data-acquisitionsystem (Viventi et al. 2010, 2011) with four data-acquisition cards(PXI-6289, National Instruments). Neural (voltage) signals were re-corded relative to a reference electrode that was attached to eachanimal.
To reduce the recording noise, multiple samples (n 30) werecollected and averaged at each recording (electrode) site beforesampling �ECoG activity at the next recording site. The 14 row selectsignals of the multiplexed electrode array were cycled at �8.928 kHzto sample all of the electrodes on the array, yielding an effectivesampling rate of �297.6 Hz per active electrode. All of the 14electrodes in a given column were sampled sequentially. The multi-plexer output settled in less than 5 �s. With improvements in thedesign of our data acquisition system, the multiplexing rate could beincreased to enable sampling rates higher than 14 kS/s per electrode.Here, data were acquired, demultiplexed, filtered (analog high-passfilter at 0.007 Hz), stored, and displayed in real-time using customLabVIEW software (National Instruments).
Custom passive �ECoG array. In three separate animals, werecorded neural activity with commercially available passive �ECoGarrays (NeuroNexus; E32-300-20-50). Unlike the active transistor�ECoG arrays designed here, the NeuroNexus is a passive �ECoGarray containing 32 electrodes arranged into 4 columns and 8 rowswith 300-�m contact spacing and contact diameter of 50 �m(1,963-�m contact area). Neural data were acquired for these arrayswith a TDT Z-series system (PZ2–128 amplifier and RZ2 processor)at a sampling rate of 2 kHz. Note that the custom array covers a largerarea, with higher spatial resolution, and a larger number of electrodesthan the commercially available array used in this study. This willimpact on extent and possibly resolution of response topographies.Hence, site-by-site comparisons are made between IOI and arrayresponses in the RESULTS section.
IOI. A1 and secondary auditory cortical fields differ in averagesound-response properties and the topography of these responseproperties as demonstrated with multiunit penetrating electrode andIOI methodologies (Funamizu et al. 2013; Higgins et al. 2010;Kalatsky et al. 2005; Polley et al. 2007; Storace et al. 2011). Toneresponses obtained with IOI and multiunit penetrating electrodes arecorrelated and have similar tonotopic organization (Escabi et al. 2007;Kalatsky et al. 2005; Storace et al. 2011). Here, IOI was used as itprovides a larger area of response acquisition coverage in a shorteramount of time than penetrating electrode arrays. Fourier methodswere used to extract the phase and magnitude of the intrinsic meta-bolic response to continuous (and periodic) auditory stimuli, asdescribed in detail elsewhere (Kalatsky et al. 2005). After preparing arat and positioning the earbars and speakers, a Dalsa 1M30 CCDcamera (512 � 512 pixel array) was focused on the cortical surface.The cortex was illuminated with green-wavelength (547 � 10 nm)light to obtain a 4.6 � 4.6 mm2 image of the surface blood vessels.Next, the focal plane was translated down by 650 �m, and thereflectance of red-wavelength light (605 � 10 nm) was recorded whilediotically presenting the tone sequences. Because ascending anddescending tone sequences yielded similar IOI frequency topogra-phies, the hemodynamic delay was corrected by subtracting theascending and descending maps to create a frequency differencetone-response map (Higgins et al. 2010; Kalatsky et al. 2005). Toreduce the pixel variability, tone-response maps were Gaussian fil-tered (SD 162 �m), as described previously (Storace et al. 2011).Note that tone-responses obtained with IOI were at a single binaurallymatched low sound level (45 dB SPL). Using this high correlationbetween the multiunit BFs and IOI BFs is obtained whether consid-ering unit-response BF estimates from a single matched SPL or from
Innovative Methodology
1569A �ECoG ARRAY FOR RECORDING AUDITORY ACTIVITY
J Neurophysiol • doi:10.1152/jn.00179.2013 • www.jn.org
on Septem
ber 17, 2014D
ownloaded from
the entire unit-response FRA (Higgins et al. 2008; Kalatsky et al.2005; Storace et al. 2011).
Data Analysis
Calculating BF and BW from �ECoG FRA. FRAs were computedfrom the continuous �ECoG data. We collected �ECoG data whiletone pips, which varied in frequency and sound level, were deliveredto a rat. For each recording site, we computed the average response toeach tone-pip across six trials over a window of 300 ms followingtone-pip onset. The FRA was obtained by calculating the averagepeak-to-peak voltage value as a function of tone frequency and soundlevel.
For each recording site, a FRA was significant if the FRA-datasamples exceeded a significance criterion of P � 0.001. Samples thatdid not meet this significance requirement were set to a value of zero.As a null hypothesis, we assumed that the �ECoG signal had equalpower but occurred randomly with respect to the tone pips. Wesimulated this scenario by creating a random ”noise“ FRA (nFRA).This nFRA was created by first randomizing the �ECoG signal’sphase spectrum. This phase randomization preserved the power spec-trum of the original signal and thus generated a noise response thatwas temporally uncorrelated with the tone pips. Next, the nFRA wascomputed as described above for the original data. This procedure wasbootstrapped (50 iterations), and the samples from the nFRAs formeda reference-noise distribution. Because nFRA samples were normallydistributed (�2 test, P � 0.01), we required that the original FRAsamples exceeded 3 SDs of the nFRA to achieve a significance levelof P � 0.001. Using only those significant FRA samples, a recordingsite’s BF was defined as the center-of-mass of the FRA at 65 dB SPL.This sound level was chosen because significant responses could bemeasured across the majority of recording sites of the array at thisSPL. The BW of the tone FRA was measured as twice the SD oftone-frequency response at 65, 75, or 85 dB SPL.
Determining cortical field boundaries and calculating BF from theintrinsic optical image. The pure-tone BF estimates from the IOI wereobtained as described in detail previously (Higgins et al. 2010; Storaceet al. 2011). Here, the pure-tone BFs estimated from IOI and �ECoGarray recordings were compared for data from the same cortical sitemeasured with each method. Our optical images were obtained at asound level of 45 dB, whereas �ECoG data were analyzed at a soundlevel of 65 dB. This was done because many of the cortical sites didnot exhibit statistically significant responses with �ECoG at 45 dBSPL, and thus BFs could not be obtained to compare against the IOI.Consequently, there is a 20-dB difference in the sound level of thetones used to estimate BF for the two methodologies. This is areasonable comparison, as our laboratory’s prior studies found mini-mal differences in BFs between 45 and 75 dB in A1 (Higgins et al.2008). Likewise, BFs estimated from a single sound level in the IOIare highly correlated with BFs estimated from the average of severalsound levels (Kalatsky et al. 2005). The cortical field boundariesbetween A1, VAF, anterior (AAF), and suprarhinal auditory fields(SRAF) were determined by the direction of the BF gradients in theIOI, as described in detail elsewhere (Higgins et al. 2010) and byothers (Doron et al. 2002; Kalatsky et al. 2005; Rutkowski et al. 2003;Takahashi et al. 2011). The active �ECoG array covered A1, VAFand AAF, whereas the passive �ECoG array covered a smaller areaexcluding AAF in some animals. Hence, detailed comparisons be-tween IOI and �ECoG estimates of BF were made for those locationsthat overlapped with both recording methodologies.
Calculating and identifying reliable STRFs with the active �ECoGarray. Additionally, for our activity �ECoG array, we generated theSTRFs at each electrode site. Specifically, for each electrode site, aSTRF (558 frequency � 151 temporal samples) was computed fromthe continuous �ECoG signal that was collected while the DMRstimulus was delivered to a rat. Because the auditory stimulus and the�ECoG signal were continuous, the STRF was generated by cross-
correlating the stimulus’ spectrotemporal envelope [STRF (�, Xk)]with the �ECoG signal [r(t)]:
STRF��, Xk� �1
�S2 �r�t � �� · S�t, Xk�� (1)
where �·� is the time-average operator, Xk is the octave frequency ofthe kth frequency channel, and �S
2 is the variance of the DMRspectrotemporal envelope.
For each recording site, we identified statistically significant spec-trotemporal samples of the STRF that exceeded a significance crite-rion of P � 0.001. As a null hypothesis, we assumed that the �ECoGsignal occurred randomly with respect to the DMR stimulus. Wesimulated this scenario by creating a random ”noise“ STRF (nSTRF).This nSTRF was generated by first randomizing the �ECoG signal’sphase spectrum. The resulting signal’s power spectrum was identicalto the original �ECoG signal but had a random temporal response.Next, we cross-correlated this phase-randomized signal with thestimulus’ spectrotemporal envelope (using Eq. 1). This procedure wasbootstrapped (50 iterations), and the samples for each of the nSTRFsformed a reference-noise distribution. Because the nSTRF sampleswere normally distributed (�2 test, P � 0.01), we required that theoriginal STRF samples exceed 3 SDs of the nSTRF to achieve asignificance level of P � 0.001.
For any given trial of the DMR, �84 STRF samples (151 temporal �558 spectral samples � 0.001 84.3 samples) were false positives;that is, they exceeded the significance level of P � 0.001 by chance.Whereas such samples exceeded the significance criterion, they didnot satisfy the primary objective of identifying STRFs that hadreproducible auditory responses. To overcome this issue, we com-puted a “reliability” index (RI) that identified STRF samples withsignificantly reproducible structure. The RI was calculated by firstsegmenting the continuous �ECoG response into 60-s-long segments(20 segments total). One-half of the 60-s segments were selected atrandom, and two STRFs were generated with each half of the data(STRFA and STRFB). This procedure was bootstrapped 500 times. Foreach iteration and as a function of each sample, we computed thecorrelation coefficient between STRFA and STRFB. RI was defined asthe average correlation coefficient across all bootstrap iterations. RIvalues near 1 indicated that a STRF sample was highly reliable. Incontrast, RI values near 0 indicated that the STRF sample was notreliable. Finally, a recording site was defined to contain a “significantresponse” only if the RI exceeded chance reliability. To calculate thisprobability, the RI was first calculated from the phase-randomized�ECoG signal. Using the distribution of RI measurements obtainedfor this phase-randomized �ECoG, reliable sites were identified at asignificance level of P � 0.01. Only those recording sites thatcontained a significantly reliable response were considered for furtheranalysis.
ESTIMATING STRF PARAMETERS. The preferred spectral and tem-poral modulation of a recording site was estimated from the ripple-transfer function, which was the two-dimensional Fourier transform ofa significant STRF. The spectral- and temporal-modulation transferfunctions were calculated by 1) collapsing the ripple-transfer functionrelative to its spectral and temporal dimensions, respectively, and 2)then normalizing each function for a maximum gain of one. The“best” spectral and temporal modulations were the center-of-massvalues of these respective functions. The spectral-modulation upper-cutoff frequency was the modulation frequency where the gain of thespectral-modulation function was reduced by 3 dB (or equivalently to50% of the maximum power). The temporal-modulation upper-cutofffrequency was defined in an analogous manner. Details of the rippletransfer-function analysis have been reported previously (Qiu et al.2003; Rodriguez et al. 2010b).
Other response parameters were also measured directly from eachrecording site’s STRF. The BF and “response delay” were defined,respectively, as the frequency and temporal lag that corresponded to
Innovative Methodology
1570 A �ECoG ARRAY FOR RECORDING AUDITORY ACTIVITY
J Neurophysiol • doi:10.1152/jn.00179.2013 • www.jn.org
on Septem
ber 17, 2014D
ownloaded from

the maximum STRF value. Note that the STRF BF and the pure-toneBF: 1) are generated from DMR and pure-tone auditory stimuli,respectively, and 2) they are potentially different in that they reflecttemporally precise phase-locked activity to the DMR for the STRF vs.the maximum firing rate to tones from the FRA, respectively. We alsoestimated the BW and integration time of each STRF to characterizethe spectral and temporal resolution of each recording site. To esti-mate these values, we first obtained a response time-frequency powerdistribution by computing the squared magnitude of the Hilberttransform of each STRF. Next, the spectral- and temporal-marginalfunctions were calculated by collapsing this power distribution alongits spectral and temporal dimensions, respectively. The STRF “band-width” was twice the SD of the spectral-marginal function, and theSTRF “integration time” was twice the standard deviation of thetemporal-marginal function (Rodriguez et al. 2010b).
Correlation between recording sites on the active �ECoG array.The correlation between two recording sites on the active �ECoGarray was calculated by finding the cross-correlogram between theconcatenated �ECoG signals that were elicited over the combinedfirst and second 10-min representations of the DMR stimulus (20 mintotal). Given the measured neural response from sites k [sk(t)] and l[sl(t)], the cross-correlation was first obtained as
rkl��� �1
T�T�SK�t���k��S1�t � ����1�dt
where �k and �l are the mean values of the response. The normalizedcorrelation was then defined as
CKl��� �kl����k�l
Note that the cross-correlations (i.e., correlations between �ECoGsignals at different sites) reflected contributions of both signal andnoise correlations (i.e., neural variability, etc.). If the measured neuralresponses contain both a sound-driven [signal, x(t)] and neural vari-ability [noise, n(t)]:
SK�t� � Xk�t� � nk�t�and the signal and noise are independent, it can be shown that:
CKl��� �xkxl
����k�l
�nknl
����k�l
� Cklsignal��� � Ckl
noise���
Thus the normalized cross-correlation, in general, reflects both signaland noise correlations from the measured response.
The significance of the correlation was calculated with a bootstrapanalysis: we independently randomized the phase of two �ECoGsignals, which maintained their magnitude spectrum, and then calcu-lated the correlation between these randomized signals. This processwas repeated 5,000 times to generate a distribution of correlationvalues that we compared with the actual peak-correlation value.Further analysis was restricted only to those sites with significant(P � 0.01, relative to the randomized distribution) peak-correlationvalues. We also limited our analyses to cross-correlograms with peaksoccurring at times 0.1 s, which are typical of those found in studiesof single-unit cross-correlation (Miller et al. 2001), and to pairs ofsites that had significant STRFs.
RESULTS
FRAs Generated with a Custom Active �ECoG Array
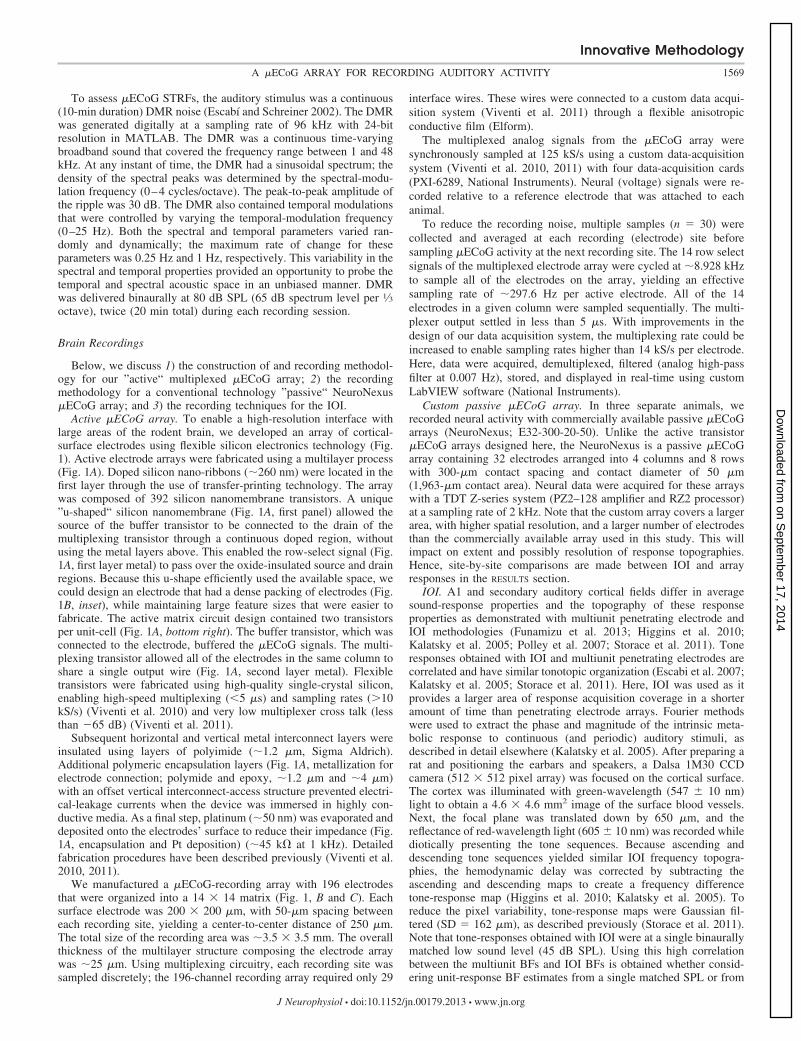
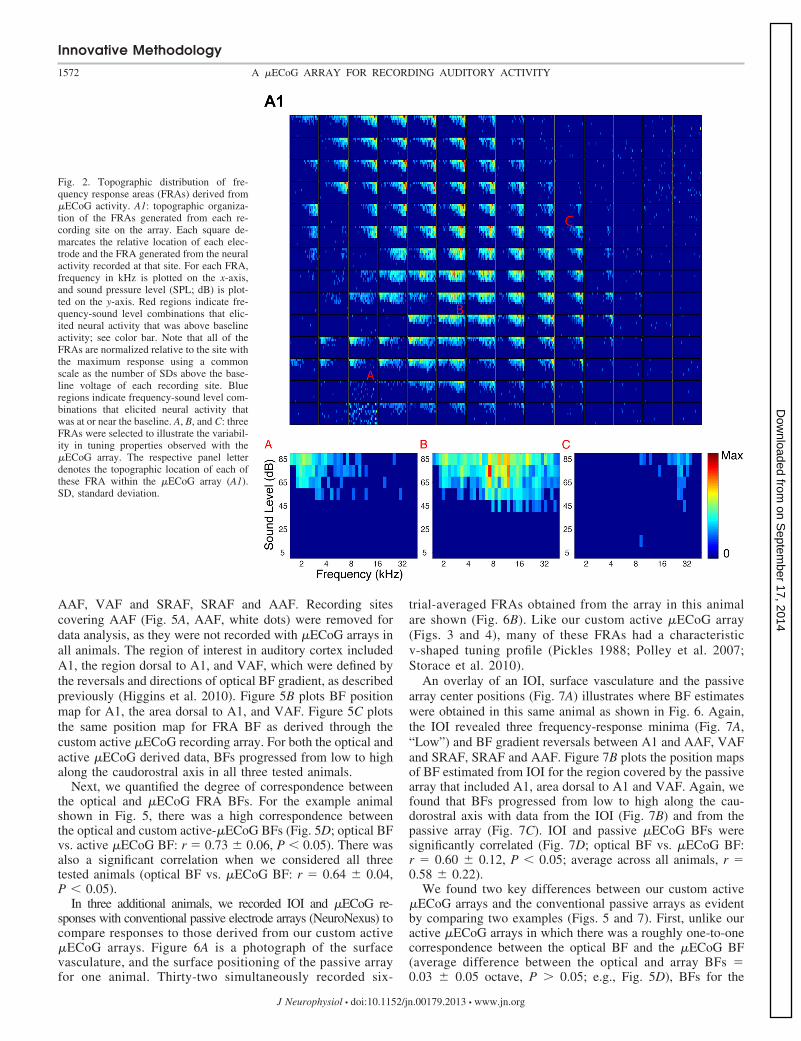
To quantify the frequency selectivity of a recording site,FRAs were generated on each electrode in the array by mea-suring the cortical �ECoG response to tone pips of varyingfrequency and sound levels (6 repetitions per condition, MATE-RIALS AND METHODS). The spatial distribution of FRAs from six
trial-averaged �ECoG responses from one animal is shown inFigure 2.
To illustrate the reliability of the responses from our customactive �ECoG array, Fig. 3 compares single-trial responseswith trial-averaged responses from a single recording site. Thetop panels in this figure show the single-trial �ECoG responsetraces (Fig. 3A) and the trial-averaged (Fig. 3B) �ECoGresponses. Individual and trial-averaged responses were typi-cally biphasic, resembling in some respects local field re-sponses to a variety of sounds in rat auditory cortex (Centanniet al. 2014; Reimer et al. 2011; von der Behrens et al. 2009).The bottom panels show the single-trial FRA and the corre-sponding trial-averaged FRA. As can be seen, the selectivityand sensitivity of the single-trial FRA was comparable to thatgenerated from the trial-averaged responses, although morevariable. Indeed, the single-trial FRA had a “v-shaped” tuningprofile that is characteristic of FRAs that are generated throughsingle-unit and multiunit recordings and other techniques in A1(Pickles 1988; Polley et al. 2007; Storace et al. 2010). Threeadditional six-trial FRAs (Fig. 4, A–C) and their correspondingsingle trial-averaged FRAs (Fig. 4, D–F) show the samerelationship.
Next, we compared the cortical position maps and values forBFs obtained from single- vs. six-trial-average FRAs. Wecalculated BF from each statistically significant FRA (seeMATERIALS AND METHODS), where BF was defined as the center ofmass of the FRA at a given SPL (e.g., 65 dB). BF maps weregenerated by plotting the measured BF as a function of eachelectrode site’s center location. As shown, there is a highcorrespondence between single-trial (Fig. 4G) and six-trial-averaged BF maps (Fig. 4H). Indeed, when we plotted, on asite-by-site basis, the trial-averaged BF against the single-trialBF, we found that they were highly correlated (Fig. 4I; r 0.95 � 0.01, mean � SE; average of all cases, r 0.92 �0.02, mean � SE). Thus frequency organization can be quicklyand accurately derived with the active �ECoG array with aslittle as one response trial with a 13.5-s total acquisition time toprobe responses to 45 frequencies at 1 sound level with aninterstimulus interval of 300 ms.
A Comparison Between the Frequency Organization of theAuditory Cortex as Assessed with �ECoG Arrays, and IOI
An orderly spatial organization and correspondence is ob-served between multiunit and IOI metrics of BF responses totone pips (Kalatsky et al. 2005; Polley et al. 2007). Here, weexamined whether a similar correspondence existed betweenIOI- and active �ECoG-derived responses; we chose to com-pare array activity with Fourier optical-imaging data because,like the �ECoG-array data, it facilitates simultaneous obser-vation across large regions of cortex and is a “gold” standardtechnique for large-scale recordings of neural response relatedactivity (Higgins et al. 2010; Kalatsky et al. 2005).
IOI and active-�ECoG-array activity were recorded fromthe same cortical positions. The IOI, the surface vasculature,and the corresponding locations of the electrode sites of thecustom active �ECoG array (dots) are illustrated for oneanimal (Fig. 5A). Figure 5A shows the spatial distribution ofIOI BF over a large region (4.6 mm � 4.6 mm) of the auditorycortex that included three tone-frequency response minima(Fig. 5A, “Low”) and BF gradient reversal between A1 and
Innovative Methodology
1571A �ECoG ARRAY FOR RECORDING AUDITORY ACTIVITY
J Neurophysiol • doi:10.1152/jn.00179.2013 • www.jn.org
on Septem
ber 17, 2014D
ownloaded from
AAF, VAF and SRAF, SRAF and AAF. Recording sitescovering AAF (Fig. 5A, AAF, white dots) were removed fordata analysis, as they were not recorded with �ECoG arrays inall animals. The region of interest in auditory cortex includedA1, the region dorsal to A1, and VAF, which were defined bythe reversals and directions of optical BF gradient, as describedpreviously (Higgins et al. 2010). Figure 5B plots BF positionmap for A1, the area dorsal to A1, and VAF. Figure 5C plotsthe same position map for FRA BF as derived through thecustom active �ECoG recording array. For both the optical andactive �ECoG derived data, BFs progressed from low to highalong the caudorostral axis in all three tested animals.
Next, we quantified the degree of correspondence betweenthe optical and �ECoG FRA BFs. For the example animalshown in Fig. 5, there was a high correspondence betweenthe optical and custom active-�ECoG BFs (Fig. 5D; optical BFvs. active �ECoG BF: r 0.73 � 0.06, P � 0.05). There wasalso a significant correlation when we considered all threetested animals (optical BF vs. �ECoG BF: r 0.64 � 0.04,P � 0.05).
In three additional animals, we recorded IOI and �ECoG re-sponses with conventional passive electrode arrays (NeuroNexus) tocompare responses to those derived from our custom active�ECoG arrays. Figure 6A is a photograph of the surfacevasculature, and the surface positioning of the passive arrayfor one animal. Thirty-two simultaneously recorded six-
trial-averaged FRAs obtained from the array in this animalare shown (Fig. 6B). Like our custom active �ECoG array(Figs. 3 and 4), many of these FRAs had a characteristicv-shaped tuning profile (Pickles 1988; Polley et al. 2007;Storace et al. 2010).
An overlay of an IOI, surface vasculature and the passivearray center positions (Fig. 7A) illustrates where BF estimateswere obtained in this same animal as shown in Fig. 6. Again,the IOI revealed three frequency-response minima (Fig. 7A,“Low”) and BF gradient reversals between A1 and AAF, VAFand SRAF, SRAF and AAF. Figure 7B plots the position mapsof BF estimated from IOI for the region covered by the passivearray that included A1, area dorsal to A1 and VAF. Again, wefound that BFs progressed from low to high along the cau-dorostral axis with data from the IOI (Fig. 7B) and from thepassive array (Fig. 7C). IOI and passive �ECoG BFs weresignificantly correlated (Fig. 7D; optical BF vs. �ECoG BF:r 0.60 � 0.12, P � 0.05; average across all animals, r 0.58 � 0.22).
We found two key differences between our custom active�ECoG arrays and the conventional passive arrays as evidentby comparing two examples (Figs. 5 and 7). First, unlike ouractive �ECoG arrays in which there was a roughly one-to-onecorrespondence between the optical BF and the �ECoG BF(average difference between the optical and array BFs 0.03 � 0.05 octave, P � 0.05; e.g., Fig. 5D), BFs for the
Fig. 2. Topographic distribution of fre-quency response areas (FRAs) derived from�ECoG activity. A1: topographic organiza-tion of the FRAs generated from each re-cording site on the array. Each square de-marcates the relative location of each elec-trode and the FRA generated from the neuralactivity recorded at that site. For each FRA,frequency in kHz is plotted on the x-axis,and sound pressure level (SPL; dB) is plot-ted on the y-axis. Red regions indicate fre-quency-sound level combinations that elic-ited neural activity that was above baselineactivity; see color bar. Note that all of theFRAs are normalized relative to the site withthe maximum response using a commonscale as the number of SDs above the base-line voltage of each recording site. Blueregions indicate frequency-sound level com-binations that elicited neural activity thatwas at or near the baseline. A, B, and C: threeFRAs were selected to illustrate the variabil-ity in tuning properties observed with the�ECoG array. The respective panel letterdenotes the topographic location of each ofthese FRA within the �ECoG array (A1).SD, standard deviation.
Innovative Methodology
1572 A �ECoG ARRAY FOR RECORDING AUDITORY ACTIVITY
J Neurophysiol • doi:10.1152/jn.00179.2013 • www.jn.org
on Septem
ber 17, 2014D
ownloaded from

conventional arrays were positively biased (average differencebetween the optical and array BFs 0.2 � 0.04 octave, P �0.01; e.g., Fig. 7D). A second difference we observed wasthat the active �ECoG array represented a continuous fullrange of BF responses between 2 and 32 kHz, whereas thepassive array represented a less continuous (compressed)and truncated range of BFs between 3 and 10 kHz (compareFigs. 5C and 7C).
Change in Frequency BW with Sound Level
The active-�ECoG-array responses were resolved enoughto reveal a systematic relationship between BF and BW asdescribed previously for multiunit recordings in auditorycortex. Data from one animal illustrate how the active-�ECoG-array BW followed an inverted “U-shaped” BW vs.BF function (Fig. 8), similar to that reported for spike-rate-based FRAs in rat A1 (Funamizu et al. 2013; Miyakawa etal. 2013). The BW organization and BF vs. BW relationshippersisted at the two highest average sound levels (75 and85 dB).
Comparisons between the passive vs. active electrode re-cordings revealed differences in observed BW range and leveldependence. For this comparison, FRAs were selected from AIidentified sites, and the data were randomly resampled so thatBFs of the active and passive arrays were equally distributed
(following a uniform distribution between 2.3 and 16 kHz).FRAs were more narrowly tuned, BWs were less sound-leveldependent, and the range of BWs was compressed for theconventional passive (Fig. 9, gray line) vs. custom active�ECoG array (Fig. 9, black line). Specifically, across allmeasured sound levels, the BWs of the custom array FRAswere significantly (P � 0.001, rank-sum test) higher than thoseof the conventional array. Furthermore, the custom �ECoGarray BWs increased systematically with sound level (Fig. 9,black line), as previously observed with multiunit spike rateresponses in auditory cortex (Pickles 1988; Polley et al. 2007;Storace et al. 2010). The conventional array FRAs by compar-ison were much more level invariant (Fig. 9, gray line). Thiswas true even though the cortical regions and BFs ranges werematched for both arrays (BFs were uniformly distributed be-tween 2.3 and 16 kHz).
Overall, the frequency organization of the auditory cortexcan be readily measured with the high-density active�ECoG arrays proposed here (Fig. 5), as well as the moreconventional passive arrays (Fig. 7). However, only ouractive �ECoG array had a frequency resolution comparablewith that of high-resolution IOI and multiunit spike raterecordings. In contrast, the passive conventional array didnot yield a veridical representation of tonotopy, and BFswere positively biased, relative to IOI. Furthermore, pas-
Fig. 3. Reliability of single-trial and tri-al-averaged �ECoG responses from asingle electrode site on the active�ECoG array. A: single-trial �ECoGvoltage response traces to single tonepips at each frequency (x-axis) andsound level (y-axis) combination. B:trial-averaged �ECoG voltage re-sponse traces that were generated fromsix tone pip presentations at each leveland frequency combination. Like A,these data are organized as a functionof frequency (x-axis) and sound level(y-axis). C and D: the FRAs generatedfrom the single-trial and trial-averaged�ECoG responses, respectively. Thecolor bar indicates measured peak-to-peak voltage from the recorded voltagetraces in A and B.
Innovative Methodology
1573A �ECoG ARRAY FOR RECORDING AUDITORY ACTIVITY
J Neurophysiol • doi:10.1152/jn.00179.2013 • www.jn.org
on Septem
ber 17, 2014D
ownloaded from

sive-�ECoG-array BWs were narrower and less level de-pendent. These differences in the measured neural responseorganization presumably stem from properties of the array;however, the present study cannot determine the source ofsuch differences conclusively.
Measuring Spectrotemporal Sensitivities with the Active�ECoG Array
The �ECoG STRF was computed to determine whether ouractive �ECoG array could record the temporally precise,phase-locked responses that are characteristic of single andmultiunit responses in A1 (Atencio and Schreiner 2012;Norena et al. 2008). This �ECoG STRF was computed todetermine what components of the DMR sound drove tempo-rally precise (i.e., phase-locked) surface cortical responses.Each recording site’s �ECoG-derived STRF was computed bycross-correlating the �ECoG-derived signal with the DMRstimulus (see MATERIALS AND METHODS). As seen in Figs. 10 and11, the �ECoG STRFs exhibited an on-off temporal responsepattern (Fig. 10A, red-blue areas) that is typical of single- andmultiunit cortical STRFs, as well as STRFs generated withsubdural �ECoG arrays (deCharms et al. 1998; DePireux et al.2001; Eggermont et al. 1981; Escabí and Read 2003; Escabíand Schreiner 2002; Fritz et al. 2003; Linden et al. 2003;Machens et al. 2004; Miller et al. 2002; Pasley et al. 2012).
An exemplar case illustrates the spatial organization of thesignificant �ECoG-derived STRFs (Fig. 10A) and their corre-sponding BF (Fig. 10B) and reliability (Fig. 10C) indexes. Theregion corresponding to A1 (Fig. 10, B and C, black outlined
area) has directional components in the caudorostral and ven-tral-dorsal anatomic axes, as is characteristic of multiunitand IOI responses in A1 (Higgins et al. 2010). In A1, theSTRF BFs ranged from 2 to 32 kHz (Fig. 10C, blackoutlined area) and were topographically organized alongthe same anatomic axis as the tone-evoked BFs measured inthe same animal (e.g., Fig. 5, B and C). Position maps of thereliability and BF indexes indicate that the cortical regiondorsal to A1 had the highest STRF reliability and BFs (Fig.10, B and C, red areas). This high-BF dominated region wasnot evident in the tone evoked BF estimated from the IOI(Fig. 5A) or the active �ECoG (Fig. 5B). There were fewsignificant STRFs in the region below A1 corresponding toVAF (Fig. 10B, ventral to black outline). In contrast, therewere significant tone evoked active �ECoG FRAs in VAF inthis animal (Figs. 2 and 5C). Together, these observationsindicate that cortical responses to dynamically modulatedsound are temporally precise (and phase-locked) in A1 andin the dorsal area but not in VAF.
As an objective criterion for determining the response reli-ability, we estimated the significance of each STRF (bootstraptest, P � 0.001; see MATERIALS AND METHODS). For the BF datashown in Fig. 10A, 38% (75/196) of the recording sites had aSTRF with a significant RI (P � 0.01; colored squares in Fig.10B) with the most reliable sites clustered on the dorsal aspectof the array. Nonsignificant recording sites (white; Fig. 10B) inall areas, including VAF, might have produced change inactivity that was not temporally phase-locked with the auditorystimulus.
Fig. 4. High correspondence between thebest frequencies (BFs) of single-trial FRAsand trial-averaged FRAs. Three examples ofsingle-trial FRAs (A–C) are shown with theircorresponding trial-averaged FRAs (D–F).For these plots, color indicates the maximumpeak-to-peak voltage: blue indicates 0 V,and dark red indicates the highest peak-to-peak voltage observed for that particularelectrode site. A map of BF that was gener-ated from the single-trial FRA data (trialnumber 3) at each electrode site is shown inG, whereas the trial-averaged map of BF isshown in H. The color bar between G and Hindicates the frequency scale (kHz) of thesetwo BF maps. I: the site-by-site correlation(r 0.95 � 0.01, mean � SE) between thesingle-trial BF and the trial-averaged BF forsignificant FRAs obtained from this animal;the gray line is the line of unity. Data fromthis same animal are shown in Fig. 8.
Innovative Methodology
1574 A �ECoG ARRAY FOR RECORDING AUDITORY ACTIVITY
J Neurophysiol • doi:10.1152/jn.00179.2013 • www.jn.org
on Septem
ber 17, 2014D
ownloaded from

Sensitivity and the Spatial Organization of Spectral andTemporal Strf Parameters
Next, we tested several spectrotemporal acoustic features ofthe �ECoG STRF (see MATERIALS AND METHODS for details onhow these features were calculated). Two points are apparentfrom the example STRFs that are shown in Fig. 11. First, somesites were narrowly tuned and responded most robustly to asingle frequency (i.e., dark red regions in Fig. 11, A, D, and E).In contrast, other sites were more broadly tuned and respondedin a phase-locked manner to multiple discrete frequencies (seemultiple red regions in Fig. 11, B, C, and F). Second, almost all ofthe STRFs had “on-off” profiles (Fig. 11, A–F). That is, the�ECoG STRFs had inhibitory/suppressive regions (blue regionsin Figs. 10A and 11, A–F) that were temporally delayed withrespect to the fast excitation (red regions). Because most STRFshad similar temporal properties, the variability of temporal-mod-ulation sensitivity across the array was relatively small.
Several spectrotemporal features of the STRF were systemati-cally organized within and across the area corresponding to A1(e.g., Fig. 12). For example, two STRF parameters that variedsystematically in the auditory cortex were BW and best-spectralmodulation. The STRF BW represents the range of frequenciesthat produced phase-locked responses to a sound. The best-spectral modulation was a site’s preference for the frequencyspacing between the peaks and valleys in the sound spectrum(units of cycles/octave). This parameter is analogous to a visualneuron’s sensitivity to the spatial frequency of a visual grating. InA1, BW increased and best spectral modulations changed mini-mally along BF gradient axis (Fig. 12, A and B, respectively, black
outlined area). Summary data from all three animals illustratessystematic variations in spectrotemporal features of the STRF. BFwas positively correlated with BW [Fig. 13A; log10(BF) vs.log10(BW), r 0.83 � 0.02 (mean � SE), P � 0.01]. Aninverted “U” relationship was observed for BF vs. BW plotted inoctaves (Fig. 13B). In contrast, BW was negatively correlatedwith the best spectral modulation [Fig. 13C; r �0.64 � 0.04(mean � SE), P � 0.01]. Sites dorsal to A1 and a few sites ventralto A1 had significant STRFs, narrow BWs and high spectralmodulations, consistent with the observation of high BFs in theseregions (e.g., Fig. 12, A and B, sites outside of the black-outlinedarea).
We found that one temporal feature of the STRFs, inparticular, response delay, was also systematically organized.Response delay corresponds to the time of the STRF maximumamplitude. Response delay decreased along the BF gradientaxis of A1 (Fig. 12C); consequently, BF and delay werenegatively correlated [Fig. 13D; r �0.47 � 0.07 (mean �SE), P � 0.01]. The regions dorsal to A1 had primarily highBFs and short delays. The best-temporal modulation, anothertemporal feature of the STRF, was a recording site’s preferredrate for changes in stimulus power per unit time (Fig. 12D).Unlike the other three parameters, there was little variability inthis parameter, and we could not identify any systematic spatialorganization.
As the BW of a system increases, the integration time shoulddecrease (Dorf and Bishop 1995). Here, we examined whetherthis principle holds for spectrotemporal features of the corticalSTRF. As expected (Fig. 13E), the integration time and tem-
Fig. 5. Correlation between FRAs generatedfrom intrinsic optical imaging (IOI) andcustom active-�ECoG-array recordings.A: composite image of the lateral surface ofa rat’s brain, including surface vasculatureand IOI responses to tone sequences; thecolor bar indicates the tone BF. The gray andblack dots indicate the locations of eachelectrode of the array: black dots indicatethose electrodes that overlapped with theprimary auditory cortex plus the area dorsalto primary (A1) (labeled A1) and ventralauditory field (VAF), as defined by IOI.Scale bars indicate 500 �m, dorsal (D) andventral (V) anatomic axes. B and C: the BFmaps generated from IOI and �ECoG FRAdata, respectively. The IOI BF was averagedover a spatial region corresponding to thespacing (i.e., 250 � 250 �m) between eachrecording site of the active �ECoG array.The color bars indicate the BF (kHz) of thesemaps. D: a significant (RESULTS) site-by-sitecorrelation between the BF values generatedfrom the �ECoG FRA and the IOI is ob-served. The dotted line is the line of unity.The white areas in B and C either wererecording sites that were not in the area ofinterest or were sites that did not have sta-tistically reliable BFs. The data shown inthis figure are the results from a singleanimal. Spectrotemporal response field(STRF) and STRF BF data for this sameanimal are shown in Fig. 10.
Innovative Methodology
1575A �ECoG ARRAY FOR RECORDING AUDITORY ACTIVITY
J Neurophysiol • doi:10.1152/jn.00179.2013 • www.jn.org
on Septem
ber 17, 2014D
ownloaded from

poral-modulation upper-cutoff frequencies were negativelycorrelated [r �0.36 � 0.07 (mean � SE), P � 0.01].Although temporal-filtering theories would predict a positivecorrelation between delay and integration time (Oppenheim etal. 1983), this relationship could not be identified in our dataset [Fig. 13F; r �0.06 � 0.06 (mean � SE), P � 0.05].
Functional Correlation
Another advantage afforded by large-scale temporally pre-cise array recordings is the ability to examine the correlationsin responses across distant cortical areas to determine func-
tional alignment and segregation of cortical networks. In ourfinal set of analyses, we calculated the pairwise correlation(both signal and noise correlation) between recording sites.Correlograms were calculated as a function of the spatialseparation between recordings sites and as a function of thedifference between the BF values of recording sites. Figure14A shows the median correlogram as a function of threedifferent spatial separations. Independent of their spatial sep-aration, the correlogram is characteristic of that seen in previ-ous studies (Eggermont 2000; Eggermont et al. 2011): a peakat a time lag of 0 ms with small peaks at longer time lags
Fig. 6. Topographic distribution of FRAs derived from commercially available passive �ECoG recordings. A: the lateral surface of a rat’s brain, including surfacevasculature and the passive NeuroNexus array positioned on the surface of the rat’s brain. Scale bars indicate 500 �m, D and R (rostral) indicate the anatomicaxes. The FRAs generated from this array are shown in B. Red regions indicate frequency-sound level combinations that elicited neural activity that was abovebaseline; see color bar. Blue regions indicate frequency-sound level combinations that elicited neural activity that was at baseline. Each FRA is normalizedrelative to the voltage values recorded at that electrode site. The FRAs are organized relative to the spatial position of each recording site on the array. The datashown in this figure are the results from a single animal.
Innovative Methodology
1576 A �ECoG ARRAY FOR RECORDING AUDITORY ACTIVITY
J Neurophysiol • doi:10.1152/jn.00179.2013 • www.jn.org
on Septem
ber 17, 2014D
ownloaded from

corresponding to spindling or the theta range of frequencies(Miller and Schreiner 2000). Nevertheless, as the spatial sep-aration increased, the peak value of the median correlogramdecreased. For example, for the data shown in Fig. 14A, thepeak-correlation value for nearby sites (i.e., 0–1 mm) was 0.2,whereas the peak-correlation value was �0.02 for sites thatwere separated by 1–2 mm. Interestingly, at the largest sepa-rations (�2 mm), the correlation became negative: peak-correlation values at 0 ms were approximately �0.05. For eachof three animals that we tested, the peak-correlation valuedecreased significantly [2-factor ANOVA (spatial separation �BF); main effect of spatial separation: rat 1, F(2,2297) 372;rat 2, F(2,4944) 909; F(2,5044) 2154; all P � 0.05] withincreasing spatial separation.
Because the auditory cortex is tonotopically organized, areasonable prediction would be that correlation between sitesshould decrease as a function of their spatial separation and thedifference between the BFs of their STRFs. However, becausethese two parameters do not covary perfectly, we directlytested the relationship between the peak-correlation value andBF difference (Fig. 14B). For sites whose BF differenceswere �3.0 octaves, we found the predicted relationshipbetween BF and correlation. That is, for sites that hadsimilar BFs (i.e., �0.5 octaves), the peak correlation wasrelatively large (�0.15). But, as the BF difference betweensites increased, the correlation decreased and eventuallybecame negative: for sites with BF differences between 0.5and 1.5 octaves, the correlation was �0.02, whereas forsites with BF differences between 1.5 and 3 octaves, the
correlation was approximately �0.02. This pattern did nothold at the most disparate sites (�3 octaves): the correlationflipped polarity and became positive (�0.02). For each ofthree animals that we tested, the peak-correlation value wassignificantly dependent [2-factor ANOVA (spatial separa-tion � BF); main effect of BF: rat 1, F(1,2997) 46; rat 2,F(1,4944) 196; F(1,5044) 396; all P � 0.05] on BF.
The functional relationship between spatial separation, BFdifference, and the peak-correlation value can be seen in Fig.14C. Similar to previous findings (Bao et al. 2003), at nearbysites, correlation values were highest for sites with the mostsimilar BFs. As the BF difference increased, the peak-correla-tion value maintained a similar pattern, although the peak-correlation value decreased. At intermediate separations (i.e.,1–2 mm), the peak-correlation value was small and indepen-dent of BF difference. At the largest separations (i.e., �2 mm),the relationship between BF difference and peak-correlationvalue was complex. Nevertheless, these peak-correlation val-ues tended to be larger than those seen at intermediate sepa-rations (i.e., 1–2 mm). Once again, for each of three animalsthat we tested, the peak-correlation value was significantlymodulated [2-factor ANOVA (spatial separation � BF); inter-action between spatial separation and BF: rat 1, F(2,1) 41;rat 2, F(2,1) 40; F(2,1) 24; all P � 0.05] by both spatialseparation and BF difference.
Finally, because the electrodes along the columns and rowsdifferentially transmitted information (i.e., the column elec-trodes had signals that were multiplexed together, whereasthose along the rows transmitted signals on independent wires),
Fig. 7. Correlation between FRAs obtainedfrom IOI and conventional passive �ECoGrecording. A: composite image of the lateralsurface of a rat’s brain, including surfacevasculature and IOI response to tone se-quences; the color bar indicates the tone BF.The gray and white dots indicate the loca-tions of each electrode of the array: blackdots indicate those electrodes that over-lapped with the primary auditory cortex andthe area dorsal to A1 (all labeled A1) andVAF, as defined by the IOI. B and C: the BFmaps generated from IOI and �ECoG FRAdata, respectively. The optical BF was aver-aged over a spatial region corresponding tothe spacing (i.e., 300 � 300 �m) betweeneach recording site of the passive �ECoGarray. The color bar in B indicates the BF(kHz). D: a significant (RESULTS) site-by-sitecorrelation between the BF values generatedfrom the conventional passive �ECoG FRAand the IOI. The diagonal line is the line ofunity for comparison. The white areas in Band C either were recording sites that werenot in the area of interest, or were sites thatdid not have statistically reliable BFs. Thedata shown in this figure are the results froma single animal.
Innovative Methodology
1577A �ECoG ARRAY FOR RECORDING AUDITORY ACTIVITY
J Neurophysiol • doi:10.1152/jn.00179.2013 • www.jn.org
on Septem
ber 17, 2014D
ownloaded from

our correlation values might have depended on the transmis-sion route. To address this issue, we independently calculatedcorrelation data along a column of an array and independentlyalong a row of an array. We found that the distribution ofcorrelation values overlapped (P � 0.05; data not shown),which indicated that, on average, the method of transmissiondid not bias the neural correlations between the electrodes.
DISCUSSION
Our understanding of the large-scale population dynamics ofneural activity is not complete. This gap in our knowledge isdue, in part, to our inability to record simultaneously fromlarge regions of the auditory cortex with high spatial andtemporal resolution and large cortical area coverage. Althoughproviding important principles, previous single-unit and elec-trocortigraphical studies have been limited to simultaneousrecordings from fewer cortical sites (Eggermont et al. 2011;Mesgarani and Chang 2012; Ogawa et al. 2011; Owens et al.1995; Pasley et al. 2012; Takahashi et al. 2003). Large-scalerecordings have been obtained with intrinsic imaging; how-ever, these recordings reflect slow metabolic activity and nottemporally precise neural activity (Besle et al. 2011; Ebner andChen 1995). Finally, studies using voltage-sensitive dyes(Horikawa et al. 2001; Kubota et al. 2012; Sawatari et al. 2011)are limited because, whereas this technique allows for record-ings from large areas of the brain, current dyes have relativelypoor temporal resolution and signal-to-noise ratio. Here, wedemonstrated a new approach that is not invasive to corticaltissue and allows for large-scale mapping of sound-responseproperties with high spatial and temporal precision.
We found that the tone-frequency response organizationrevealed by our custom active �ECoG array was very similarto that revealed by IOI and substantially better than a conven-tional passive �ECoG array. This result validates our active�ECoG array as a reliable probe for assessing functionalproperties and organization of the auditory cortex. Moreover,we also found that our custom array was an appropriate probe
Fig. 8. Topographic organization and rela-tionship between BF and bandwidth (BW)measured with the custom �ECoG array. A1and A2: position maps for tone BF and BW,respectively, derived from the FRA obtainedat a sound level of 65 dB SPL. Scale barsindicate 500 �m, D and V anatomic axes.Color bars indicate range of values in allcorresponding maps. A3: an inverted “U-shaped” relationship is observed between BFvs. BW measured at each cortical site.B1–B3 and C1–C3 follow the same conven-tion as in A1–A3; however, data are obtainedat sound levels of 75 and 85 dB SPL, respec-tively. The data shown in this figure are theresults from a single animal, same animal asin Fig. 4.
Fig. 9. A comparison of the FRA BW selectivity between custom active andconventional passive �ECoG arrays. The median BW for each array is plottedas a function of sound level. Error bars indicate the standard error obtained viabootstrapping across measurements (MATERIALS AND METHODS). *Sound levelsin which the BWs of custom vs. conventional array responses were signifi-cantly different (P � 0.001; rank-sum test).
Innovative Methodology
1578 A �ECoG ARRAY FOR RECORDING AUDITORY ACTIVITY
J Neurophysiol • doi:10.1152/jn.00179.2013 • www.jn.org
on Septem
ber 17, 2014D
ownloaded from

to test the temporal precision of neural responses to moreethologically relevant dynamically modulated sounds.
In this study, we identified novel cortical-field differencesusing the active �ECoG array. First, the pure-tone BF re-sponses obtained with IOI and active-�ECoG methodologieswere correlated and had similar tonotopic organization over a
large cortical area, including A1, an area dorsal to A1 andVAF. Second, most sites in VAF lacked significant STRFs(e.g., Figs. 10 and 12), although the same sites exhibitedclearly defined responses to tones for both the IOI and �ECoGrecordings (Figs. 2 and 5). Together, these findings indicatethat A1 represents sound frequency with a high degree of
Fig. 10. Topographic distribution of STRFs and BFs derived from custom active-�ECoG-array responses. A: the topographic organization of STRFs that weregenerated from each recording site on the array. Each square demarcates the relative location of each electrode and the STRF that was generated from the neuralactivity recorded at that site. For each STRF, delay in milliseconds is plotted on the x-axis, and frequency in octaves is plotted on the y-axis. Blue regions indicateexcitatory voltage responses were temporally phase-locked with the auditory stimulus, whereas blue values indicate suppressive/inhibitory responses (see Fig.11 for typical STRF patterns). The color scale on all STRFs is normalized relative to the recording site with the strongest response. The reliability of each STRFis shown in B for each recording site. The value of each STRFs reliability is indicated by the color bar: STRFs with lowest reliability are blue, and those withhighest reliabilities are dark red. C: the topographic organization of BF. The BF from each recording site was calculated from the STRFs shown in A. The BFof each site is indicated by the color bar: sites with �1-kHz BFs are dark blue, and those with �32-kHz BFs are dark red. The data shown in this figure arethe results from a single animal. The pure-tone BF responses and various STRF response parameters for this animal are shown in Figs. 5 and 12, respectively.
Fig. 11. Examples of STRFs from the pri-mary auditory cortex. A–F: each panelshows a STRF generated from a differentrecording site. As indicated by the color bar,increasingly red regions indicate spectrotem-poral combinations in which the �ECoGsignal was increasing, whereas increasinglyblue regions indicate spectrotemporal com-binations in which the �ECoG signal was atdecreasing. For both, increases and de-creases were temporally phase-locked withthe auditory stimulus. The STRFs have beennormalized relative to the maximum values.
Innovative Methodology
1579A �ECoG ARRAY FOR RECORDING AUDITORY ACTIVITY
J Neurophysiol • doi:10.1152/jn.00179.2013 • www.jn.org
on Septem
ber 17, 2014D
ownloaded from

temporal precision and phase-locking to envelope modulations,whereas VAF represents sound frequency with a low degree oftemporal precision. This is consistent with reports of lowvector strength for multiunit VAF spike-rate responses toperiodically modulated sound sequences compared with A1 inthe rat (Engineer et al. 2014). These observations build on andare consistent with prior studies reporting slower response peak
latencies for VAF compared with A1 (Funamizu et al. 2013;Polley et al. 2007).
One possible explanation for these cortical-field differencesis that tone-based responses do not require the same level oftemporal precision and phase-locking as required for theSTRFs. STRFs reflect phase-locked neural activity to soundmodulations that requires substantially higher temporal re-
Fig. 12. Topographic organization of STRFparameters. A: the organization of STRF BWin units of octaves. B: the organization of thebest spectral modulation in units of Hertz/octave. C: the organization of response delayin units of milliseconds. D: the organizationof the best temporal modulation in Hertz.The color bar next to each panel indicatesthe respective range of values. See MATERI-ALS AND METHODS for details on how theseparameters were calculated. In each panel,the thick black line delineates the bordersof the primary auditory cortex and the VAF.The spatial orientation of the data in B–D isthe same as that shown in A. The data shownin this figure are the results from a singleanimal. The boundaries between the primaryauditory cortex and the VAF were deter-mined by the direction of the BF gradients inthe optical image, as described previously(Higgins et al. 2010).
Fig. 13. Correlation between STRF parameters. The correlations between different A–F: STRF parameters are shown in each of the panels. Each symbol in eachgraph represents the data value (e.g., BF and BW for A) generated from the STRF at a single recording site. The different symbols (circle, triangle, and cross)represent data from different animals.
Innovative Methodology
1580 A �ECoG ARRAY FOR RECORDING AUDITORY ACTIVITY
J Neurophysiol • doi:10.1152/jn.00179.2013 • www.jn.org
on Septem
ber 17, 2014D
ownloaded from

sponse precision to produce significant response fields. As seenfrom Fig. 10, STRF (phase-locking) reliability varied acrossthe dorsal-to-ventral axis, such that sites in A1 were the mostreliable, whereas sites in VAF had low reliability and insignif-icant STRFs. Such a difference could in theory be due to lowerresponse amplitudes for tone vs. DMR STRFs (Pienkowski andEggermont 2011). Because reliable tone FRAs were elicited inVAF, the lack of STRFs in this region cannot be triviallyattributed to a lack of responsiveness. Instead, the differencesmay be due to poorer response-timing precision and/or reli-ability of these ventral sites. Indeed, STRF reliability washighest in the region dorsal to A1 but lowest on average inVAF. This dorsal-ventral difference may have important func-tional consequences: A1 and the dorsal area may employ arobust timing code, whereas VAF may transmit informationthrough slower changes in firing rate.
The recording array and reconstructed STRFs resolved dis-tinct neurophysiological responses across neighboring record-ing sites, as evident from differences in receptive fields innearby recording sites. �ECoG STRFs and intrinsic metabolicresponses measured at the same cortical sites had similar BFsand topographic organization (Fig. 5). Prior current sourcedensity analyses find the largest local field potential responsesto dynamic sounds reside within the thalamic input layers ofauditory cortex (Szymanski et al. 2011). Although we cannotdetermine the primary source of the �ECoG STRF responsesin the present study, the spatial resolution and organization of�ECoG responses in the auditory cortex is consistent with thatobserved with local field potential responses to pure tones anddynamic sounds (Eggermont et al. 2011; Ohl et al. 2000).
Several spectral and temporal features of the �ECoG STRFchanged systematically with BF (Figs. 12 and 13), as predictedfrom previous single and multiunit studies (Atencio andSchreiner 2012; Cheung et al. 2001; Eggermont et al. 2011)and subcortical stations of the auditory pathway (Rodriguez etal. 2010a, 2010b). Our study builds on these prior studiesbecause we demonstrated that reliable, phase-locked responsesto sound features can be generated from �ECoG-level signals.
Sensory-driven response-feature correlations are more likelyto occur between neurons and regions with similar responseproperties (Atencio and Schreiner 2010; deCharms and Mer-zenich 1996; Tomita and Eggermont 2005) that are also con-nected by short- and long-range corticocortical connections(Chisum and Fitzpatrick 2004; Read et al. 2001). Accordingly,in the auditory cortex, neighboring neurons and neurons lo-cated more than 1 mm away that have similar BFs (within �1⁄3 octave) are anatomically connected (Read et al. 2001). Ourapproach allowed us to test the response correlation betweenelectrode sites across a large range of cortical positions coveredby the recording array. As indicated with other methodologies,by far the strongest correlations occurred between neighboringcortical positions with similar BFs (Fig. 14). However, consis-tent with previous studies (Brosch and Schreiner 1999; Egg-ermont 2000), we also found that relatively high correlationsoccurred between positions separated by large distances, andthese were not restricted to sites with similar BFs. Thesecorrelations were likely driven by higher-order receptive-fieldproperties other than BF (Brosch and Schreiner 1999) andmay underlie the ensemble or population coding needed tocreate unified perceptual representations of auditory stimuli
Fig. 14. The pairwise correlation between recordingsites was dependent on their spatial separation andthe difference between the STRF BFs for each site.A: the median cross-correlation functions as a func-tion of the spatial separation between recordingsites. B: the median cross-correlation functions as afunction of the BF difference. C: the interdepen-dence between spatial separation and BF difference.In each plot, the spatial separation is held constant,whereas the cross-correlation functions are plottedas a function of BF difference. See B for the colorcode of BF difference. For all of the panels, eachcross-correlation function represents the medianfunction that was calculated from the subset ofrecording sites that had significant STRFs for eachcombination of spatial separation and BF difference.The data shown in this figure are the results from asingle animal.
Innovative Methodology
1581A �ECoG ARRAY FOR RECORDING AUDITORY ACTIVITY
J Neurophysiol • doi:10.1152/jn.00179.2013 • www.jn.org
on Septem
ber 17, 2014D
ownloaded from
(deCharms and Merzenich 1996; Eggermont 1997; 2000;Griffiths and Warren 2004; King and Nelken 2009).
Compared with IOI, our active �ECoG arrays have compa-rable spatial resolution over a large recording area (Fig. 5).However, unlike IOI, which reflects slow metabolic activity(Besle et al. 2011; Ebner and Chen 1995), the arrays measureneural signals on short time scales and can be used to assessprecise timing of stimulus-response functions (i.e., STRFs;Figs. 10–13) or precisely correlated network activity (Fig. 14).As demonstrated, our custom active �ECoG array offers betterspatial selectivity (compare Figs. 5 and 7) and thus producesmore accurate sensory maps over a larger recording area thancurrently available passive �ECoG technologies. Furthermore,unlike IOI, which requires tens of minutes of neural dataacquisition to measure BF organization at a single sound level,cortical BF organization can be derived rapidly with a singleresponse trial of the active �ECoG array (Figs. 3 and 4; 13.5-sacquisition time for one sound level), allowing measurementsof cortical organization at multiple sound levels in as littleas 1.5 min.
Overall, this study indicated the promising future for using�ECoG micro-fabricated flexible arrays to reveal new princi-ples of auditory organization in the cortex. Whereas there aresome potential disadvantages of this approach, including po-tentially higher cost and increased computational burden foranalysis, these obstacles can be overcome. Reliable flexibleencapsulation of implanted active circuitry remains a challeng-ing area for future research that we are actively pursuing.
The current flexible electrode array was a product of recentadvances in materials science and micro-fabrication that allowactive circuitry to be built directly into a flexible substrate. Thisintimate integration allowed for a high-resolution interfacewith the cortical surface and ultimately will enable low-noiseamplification of signals from thousands of discrete electrodesto be recorded without requiring thousands of wires. Thespacing of this array, currently 1 electrode per 250 �m, can bereduced using more advanced semiconductor fabrication tech-niques and is essentially only limited by the available resolu-tion of the neural signals. In the future, it will be important todevelop novel coatings and materials to extend the deviceencapsulation lifetime to allow for long-term chronic record-ings. The current version of this array minimizes the interfacewires (i.e., 29) to record high-fidelity signals from 196 elec-trodes and, therefore, is the first necessary step to adapt thesearrays for future chronic implantation and continuous record-ing in freely behaving animals in future studies.
ACKNOWLEDGMENTS
We thank Heather Hersh for helpful comments on the preparation of thismanuscript.
GRANTS
This research was supported by grants from the National Institute onDeafness and Other Communications Disorders and Boucai Hearing Restora-tion Fund to Y. E. Cohen. This material is based upon work supported by theNational Science Foundation under grant DMI-0328162 and the US Depart-ment of Energy, Division of Materials Sciences under Award No. DE-FG02-07ER46471, through the Materials Research Laboratory and Center for Mi-croanalysis of Materials (DE-FG02-07ER46453) at the University of Illinois atUrbana-Champaign. J. A. Rogers acknowledges a National Security Scienceand Engineering Faculty Fellowship. B. Litt is supported by National Institute
of Neurological Disorders and Stroke Grants (RO1-NS-041811, R01-NS-48598), the Dr. Michel and Mrs. Anna Mirowski Discovery Fund for EpilepsyResearch, and the Julie’s Hope Award from Citizens United for Research inEpilepsy (CURE). J. Viventi is supported by a Taking Flight Award fromCURE and NYU Wireless.
DISCLOSURES
No conflicts of interest, financial or otherwise, are declared by the author(s).
AUTHOR CONTRIBUTIONS
Author contributions: M.A.E., H.L.R., J.V., D.-H.K., N.C.H., D.S., Y.-S.K.,A.E.A., J.V.d.S., Y.H., M.L., J.W., J.A.R., B.L., and Y.E.C. conception anddesign of research; M.A.E., H.L.R., J.V., N.C.H., D.S., A.S.L., and Y.E.C.performed experiments; M.A.E., H.L.R., N.C.H., D.S., A.M.G., J.F.B., andM.C. analyzed data; M.A.E., H.L.R., N.C.H., D.S., and Y.E.C. interpretedresults of experiments; M.A.E., H.L.R., J.V., N.C.H., D.S., and Y.E.C. pre-pared figures; M.A.E., H.L.R., J.V., and Y.E.C. drafted manuscript; M.A.E.,H.L.R., J.V., D.-H.K., N.C.H., D.S., A.S.L., A.M.G., J.F.B., M.C., Y.-S.K.,A.E.A., J.V.d.S., Y.H., M.L., J.W., J.A.R., B.L., and Y.E.C. edited and revisedmanuscript; M.A.E., H.L.R., J.V., D.-H.K., N.C.H., D.S., A.S.L., A.M.G.,J.F.B., M.C., Y.-S.K., A.E.A., J.V.d.S., Y.H., M.L., J.W., J.A.R., B.L., andY.E.C. approved final version of manuscript.
REFERENCES
Atencio CA, Schreiner CE. Columnar connectivity and laminar processing incat primary auditory cortex. PLos One 3: e9521, 2010.
Atencio CA, Schreiner CE. Spectrotemporal processing in spectral tuningmodules of cat primary auditory cortex. PLos One 7: e3153, 2012.
Bao S, Chang EF, Davis JD, Gobeske KT, Merzenich MM. Progressivedegradation and subsequent refinement of acoustic representation in theadult auditory cortex. J Neurosci 23: 10765–10775, 2003.
Besle J, Schevon CA, Mehta AD, Lakatos P, Goodman RR, McKhannGM, Emerson RG, Schroeder CE. Tuning of the human neocortex to thetemporal dynamics of attended events. J Neurosci 31: 3176–3185, 2011.
Brosch M, Schreiner CE. Correlations between neural discharges are relatedto receptive field properties in cat primary auditory cortex. Eur J Neurosci11: 3517–3530, 1999.
Centanni TM, Booker AB, Sloan AM, Chen F, Maher BJ, Carraway RS,Khodaparast N, Rennaker R, Loturco JJ, Kilgard MP. Knockdown ofthe dyslexia-associated gene Kiaa0319 impairs temporal responses to speechstimuli in rat primary auditory cortex. Cereb Cortex 24: 1753–1766, 2014.
Cheung SW, Bedenbaugh PH, Nagarajan SS, Schreiner CE. Functionalorganization of squirrel monkey primary auditory cortex: reponses to puretones. J Neurophysiol 85: 1732–1749, 2001.
Chisum HJ, Fitzpatrick D. The contribution of vertical and horizontalconnections to the receptive field center and surround in V1. Neural Netw17: 681–693, 2004.
deCharms RC, Blake DT, Merzenich MM. Optimizing sound features forcortical neurons. Science 280: 1439–1444, 1998.
deCharms RC, Merzenich MM. Primary cortical representation of sounds bythe coordination of action-potential timing. Nature 381: 610–613, 1996.
DePireux DA, Simon JZ, Klein DJ, Shamma SA. Spectro-temporal responsefield characterization with dynamic ripples in ferret primary auditory cortex.J Neurophysiol 85: 1220–1234, 2001.
Dorf RC, Bishop RM. Modern Control Systems. Reading, MA: Addison-Wesley, 1995.
Doron NN, Ledoux JE, Semple MN. Redefining the tonotopic core of ratauditory cortex: physiological evidence for a posterior field. J Comp Neurol453: 345–360, 2002.
Ebner TJ, Chen G. Use of voltage-sensitive dyes and optical recordings in thecentral nervous system. Prog Neurobiol 46: 463–506, 1995.
Eggermont JJ. Firing rate and firing synchrony distinguish dynamic fromsteady state sound. Neuroreport 8: 2709–2713, 1997.
Eggermont JJ. Sound-induced synchronizaion of neural activity between andwithin three auditory cortical areas. J Neurophysiol 83: 2708–2722, 2000.
Eggermont JJ, Aertsen AM, Hermes DJ, Johannesma PI. Spectro-temporalcharacterization of auditory neurons: redundant or necessary? Hear Res 5:109–121, 1981.
Eggermont JJ, Munguia R, Pienkowski M, Shaw G. Comparison of LFP-based and spike-based spectro-temporal receptive fields and cross-correla-tion in cat primary auditory cortex. PLos One 6: e20046, 2011.
Innovative Methodology
1582 A �ECoG ARRAY FOR RECORDING AUDITORY ACTIVITY
J Neurophysiol • doi:10.1152/jn.00179.2013 • www.jn.org
on Septem
ber 17, 2014D
ownloaded from
Engineer CT, Centanni TM, Im KW, Borland MS, Moreno NA, CarrawayRS, Wilson LG, Kilgard MP. Degraded auditory processing in a rat modelof autism limits the speech representation in non-primary auditory cortex.Dev Neurobiol. In press, 2014.
Escabi MA, Higgins NC, Galaburda AM, Rosen GD, Read HL. Earlycortical damage in rat somatosensory cortex alters acoustic feature repre-sentation in primary auditory cortex. Neuroscience 150: 970–983, 2007.
Escabi MA, Read HL. Neural mechanisms for spectral analysis in theauditory midbrain, thalamus, and cortex. Int Rev Neurobiol 70: 207–252,2005.
Escabí MA, Read HL. Representation of spectrotemporal sound informationin the ascending auditory pathway. Biol Cybern 89: 350–362, 2003.
Escabí MA, Schreiner CE. Nonlinear spectrotemporal sound analysis byneurons in the auditory midbrain. J Neurosci 22: 4114–4131, 2002.
Fritz J, Shamma S, Elhilali M, Klein D. Rapid task-related plasticity ofspectrotemporal receptive fields in primary auditory cortex. Nat Neurosci 6:1216–1223, 2003.
Funamizu A, Kanzaki R, Takahashi H. Pre-attentive, context-specific rep-resentation of fear memory in the auditory cortex of rat. PLos One 8:e63655, 2013.
Geffen MN, Gervain J, Werker JF, Magnasco MO. Auditory perception ofself-similarity in water sounds. Front Integr Neurosci 5: 15, 2011.
Griffiths TD, Warren JD. What is an auditory object? Nat Rev Neurosci 5:887–892, 2004.
Higgins NC, Escabi MA, Rosen GD, Galaburda AM, Read HL. Spectralprocessing deficits in belt auditory cortex following early postnatal lesionsof somatosensory cortex. Neuroscience 153: 535–549, 2008.
Higgins NC, Storace DA, Escabi MA, Read HL. Specialization of binauralresponses in ventral auditory cortices. J Neurosci 30: 14522–14532, 2010.
Horikawa J, Hess A, Nasu M, Hosokawa Y, Scheich H, Taniguchi I.Optical imaging of neural activity in multiple auditory cortical fields ofguinea pigs. Neuroreport 12: 3335–3339, 2001.
Kalatsky VA, Polley DB, Merzenich MM, Schreiner CE, Stryker MP. Finefunctional organization of auditory cortex revealed by Fourier opticalimaging. Proc Natl Acad Sci U S A 102: 13325–13330, 2005.
Kalatsky VA, Stryker MP. New paradigm for optical imaging: temporallyencoded maps of intrinsic signal. Neuron 38: 529–545, 2003.
King AJ, Nelken I. Unraveling the principles of auditory cortical processing:can we learn from the visual system? Nat Neurosci 12: 698–701, 2009.
Kubota M, Miyamoto A, Hosokawa Y, Sugimoto S, Horikawa J. Spatio-temporal dynamics of neural activity related to auditory induction in the coreand belt fields of guinea-pig auditory cortex. Neuroreport 23: 474–478,2012.
Linden JF, Liu RC, Sahani M, Schreiner CE, Merzenich MM. Spectro-temporal structure of receptive fields in areas AI and AAF of mouse auditorycortex. J Neurophysiol 90: 2660–2675, 2003.
Machens CK, Wehr MS, Zador AM. Linearity of cortical receptive fieldsmeasured with natural sounds. J Neurosci 24: 1089–1100, 2004.
Mesgarani N, Chang EF. Selective cortical representation of attended speakerin multi-talker speech perception. Nature 485: 233–236, 2012.
Miller LM, Escabí MA, Read HL, Schreiner CE. Feature selectivity andinterneuronal cooperation in the thalamocortical system. J Neurosci 21:8136–8144, 2001.
Miller LM, Escabí MA, Read HL, Schreiner CE. Spectrotemporal receptivefields in the lemniscal auditory thalamus and cortex. J Neurophysiol 87:516–527, 2002.
Miller LM, Schreiner CE. Stimulus-based state control in the thalamocorticalsystem. J Neurosci 20: 7011–7016, 2000.
Miyakawa A, Gibboni R, Bao S. Repeated exposure to a tone transientlyalters spectral tuning bandwidth of neurons in the central nucleus of inferiorcolliculus in juvenile rats. Neuroscience 230: 114–120, 2013.
Norena A, Gourevitch B, Pienkowski M, Shaw G, Eggermont JJ. Increas-ing spectrotemporal sound density reveals an octave-based organization incat primary auditory cortex. J Neurosci 28: 8885–8896, 2008.
Ogawa T, Riera J, Goto T, Sumiyoshi A, Nonaka H, Jerbi K, Bertrand O,Kawashima R. Large-scale heterogeneous representation of sound attri-butes in rat primary auditory cortex: from unit activity to populationdynamics. J Neurosci 31: 14639–14653, 2011.
Ohl FW, Scheich H, Freeman WJ. Topographic analysis of epirduralpure-tone-evoked potentials in gerbil auditory cortex. J Neurophysiol 83:3123–3132, 2000.
Oppenheim AV, Willsky AS, Young IT. Signals and Systems. EnglewoodCliffs, NJ: Prentice-Hall, 1983.
Owens AL, Denison TJ, Versnel H, Rebbert M, Peckerar M, Shamma SA.Multi-electrode array for measuring evoked potentials from surface of ferretprimary auditory cortex. J Neurosci Methods 58: 209–220, 1995.
Pasley BN, David SV, Mesgarani N, Flinker A, Shamma S, Crone NE,Knight RT, Chang EF. Reconstructing speech from human auditory cortex.PLoS Biol 10: e1001251, 2012.
Pickles JO. An Introduction to the Physiology of Hearing. New York:Academic, 1988.
Pienkowski M, Eggermont JJ. Sound frequency representation in primaryauditory cortex is level tolerant for moderately loud, complex sounds. JNeurophysiol 106: 1016–1027, 2011.
Polley DB, Read HL, Storace DA, Merzenich MM. Multiparametric audi-tory receptive field organization across five cortical fields in the albino rat.J Neurophysiol 97: 3621–3638, 2007.
Qiu A, Schreiner CE, Escabí MA. Gabor analysis of auditory midbrainreceptive fields: spectro-temporal and binaural composition. J Neurophysiol90: 456–476, 2003.
Read HL, Winer JA, Schreiner CE. Modular organization of intrinsicconnections associated with spectral tuning in cat auditory cortex. Proc NatlAcad Sci U S A 98: 8042–8047, 2001.
Reimer A, Hubka P, Engel AK, Kral A. Fast propagating waves within therodent auditory cortex. Cereb Cortex 21: 166–177, 2011.
Rodriguez FA, Chen C, Read HL, Escabí MA. Neural modulation tuningcharacteristics scale to efficiently encode natural sound statistics. J Neurosci30: 15969–15980, 2010a.
Rodriguez FA, Read HL, Escabi MA. Spectral and temporal modulationtradeoff in the inferior colliculus. J Neurophysiol 103: 887–903, 2010b.
Rutkowski RG, Miasnikov AA, Weinberger NM. Characterisation of mul-tiple physiological fields within the anatomical core of rat auditory cortex.Hear Res 181: 116–130, 2003.
Sawatari H, Tanaka Y, Takemoto M, Nishimura M, Hasegawa K, SaitohK, Song WJ. Identification and characterization of an insular auditory fieldin mice. Eur J Neurosci 34: 1944–1952, 2011.
Storace DA, Higgins NC, Chikar JA, Oliver DL, Read HL. Gene expressionidentifies distinct ascending glutamatergic pathways to frequency-organizedauditory cortex in the rat brain. J Neurosci 32: 15759–15768, 2012.
Storace DA, Higgins NC, Read HL. Thalamic label patterns suggest primaryand ventral auditory fields are distinct core regions. J Comp Neurol 518:1630–1646, 2010.
Storace DA, Higgins NC, Read HL. Thalamocortical pathway specializationfor sound frequency resolution. J Comp Neurol 519: 177–193, 2011.
Szymanski FD, Rabinowitz NC, Magri C, Panzeri S, Schnupp JW. Thelaminar and temporal structure of stimulus information in the phase of fieldpotentials of auditory cortex. J Neurosci 31: 15787–15801, 2011.
Takahashi H, Ejiri T, Nakao M, Nakamura N, Kaga K, Herve T. Micro-electrode array on folding polyimide ribbon for epidural mapping of func-tional evoked potentials. IEEE Trans Biomed Eng 50: 510–516, 2003.
Takahashi H, Yokota R, Funamizu A, Kose H, Kanzaki R. Learning-stage-dependent, field-specific, map plasticity in the rat auditory cortex duringappetitive operant conditioning. Neuroscience 199: 243–258, 2011.
Tomita M, Eggermont JJ. Cross-correlation and joint spectro-temporalreceptive field properties in auditory cortex. J Neurophysiol 93: 378–392,2005.
Viventi J, Kim DH, Moss JD, Kim YS, Blanco JA, Annetta N, Hicks A,Xiao J, Huang Y, Callans DJ, Rogers JA, Litt B. A conformal, bio-interfaced class of silicon electronics for mapping cardiac electrophysiology.Sci Transl Med 2: 24ra22, 2010.
Viventi J, Kim DH, Vigeland L, Frechette ES, Blanco JA, Kim YS, AvrinAE, Tiruvadi VR, Hwang SW, Vanleer AC, Wulsin DF, Davis K, GelberCE, Palmer L, Van der Spiegel J, Wu J, Xiao J, Huang Y, Contreras D,Rogers JA, Litt B. Flexible, foldable, actively multiplexed, high-densityelectrode array for mapping brain activity in vivo. Nat Neurosci 14:1599–1605, 2011.
von der Behrens W, Bauerle P, Kossl M, and Gaese BH. Correlatingstimulus-specific adaptation of cortical neurons and local field potentials inthe awake rat. J Neurosci 29: 13837–13849, 2009.
Innovative Methodology
1583A �ECoG ARRAY FOR RECORDING AUDITORY ACTIVITY
J Neurophysiol • doi:10.1152/jn.00179.2013 • www.jn.org
on Septem
ber 17, 2014D
ownloaded from