a gold miner in the making - sabina back river · properties are forward looking information within...
TRANSCRIPT

A Gold Miner in the Making Corporate Presentation – February 2018
Goose Gold Project, Back River, Nunavut, Canada

Forward Looking Information Statements relating to our belief as to the timing of completion of the environmental assessment, the results of the final public hearings, the timing of
receipt of a project certificate and permits and the timing of the start of construction and the first gold pour, and the results of further optimization
studies to the feasibility study, the potential tonnage and grades and contents of deposits and the potential production from and viability of Sabina’s
properties are forward looking information within the meaning of securities legislation of certain Provinces in Canada. Forward looking information are
statements that are not historical facts and are generally, but not always identified by the words “expects,” “plans,” “anticipates,” “believes,” “intends,”
“estimates,” “projects,” “potential,” “opportunities,” and similar expressions, or that events or conditions “will,” “would.” “may,” “could,” or should occur.
The forward looking information is made of the date of this presentation. This forward looking information is subject to a variety of risks and
uncertainties which could cause actual events or results to differ materially from those reflected in the forward looking information, including, without
limitation: the effects of general economic conditions; changing foreign exchange rates; risks associated with exploration and project development; the
calculation of mineral resources and reserves; risks related to fluctuations in metal prices; uncertainties related to raising sufficient financing to fund the
planned work in a timely manner and on acceptable terms; changes in planned work arising from weather, logistical, technical or other factors; the
possibility that results of work will not fulfill expectations and realize the perceived potential of the Company’s properties; risk of accidents, equipment
breakdowns and labour disputes; access to project funding or other unanticipated difficulties or interruptions; the possibility of cost overruns or
unanticipated expenses in the work program; title matters; government regulation; obtaining and receiving necessary licenses and permits; the risk of
environmental contamination or damage resulting from Sabina’s operations and other risks and uncertainties including those described in Sabina’s
annual information form for the year ended December 31, 2016 available at www.sedar.com
Forward looking information is based on the beliefs, estimates and opinions of Sabina’s management on the date the statements are made. Sabina
undertakes no obligation to update the forward looking information should management’s beliefs, estimates or opinions, or other factors, change, except
as required by applicable law
2

SABINA – A GOLD MINER IN THE MAKING
80km long multi-generational mining district with embedded growth in a good jurisdiction
Will produce ~200k ounces Au/year
Robust at US$1150 gold and C$0.80 with a 24% after tax IRR
Capex is attainable - targeting gold production Q1/2021
Completed Environmental Assessment process – now in licensing
Strong government and community support – binding IIBA term sheet signed
Exceptional team
~C$94 million in cash and equivalents
Aggressive exploration drilling identified for 2018
A scarcity of gold and de-risked gold projects make Sabina one of the few highly leveraged undervalued opportunities
3

0
1
2
3
4
5
6
7
8
1998 2002 2007 2009 2010 2012 2015
Gold Resource Millions oz
Indicated Inferred
Back River – Deposits are Well Drilled , Well Understood and Open
4
Under Sabina
Ownership
*See mineral reserves and resources estimate slide 28 for details
Mineral Resource Estimate Oct/14 Tonnes (kt) Au (g/t) Metal (koz Au)
Measured 10,273 5.27 1,740
Indicated 17,969 6.22 3,593
Measured and Indicated 28,242 5.87 5,333
Inferred 7,750 7.43 1,851
Mineral Reserve Estimate Aug/15 Classification Tonnes (kt) Au (g/t) Au (koz)
Total Open Pit Proven 6,983 5.97 1,340
Probable 1,885 5.52 335
Total Underground Proven 20 9.52 6
Probable 3,471 7.37 822
Total Back River Property Proven 7,003 5.98 1,346
Probable 5,356 6.72 1,157
80% of open pit reserve is in Proven Category
1980’s & 90s 1997-2009 June 2009 2010-2014
George & Goose deposit discoveries
Project owned by Arauco, Kinross, Miramar & DPM
Project acquired by Sabina
+325% resource growth under Sabina

5
Evolving A Gold System – Goose Property (Initial Production Focus)
Llama – Umwelt – Goose Longitudinal Section
0 7km
-1000m
-500m
LLAMA UMWELT
525 m Llama Plunge
Extension
Growing a >5 Million Ounce Gold Trend
Open
Dif Target
Dif Target
Llama - Umwelt – Goose Mineralizing Trend: • Significant upside exploration potential. • Conversion and expansion potential. Unfolded Composite Long-section view looking north
Resource MI&I
GOOSE MAIN
Dif Target
Open Open Vault
GNS HACKLES ECHO KOGOYOK NUVUYAK
Open
Drill Target
Highly prospective for extending mine life and making new discoveries 5km of an 80km District
Current Mine Life ~ 12 years
LOM Gold Production 2.3M oz Au
M&I 5,333M oz Au
Inferred 1,851M oz Au
See QA/QC Slide 28

Back River Gold District DISTRICT OPPORTUNITY 100% OWNED BY SABINA
Significant extended production opportunities exist through:
Deposits not included in first mine plan (at both Goose and George)
Low risk resource conversion opportunities
Direct extensional potential for all deposits
Numerous blue sky brownfield targets
Continued greenfield and generative exploration future
Back River Property
80 Km
Kilometres
0 12.5 25
LEGEND
Inuit Owned Land
Camp
Area of Interest
Claim
Lease
Surface
Subsurface and Surface
George Project
Boot Boulder
Goose Project
Del
Bath
6
George Property Existing Mineral Resources:
Indicated 1.1m oz @ 5.6 g/t
Inferred 980k oz @ 6.32 g/t
Included in prior Feasibility ~600 k oz
Marine Lay Down Area (MLA)
Significant existing resources at George on 20km of largely unexplored iron formation offering opportunity for another mining complex on the Back River district
QA/QC Slide 27
Sabina Accomplishments in 2017 A positive Nunavut Impact Review Board Recommendation
Continued exploration success at Vault (Umwelt) and Llama deep
Continued de-risking of the Back River Project ($5m+ spent after feasibility – basic engineering completed)
A binding term sheet for long term land tenure and impact and benefits to the Kitikmeot Inuit Association
A positive Minister of Indigenous and Northern Affairs decision for the Back River Project to proceed to the next phase of licensing and filing of the Type A & B Water License applications
Receipt of the Back River Project certificate – EA process completed
Announcement of a strategic financing with Zhaojin at $2.65 per share for a total investment of approximately C$66,100,000
Out performed most peers
7

Significant Potential at Both Llama and Umwelt Underground
• Significant potential at both Umwelt and LLama.
• Parallel structures along 3 +km of strike
• High grade Vault Zone at Umwelt confirmed
• At Llama significant down plunge step outs identified underground potential and higher grade zone.
8

Significant Potential at Umwelt Underground Vault Zone
9
Highlight hole
ID
Length
(m)
Au (g/t)
11GSE075 24.4 13.43
11GSE106 29.85 10.91
12GSE217 17 49.24
17GSE511B 13.5 16.86
17GSE517 33.25 5.99
17GSE522B 31.90 8.65
True widths unknown
Vault zone is characterized by exceptional grades and widths

Permitting Progress 10
Project certificate issued December, 2017 completing the Environmental Assessment process
Type A and B water license and other applications submitted or being prepared
Type B enables pre-development and construction activities – Q1, 2018
Type A supersedes Type B enables all activities including operations – Q4, 2018
Environmental Assessment process completed – moving through licensing and permitting phase
Binding Term Sheet with Kitikmeot Inuit Association 1% NSR 20 year term 6.7 million shares – alignment as a shareholder Term sheet is in line with others in the territory for
economic benefits $4 million cash payment towards Regional Wealth
Creation. A new initiative for creating long term benefits to the region and jobs outside of the mining industry

Initial Project Feasibility Study Results BACK RIVER - SEPT 2015
*LOM All-In Cash Cost includes initial, sustaining and closure capital QA/QP (see slide 28)
Pre-Tax NPV(5%) & IRR C$699M / 28.2%
After-Tax NPV(5%) & IRR C$480M / 24.2%
Payback 2.9 years
Mill Throughput 3,000 tpd
Avg. Grade Processed 6.30 diluted g/t Au
Gold Recovery 93.0%
Mine Life 11.8 years
Avg. Production (Y1-8) 250,000 oz/year
Summary Results @US$1,150/oz Gold/ C$0.80 Exchange
Avg. LOM Production 198,000 oz/year
On-Site Op. Costs C$114.58/t milled
Total Cash Cost US$534/oz
All-In Sustaining Cost US$620/oz
LOM All-In Cash Cost* US$763/oz
Pre-Production Capital C$415M
Sustaining Capital C$185M
Closure Capital C$64M
11
February 15, 2018 spot Au and FX = CAD $1,691, IRR = 32%, NPV $734M (after-tax)
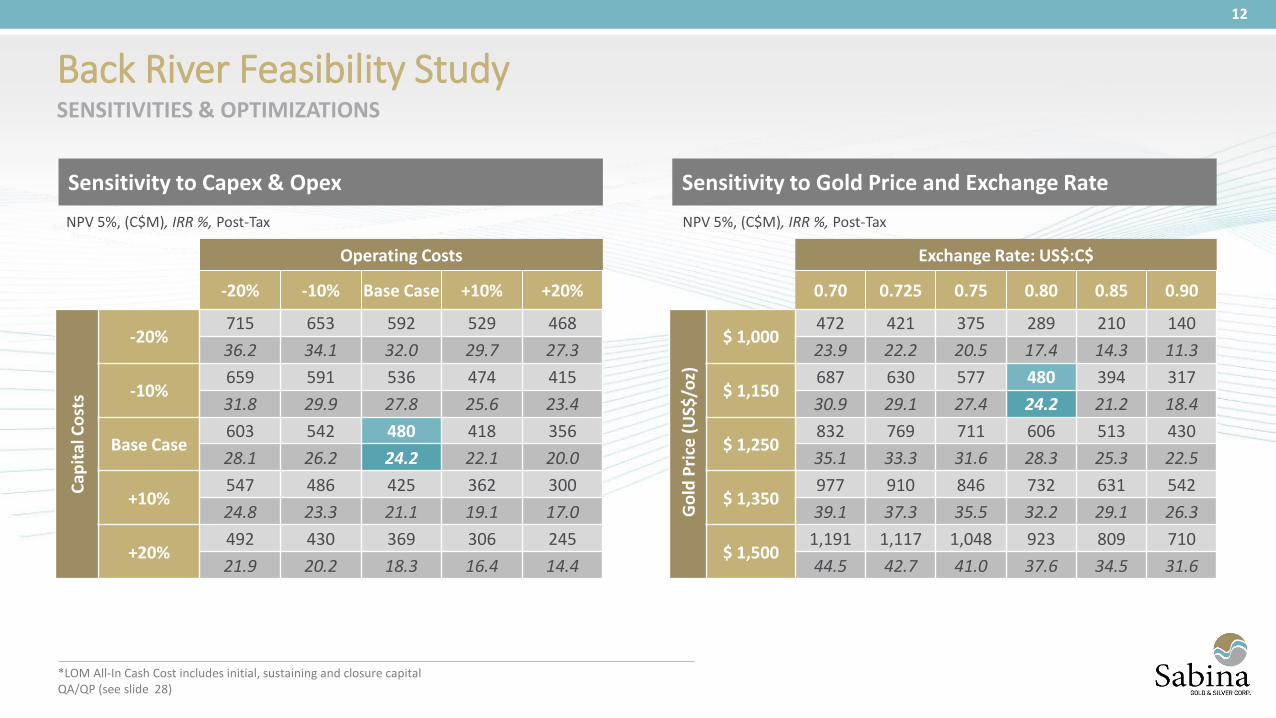
Sensitivity to Capex & Opex
Back River Feasibility Study SENSITIVITIES & OPTIMIZATIONS
*LOM All-In Cash Cost includes initial, sustaining and closure capital QA/QP (see slide 28)
Sensitivity to Gold Price and Exchange Rate
NPV 5%, (C$M), IRR %, Post-Tax
Operating Costs
-20% -10% Base Case +10% +20%
Cap
ital
Co
sts
-20% 715 653 592 529 468
36.2 34.1 32.0 29.7 27.3
-10% 659 591 536 474 415
31.8 29.9 27.8 25.6 23.4
Base Case 603 542 480 418 356
28.1 26.2 24.2 22.1 20.0
+10% 547 486 425 362 300
24.8 23.3 21.1 19.1 17.0
+20% 492 430 369 306 245
21.9 20.2 18.3 16.4 14.4
NPV 5%, (C$M), IRR %, Post-Tax
Exchange Rate: US$:C$
0.70 0.725 0.75 0.80 0.85 0.90
Go
ld P
rice
(U
S$/o
z)
$ 1,000 472 421 375 289 210 140
23.9 22.2 20.5 17.4 14.3 11.3
$ 1,150 687 630 577 480 394 317
30.9 29.1 27.4 24.2 21.2 18.4
$ 1,250 832 769 711 606 513 430
35.1 33.3 31.6 28.3 25.3 22.5
$ 1,350 977 910 846 732 631 542
39.1 37.3 35.5 32.2 29.1 26.3
$ 1,500 1,191 1,117 1,048 923 809 710
44.5 42.7 41.0 37.6 34.5 31.6
12
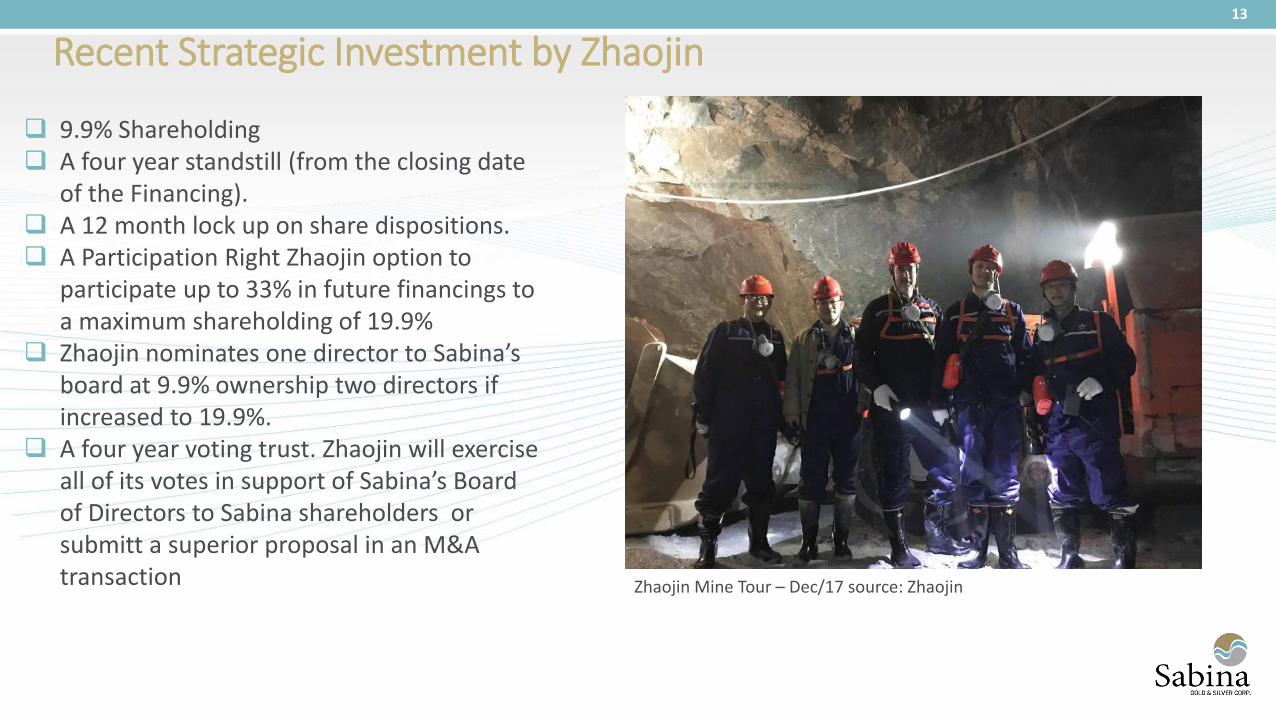
Recent Strategic Investment by Zhaojin 13
9.9% Shareholding A four year standstill (from the closing date
of the Financing). A 12 month lock up on share dispositions. A Participation Right Zhaojin option to
participate up to 33% in future financings to a maximum shareholding of 19.9%
Zhaojin nominates one director to Sabina’s board at 9.9% ownership two directors if increased to 19.9%.
A four year voting trust. Zhaojin will exercise all of its votes in support of Sabina’s Board of Directors to Sabina shareholders or submitt a superior proposal in an M&A transaction Zhaojin Mine Tour – Dec/17 source: Zhaojin

Project Financing Requirements / Sources
Sources and Uses Potential Debt/Equity (in Canadian Dollars)
Total Capital
(Includes Pre-production Capital, Working
Capital, Environmental Bonding, Financing
Costs)
$540m - $575m
Potential Debt Facility $344m – $375m
Potential Future Equity Requirements post
Zhaojin financing (includes initial investment
and potential future participations)
$ 80m – $115m
14
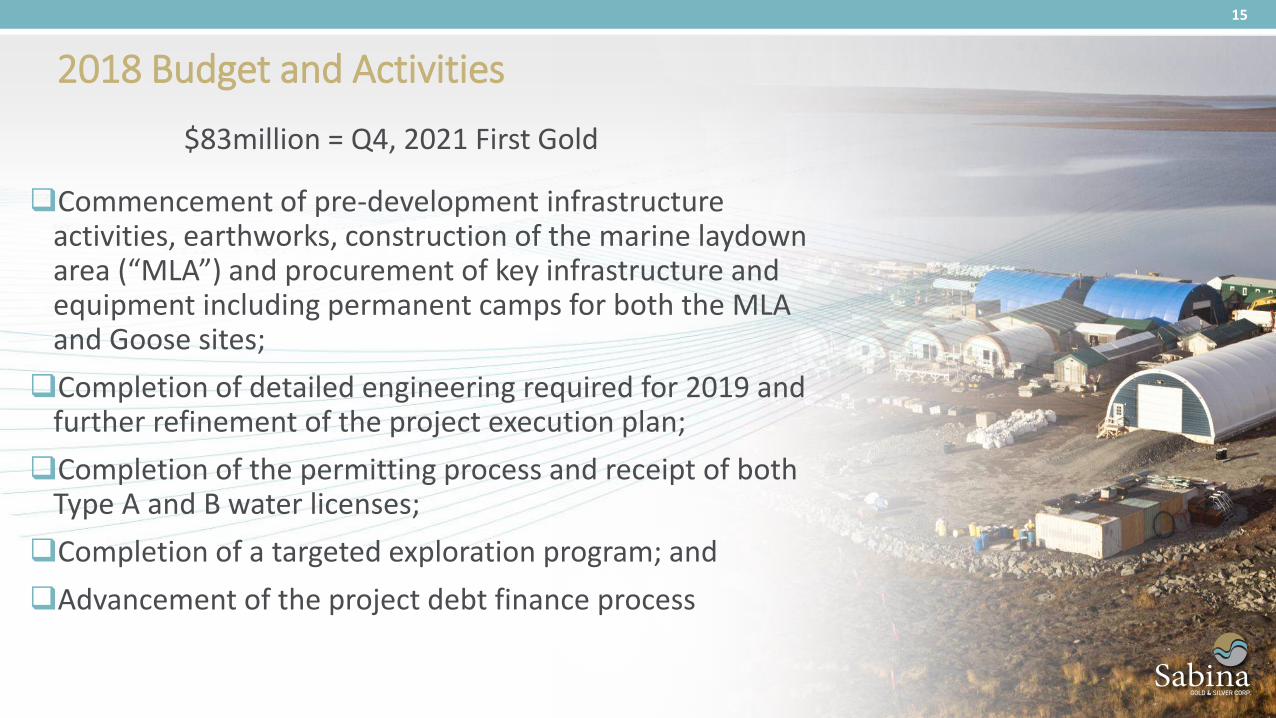
2018 Budget and Activities
15
Commencement of pre-development infrastructure activities, earthworks, construction of the marine laydown area (“MLA”) and procurement of key infrastructure and equipment including permanent camps for both the MLA and Goose sites;
Completion of detailed engineering required for 2019 and further refinement of the project execution plan;
Completion of the permitting process and receipt of both Type A and B water licenses;
Completion of a targeted exploration program; and
Advancement of the project debt finance process
$83million = Q4, 2021 First Gold
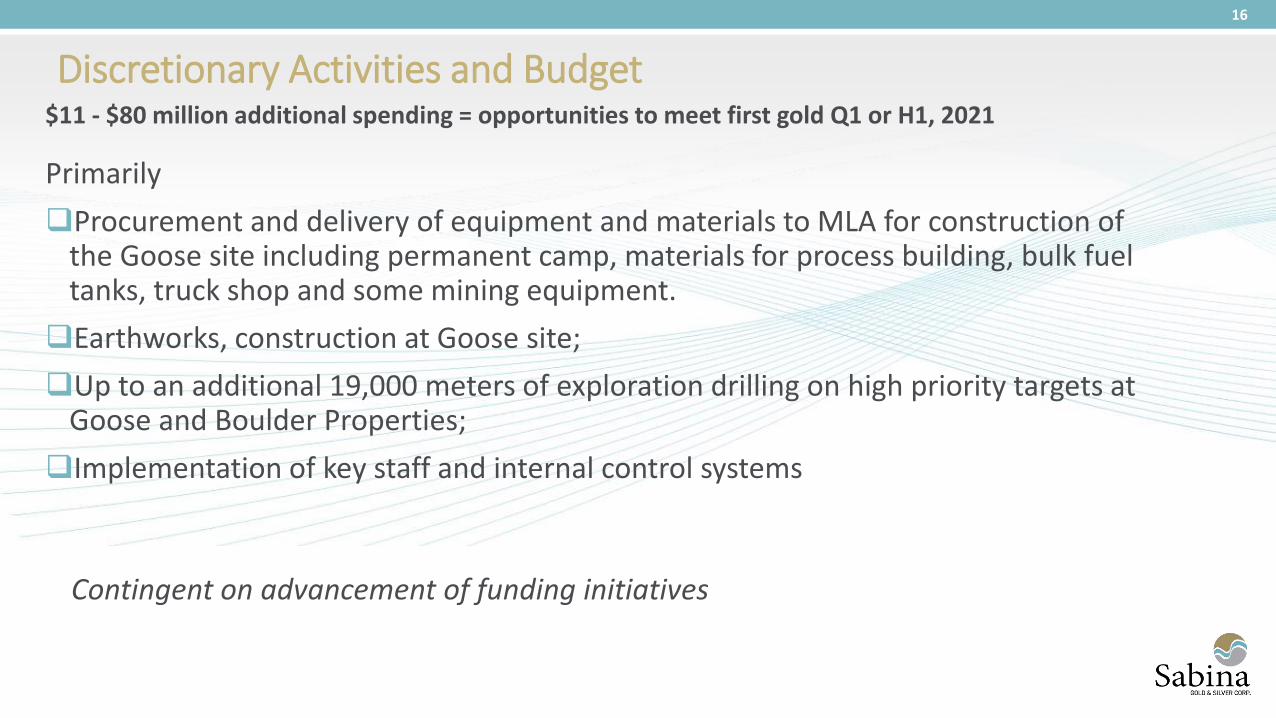
Discretionary Activities and Budget
16
Primarily
Procurement and delivery of equipment and materials to MLA for construction of the Goose site including permanent camp, materials for process building, bulk fuel tanks, truck shop and some mining equipment.
Earthworks, construction at Goose site;
Up to an additional 19,000 meters of exploration drilling on high priority targets at Goose and Boulder Properties;
Implementation of key staff and internal control systems
$11 - $80 million additional spending = opportunities to meet first gold Q1 or H1, 2021
Contingent on advancement of funding initiatives
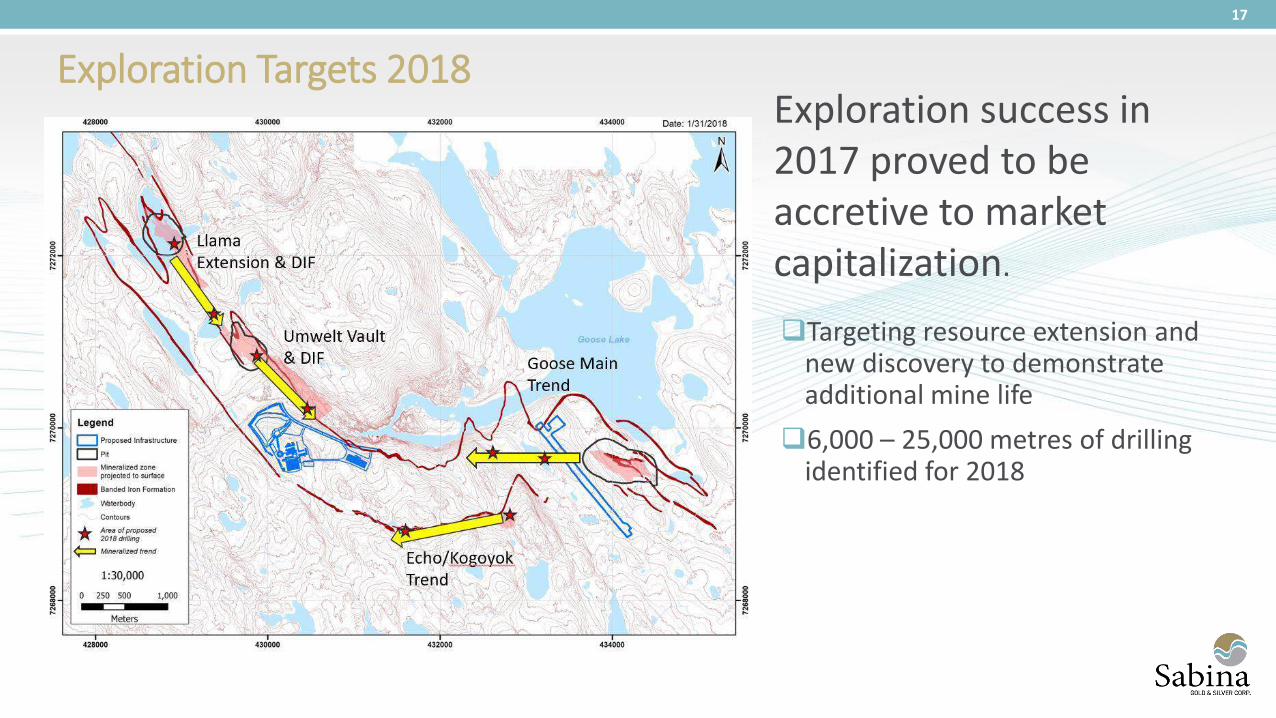
Exploration Targets 2018
17
Targeting resource extension and new discovery to demonstrate additional mine life
6,000 – 25,000 metres of drilling identified for 2018
Exploration success in 2017 proved to be accretive to market capitalization.

Empowering Geology in Exploration Nuvuyak (Sky) 2018 Target
Geophysics & Structure Geology & Stratigraphy
Nuvuyak NEW TARGET
F2 Fold Axis
Mineralization and Resources
Goose Main
F2 Fold Axis
Hook Nuvuyak NEW TARGET
18
Pre-1.9 Ga Gabbro dykes
Mackenzie dykes
Late Archean Granitoids
Unconformity

Hackett Silver Royalty
Significant potential cash flow at no cost from silver royalty.
22.5% x 190 million ounces of silver
= cash equivalent of ~3 million ounces of silver per year; and
12.5% x of silver production after 190 million ounces
19
0
20
40
60
80
100
120
140
160
PRECIOUS METALS BASE METALS
To
nn
es
( m
illi
on
s)
Data source: alley et al. , Mineral deposits of Canada, 2007 and selected company websites. Metal distribution using
Wardrop PEA metal prices, 2.00 Cu, 0.80 Zn, 0.50 Pb, 14.00 Ag, 600 Au
Sabina mineral resource estimate:
Indicated resources of 25 million tonnes at 4.2% Zn and 130 g/t Ag
Inferred resources of 57 million tonnes at 3% Zn and 100 g/t Ag
60km west of Back River, one of world’s largest undeveloped silver rich VMS deposits
QA/QC – slide 29

Hackett River Glencore Activities
Glencore has satisfied expenditure requirements under terms of Agreement
In October, 2018, if Glencore has not announced a production decision, Sabina can buy
back the Hackett River asset for an amount equal to what Glencore has spent on the
project
If Glencore elects not to sell the property to Sabina, Glencore must pay Sabina $75
million over three years against future royalty payments
Sabina loses buy back right after third anniversary of buy back notice
Sabina views royalty as strategic option on silver going forward
20
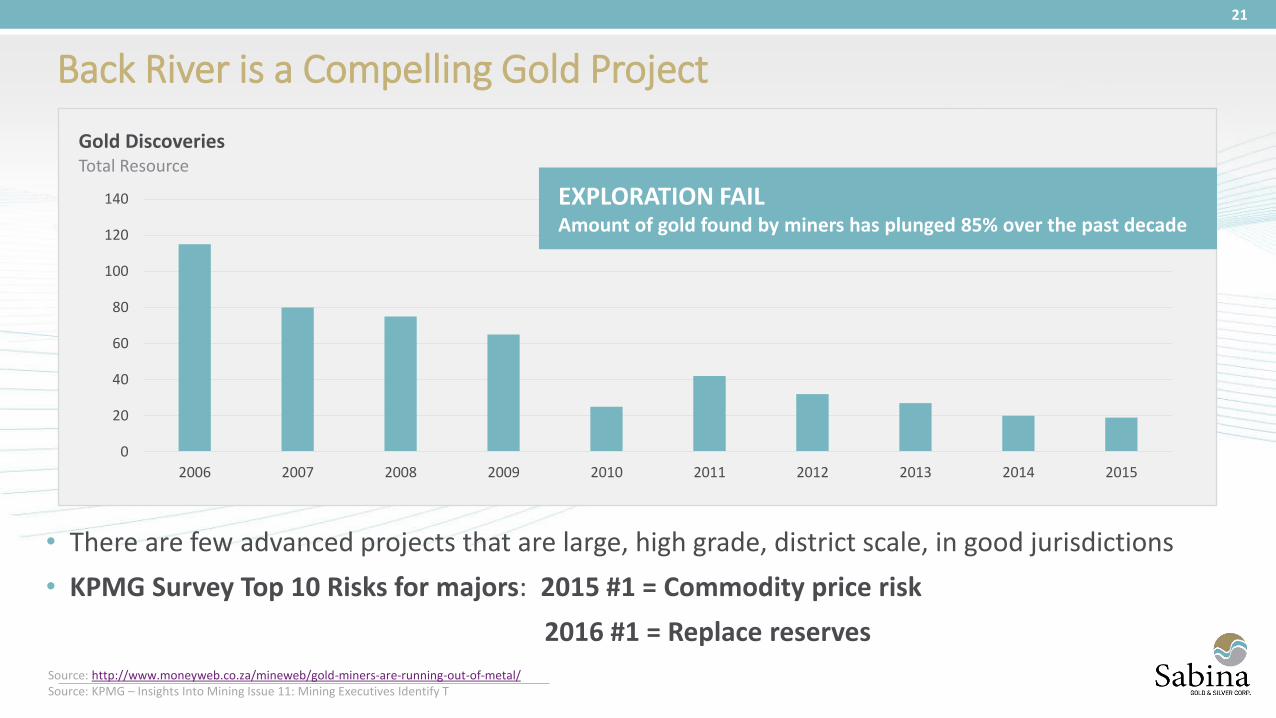
Back River is a Compelling Gold Project
• There are few advanced projects that are large, high grade, district scale, in good jurisdictions
• KPMG Survey Top 10 Risks for majors: 2015 #1 = Commodity price risk
2016 #1 = Replace reserves
Source: http://www.moneyweb.co.za/mineweb/gold-miners-are-running-out-of-metal/ Source: KPMG – Insights Into Mining Issue 11: Mining Executives Identify T
0
20
40
60
80
100
120
140
2006 2007 2008 2009 2010 2011 2012 2013 2014 2015
Gold Discoveries Total Resource
EXPLORATION FAIL Amount of gold found by miners has plunged 85% over the past decade
21

Sabina Investment Thesis Summary
22
Remaining ounces in mineral resource estimate George - Sabina’s Amaruq or Boston Significant exploration upside in a district owned 100% by Sabina Vault and Llama potential for extended mine life and enhanced
economics Hackett River Royalty – option on silver for the future Jurisdiction – Nunavut, Canada pro-responsible development Inuit Binding Term sheet for land tenure and economic benefits
Upcoming Catalysts: Significant exploration program for 2018 Key staff additions Project update & plans for 2018 Project financing plan announcement Continued de-risking of project
Sabina’s sum of the parts is more than the feasibility study

Management & Board
Combined exploration, mine development, permitting operations & capital markets experience in over 70 projects & companies
Executive Management
Bruce McLeod President, CEO & Director
Elaine Bennett VP Finance & CFO
Nicole Hoeller VP Communications & Corp. Secretary
Technical Management
Angus Campbell VP Exploration
Matthew Pickard VP Environment & Sustainability
Bruce McLeod (Pres. & CEO)
Walter Segsworth (Chairman)
David Fennell
Jonathan Goodman
James Morton
Anthony Walsh
Roy Wilkes
Anna Stylianides
Leo Zhao
Board of Directors
23
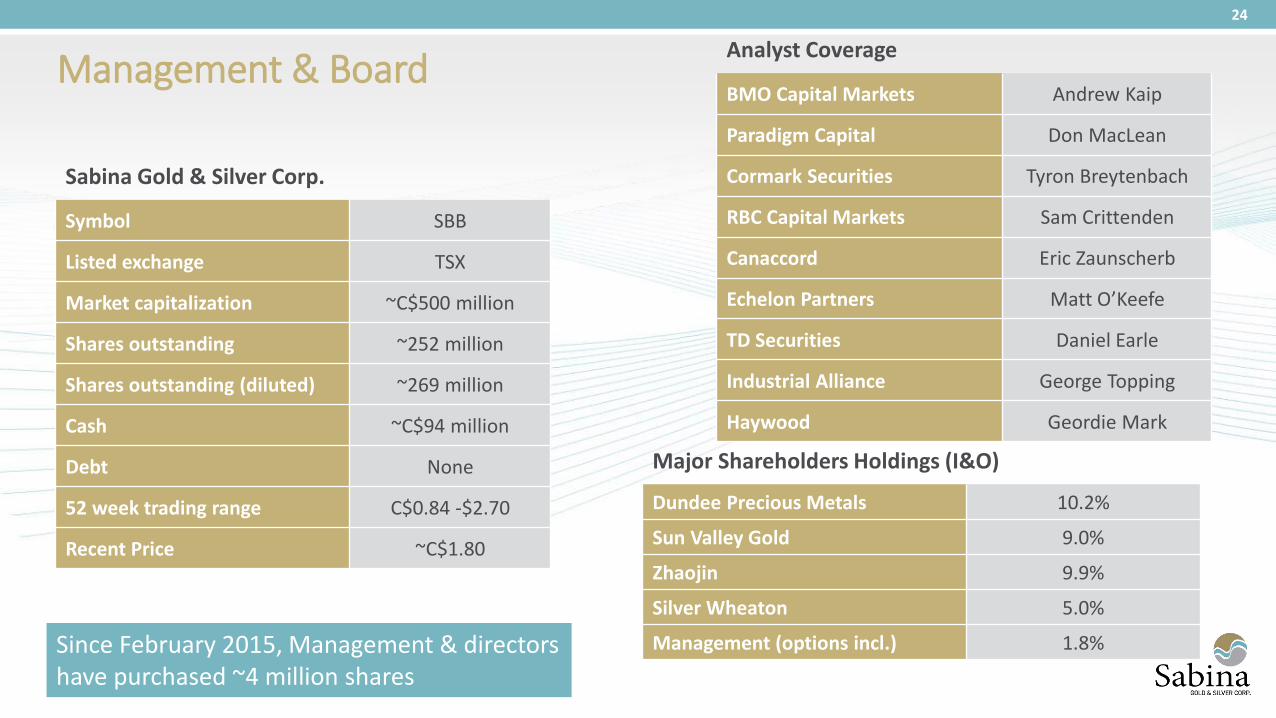
Management & Board
Sabina Gold & Silver Corp.
Symbol SBB
Listed exchange TSX
Market capitalization ~C$500 million
Shares outstanding ~252 million
Shares outstanding (diluted) ~269 million
Cash ~C$94 million
Debt None
52 week trading range C$0.84 -$2.70
Recent Price ~C$1.80
Analyst Coverage
BMO Capital Markets Andrew Kaip
Paradigm Capital Don MacLean
Cormark Securities Tyron Breytenbach
RBC Capital Markets Sam Crittenden
Canaccord Eric Zaunscherb
Echelon Partners Matt O’Keefe
TD Securities Daniel Earle
Industrial Alliance George Topping
Haywood Geordie Mark
Major Shareholders Holdings (I&O)
Dundee Precious Metals 10.2%
Sun Valley Gold 9.0%
Zhaojin 9.9%
Silver Wheaton 5.0%
Management (options incl.) 1.8%
24
Since February 2015, Management & directors have purchased ~4 million shares

Back River Feasibility Study QA/QC The FS was prepared under the direction of JDS Energy & Mining Inc. by leading independent industry consultants, all Qualified Persons (QP) under National Instrument 43-101.
Angus Campbell, P.Geo, Vice-President, Exploration, is a qualified person under NI-43-101 where the information relates to mineral resource estimates and Jeff Eng, P.Eng Director, Engineering are qualified persons under NI 43-101 for the feasibility study and both approve the scientific and technical information contained herein. Further information can be found at Technical Report for the Initial Project Feasibility Study on the Back River Gold Property, Nunavut” dated October 28, 2015 and filed on SEDAR at http://www.sedar.com.
Qualified Person, Designation Company QP Responsibility/Role
Gord Doerksen, P.Eng. JDS Energy & Mining Inc.
Executive Summary, Introduction, Reliance on Other Experts, Reserves,
Infrastructure, Market Studies, Capex, Opex, Economic Analysis, Adjacent
Properties, Environmental, Other Relevant Data, Interpretations,
Recommendations, References, Abbreviations, Project Execution Plan,
Logistics, Infrastructure, G&A
Dino Pilotto, P.Eng. JDS Energy & Mining Inc. Mining Methods
Andrew Fowler, MAusIMM, CP (Geo) AMC Mining Consultants (Canada) Ltd. Mineral Resource Estimates for George
Dinara Nussipakynova, P.Geo AMC Mining Consultants (Canada) Ltd. Mineral Resource Estimates for Goose
John Morton Shannon, P.Geo AMC Mining Consultants (Canada) Ltd. Property Description, Accessibility, History, Geology, Deposits, Exploration,
Drilling, sample Preparation, Data Verification
Maritz Rykaart, P.Eng. SRK Consulting (Canada) Inc. Geochemistry, Tailings Management, Water Management
Stacy Freudigmann, P.Eng Canenco Canada Inc. Metallurgy, Recoveries, Process
Rob Mercer, Ph.D., P.Eng Knight Piésold Ltd. Geomechanical
25

CIM definitions were used for the resources.
Ms. D. Nussipakynova, P.Geo. and Dr. A. Fowler, Ph.D., MAusIMM, CP (Geo), both from AMC and Qualified Persons under NI 43-101, take responsibility for the Mineral Resource Estimates.
Open pit resources are constrained by an optimized pit shell at a gold price of US$1,500 oz. The cut-off grade applied to the open pit resources is 1.0 g/t Au.
The underground cut-off grade is 4.0 g/t Au for all George resources (LCPN, LCPS, LOC1, LOC2, GH, and Slave), 3.5 g/t Au for Goose Main, Echo, and Llama, and 4.5 g/t for the Umwelt deposit.
The George resources were estimated within mineral domains expanded to a minimum width of 2 m for the underground resources.
Drilling results up to December 31, 2013 are included, except for Echo (July 4, 2014) and LOC1 and LOC2 (July 21, 2014).
The numbers might not add due to rounding.
Measured and Indicated Resources are inclusive of Reserves.
Resources that are not reserves do not have demonstrated economic viability.
26
A gold price of US$1,250/oz is assumed. An exchange rate of CDN$1.15 to US$1.00 is assumed. The numbers might not add due to rounding . Notes for open pit: Dilution and recovery factors are applied as per open pit mining method. A COG of 2.08 g/t was used for the Umwelt Open Pit Mineral Reserve Estimate. A COG of 2.14 g/t was used for the Llama Open Pit Mineral Reserve estimate. A COG of 2.07 g/t was used for the Goose Main Open Pit Mineral Reserve estimate. Notes for underground: Dilution and recovery factors are applied as per underground mining method. A COG of 3.86 g/t was used for the Umwelt underground Mineral Reserve Estimate.
Mineral Resources Estimate Mineral Reserve Estimate
Back River Mineral Resource and Reserve Estimates QA/QC

Hackett River QA/QC
The updated mineral resource estimate was originally prepared by Glencore (previously Xstrata) under the JORC code and was reported by Glencore on May 3, 2013 in its annual report of mineral resources and reserves as at December, 31, 2012. Glencore’s updated mineral resource estimate has been reviewed by Sabina and is stated in the Report dated July 31, 2013 and titled “Sabina Gold & Silver Corp. Hackett River Property Royalty NI 43-101 Technical Report, Nunavut, Canada” in accordance with NI 43-101 thus conforming to CIM Definition Standards. Mineral resources that are not mineral reserves do not have demonstrated economic viability. Mineral resource estimates do not account for mineability, selectivity, mining loss and dilution. These mineral resource estimates include inferred mineral resources that are normally considered too speculative geologically to have economic considerations applied to them that would enable them to be categorized as mineral reserves. There is also no certainty that these inferred mineral resources will be converted to measured and indicated categories through further drilling, or into mineral reserves, once economic considerations are applied.
27