a gis performance analysis of a 3g wireless cellular network
TRANSCRIPT
Information and Knowledge Management www.iiste.org
ISSN 2224-5758 (Paper) ISSN 2224-896X (Online)
Vol.5, No.7, 2015
124
A GIS Performance Analysis of a 3G wireless Cellular Network
Etebong B. Isong1
Uduak A. Umoh2
1. Department of Computer Science, Akwa Ibom State University, Ikot Akpaden, Mkpat Enin, .M.B 1167,
Uyo- Nigeria.
2. Department of Computer Science, University of Uyo-Nigeria.
Abstract
In this paper, GIS performance Analysis of a 3G wireless cellular network is presented. The research is
motivated by the need for network operators and mobile users to have on the spot assessment of the network
performance. This was achieved by studying the effect of population, road structure and visibility on the Erlang
traffic of an existing 3G Network. The result expectedly revealed that densely populated areas are likely to
experience high traffic and poor signal reception. Road structure analysis shows poor service quality along major
roads due to high traffic within the study area while the visibility analysis revealed that the terrain structure of
the study area does not support good visibility.
Keywords: GIS, 3G wireless cellular Networks, Erlang Traffic, Base Transceiver station.
1.1 Introduction
The Geographical Information System (GIS) is known for its ability to accept dataset from various sources
provided they are in an acceptable format, processed and displayed in a variety of ways. Proper integration of
different data layers using appropriate algorithms guarantee a high quality result or output that can aid informed
decision. A number of researchers have utilized several GIS functionalities to map communication factors such
as signal strength input data into the GIS environment for further analysis and display. This is evidenced in the
work of [Radis et al. 1997], who used professional GIS tools and customized application Radio
Telecommunication Modelling (RTM), for geographic data management and GSM network planning operations.
They used sites database developed by network planners and implemented on Microsoft (MS) Access,
cartographic GIS database re-organized and updated using ArcView/Spatial Analysis /RTM to comply with
network planner’s requirements.
In various fields there is need to manage geometric, geographic, or spatial data, which means data related to
the air interface. The air interface may be the two dimensional abstraction of (parts of the earth's surface or a 3D-
space representing a Digital Terrain Model. Since the advent of relational databases, there have been several
attempts to manage such data in database systems. One of the benefits offered by emerging GIS technologies is
the capability to deal with large collections of relatively simple geometric objects, for instance, a set of 100,100
polygons. Several terms have been used for database systems offering such support like pictorial, image,
geometric, geographic, or spatial database system arise from the fact that the data to be managed are often
initially captured in the form of digital raster images (e.g., remote sensing by satellites, or computer tomography
in medical applications. The term ‘spatial database system’ has become popular during the last few years, and is
associated with a view of a database as containing sets of objects in space rather than images or pictures of a
space. Indeed, the requirements and techniques for dealing with objects in space that have been identified and
well-defined extents, locations, and relations are rather different from those for dealing with raster images. A
spatial database therefore has the following characteristics: (i) A spatial database system is a database system. (ii)
It offers Spatial Data Types (SDTs) in its model and query language. (iii) It supports Spatial Data Types in its
implementation, providing at least indexing and efficient algorithms for spatial join.
Many factors influence a successful GIS implementation. None however are more fundamental than having
the right management strategy and software to implement these. The spatial database is the foundation by which
all data is uniformly created and transformed. But maintaining the integrity and currency of the data is of
fundamental importance. A classic error made by most organisations in the thinking that a generic spatial
database is sufficient for their needs. The spatial database is the end product of a series of process that determine
the specific functional requirements for the user and the key applications. Interoperability of data is also of a
critical concern in the development of spatial data information systems. As technology drifts from newly created
data to assimilation of all existing data, a properly designed spatial database is insurance for end user success.
Topology is one of the most useful relationships maintained in many spatial databases. It is defined as the
Mathematics of connectivity or adjacency of points or lines that determines spatial relationships in a GIS. The
topological data structure logically determines exactly how and where points and lines connect on the map by
means of nodes (topological junctions). The order of connectivity defines the shape of an arc or polygon. The
computer stores this information in various tables of the database structure. By storing information in a logical

Information and Knowledge Management www.iiste.org
ISSN 2224-5758 (Paper) ISSN 2224-896X (Online)
Vol.5, No.7, 2015
125
and ordered relationship, missing information, e.g. a line segment of a polygon is apparent. A GIS manipulates,
analyses, and uses topological data in determining data relationship.
Network analysis uses topological modelling to determine shortest paths and alternate routes. For instance,
a GIS for emergency service dispatch may use topological models to quickly ascertain optional routes for
emergency vehicles. Automobile commuters perform a similar mental task by altering their routes to avoid
accidents and traffic congestions. Likewise an electrical utility GIS could rapidly determine different circuit
paths to route electricity when service is interrupted by equipment damage. Similarly, political re-districting
planners could use certain algorithms to determine logical relationships between population groups and areas for
district boundaries. Telecommunication networks are inherently spatial systems [Hepworth 2007][Baskis 2001].
Telecommunication infrastructure development is a process of spatial interaction and mutual growth between
and demands. Geographical Information Systems [Chrisman 1997][Laurni and Thompson 1992] with their
powerful data handling and spatial analysis capabilities, are ideal for meeting the information needs of
telecommunications infrastructure development.
In Akwa Ibom State, Nigeria (the case study for the GIS mapping), the concept of topology representation
is vital. With the application of this concept, 3G (Third Generation) cellular wireless networks stands to benefit
from this research as they will obtain instant data on locations of Base station as well as signal and traffic
quality reports, when all the nodes and locations at every point, line and regions under study are properly
represented in a relational spatial database format. The topology data will also allow for the proper network
planning and development of new sites. A detailed network analysis of QoS (Quality of Service) is necessary in
study area. This would be obtained easily from the spatial database. Hence, availability of resources such as
network channels to service traffic requests can be centrally managed at the various Base Transceiver
Station(BTS) control sites, to ensure that areas with poor topologies are given due attention. Monitoring and
tracking of certain events is also possible when the locations of each BTS can be accessed. The database could
also hold handover data as users are transiting from one cell to another.
2.1 Related Works
In [Ajala 2005] GIS application was incorporated into a standard network monitoring tool to produce
different types of dynamic maps as output to show different aspect of the network. He used a predicted coverage
array which is a collection of geo-referenced polygons in space that represent the radial distance of the signal
strength away from each cell based on the signal’s interaction with environmental factors, as one of the input
layer. A counter-based network statistics captured based on network-defined temporal frequency and stored in
Oracle database server section formed another input data set. This created a GIS of a sort in which geo-
referenced arrays served as spatial data while the dynamic statistics served as the attributes. Once this join has
been accomplished, various dynamic thematic maps were created as output that gave insight into the geographic
spread of a particular network phenomenon, e.g.; traffic, drop call, etc. [Guoray 2002] Proposes a GIS approach
for analyzing the adequacy of a regional broadband infrastructure by spatially relating infrastructure facility with
demand.
In this paper, to enhance the proper monitoring of Network Providers, we have offered a GIS solution with
a Graphical User Interface (GUI) that can be integrated into mobile phones for users to qualitatively monitor the
Carried traffic of the 3G cellular wireless network with respect to population (number of users, mobility and
visibility. The advantage of the GIS solution is to provide network operators and mobile users with on the spot
assessment of the network (in real time). If Network carriers are aware of locations where network degradation is
high, then solutions could be proffered before the situation degenerate further.
3.1 Methodology
The transformation of information about the geographic environment to geospatial data, and in turn to maps can
be achieved through information modelling. In this thesis, data about CDMA traffic of 3G cellular wireless
network was first transformed into geospatial data to qualitatively view the performance of the system. The
geospatial data were then transformed into cartographic maps with well-defined rules for cartographic
abstraction, symbology and labelling, graphic refinement and map compilation.
3.1.1 Acquisition of Primary and Secondary Data
This research required a survey of a telecommunication operator’s cell sites or base stations in Akwa Ibom
State, Nigeria. During data gathering, we obtained data concerning the network’s coverage areas. These data
were collected with permission from the planning and optimization department of the network operator. The data
collected includes operational sites and cells (base stations), their respective geo-reference locations (longitude
and latitude) and addresses .To provide a qualitative view of the existing system’s performance, we concentrate
on Akwa Ibom State zone, and export the locations which represent the cell (mast) points, to the base map of the
State. A spatial data analysis was performed on the Base maps to study the effect of (Population Density,
Information and Knowledge Management www.iiste.org
ISSN 2224-5758 (Paper) ISSN 2224-896X (Online)
Vol.5, No.7, 2015
126
Intervisibility and Mobility/Road structure) on the QoS.
The Base maps were scanned using a scanning machine and imported to the Geographical Information
System (GIS) environment. The scanned maps were geo-referenced to assign geographical locations to each of
the traffic dataset. This was achieved by using a latitude and longitude geographic referencing system based on
the World Geodatic System 1984 ellipsoid. The ArcMap 9.2 software was used to carry out the geo-referencing
and final digitization of the maps. The digital elevation model (DEM) of the study area which is a three-
dimensional model depicting a part of the earth surface in digital format adopted the United States Geological
Survey (USGS). The Digital Elevation Model (DEM) was used to generate the contour maps that will assist us
perform the analysis of the operator’s network.
We emphasize that the interface between GIS components layers must be standardized to provide syntactic
interoperability. GIS efficiency and effectiveness of integration largely depends on whether the GIS components
share a common data model, otherwise, mismatch of the data model will arise. A solution to this problem is the
development of read-only spatial databases to avert unnecessary data modifications. Therefore, data must be
appropriately verified before building the spatial database.
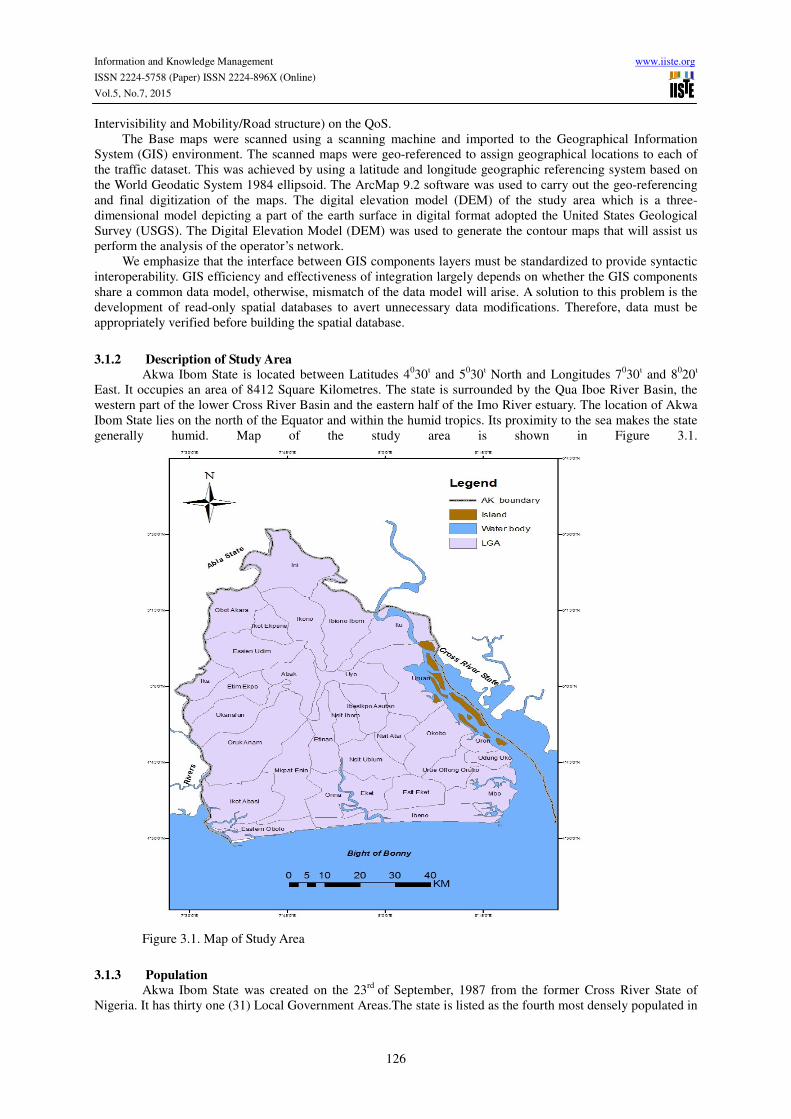
3.1.2 Description of Study Area
Akwa Ibom State is located between Latitudes 4030
ι and 5
030
ι North and Longitudes 7
030
ι and 8
020ι
East. It occupies an area of 8412 Square Kilometres. The state is surrounded by the Qua Iboe River Basin, the
western part of the lower Cross River Basin and the eastern half of the Imo River estuary. The location of Akwa
Ibom State lies on the north of the Equator and within the humid tropics. Its proximity to the sea makes the state
generally humid. Map of the study area is shown in Figure 3.1.
Figure 3.1. Map of Study Area
3.1.3 Population
Akwa Ibom State was created on the 23rd
of September, 1987 from the former Cross River State of
Nigeria. It has thirty one (31) Local Government Areas.The state is listed as the fourth most densely populated in

Information and Knowledge Management www.iiste.org
ISSN 2224-5758 (Paper) ISSN 2224-896X (Online)
Vol.5, No.7, 2015
127
Nigeria with 541 persons/Km2. The 2006 census revealed that some Local Government Areas such as Oron, Uyo
and Ikot Ekpene have human density of more than 1000 persons/Km2
. The most densely populated LGAs in
Akwa Ibom State are Oron 2128, Uyo 1986, Ikot Ekpene 1116, Eket 983, Nsit Ibom 993 and Etinan 928
persons/Km2 respectively. The least densely populated LGAs are Uruan and Okobo with 280 persons/Km
2 and
289 persons/Km2 respectively; the rest have densities higher than 300 persons/Km
2 [Inyang 2010]. The map
showing the population density distribution of Akwa Ibom State can be seen in Figure 4.1.
3.1.4 Procedure for Data Collection and Analysis The researchers obtained data concerning the coverage area of the Service provider from the planning and
optimisation department of the Company. The data collected included the operational sites and cell (Base
Transceiver Stations), their respective geo-reference locations in the State and addresses. The BTS points were
exported to the map and used for relevant spatial analysis operations. The Digital Elevation Model of the study
area which is a three-dimensional model depicting a part of the earth surface in digital format was obtained from
United States Geological Survey (USGS). The DEM was used to generate the respective contour maps and also
perform the intervisibility analysis on the service provider’s network facilities.
4.1 Discussion of Results
4.1.1 Population Analysis It is expected that densely populated areas are likely to experience high traffic and poor signal reception
which could result in congestions, blocking, outages, network failures, etc. This defect is as a result of the non-
line-of-sight (NLOS) nature of the environment. Densely populated areas are mostly full of high rise buildings
and other obstacles that impair signals. Also more people are joining the network, which in turn results in
increased subscriber’s base, resulting in call blocking, cell congestion, echoing, etc. This scenario is typical of
Figure 4.1. As observed, the Akwa Ibom state population spread for instance, is not directly proportional to the
population density per square meter. This implies that for the population density of a typical Local Government
Area, the number of persons available may not be evenly distributed to ensure a smooth transmission. This is
expected, as we experience frequent exodus of persons from rural to urban areas.
In some areas such as commercial nerve centres, the population seems to outweigh the number of
servicing equipment, thus resulting in signal degradation due to ever increasing subscribers. Furthermore, some
cities were not well planned, which greatly impair signals. Even in non-densely populated areas, the proliferation
of mobile phones exceeds the coverage strength thus causing severe congestion and poor quality of service
delivery.

Information and Knowledge Management www.iiste.org
ISSN 2224-5758 (Paper) ISSN 2224-896X (Online)
Vol.5, No.7, 2015
128
Figure 4.1. Population map showing Carried Traffic in the Study Area
4.1.2 Road Structure Analysis
To service travellers or users on the move; telecommunication operators plant handover base stations to
ensure that call requests do not ‘die off’ or fade as a mobile user transits from one base station to another. These
base stations are not for coverage and as such will not cover long distances. The base station controller (a central
computer which specializes in making phone connections) and the intelligence of the cell phone keep track of
and allow the phone to switch from one base station to another during conversation. As the user migrates towards
a base station, it picks the strongest signal and releases the station from which the signal has become
weaker.[Isong 2015] Figure 4.2 reveals a case where poor service quality is observed along major roads due to
high traffic (within the study area). As expected, telecommunications companies would not want to waste
revenue on boosting signal strength along these roads. One way of minimizing this effect is to apply effective
power control mechanisms and condition base stations such that users do not experience the ‘near-far’ effect, i.e.,
strong signals swamping weaker signals, thus permitting only those closer to the base station to enjoy optimal
services.

Information and Knowledge Management www.iiste.org
ISSN 2224-5758 (Paper) ISSN 2224-896X (Online)
Vol.5, No.7, 2015
129
Figure 4.2: Road Map showing Carried Traffic in the Study Area
4.1.3 Visibility Analysis
Visibility is described by the signal attenuation between a transmitter and receiver (as a function of the
propagation distance and other parameters which relates the terrain profile and its surface feature). Most of the
problems of radio propagation are similar to the problems of inter-visibility analysis, i.e., the choice of data
model (grids vs. triangular irregular networks, digital terrain model scale or resolution, profile retrieval algorithm;
incorporation of ground cover data) and verification of the predicted results. Some users of GIS applications
simplify inter-visibility problem by ignoring the clutter – an inefficient option for accurate radio communications
planning. Clutter may include buildings – roof structures, building resources and high vegetation and shrubbery
– trees, 2-D surface features that possess distinctive propagation properties.
As observed in Figure 4.3, poor visibility resulting from hazy weather conditions contributes to poor
connection and adversely affects the network performance. This explains the reason for delays in network
connectivity and incessant break-ups in communication. Poor visibility may also be as a result of signal
absorption due to the following: (i) highly noisy environment in certain localities that were not pre-planned or
well-planned, (ii) reflection and diffraction of the signals, most especially where there is monopoly/competition
in the telecommunication market [Isong et al. 2015]. As shown in the Figure 4.3, traffic is also affected because
there are numerous obstacles and poorly planned infrastructures which contribute to traffic jams. Also the terrain
structure of the study area does not support good visibility.

Information and Knowledge Management www.iiste.org
ISSN 2224-5758 (Paper) ISSN 2224-896X (Online)
Vol.5, No.7, 2015
130
Figure 4.3. Visibility Map showing Carried Traffic in Study Area
Conclusion
We have presented a GIS performance analysis of an existing 3G wireless Cellular Network in a bid to proffer
optimised solutions to the existing traffic problems of network operators through proper monitoring of
telecommunication traffic. With the GIS solution, a graphic user interface (GUI) can be integrated into mobile
phones for users to monitor the Erlang traffic or Carried traffic with respect to number of users, mobility and
visibility. The GIS has the advantage of providing network operators and mobile users with the on the spot
assessment of the network ( in real-time).
References Ajala, I.(2005) GIS and GSM Network Quality Monitoring: A Nigerian Case Study.
http://www.directionsmag.com/articles/gis-and-gsm-network-quality-monitoring-a-nigerian-case-study/123278. Accessed on
29 December, 2010.
Bakis, H. (2001). Elements for Geography of Telecommunication. Geographical Research Forum 4, 31–45.
Chrisman, N. (1999). A Transformational approach to GIS operations. International Journal of Geographical Information
Science 13(7) 607-637.
Guoray C.A.(2002). A GIS Approach to the Spatial Assessment of Telecommunications Infrastructure Networks and Spatial
Economics, 2: (2002) 35–63
Hepworth, M.E. (2007). Information Technology as Spatial Systems. Progress in Human Geography 11(2 ), 157–180
Isong E.B. (2015). Modelling and Optimisation of Data/Voice Traffic in an established 3G Cellular Wireless Network.
Ph.D thesis in Information Management Technology submitted to Federal University of Technology, Owerri-Nigeria.
Inyang, I. B. (2010). Akwa Ibom State. A Geographical Perspective. Enugu: Immaculate Publication Limited.
Laurini, R. and D. Thompson. (1992). Fundamentals of Spatial Information Systems. London: Academic Press.
Radis, D., Bulavas, V. & Pleskis, K. (1997). GSM Network Planning Tools on a base of ArcView GIS. Retrieved from
http://proceedings.esri.com/library/userconf/europroc97/10amfm/AM2/am2.htm.

The IISTE is a pioneer in the Open-Access hosting service and academic event management.
The aim of the firm is Accelerating Global Knowledge Sharing.
More information about the firm can be found on the homepage:
http://www.iiste.org
CALL FOR JOURNAL PAPERS
There are more than 30 peer-reviewed academic journals hosted under the hosting platform.
Prospective authors of journals can find the submission instruction on the following
page: http://www.iiste.org/journals/ All the journals articles are available online to the
readers all over the world without financial, legal, or technical barriers other than those
inseparable from gaining access to the internet itself. Paper version of the journals is also
available upon request of readers and authors.
MORE RESOURCES
Book publication information: http://www.iiste.org/book/
Academic conference: http://www.iiste.org/conference/upcoming-conferences-call-for-paper/
IISTE Knowledge Sharing Partners
EBSCO, Index Copernicus, Ulrich's Periodicals Directory, JournalTOCS, PKP Open
Archives Harvester, Bielefeld Academic Search Engine, Elektronische Zeitschriftenbibliothek
EZB, Open J-Gate, OCLC WorldCat, Universe Digtial Library , NewJour, Google Scholar