a gis-based multi-criteria evaluation of disaster
TRANSCRIPT

A GIS-BASED MULTI-CRITERIA EVALUATION OF
DISASTER VULNERABILITY IN AN URBAN SPACE
Shibuki Hanai
A Capstone project presented in partial fulfillment
of the requirements for the degree of:
Master of Arts in Policy Studies
University of Washington Bothell
School of Interdisciplinary Arts and Sciences

1
TABLE OF CONTENTS
1. INTRODUCTION 3
1.1 BACKGROUND 3
1.2 NATURAL HAZARDS, URBAN SPACE, AND PLANNING 3
1.3 VULNERABILITY, RESILIENCE, AND ADAPTATION 7
1.4 EVALUATING VULNERABILITY 11
1.5 PARADIGM SHIFT IN BUILDING RESILIENCE 13
1.6 RECOVERY VS. MITIGATION 14
2. STUDY AREA 16
2.1 SOCIO-ECONOMICS AND DEMOGRAPHICS 16
2.2 NATURAL DISASTERS AND POLICY 18
3. METHODS AND DATA 20
3.1 MULTI0CRITERIA EVALUATION 20
3.2 MODEL IMPLEMENTATION 21
3.3 DATA PROCESSING 27
3.4 SCENARIO PLANNING 32
4. RESULTS AND DISCUSSION 34
4.1 DISASTER VULNERABILITY IN BOTHELL 34
4.2 INTERPRETING THE SENSITIVITY OF THE MODEL 40
4.3 RECOMMENDATIONS 49
5. CONCLUSION 56
5. REFERENCES 61

2
LIST OF FIGURES AND TABLES
FIGURES
FIGURE 1: STRESS RESISTANCE AND RESILIENCE OVER TIME 7
FIGURE 2: BOTHELL CITY LIMITS AND CENSUS BLOCKS 17
FIGURE 3: NATURAL HAZARD MAP OF BOTHELL SHOWING THE PAST LANDSLIDES AND FLOOD 26
FIGURE 4: BOTHELL’S ZONING MAP 26
FIGURE 5: Z-SCORE OF FEMALE RATIO IN EACH CENSUS TRACKS BLOCK 29
FIGURE 6: Z-SCORE OF MEDIAN HOUSEHOLD INCOME IN EACH CENSUS TRACKS BLOCK 30
FIGURE 7: Z-SCORE OF MEDIAN BUILDING AGE IN EACH CENSUS TRACKS 31
FIGURE 8: DISASTER VULNERABILITY MAP OF BOTHELL (STATUS QUO) 36
FIGURE 9: DISASTER VULNERABILITY MAP OF BOTHELL (SOCIAL DIMENSION) 37
FIGURE 10: DISASTER VULNERABILITY MAP OF BOTHELL (ECONOMIC DIMENSION) 38
FIGURE 11: DISASTER VULNERABILITY MAP OF BOTHELL (BUILT ENVIRONMENT) 39
FIGURE 12: SCENARIO MAP (“LESS THAN 9TH GRADE” AS ADJUSTED EVALUATION FACTOR) 42
FIGURE 13: SCENARIO MAP (“SOME HIGH SCHOOL” AS ADJUSTED EVALUATION FACTOR) 43
FIGURE 14: SCENARIO MAP (“HIGH SCHOOL” AS ADJUSTED EVALUATION FACTOR) 44
FIGURE 15: SCENARIO MAP (“18 YEARS OLD AND YOUNGER” AS ADJUSTED EVALUATION FACTOR)45
FIGURE 16: SCENARIO MAP (“65 YEARS OLD AND OLDER” AS ADJUSTED EVALUATION FACTOR) 46
FIGURE 17: SCENARIO MAP (“UNEMPLOYMENT RATE” AS ADJUSTED EVALUATION FACTOR) 47
FIGURE 18: SCENARIO MAP (“CDBG ELIGIBILITY” AS ADJUSTED EVALUATION FACTOR) 48
TABLES
TABLE 1: BECCARI’S CLASSIFICATION SCHEME FOR VARIABLES IN COMPOSITE INDICATOR METHODOLOGIES 23
TABLE 2: EVALUATION FACTORS OF VULNERABILITY AT THE CENSUS BLOCKS LEVEL 24
TABLE 3: Z-SCORES AND SUMMARY STATISTICS 28
TABLE 4: HYPOTHETICAL CONDITIONS AND VALUE ADJUSTMENT OF EACH EVALUATION FACTOR 33
TABLE 5: WEIGHT CHANGES TO SOCIAL DIMENSION MAPS 33
TABLE 6: WEIGHT CHANGES TO ECONOMIC DIMENSION MAPS 33
TABLE 7: WEIGHT CHANGES TO BUILT ENVIRONMENT MAPS 33

3
1. Introduction
1.1 Background
The notions of resilience and vulnerability are rapidly gaining ground in the urban
sustainability and planning literature. The series of recent natural disasters around the world such
as earthquakes, tsunami, and hurricanes, highlights the need for planning around natural hazard
prevention and mitigation in human settlements. Historically, efforts have concentrated on
recovery efforts, but rather than public engagement with emergency planning. Traditionally,
most policy regarding disaster puts emphasis on the impact of natural phenomena. This notion
has led to the dominance of technical interventions concentrating on prediction of hazards or
modifying their impact. Catastrophic natural disasters such as Hurricane Katrina in 2005 taught
us a hard lesson that traditional methods of communicating emergency information often fall
short from the goal of reaching everyone in a community (Bates and Swan 2010). Accordingly,
the incorporation of the notions of vulnerability and resilience in city’s emergency preparedness
and disaster management has become a new frontier. In this study, I employed a multi-criteria
evaluation (MCE) method within a geographic information system (GIS) framework to evaluate
the vulnerability at of the City of Bothell to natural disasters at the census block level.
1.2. Natural Hazards, Urban Space, and Planning
Natural hazards such as earthquakes, landslides, volcanic activities, and flooding are
geophysical events that threaten lives, property, and other assets of human settlements (FEMA).
After decades of migration from rural to urban space, nearly half of humanity lives in cities. It is
predicted that this figure will skyrocket to 75 percent by 2050 (Patrick 2012). Unprecedented
urbanization is creating new economic opportunities, but it is also placing extraordinary strains

4
on national and municipal authorities that struggle to provide the marginalized inhabitants of
these chaotic agglomerations with basic security, sustainable livelihoods, and modern
infrastructure (Patrick 2012). When it comes to natural disasters, today's burgeoning urban
centers will increasingly be on the front lines. Vulnerability and exposure to natural hazards is
increasing as more people move into urbanized areas. Since 1970, the world’s population has
grown by 87 per cent. During the same time, the proportion of people living in flood-prone river
basins increased by 114 per cent and on cyclone-exposed coastlines by 192 per cent. More than
half of the world’s large cities, with populations ranging from 2 to 15 million, are located in
areas of high earthquake risk. In addition to disaster vulnerability, the main drivers of risk are
poorly planned and managed urbanization, environmental degradation, poverty and weak
governance (Szlafsztein and Sterr 2007; Levy 2015). Disaster vulnerability is reduced as a direct
product of sound development (United Nation International Strategy for Disaster Reduction
2015). Poorly planned and managed urbanizations by local authorities, which increasingly occurs
in peripheral zones of marginal habitation, leaves hundreds of millions of people at the risk of
natural disasters (Sanderson, Kayden, and Leis 2016). It is important to realize the importance
and crucial role of disaster management, resilience and knowing the risks and vulnerabilities in
order to bring down the impact of natural hazards in this rapidly changing urban environment
(Sanderson, Kayden, and Leis 2016). It can not only prevent the loss of lives, but also the huge
economic loss which is a result of breakdown of the finest infrastructure (housing, roadways,
physical and social infrastructure etc.), which took many years to be built. The relationship
between disasters and development is indeed very intense. While there is universal acceptance
that disasters can damage, erode and destroy development gains, there is a very limited

5
recognition of the role that different approaches to development play in creating or increasing
vulnerability.
The level and quality of development and planning to a large extent, determines the way
in which hazards impact people, structures, and economies (Sanderson, Kayden, and Leis 2016).
There is growing evidence of the intensity and frequency of hazard related extreme events on
cities. It is therefore critical that disasters should be seen through the lens of risk reduction and
resilience construction during the planning process of a city, rather than just as a response to a
one-off disaster event. In today’s world of rapidly changing environment, increasing
urbanization, and vulnerability, it is very crucial to embed the concept of resilience into the
development planning of our cities in order to have a sustainable development. Disaster
resilience is thus a desired attribute that cities should possess throughout their planning and
management processes. Systems that increase and incorporate resilience, enable cities to
withstand shocks from man-made and natural disasters. It is very crucial to incorporate resilience
in planning and development of city’s infrastructure as disasters usually occur very abruptly
giving no time to react or to take immediate mitigation actions. Therefore, resilience should be
mainstreamed at the very early stages of development to make the final product strong, robust,
and flexible to withstand shocks and stresses. Resilient cities are able to cope with disaster
situations as they are robust and prepared for any such situation beforehand only (Hayashi,
Suzuki, Sato, and Tsukahara 2016). Disaster mitigation plans that incorporate the resilience
concept help cities quickly bounce back to normal functioning once a disaster passes away.
Before planning to establish a resilient city framework, we must understand the basic variety of
disasters such as earthquakes, floods, volcanic eruptions, avalanches, landslides etc. We face
such disasters caused by natural hazards because we are setting cities dangerously close to
6
natural hazards due to rapid urbanization, and we cannot handle their impact with available
resources and the way they are intentionally allocated across the city while ignoring geographic
and societal aspects of the city. A focus on disaster resilience in the process of urban planning
forms a basic backbone structure for a resilient and safe city.
Urban planning allows towns, cities and settlements to be analyzed and planned as a
system comprised of various sectors and institutions (Levy 2015). This is crucial in coping with
interdependencies among failures in lifeline infrastructure in disaster situations. Urban planning
with integrated disaster resilience also contributes to preventing secondary disasters and delays
in the rehabilitation and recovery process. While a primary disaster is the initial or triggering
event, a secondary disaster is a consequence of the original occurrence (FEMA; H.O.P.E 2010).
The planning practice can reinforce stakeholder relationships and integration at different levels
and institutional frameworks and partnerships; it also helps address risk reduction and resilience
in a holistic manner across public and private actors such as particularly planners, architects,
engineers, disaster and risk reduction management specialists, and communities. It is important
to strengthen the legal planning frameworks of risks in master plans and land use codes in urban
areas to support resilience. Cities, towns, and settlements are expanding, and village settlements
are becoming towns and cities. A legal framework within development plans can guide future
planning and integration of disaster risk reduction (UNISDR, 2012). Unless cities and its citizens
have a clear understanding of the risks they face, planning for meaningful disaster risk reduction
may be ineffective and worthless. Risk analysis and assessments are also essential prerequisites
for informed decision-making, prioritizing projects, planning for risk reduction measures, and
identifying high, medium or low-risk areas, according to their vulnerability and the cost
effectiveness of potential interventions (Hayashi, Suzuki, Sato, and Tsukahara 2016). A well-
7
maintained database of disaster losses and a comprehensive GIS to map hazards, vulnerabilities,
the exposure of people and assets and capacities will provide the foundation for the assessment
of risk and vulnerability (Szlafsztein and Sterr 2007; Bartholomew 2006). Planning helps to
include risk and vulnerability mapping in land use suitability in order to plan for a resilient future
development. This inclusion not only inculcates awareness about the disaster, but also makes the
communities aware of the existing ways to minimize the impact of disasters. It enhances their
knowledge about safe zones, mitigation measures, resilient building material to be used, and
other useful knowledge. Within this context, strong disaster resilience is a product of the
integration of communities’ needs and emergency preparedness with emphasis on the complex
relationship between human activities and hazardous physical events. This integration is possible
throughout the urban planning process. This study focuses on the development of an assessable
spatially explicit model to prioritize disaster mitigation criteria by investigating the multiple
factors that contribute to deterioration of the resilience of a city.
1.3 Vulnerability, Resilience, and Adaptation
In this study, I define vulnerability as the inability to deal with the resulting hazardous
event, and some risk combined with the level of social and economic liability (Birkmann 2006;
Corbin 2015; Zahran, Brody, Peacock, Vedlitz, and Grover 2008). Vulnerability is a
characteristic of individuals or groups of people that inhabit a given geographic, social, and
economic space. Individuals or groups of people are differentiated according to their varying
position in society into more or less vulnerable population (Birkmann 2006; VCOSS 2014). For
example, people and groups that are socioeconomically disadvantaged, such as, poor and
immigrants, are frequently consigned to more vulnerable locations. The vulnerability and
resilience concepts are a measure of translating known everyday-process of the political and

8
economic separation of people into a more specific identification of those who may be at risk in
hazardous environments (Cannon 1994). It is not that the victims of disasters were vulnerable to
that hazard, as is demonstrated by them being its victim; there are particular characteristics of
different groups of people, meaning some people avoid disaster and others do not because of the
impact of a particular type of hazard of a given intensity.
Within the disaster risk community, resilience is defined as the ability of individuals,
communities, organizations, and states to adopt to and recover from hazards, shocks, or stresses
without compromising long-term prospects form development (GSDRC 2014). More specifically,
scholars found consensus on two important points of resilience: first is that resilience is better
conceptualized as an ability or process than as an outcome; Second, resilience is better
conceptualized as adaptability than as stability (Brown and Kulig 1996/97; Pfefferbaum et al.
2005; Handmer and Dovers 1996; Waller 2001). For example, the resilience of system in general
depends on one component or part of the system being able to change or adopt in response to the
changes happened in other components. Therefore, the system would fail to function if that
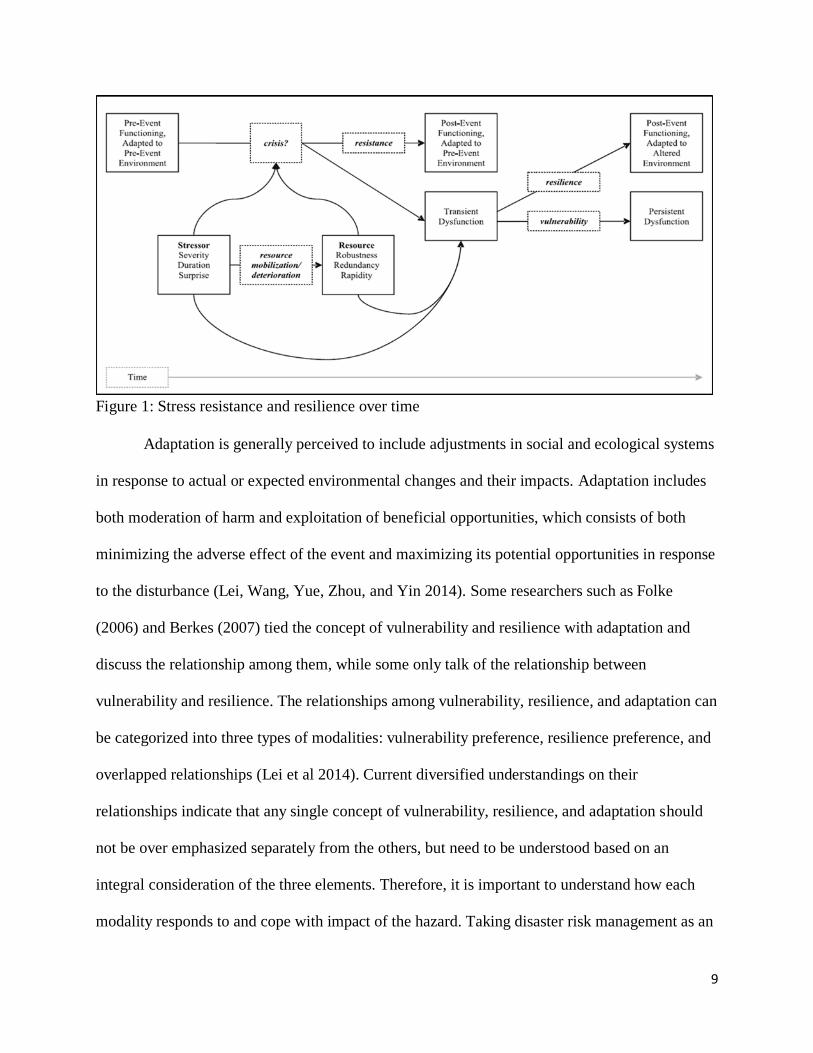
component remined stable (Adger 2001). Figure 1 visualizes stress resistance and resilience over
time. Resilience occurs when resources are sufficient, robust, or rapid to counteract the effects of
the stressor. While resistance is the ideal outcome, the process that produces adapted outcomes is
resilience. Faster the return to pre-disaster functioning, the greater the resilience. George
Bonanno (2004) characterized recovery as involving a period of dysfunction lasting several
months or more followed by a gradual return to pre-disaster functioning. On the other hand, he
defined resilience trajectories as something that involve transient perturbations lasting as long as
several weeks involving a stable trajectory of healthy functioning.
9
Figure 1: Stress resistance and resilience over time
Adaptation is generally perceived to include adjustments in social and ecological systems
in response to actual or expected environmental changes and their impacts. Adaptation includes
both moderation of harm and exploitation of beneficial opportunities, which consists of both
minimizing the adverse effect of the event and maximizing its potential opportunities in response
to the disturbance (Lei, Wang, Yue, Zhou, and Yin 2014). Some researchers such as Folke
(2006) and Berkes (2007) tied the concept of vulnerability and resilience with adaptation and
discuss the relationship among them, while some only talk of the relationship between
vulnerability and resilience. The relationships among vulnerability, resilience, and adaptation can
be categorized into three types of modalities: vulnerability preference, resilience preference, and
overlapped relationships (Lei et al 2014). Current diversified understandings on their
relationships indicate that any single concept of vulnerability, resilience, and adaptation should
not be over emphasized separately from the others, but need to be understood based on an
integral consideration of the three elements. Therefore, it is important to understand how each
modality responds to and cope with impact of the hazard. Taking disaster risk management as an

10
example, comprehensive understandings on the internal relationships among vulnerability,
resilience, and adaptation, and their linkage with disaster risk are critical base of scientific risk
analysis and robust strategies (Nelson 2011, Lei et al 2014).
Vulnerability preference traditionally holds a standpoint that vulnerability is its most
basic and inclusive attribute of a socio-ecological system (SES) met by an external stress or
hazard. It integrates resilience and adaptation into response capacity under a vulnerability
framework (Gallopin 2006). In this viewpoint, it suggests that reducing vulnerability to hazards
is the fundamental approach to disaster risk mitigation (O’Brien et al 2004). Resilience
preference views resilience as the key factor to mitigating the risk of a SES that was confronted
with outside forces (external stresses) or natural hazard (Lei et al 2014). It considers resilience as
a response capacity to external shocks or changes, including both in short-term coping capacity
and long-term adaptive capacity (Lei et al 2014). Finally, overlapped relationship framework
uses vulnerability focusing on the pre-disaster situation of a system and resilience as process
focusing on the during- and after-disaster situation of a system. In this framework, adaptive
capacity depends on scale and place that differs from location to location, among different social
groups and individuals over time. Note that in this study, vulnerability emphasizes the situation
of a system and social demographic attributes before a disaster while resilience refers to a
process, mainly focused on the stages of during and post-disaster, which helps to enhance the
abilities of the system to resist and recover from hazards. Although vulnerability and resilience
defined in this study constitute different but overlapping characteristics, and the vulnerability and
resilience concepts are individually linked through adaptability, this study aims to achieve
identification of disaster vulnerable areas and how reducing vulnerability to natural hazards

11
contributes to consolidation of resilience towards hazardous events. Therefore, this study adopts
vulnerability preference framework.
1.4 Evaluating Vulnerability
Despite the fact that the international community does not establish guidelines on how to
create indicators or system to assess vulnerability and resilience, in the past decade, substantial
attention has been given to the development of tools to measure the vulnerability, resilience
communities to disasters. In order to quantify these concepts, particular attention has been given
to the composite indices, mirroring their deployment in other fields such as sustainable
development (Beccari 2017). This indicates that evaluating degree of a community’s
vulnerability and resilience to natural hazards requires a clear understanding and definition of it,
as well as an assessable framework that allows us to evaluate the strength of emergency
preparedness of a city with regard to natural hazards. Beccari (2017) analyzed 106 composite
indicator methodologies to understand the range and depth of practice. The result of his research
identified five key approaches with the use of hierarchical or deductive indices being the most
common (Beccari 2017). The 106 methodologies used total 2298 unique variables, more
specifically, approximately two thirds of the methodologies used less than 40 variables (a
minimum of 2 variables and a maximum of 235 variables). Classification of variables used in
each methodology is as follows: 34% related to the social environment, 25% to the disaster
environment, 20% to the economic environment, 13% to the build environment, 6% to the
natural environment, and 3% to other indices; However, variables specifically measuring
mitigation effort or preparedness for disasters only comprised 12% (Beccari 2017). A key
obstacle in creating composite indicators is the availability of quantitative data related to the
conceptualization of vulnerability and resilience with respect to natural hazards. Thus, measuring

12
resilience and vulnerability in a truly quantitative way still appear to be very challenging
(Beccari 2017).
The vulnerability perspective first assumes that a disaster occurs when it strikes an
underprivileged population. Noy and Yonson (2018) argue that there is a new paradigm of
discourse on disaster that disasters triggered by natural hazards have been perceived as unnatural
occurrences brought about by a confluence of societal factors. This indicates that different
populations encounter different levels of risk and vulnerability, and the sources of vulnerability
is diverse such as population distribution and social diversity. King (2014), in a research by
Victorian Council of Social Services (VCOSS), similarly argues that populations facing one or
more disadvantages are at greater risk of becoming socially more vulnerable in an emergency.
However, it is important to note that not everyone who faces individual disadvantages are
socially vulnerable in emergency situations caused by a hazard; even disadvantaged communities
can be resilient and hold unique skills, knowledge and resources they can utilize in the time of a
disaster. Therefore, identification of social causes linked directly with disaster risk would help
identify those vulnerable (at-risk) populations specifically when hazards occur. Several
literatures on social vulnerability and disaster risk management suggest that the following types
of social vulnerability must be considered: poverty, refugee and migrant populations, people with
a disability, young people and children, women, housing quality, people with lack of education
(King 2014; Nivaran 2016; PRB 2011). In addition to social vulnerability, economic
vulnerability and built environment interrelating with the hazard itself and the exposure of
populations and economic systems are also considered critical factors to determine the resulting
disaster impacts (Noy and Yonson 2018). For example, economic vulnerability and economic
resilience are shaped by the degree and quality of development governance and features of

13
development such as rapid urbanization and inequality. Built environment and existing
conditions such as geography and geology of study area are also critical vulnerability indicators
as conditions like eligibility for federal grants and building age directly impact the planning of
mitigation efforts. In applying a GIS-based MCE model, determining the weights for this study
that are applied to each evaluation factor relied on the subjective opinions of the Emergency
Preparedness Coordinator from the City of Bothell.
1.5 Paradigm Shift in Building Resilience
Cannon (1994) argues that conventional analysis of disaster considers a direction of
causality that proceeds from hazards through spatial variability to the impact on society.
Explanation of disaster causality is only possible by understanding the ways in which social
systems themselves generate unequal exposure to risk by making some group of people more
prone to hazards than others. To comprehend the relationship between humans and nature, it is
more important to distinguish how human system themselves accommodate people in relation to
each other and to the environment than to interpreting natural systems. Following Cannon’s
argument, Birkmann (2006) stresses that the current trend in promotion of disaster-resilient
societies is a paradigm shift from quantification prediction, analysis, and modification of the
hazard itself to the identification, assessment, and ranking of vulnerabilities. Since the 1980s, the
dominance of hazard-oriented prediction strategies based on technical interventions has faced
challenges by the alternative approach of using vulnerability as the essential for risk reduction.
The growing awareness that modified social systems and structures could cause a disaster out of
a situation where otherwise may not have been a disaster, was the catalyst of today’s
understanding that human activity itself has established the conditions for natural hazards to
transform into disastrous events had become a common understanding. This approach combines

14
the susceptibility of people and community exposed with their social, economic, and cultural
abilities to cope with the damage that could occur (Hilhorst and Bankoff, 2004). This study looks
to reinforcing the current conditions in Bothell surrounding four critical dimensions of a
consistent system of resilience indicators – vulnerable populations, critical and environmental
infrastructure, social factors, built infrastructure – identified by National Research Council (NRC
2012). Although measuring resilience remains a challenge in many cases, making adjustments
that directly influence the way these four resilience dimensions are exposed to natural hazards
benefits critically for communities to clarify and formalize what the concept of resilience means
and looks like during an emergency for them.
1.6 Recovery vs. Mitigation
Jason Barnosky (2015) points out that unfortunately the United States’ disaster policies
are not well suited for problems caused by natural hazards such as extreme weather events with
links to climate change. The United States disaster policy focuses its resources largely on
responding and recovering from natural disasters after hazards occurred (Barnosky 2015). Policy
analysts from Department of Homeland Security generally talk about five mission areas:
prevention, protection, mitigation, response, and recovery (Brookings 20015). Given
appropriation based on the possible threads and hazards people face, public officials squeeze
resources (people and funding) between these five areas. When public officials deal with
terrorism, prevention part is their main focus. However, prevention is not a primary option in
cases of natural hazards. Instead, focuses are put on the other four areas (Brookings 2015). In
attempt to build stronger resilience to natural hazards, which requires much attention to
mitigation efforts prior to hazardous events than post-event recovery and rescue efforts, this
study seeks resolutions that contributes to safer community that takes people out of harm’s way

15
and prevents stressors from the natural hazard from reaching to vulnerable populations/areas.
Thus, distinguishing the features and outcomes of recovery-focus and mitigation-focus solutions
becomes important. Federal Emergency Management Agency (FEMA) spends much of its time
assisting states and communities after they have been struck by hazardous events. For instance,
FEMA obligated more than 3.2 billion for Hazard Mitigation Grant Program (HMGP). In the
wake of a major event, emergency manager, firefighters, and law enforcement conduct search
and rescue efforts, then if the damage is serious enough, in addition to FEMA’s individual
assistance through its public assistance program, other agencies such as the Department of
Housing and Urban Development (HUD), the Small Business Administration, and the
Department of Transportation provide with recovery assistance (Barnosky 2015). While federal
and state-wide policies tend to focus on recovery efforts, it’s well established that there are a
number of actions local communities can take to reduce the impact of natural hazards. For
example, well-designed building codes can ensure that structures can withstand the damage of
earthquakes or floods; residential and community safe rooms can shield people from wind and
debris; and homes can be elevated to reduce flood damage. These steps build resiliency against
disasters. This means that there’s less to repair and rebuild— and less need for costly response
and recovery efforts.
The review of literature reveals the importance of integrating the concept of vulnerability
and resilience in emergency preparedness and disaster risk management. It also points at the
complex relationship between human activities and hazardous physical events and exposes the
weaknesses of the existing risk management practices that emphasize on technical interventions
and recovery-focused policies. It also revealed how social vulnerability is often exacerbated by
the lack of access to resources after a disaster. Within this context, this study addresses the

16
following general research question: how can the City of Bothell measure its disaster
vulnerability and implement or prioritize it in their disaster mitigation planning? I hypothesize
that cities can prioritize disaster mitigation by identifying vulnerable areas to natural hazards and
evaluating the degree of their vulnerability in comparison with other areas of the city.
2. Study Area
2.1. Socio-economics and demographics
This study focuses on the City of Bothell (Figure 2). Bothell is a city in Washington State,
along the Cascadia subduction zone, which is an area highly susceptible to various types of
natural hazards. The City of Bothell is located across two counties: the north-central region of
King County and the south-central region of Snohomish County. The city has evolved from a
logging town to an agricultural community to a bedroom suburb to a balanced city with
residential areas and business centers (The City of Bothell 2010). The Emergency Preparedness
department assists the city departments in the development and implementation of the hazard
mitigation plan. Bothell has a population of 43,153 people with a median age of 37.5 and median
household income of $86,167. Between 2015 and 2016 the population of Bothell grew at 4.72 %
increase and its median household income grew at 5.12 % increase. The population of Bothell
consists of 69.4 % White, 13.4 % Asian, 8.57 % Hispanic, and 0.23 % of the people in Bothell
speak a non-English language. 12 % of overall population are 65 years old or older while 22.7 %
are younger than 18 years old. Males in Bothell have an average income that is 1.37 times higher
than the average income of female residents, which is $52,973. 6.69 % of the population in
Bothell live below the poverty line, a number that is lower than the national average of 14 %.
The largest living in poverty is female 18-24, followed by female 25-34, and then female 35-44.

17
In 2016, 66.6 % of the housing units in Bothell were occupied by their owner, which is higher
than the national rate (63.6 %) and the state rate (62.4 %) (Data USA 2016).
Figure 2: Bothell City Limits & Census Tracks

18
2.2. Natural disasters and policy
As disaster preparedness has become a popular topic among local and state-wide media
and residents, it is critical to conduct comprehensive analysis of what we need to prepare for and
how to do so more effectively in case of a natural disaster. Relevant literatures revealed that the
probability of large scale natural hazard occurrence, especially destructive quakes and associated
tsunami damages, still remains relatively higher in offshore of Washington and northern Oregon
than farther south along the subduction zone although many efforts to mitigate the disaster risk.
The City of Bothell is not an exception among other cities in the greater-Seattle area. In 2014,
Rep. Suzan DelBene who represents Bothell as well as Kenmore in Congress, sent a letter to the
House Appropriations Committee addressing the need for additional funding in the effort to
mitigate landslide risks. Both King and Snohomish counties where Bothell is located
acknowledge that they are exposed to various natural and unnatural hazards that potentially lead
to disaster and social disfunction (King and Snohomish County 2018). In 2016, Snohomish
County released a statement to reflect on National Preparedness Month in September “… an
important step Snohomish County residents can take to prepare for emergencies is to understand
potential hazards where they live, work, and play… It also offers guidance about how to reduce
the effects of natural disasters such as floods, earthquakes, or volcanic eruptions” (Snohomish
County 2016). Following the statement, Jason Biermann, Director of Snohomish County’s
Department of Emergency Management, (2016) said “I encourage everyone to prepare their
families and homes for natural disasters, since even minimum preparation can have maximum
benefit”. Although the numbers of reports indicate that it is a matter of time until a catastrophic
natural hazard hits the Pacific Northwest region, there is no holistic review of current emergency

19
preparedness at local municipal level in the Puget Sound region, including Seattle and its
neighboring cities.
On May 1, 2015, the U.S. Department of homeland Security’s Federal Emergency
Management Agency (FEMA) approved the King County Regional Hazard Mitigation Plan
(KCRHMP) as a multi-jurisdictional local plan including the City of Bothell (Bothell Disaster
Mitigation Plan 2010). Meanwhile, the City of Bothell had developed its own hazard mitigation
plan as an Annex to the KCRHMP, which was last updated in June 2010. To meet the FEMA’s
requirements for local mitigation plan, the City of Bothell sorted the Hazard Mitigation Plan into
five categories: Planning Process, Planning Area, Risk Assessment, Mitigation Strategy, and
Plan Mitigation Process and Adoption. In the mitigation plan, the City of Bothell conducted
identification and analysis of the hazards that would affect Bothell, as well as the city’s
vulnerability to future events. It concludes that Bothell experiences the same types of natural and
unnatural hazards as much of King County and considers the followings as hazards that could
potentially impact the City of Bothell: severe weather, flooding, landslides, earthquakes, civil
disorder, terrorism, fire hazards, hazardous materials, transportation, cyber-terrorism (Bothell
Disaster Mitigation Plan 2010). Bothell has used an adjective description1 (high, moderate, low)
to indicate its vulnerability to the potential impact of hazards. It is determined by the ratio of
population, property, commerce, infrastructure and service at risk, relative to entire city while
lacking some significant indices such as economic and social aspects of the city. In this context,
this study aims to compliment the Bothell Disaster Mitigation Plan by adding new dimensions to
fulfill the inadequacy in its vulnerability evaluation process. Although there are multiple
resources available to residents such as King County Hazard Mitigation Plan website that offers
1 “A High rating would indicate a significant impact throughout the entire City, a Moderate rating would indicate an
isolated significant impact or a moderate impact throughout the entire City, and a Low rating would indicate an
isolated moderate impact in a selected area or a limited impact throughout the City” (Bothell 2010)

20
executive summary of the plan and frequently asked questions by its residents as well as hazard
maps, they do not address local community level emergency preparedness with a detailed
disaster mitigation plan that directly contributes to strengthening risk and disaster mitigation.
Therefore, the city government of Bothell must develop capacity to assess its ability to withstand
natural hazard and how to improve resilience to natural hazards.
3. Methods and Data
3.1 Multi-Criteria Evaluation
The use of multi-criteria decision analysis allowed researchers to conduct proper analysis
of risks, an examination of where previous effort had been applied, and a focus on large gaps in
the industry’s risk assessment. Multi-Criteria Evaluation (MCE) is useful to suitability problem
such as identifying best location or most likely location of phenomenon, using multiple layers of
information. Typically, decision making on alternatives for risk reduction planning starts with an
intelligence phase for recognition of the decision problems and identifying the objectives
(Eastman 1999). Development of the alternatives and assigning the variable by decision makers
to each alternative are employed to the design phase. The final phase evaluates the optimal
choice by comparing the alternative, defining indicators, assigning a weight to each and tanking
them. According to Hester and Velasquez (2013), the newest trend with respect to MCE method
is to combine two or more methods to make up for shortcomings in any single particular method.
MCE allows researcher to analyze a series of variables with ways to rank them from the most
preferable to the least preferable. The main challenge of MCE application in general is to
determine criteria weights. Different researchers are likely to give different weight on a criterion,
making criteria determination could be time consuming and costly. A traditional weights
approach is allowing decision maker to give his/her preferences with respect to the evaluation
21
criteria incorporated into the decision model. Another way of assigning weights is direct
estimation of their relative importance. The outcome of MCE is frequently a set of weights
linked to the variables used indicating the preference of objectives relative to each other
(Musungu, Motala, and Smit 2012).
The integration of GIS into multicriteria decision analysis has gained significant interest
over the last couple decades. GIS-based MCE has been vital in advancing GIScience in two
major fields: spatial decision support and participatory GIS. Application of GIS to MCE has
frequently been used in producing new information by spatial analysis of existing data and
combination of multiple data sources. Spatial modelling using GIS has been applied when
finding for areas suitable for a specific land use, identifying populations that fall into specific
conditions, or for natural resources and/or species of interest. The outcome of GIS-based MCE is
generally a map depicting locations fulfilling all the conditions set with threshold values. In GIS,
there are typically two ways to approach MCE. First, all criteria are converted to Boolean
statements of suitability to make decisions under consideration. This approach is very common
with vector software system but is also widely used with raster systems. Second, quantitative
criteria are evaluated as fully continuous variables rather than collapsing them to Boolean
constrains. Such criteria are usually called factor and varying degrees of suitability for the
decision under consideration. Thus, for instance, proximity to roads would be treated not as an
all-or-none buffer zone of suitable locations, but rather, as a continuous expression of suitability
based on a special numeric scale (e.g. 0–1, 0–100, etc.) (Eastman 1999). The process of
converting data to such numeric scales is most commonly called classification (Voogd 1983).
3.2 Model Implementation
22
Based on the review of literature, the selection of social, economic, and environmental
variables that correspond to the broader range of definitions of vulnerability becomes important.
More specifically, factors that lower one’s social status by preventing access to social system –
such as, gender, ethnicity, age, disability, and level of educational attainment – are commonly
examined to evaluate social aspects of disaster vulnerability. While there are hundreds of
considerable economic factors that influences disaster vulnerability, several frequently-examined
factors includes household income, status of employment, and mobility. Built environment and
existing conditions such as geography and geology of study area are also critical vulnerability
indicators as conditions like eligibility for federal grants and building ages directly impact the
planning and mitigation effort.
All the data used for this research were gathered from PolicyMap (PolicyMap2 2018) at
the census block level (N= 49). PolicyMap offers ready-to-use online mapping with data on
demographics, real estate, health, jobs and more in communities across the United States. It is an
online platform that enables government, commercial, non-profit and academic institutions to
access data about communities and markets across the US. It is a common destination for
researchers to find the right data for their research, market studies, business planning, site
selection, grant applications and impact analysis. PolicyMap relies on more than hundreds of
data sources to collect its data including U.S. Census, Administrative Office of the U.S. Courts,
FEMA, HUD, IRS, etc. A few limitations in collecting data included maintaining consistency of
pre-defined location at census block level. This narrowed the range of available data sets and
public records. A strategy of building resilience involves more than changes to physical
infrastructure. Increasingly, governments and planners are recognizing the importance of social
infrastructure such as demographic of residents themselves, conditions they live in, institutions
2 https://washington-policymap-com.offcampus.lib.washington.edu/maps
23
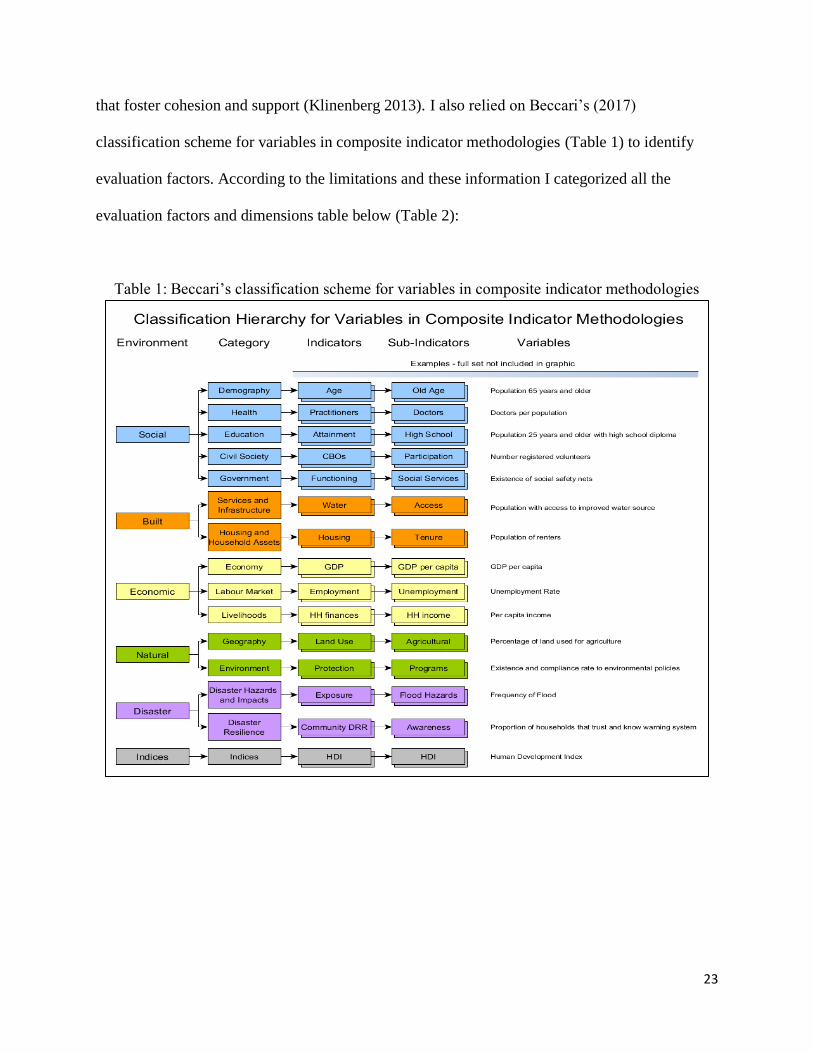
that foster cohesion and support (Klinenberg 2013). I also relied on Beccari’s (2017)
classification scheme for variables in composite indicator methodologies (Table 1) to identify
evaluation factors. According to the limitations and these information I categorized all the
evaluation factors and dimensions table below (Table 2):
Table 1: Beccari’s classification scheme for variables in composite indicator methodologies

24
Table 2: Factors used for the evaluation of vulnerability and resilience at the census block level
I implemented the MCE models using a raster GIS framework and map algebra. The
weights were discussed with the Emergency Preparedness Coordinator of the City of Bothell
who is considered an ‘expert’ in the field. The weights total must not exceed 1, which represents
100% (e.g. 0.25 = 25%, 0.0833 = 8.33%). As indicated by the expert, the highest weight of 25 %
was assigned to “population who are 65 years old and older” for the social dimension map; the
highest weight of 40 % was assigned to “average number of vehicle per household” for
economic dimension map; and the highest weight of 40 % was assigned to “rental occupancy
rate” and “building age”. I used the following model specifications:
Social Dimension (MCE 1):
• F*0.0833 + 65yrs*0.25 + 18yrs*0.0833 + Black*0.0833 + Asian*0.0833 + AIAN*0.0833 + Non-
White*0.0833 + HS*0.0833 + SomeHS*0.0833 + 9th*0.0833
Where:
F Female Population (%)
Dimension Category Evaluation Factor County Pre-Defined Location
King County Census Tract Level
Snohomish County Census Tract Level
King County Census Tract Level
Snohomish County Census Tract Level
King County Census Tract Level
Snohomish County Census Tract Level
King County Census Tract Level
Snohomish County Census Tract Level
King County Census Tract Level
Snohomish County Census Tract Level
King County Census Tract Level
Snohomish County Census Tract Level
King County Census Tract Level
Snohomish County Census Tract Level
King County Census Tract Level
Snohomish County Census Tract Level
King County Census Tract Level
Snohomish County Census Tract Level
King County Census Tract Level
Snohomish County Census Tract Level
King County Census Tract Level
Snohomish County Census Tract Level
King County Census Tract Level
Snohomish County Census Tract Level
King County Census Tract Level
Snohomish County Census Tract Level
King County Census Tract Level
Snohomish County Census Tract Level
King County Census Tract Level
Snohomish County Census Tract Level
King County Census Tract Level
Snohomish County Census Tract Level
Natural Hazard Map Hazard History N/A Bothell City Level
Zoning Map Zoning N/A Bothell City Level
Unemployment
Household Income
Vehicles per Household
Built Environment Map
Building Age
Rental Occupancy Rate
CDBG Eligibility
Economic Map
Population 65 and older
Social Map
Sex
Ethnicity
Age
Education Attainment
Female
Black
Asian
Non-White
American Indians and Alaskan Natives
Average number of vehicles per household
Median building age
Rental Occupancy Rate
Community Development Block Grant Eligibility
Population under 18 years old
Less than 9th grade
Some high school
High school
Unemployed people (16yrs-older)
Median income of a household

25
65yrs Residents who are 65 years old and older (%)
18yrs Residents who are 18 years old and younger (%)
Black Black Population (%)
Asian Asian Population (%)
AIAN American Indians and Alaskan Natives Population (%)
Non-White Non-White (Hispanic) Population (%)
HS Residents whose highest education attainment is high school diploma (%)
Some HS Residents whose highest education attainment is some high school (%)
9th Residents whose highest education attainment is less than 9th grade (%)
Economic Dimension (MCE 2):
• Vehicle*0.4 + HHI*0.3 + Unemployment*0.3
Where:
Vehicle Average number of vehicle per household
HH Income Household income ($)
Unemployment Unemployment Rate (%)
Built Environment (MCE 3):
• Rental Occupancy Rate*0.4 + Average Building Age*0.4 + CDBG Eligibility*0.2
Where:
ROR Rental Occupancy Rate (%)
Building Average Building Age (year)
CDBG Community Development Block Grants Eligibility (eligible/not eligible)
In addition to descriptive models depicting disaster vulnerability of Bothell created the
city’s social, economic, and built environment characteristics at the census block level, I mapped
the natural hazards in Bothell (Figure 3) from 2003 to 2017 and the city’s zoning map (Figure 4)
in order to provide more holistic disaster mitigation plan. Multiple existing conditions including
the city’s zoning, floodway, floodplain, known landslides from the past, and landslide-prone
deposits were visualized using ArcGIS v. 10. 5 (ESRI 2018). Data were downloaded from the
city of Bothell website. Zoning units were categorized into twelve groups based on their zoning
description (e.g. multiple residential areas were all grouped together regardless of their size). The
environmental conditions are taken into account when analyzing the level of disaster
vulnerability in comparison with other maps.

26
Figure 3: Natural Hazard Map of Bothell showing the past landslides and floods
Figure 4: Bothell’s zoning in 2018 (eliminate Zoning Unit label from the legend)

27
3.3 Data Processing
Since the city of Bothell is located within King and Snohomish counties, I prepared two
data sets that contain the same variables for each section of the city within the corresponding
county. Then, I have combined the data sets into one covering the entire city of Bothell. Finally,
all the data were imported into ArcGIS and joined with the shapefile that captures all the blocks
within Bothell. Due to some census blacks along the city border that share its territory with other
cities, all the blocks that share its territory with Bothell and whose borderline touches Bothell’s
city limits were included in this study. However, analysis of results focuses on phenomenon
within the Bothell’s city border (see Figure 2). Next, as the variables do not share a common
measuring unit, their values for each dimension must be standardized. Therefore, before
conducting the geovisualization process, Z-scores34 of the variables were calculated using the
equation below:
Z-score = (X - µ) / 𝜎
Where X is the evaluation factor being calculated; µ stands for the mean of the evaluation
factor; and 𝜎 is the standard deviation for the evaluation factor being calculated, which was
calculated by ArcGIS (Table 3). For CDBG, eligible is 10, partially eligible is 5, and not eligible
received a score of 1. Z score of Building Age, Rental Occupancy Rate, Household Income, and
CDBG Eligibility were multiplied by -1 to reverse the score as higher scorers for these
evaluation factors mean less vulnerable, and lower scores indicate more vulnerability. Z-scores
were used to standardize measurement units. Once all the variables have a standard unit that can
be compared, raster maps were created based on the Z-scores to depict each evaluation factor
3 Z-score is the number of standard deviations from the mean a data point is. 4 Z-score = (X - µ) / 𝜎

28
spatially. Values of all the raster maps were reclassified into 10 levels using an equal interval
classification scheme. Each map shows the highest and lowest Z-score values that measure how
many standard deviations below or above the population mean a raw score is (Figure 5, 6, and 7
as examples).
Table 3: Z-Scores and summary statistics
Factor Mean Standard Deviation
Female 50.9228 3.54633
> = 65 years old 11.6904 7.558699
<= 18 years old 22.9186 4.658966
Education attainment: less than 9th grade 2.2588 3.157124
Education attainment: Some HS 3.232 2.369392
Education attainment: HS 15.1976 5.771322
% of black residents 2.1894 2.818718
% of Asian residents 14.6148 10.03254
% of AIAN residents 0.7282 1.17713
% of Non-White residents 26.3372 11.347292
Median building age 1986.7 9.459915
Rental occupancy rate 26.615 20.492759
Median household income 93164.88 22390.52353
Average # of vehicle/household 1.72 0.693974
Unemployment rate 4.8982 2.99115

29
Figure 5: Z-Score of female ratio at the census block level and natural hazards in the City of
Bothell

30
Figure 6: Z-Score of median household income at the census block level and natural hazards in
the City of Bothell

31
Figure 7: Z-Score of median building age at the census block level and natural hazards in the
City of Bothell

32
3.4 Scenario Planning
Along with MCE, a scenario planning approach was also applied to uncover information
about the city’s future conditions to help communities and local government officials make
decisions. Scenario planning methodology offers analytics to estimate how well existing or
potential plans and strategies will function in meeting important local and regional needs given
different assumptions about the future. In this step, I examined several “what if…” situations by
modifying the original values and weights of each variable to see how changes to each
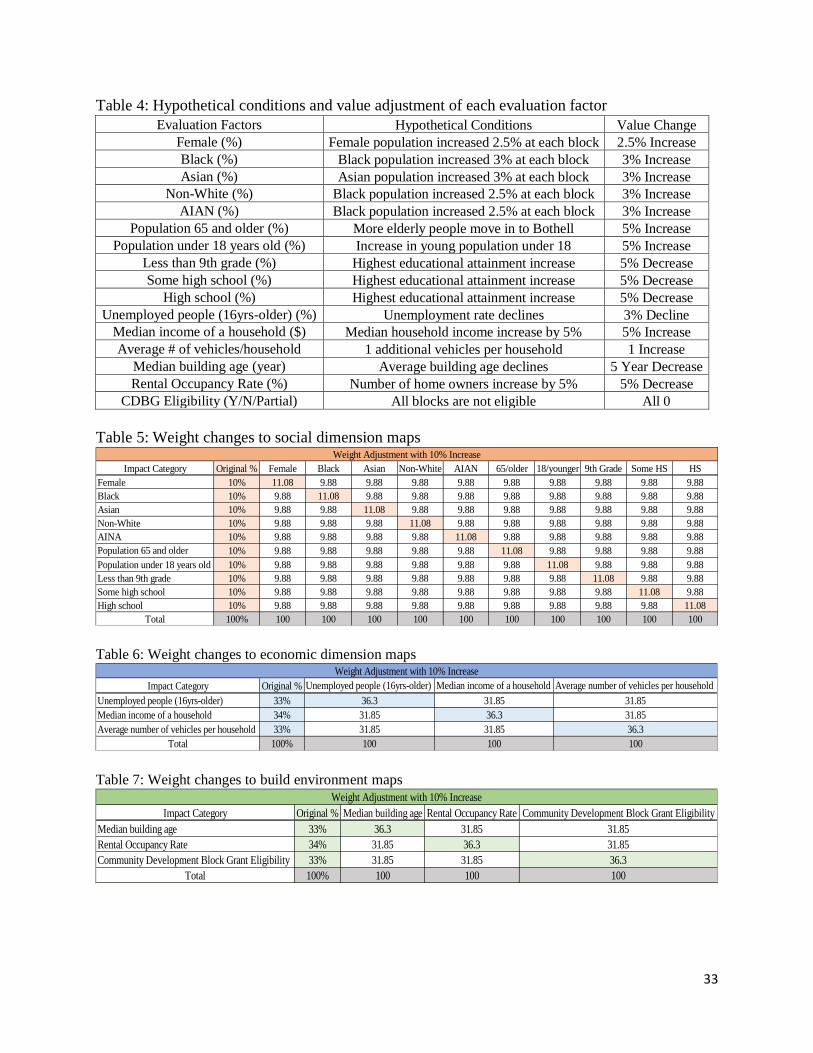
evaluation factor affect the outcome. All the variables weighed by a new set of adjusted weights
with a 10% change adjustment from the original weights5. 10 % weight adjustment was selected
as anything below 10 % change of the original values did not show significant changes in
scenario maps. For the same purpose, a new set of hypothetical values are assigned to all the
variables. Value changes were determined in consideration of realistic standpoint reflecting the
actual growth rate from the past year (for some data were not available) and value changes that
make at least a noticeable change in the final outcome. All maps with the new sets of weights
and values were compared with the status quo disaster vulnerability map to test the sensitivity of
the model and detect if there are any patterns that indicate changes of vulnerability level.
5 While one variable’s weight increases, the weights of the other variables decrease as an overall weight cannot
exceed higher than 100%.
33
Table 4: Hypothetical conditions and value adjustment of each evaluation factor
Evaluation Factors Hypothetical Conditions Value Change
Female (%) Female population increased 2.5% at each block 2.5% Increase
Black (%) Black population increased 3% at each block 3% Increase
Asian (%) Asian population increased 3% at each block 3% Increase
Non-White (%) Black population increased 2.5% at each block 3% Increase
AIAN (%) Black population increased 2.5% at each block 3% Increase
Population 65 and older (%) More elderly people move in to Bothell 5% Increase
Population under 18 years old (%) Increase in young population under 18 5% Increase
Less than 9th grade (%) Highest educational attainment increase 5% Decrease
Some high school (%) Highest educational attainment increase 5% Decrease
High school (%) Highest educational attainment increase 5% Decrease
Unemployed people (16yrs-older) (%) Unemployment rate declines 3% Decline
Median income of a household ($) Median household income increase by 5% 5% Increase
Average # of vehicles/household 1 additional vehicles per household 1 Increase
Median building age (year) Average building age declines 5 Year Decrease
Rental Occupancy Rate (%) Number of home owners increase by 5% 5% Decrease
CDBG Eligibility (Y/N/Partial) All blocks are not eligible All 0
Table 5: Weight changes to social dimension maps
Table 6: Weight changes to economic dimension maps
Table 7: Weight changes to build environment maps
Impact Category Original % Female Black Asian Non-White AIAN 65/older 18/younger 9th Grade Some HS HS
Female 10% 11.08 9.88 9.88 9.88 9.88 9.88 9.88 9.88 9.88 9.88
Black 10% 9.88 11.08 9.88 9.88 9.88 9.88 9.88 9.88 9.88 9.88
Asian 10% 9.88 9.88 11.08 9.88 9.88 9.88 9.88 9.88 9.88 9.88
Non-White 10% 9.88 9.88 9.88 11.08 9.88 9.88 9.88 9.88 9.88 9.88
AINA 10% 9.88 9.88 9.88 9.88 11.08 9.88 9.88 9.88 9.88 9.88
Population 65 and older 10% 9.88 9.88 9.88 9.88 9.88 11.08 9.88 9.88 9.88 9.88
Population under 18 years old 10% 9.88 9.88 9.88 9.88 9.88 9.88 11.08 9.88 9.88 9.88
Less than 9th grade 10% 9.88 9.88 9.88 9.88 9.88 9.88 9.88 11.08 9.88 9.88
Some high school 10% 9.88 9.88 9.88 9.88 9.88 9.88 9.88 9.88 11.08 9.88
High school 10% 9.88 9.88 9.88 9.88 9.88 9.88 9.88 9.88 9.88 11.08
Total 100% 100 100 100 100 100 100 100 100 100 100
Weight Adjustment with 10% Increase
Impact Category Original % Unemployed people (16yrs-older) Median income of a household Average number of vehicles per household
Unemployed people (16yrs-older) 33% 36.3 31.85 31.85
Median income of a household 34% 31.85 36.3 31.85
Average number of vehicles per household 33% 31.85 31.85 36.3
Total 100% 100 100 100
Weight Adjustment with 10% Increase
Impact Category Original % Median building age Rental Occupancy Rate Community Development Block Grant Eligibility
Median building age 33% 36.3 31.85 31.85
Rental Occupancy Rate 34% 31.85 36.3 31.85
Community Development Block Grant Eligibility 33% 31.85 31.85 36.3
Total 100% 100 100 100
Weight Adjustment with 10% Increase

34
4. Results and discussion
4.1 Disaster Vulnerability in Bothell
From the Status Quo Disaster Vulnerability Map of Bothell (Figure 8), vulnerable areas
seem to concentrate on the West half of the city, as well as the central areas of the city where
King and Snohomish county meet together. In addition to the area near the county borderline,
there are highly vulnerable blocks located around Bothell-Everett Highway extending along the
highway from South to North. Although the assessment of degree of vulnerability based on the
evaluation factors does not indicate most of the East half of the city as vulnerable area, overlaid
floodways and flood plains are observed alongside North Creek River, the East side of the
Freeway I-405, and Sammamish River. Most of the landslide-prone deposits and past landslides
are heavily concentrated in the Southern region. By overlaying the zoning map (see Figure 4),
the majority of vulnerable areas are dedicated to residential and commercial development
including the downtown area. Overall, vulnerable areas are spread all over the City of Bothell;
more specifically, vulnerable areas congregate in the Western and Southern half of the city to the
central region of the city along with the county borderlines and the major highways/freeways.
Furthermore, areas near the county and city borderlines are moderately to highly vulnerable
spaces. Given the history of natural hazard and historical records, evaluation of the current
disaster vulnerability of the city concludes that although the degree of vulnerability depends on
each census block, the residents and businesses of Bothell are always at risk of facing natural
disaster.
By breaking down the city as a whole into three dimensions, this study identified that
depending on which lens is used in the analysis of disaster vulnerability, the city can focus on
one or a few areas to put more emphasis over others in prioritizing mitigation. For example, in

35
the overall “Status Quo” map (Figure 8), areas around Bothell-Everett Highway are marked as
either vulnerable or somewhat vulnerable, while three dimensional maps (Figure 9, 10, and 11)
show totally different patterns; Social dimension map shows the West side of the highway as
highly vulnerable; Economic dimension map shows the same area as less vulnerable; and Built
environment map shows the same area as vulnerable to highly vulnerable. Other than these
differences, in social dimension map, the Northern part of the city is less vulnerable than other
two dimensions while some areas near the central region of the city are also less vulnerable than
other two maps. The economic dimension map, overall, shows least vulnerable areas throughout
the map marking the downtown area less vulnerable than the other dimensional maps and the
Status Quo map. Finally, in the built environment map, vulnerable areas are heavily concentrated
in the central to Southern region, and the majority of the rest of the city is highlighted as
vulnerable or highly vulnerable (except a few blocks).

36
Figure 8: Current disaster vulnerability level of Bothell at census block level

37
Figure 9: Disaster vulnerability based on the social characteristics of the City of Bothell at
census block level

38
Figure 10: Disaster vulnerability based on the economic characteristics of the City of Bothell at
the census block level

39
Figure 11: Disaster vulnerability based on the built-environment characteristics of the City of
Bothell at census block level

40
4.2 Interpreting the Sensitivity of the Model
To test the sensitivity of the evaluation model, I modified factors and weights of the MCE
models. Some changes made noticeable differences on the map in comparison to the Status Quo
map while many changes did not drastically affect the outcome with very slight changes on the
map. Overall, four noteworthy changes were observed:
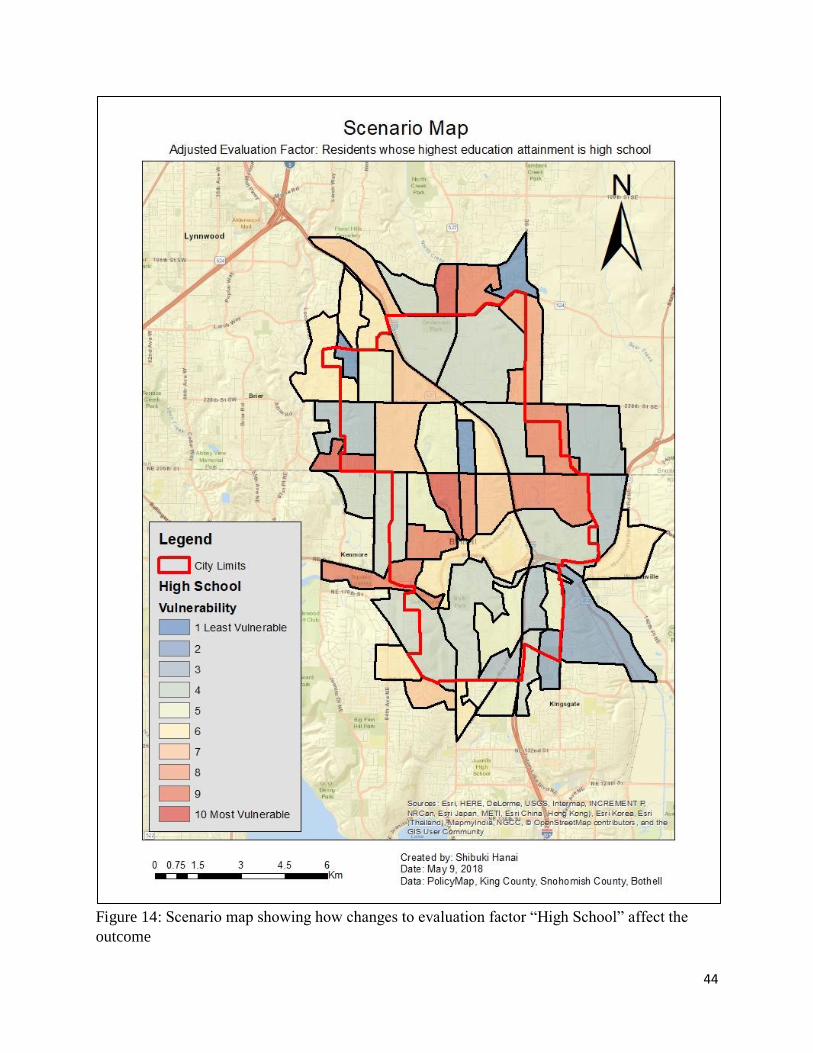
1. Increasing educational attainment, blocks on Snohomish County side of the county
borderline became less vulnerable. Blocks on the left side of I-405 also became much less
vulnerable (Figure 12, 13, and 14);
2. Increasing elderly young population including families with children made some areas
near the city limits more vulnerable – especially Northeast border of the city. However,
the changes made the West side of I-405 less vulnerable (Figure 15 and 16);
3. Decreasing unemployment rate made the Northern half of the city (Snohomish County
side) much less vulnerable; especially alongside I-405 and Bothell-Everett Highway
(Figure 17);
4. Taking away Blocks Community Development Block Grants (CDBG) Eligibility made
areas near county borderline and central to Southern region much more vulnerable
(Figure 18).
Scenario planning revealed several important implications of the model and certain
spatial patterns; whatever the evaluation factor being modified, county borderline and the city’s
periphery areas near the city boundary are always at high risk that resulting natural hazard events
easily transform into disaster except small portion of the Northeastern region of the city; despite
the changes to evaluation factors, areas around I-405 and Bothell-Everett Highway are always at
risk, and they can potentially act as obstacle for many residents during the evacuation phase of a

41
hazardous event. Seemingly less vulnerable areas such as Northeast end of the city only become
exacerbated; if there were changes, the majority occurred in the Snohomish County side of the
city – especially changes to educational attainment and unemployment rate.

42
Figure 12: Scenario map showing how changes to evaluation factor “less than 9th grade” affect
the outcome

43
Figure 13: Scenario map showing how changes to evaluation factor “Some HS” affect the
outcome
44
Figure 14: Scenario map showing how changes to evaluation factor “High School” affect the
outcome

45
Figure 15: Scenario map showing how changes to evaluation factor “18 and younger” affect the
outcome

46
Figure 16: Scenario map showing how changes to evaluation factor “65 and older” affect the
outcome

47
Figure 17: Scenario map showing how changes to evaluation factor “Unemployment” affect the
outcome

48
Figure 18: Scenario map showing how changes to evaluation factor “CDBG Eligibility” affect
the outcome

49
4.3 Recommendations
There are clear steps that local governments can take to mitigate the impact of natural
hazards and to increase resilience in their aftermath. Two important steps are building local
capacity to anticipate risk levels of each community and establishing platforms through which to
request resources from national, state, or provincial governments. As a city that expands into two
counties, developing communication mechanisms and networks that facilitate information
sharing and updating is critical to increase the accuracy of risk assessment. Particular attention
should be placed on locations on the periphery of the city and counties. Local government must
be able to provide residents with appropriate resources to support preparedness efforts before
hazards and with access to resource during and after a natural hazard event. Another priority is a
recalibration or reallocation of resources towards emergency preparedness in consideration of the
city’s population demographic and distribution. Incorporating population growth and distribution
patterns and trends into a mitigation activity is an essential part of planning. For instance,
Bothell’s poverty rate is 6.69%; the top three largest groups living in poverty are female 18-24,
followed by female 25-34, and then female 35-44; senior residents (12%) and children (22.7 %)
who are more exposed to risk in general); there is a significant pay gap between female and male
residents (male residents receive 1.37 times higher on average) although Bothell’s income
inequality index is lower than the national average. This study highlighted that these population-
specific adversities that exist in every corner of the city can be organized into location-specific
conditions. This process allows planners to more holistically assess communities’ needs and
determine primary targets for mitigation efforts with the help of spatial information. In order to
achieve effective emergency preparedness, Bothell must work with multiple stakeholders

50
throughout the planning process to identify known risks, needs, and potential solutions, realizing
the potential of community to contribute to risk reduction.
Recommendation 1:
Development of Administrative Structure for Cross-County Information Sharing
Developing cross-sectoral areas around the city limits and the county borderline for
information sharing and collaborative discussion in building policy networks are crucial steps
toward stronger resilience. In collaboration with King and Snohomish Counties, as well as with
neighboring cities such as Kenmore and Woodinville, Bothell should invest in easily accessible
channels of information and awareness systems about risk. This will provide an opportunity to
build capacity and move away from a resilience of “those-who-we-know” to having actual
shared resources to which all residents have access to. The primary objective here is to leverage
services and stakeholders to support risk reduction and emergency response activities by
delivering the right information to the right people at the right time. For complex emergencies
caused by a natural hazard, governments rely on their own standard operating procedures and
national-level mechanisms in which a specific organization leads emergency response
coordination (such as FEMA or HUD). There are also regional-level mechanisms for sharing
information for emergency response. Both national and regional mechanisms are expected to
integrate seamlessly and complement one another. However, at county and municipal level in
Washington state, there is no consolidated procedures in process for making the best use of the
available resources and no comprehensive guidelines listing the options that are accessible and
applicable to difference scenarios. There will be multitude of actors, interactions, and procedures
needed to develop a structure for efficient sharing of space-based information during an
emergency. Thus, there is a need for a decision-making framework for evaluating initial needs

51
around county borderline and city limits based on disaster scenarios and for the development of a
mechanism to determined roles, values, and limitations of each county/city. Although
information sharing is critical to recovery and search efforts, the structure of information sharing
needs to put emphasis on mitigation activities and on reaching more vulnerable areas to mitigate
the anticipated hazardous event. Given these criteria, new structures of sharing information and
creating a collaborative network must include stakeholder analysis, each stakeholder’s areas of
responsibilities, and the identification of communication platforms.
Recommendation 2:
Incentives for People Living in the South Region to Move to Safer Areas
Bothell needs to create incentives for senior residents and families with children to reside
in less vulnerable areas (e.g. building senior housings in the Northeastern region of the city while
currently many senior housings are concentrated in the Southern region). This is not only a
problem of developing incentives for those at vulnerable areas, but also providing safe spaces for
urban development, avoiding construction in disaster prone areas, and providing recreational
areas with reduced risk. Older adults and children tend to be less mobile and requires longer time
to travel from point A to point B. Therefore, securing evaluation routes and establishing
designated evaluation sites for those vulnerable populations is important. The results of this
research indicate that the entire South region is not appropriate for residential or commercial
activities and building new housing units in this area of the city should be banned as it is very
prone to landslides and floods. Thus, moving those populations to different parts of the city
would make more sense than creating evaluation sites there for two reasons: 1) as shown in the
Status Quo Disaster Vulnerability Map, construction of a designated evaluation site in the
Southern region where many elderly population reside and landslide-prone deposit lays, is not

52
realistic; 2) the Southern region of the city is physically and socially isolated from the rest of the
city by being close to the city limits and Sammamish River running from East to West side. Also,
moving forward, the future development of zoning should incorporate disaster vulnerability of
neighborhoods within the city.
Another approach is to create incentives for developers and regulate their construction
details based on number of units only available to specific populations. In the Northeast region of
the city, creating inclusionary zoning area should be a mandatory requirement or a voluntary
goal to reserve a specific percentage of housing units for family with children and/or elderly.
Aging in Place report by AARP (2015) found that an inclusionary zoning creates communities
with a richer mix of housing sizes and prices (AAPR 2015). Most communities offer significant
incentives to developers in order to offset the cost of development such as providing affordable
housing. Kinds of incentives include parking waiver, zoning variances, tax abatements, fee
waivers, and expedited permitting. These incentives generally come at a real cost to the public
sector (Calavita and Mallach 2009). Incentives such as tax abatements and fee waivers reduce
revenues available to jurisdictions just as cash subsidies to development projects would. Even
planning incentives such as density bonuses, which appear free, result in increased infrastructure
and other public costs (Calavita and Mallach 2009). However, the goal of an inclusionary
requirement here is not to enable developers to earn profits while capturing some share of
“excess profits” for public benefit. Thus, any incentive the City of Bothell can offer to make
development more profitable should also enable the imposition of a higher inclusionary
requirement to attract vulnerable populations. However, communities have to carefully weigh the
costs and benefits of each incentive and evaluate them relative to the cost of meeting criteria to
build stronger resilience to natural hazards.
53
Recommendation 3:
Support and Protection for Small Businesses
There is a need to provide a program to support local-based small businesses. It is
important to keep in mind that most of the small businesses are concentrated in the King County
side of the city, and that reducing unemployment rate lessened the degree of vulnerability in
downtown. FEMA’s research shows 40% of small business never reopen after a disaster due to
loss of employee, client, vendor information, environment changes, and loss of administrative
records (FEMA). Creating a program to assist small businesses to establish emergency policies
for employees, customers, and vendors would mitigate aftermath of natural hazard small
businesses experience and secure the city’s economic resources. The U.S. Small Business
Administration (SBA) offers small businesses a set of general preparedness information
including templates and guidelines on how to identify critical business functions and how to
create an emergency communication plan. While SBA is an easily accessible resources to all
small businesses, development and implementation of new emergency policy or management
plan would require further work. Identifying critical business function during emergency would
involve collaborative works in conjunction with the city’s risk assessment analysis of potential
natural hazards (SBA). Thus, the city should work closely with Greater Bothell Chamber of
Commerce (GBCC) to develop resources that help small business owners independently initiate
development of emergency management plan with input from the city.
This study showcased that decreasing unemployment rates can contribute to reducing
vulnerability of the Northern half of the city, however, keep in mind that on average females in
Bothell between 18 years old and 44 years old economically suffer the most during and after a
disaster as they are the top living group in poverty. Increasing opportunities for females to on
54
more stable employment opportunities and supporting them to progress in their career would also
make sense from the perspective of disaster mitigation as it rises the overall mobility of residents
and financial capability. Advocacy for female residents is interconnected with a robust
mitigation plan; developing resources to narrow the gap underserved females and less vulnerable
populations with attention to spatial information – whether increasing access to education, career
opportunities, or essential life supplies – would lead to stronger resilience to natural hazards.
With this in mind, the areas of improvement include assistance for child care and better
education system, more specifically among women with children. Along with the issue of
improving the current education system, it is critical to provide parents with enough resources in
order for them to focus on their education and work. Therefore, I would suggest a policy that
support women pursuing education. I also recommend for the government to develop a program
geared towards career strategies, professionalization, and tools that women between the ages of
18 and 44 may use to move up within their career or negotiate a higher salary. This way, the
women feel more empowered and in control of higher positions within their career field, and it
leads to better job retention rate, therefore broadening the support for women taking care of the
country. Successful integration of increasing economic capability of female residents and
development of a safeguard for small business can contribute to increased resiliency while
lessening the vulnerability of the Northern half of the city.
Recommendation 4:
Create an Evacuation Model Specific to Neighborhood
One of the recurring image of natural disasters like flood by a hurricane are pictures of
miles of bumper-to-bumper traffic along major freeways leading out of the affected area. Huston,
Texas, for example, residents of Huston rushed into road when Hurricane Rita made its way

55
toward Huston just a few weeks after Katrina devastated New Orleans, which became one of the
largest evacuations in the U.S. history (PBS). The direct death toll from the storm itself was
fewer than 10, however, dozens of people died on the road in a bus fire, traffic accidents, or heat
stroke. For this reason, when Hurricane Harvey struck the city in 2017, Huston Mayor Sylvester
Turner told people to stay at home and not to evacuate, adding “If you think the situation right
now is bad, you give an order to evacuate, you are creating a nightmare” (Turner 2017). It seems
that fundamental understanding of risk management is that not encountering or getting away
from a hazard is the best way to protect oneself. However, historical examples proved unplanned
evacuation would potentially do more harm than protection. Given the situation in Bothell where
all the major freeway/highway intersecting the city are near the areas vulnerable to natural
hazards, a traffic congestion is expected during a mass-evacuation prompted by the order from
state or local government. Or if even worse, the freeway/highway may not be functional at a
pathway to safer land, trapping residents in the vulnerable area. Thus, ensuring that public space
for evacuation site, reliable infrastructure, and parks are identified and protected at the planning
phase is critical to prevent potential injury and death from the secondary impact of a hazard.
With these concerns in mind, upgrading vulnerable settlements alongside
freeways/highways with attention to access roads, flood-risk, infrastructure, and other safety
measures, can reduce the potential to penetrate into a vulnerable area during an emergency.
Evacuation planning should involve determining how many cars and people are trying to leave a
location and go to another location, and to figure out how they are going to get there (FEMA
year?). An evacuation model for the city should be location specific, reflecting the population
demographic of the neighborhood and physical attributes that may become an obstacle during
evacuation. The city should also invest in an alternative way of utilizing I-405 and Bothell-

56
Everett Highway during an evacuation. Among the states that are subject to hurricane and flood
threads, one of the evacuation toolbox’s major features is some form of contraflow (also known
as lane reversal) (Ballard and Borchardt 2006). Most of these plans call for operating the four-
lane divided controlled-access highway traffic in all four lanes is traveling away from the coast
toward inland destinations where the dangers posed by the approaching natural hazard (typically
hurricane) are significantly reduced (Ballard and Borchardt 2006). Development and
implementation of contraflow is time consuming and requires multiple stakeholders to
participate at the planning stage, however, it can most effectively mobilize the vulnerable
population near the freeway/highway. A big concern here in WA is earth quakes. How does
preparedness around earth quakes fit within your recommendations? It doesn’t have to be a long
discussion, but something related specifically to earthquakes is missing.
5. Conclusion
This research examined disaster vulnerability of the City of Bothell by measuring social,
economic, and built environment factors with supplemental information of natural hazard history
in Bothell. This study demonstrated that a tool to measure vulnerability can help communities
assess their priorities, goals, and needs, and help establish baselines for the future mitigation.
Baselines are needed to better assess progress and to set goals to allocate resources. The model
used in this study and scenario planning revealed that one factor being evaluated can have a
different outcome on different part of the study area, depending on the conditions of the other
factors in the location being examined. For example, residents’ age is one indicator to assess the
degree of vulnerability, but overall vulnerability of the area being studied depends on its spatial
characteristics and other existing conditions, such as average household income and building age.
Within the cohesive relationship between human activity and natural environment, actions for

57
the sake of vulnerability reduction, resilience building, and adaptability improvement can all
contribute to natural hazard and risk mitigation. Thus, a sustainable mitigation strategy to the
inevitable hazards or changes to society should not only seek to decrease vulnerability of social
systems and marginalized populations, but also to foster their resilience and adaptive capacity to
future uncertainties and potential risk. This study also reaffirmed the idea that either a
communication mechanism or planning framework around emergency response, is needed to
understand investments that were made to improve resilience, especially because such
investments can be of considerable size for many communities (Cutter 2012). Therefore, at the
planning level, local governments must consider that developing new capability against natural
hazards in a community requires thorough research of risk and impacts, and close consultation
with local experts and communities.
This study also highlighted the lack of resilience to disaster in Bothell and identified
significant challenges and potential limitations to adaptation that the city may face. There are
areas where the lack of resilience was more palpable than others, including the inability to reach
vulnerable populations, immobility of vulnerable people, protection for the city’s economic
resources, and availability and access to safe public spaces. Understanding these adversities
provides opportunities for better decision making with mitigation implications. While
vulnerability exists almost at every corner of Bothell, it is important to take a look at the result of
vulnerability from a three-dimensional perspective. In ranking of vulnerability this study used
ten social, three economic, and three built-environmental evaluation factors. Addressing the
problems infesting in the existing structures and potential disaster risks should be done at a
dimensional level in addition to the city as a whole. It is helpful to take a closer look at each
evaluation dimension individually to more specifically address underlying chronic conditions

58
rooted in the community as a result of how the social systems and the city itself are structured to
provide services unevenly. After a strike of natural hazard, even when communities seem to be
doing well, segments in society that used to be secure before the hazard have to deal with more
risk and volatility than in the past. (Bates and Swan 2015).
I acknowledge that some indicators for each vulnerability dimension used by other
researchers are not included in my model. This is mainly due to the data availability at census
block level. To ensure the consistency and accuracy of the analysis and visualization result, data
whose pre-defined location level is not census block level are not applied to this study. Thus, I
suggest complementing the model used this study to advance its reliability by adding missing
components. Although an expert’s input was taken into consideration when calculating disaster
vulnerability levels, there is a need for incorporating hazard-specific geological data to prioritize
areas of attention based on the type of natural hazard. In this study, I focused on policy
recommendations to foster the needs of vulnerable populations during emergency. This research
illustrated that the determinants of disaster vulnerability overlap with of socioeconomically
marginalized populations, which draws a connection between hazard mitigation planning and
social justice endeavors. This finding reinforces the notion that location contributes to
determining degree of relative advantage or disadvantage. Thus, seeing disaster mitigation
planning as a social justice effort, the investigation of how fair and equitable distribution of
space is, would be a step toward more successful disaster mitigation planning. Finally, although
this study did not analyze the existing policies and disaster programs in depth, further research is
encouraged to investigate the effectiveness and efficiency of existing preparedness programs and
resources in an attempt to integrate federal, state, and local mitigation efforts seamlessly.
59
Although measuring resilience is a challenge in many cases, this study suggests that
mapping vulnerability of a city and identifying where vulnerable populations reside is one of
critical indicators for assessing and mapping resilience. Analyses of societies particularly
focusing on natural disaster and human activities tend to focus on vulnerabilities. While a
researcher focuses on the vulnerabilities, Nelson (2011) warns that we often overlook the fact
that the larger system (which structures many of the observed vulnerabilities in smaller scales)
may be quite resilient. This underscores the importance of ultimate changes rather than
proximate causes of changes. In addition, even recognizing potential threshold changes, those at
the top level of an organization or political structure are likely to respond to risk in a manner that
does not threaten the existing organizational structure (Handmer and Dovers 2013). Thus,
developing sources of resilience and adaptive capacities may require challenging the status quo.
This study witnessed that solving some conditions in Bothell that contribute to reducing
vulnerability requires fundamental change that may disrupt the larger systems that seem to be
functional in non-emergency situations. Thus, failure to address the city’s basic development
challenges will result in increasingly large losses of life, damage to property, and loss of
economic assets.
Lack of situational awareness of the existing system may prevent operators or
government officials from reconfiguring the system either before or after the hazardous event.
Being able to measure level of vulnerability also means being able to anticipate who is likely to
get most damage. This is noteworthy as it gives more control to the operators by breaking the
larger system into smaller clusters to prevent cascading failures during emergency. Accordingly,
in building resiliency, it is important to have strong social networks and connections among
communities to reduce the amount of uncertainties during emergency. This indicates that
60
inclusion of community members is necessary at the very beginning of planning. Efforts to
develop communication networks should create horizontal relationships, not the hierarchical
institutions, in order to provide communities with more autonomy and capabilities in situations
where the social systems they normally rely on are not functional. Therefore, in essence, being
able to identify vulnerable population and distinguish the difference level of vulnerability
spatially at community level is crucial to prioritize strategies to improve resilience to natural
disasters.

61
References
Annan, K. (2003) ‘‘Message for the International Day for Disaster Reduc- tion 8 October 2003’’,
available at http://www.unisdr.org/eng/public_aware/world_camp/2003/pa-camp03-sg-
eng.htm .
Ballard, A. J., & Borchardt, D. W. (2006). Recommended practices for hurricane evacuation
traffic operations (pp. No. FHWA/TX-06/0-4962-P2). Rep.No. FHWA/TX-06/0-4962-P2,
Federal Highway Administration, Austin, Texas. Retrieved from, 7-19
http://d2dtl5nnlpfr0r.cloudfront.net/tti.tamu.edu/documents/0-4962-P2.pdf
Barnosky, J. (2015, February 19). Before the storm: Shifting federal disaster policy toward
mitigation. Retrieved April, from
https://www.brookings.edu/blog/fixgov/2015/02/19/before-the-storm-shifting-federal-
disaster-policy-toward-mitigation/
Bates, K. A., & Swan, R. S. (2010). Through the Eye of Katrina: Social Justice in the United
State (2nd ed.). NC: Carolina Academic Press.
Beccari, B. (2017). A Comparative Analysis of Disaster Risk , Vulnerability and Resilience
Composite Indicators. PLOS - Current Disasters, March, 1–56.
https://doi.org/10.1371/currents.dis.19f9c194f3e3724d9ffa285b157c6ee3.
Birkmann, J. (2006). Measuring Vulnerability to Promote Disaster-Resilient Societies :
Conceptual Frameworks and Definitions. Measuring Vulnerability to Natural Hazards;
Towards Disaster Resilient Societies, 01, 9–54. https://doi.org/10.1111/j.1539-
6975.2010.01389.x
Bothell Wa Population. (2017-10-20). Retrieved 2018-05-26, from
http://worldpopulationreview.com/us-cities/bothell-wa/
Calavita, N., & Mallach, A. (2009). Inclusionary housing, Incentives, and land value recapture.
Land Lines, (January), 15–21. Retrieved from
http://ci.boulder.co.us/files/HSHHS/Planning/study_session_memo_2009/attachment_k_l
incoln_inst_land_value_and_incentives.pdf
Campbell, S. D. (2013). Sustainable Development and Social Justice : Conflicting Urgencies and
the Search for Common Ground in Urban and Regional Planning. Michigan Journal of
Sustainability, 1, 75–91. https://doi.org/http://dx.doi.org/10.3998/mjs.12333712.0001.007
Cannon, T. (1994). Vulnerability Analysis and the Explanation of “Natural” Disasters. Disasters,
Development and Environment. https://doi.org/10.1108/09653560810887275

62
Cleetus, R. (2018, April 9). FEMA and HUD Budgets are Vital for Disaster and Climate
Preparedness. Retrieved May, 2018, from https://blog.ucsusa.org/rachel-cleetus/fema-
and-hud-budgets-are-vital-for-disaster-and-climate-preparedness
Corbin, T. (2015). Leveraging Disaster: Promoting Social Justice and Holistic Recovery through
Policy Advocacy after Hurricane Katrina. Journal of Public Management & Social Policy,
22(2). Retrieved from http://digitalscholarship.tsu.edu/jpmsp/vol22/iss2/5
Crane, M., & Boga, D. (2017, January 1). A commentary: Rethinking approaches to resilience
and mental health training. Journal of Military and Veterans’ Health. Australian Military
Medicine Association. https://doi.org/10.1002/ejoc.201200111
Eastman, J. (1999). Multi-criteria evaluation and GIS. Geographical Information Systems, 493–
502. Retrieved from http://www.geos.ed.ac.uk/~gisteac/gis_book_abridged/files/ch35.pdf
Feizizadeth, B., & Blaschke, T. (2011). Landslide Risk Assessment Based on GIS Multi-Criteria
Evaluation: A Case Study in Bostan-Abad County, Iran B. Journal of Earth Science and
Engineering, 1, 67-71. Retrieved April, 2018, from https://doi.org/10.1007/978-3-319-
11620-4.
Handmer, J., & Dovers, S. (2013). Handbook of Disaster Policies and Institutions: Improving
Emergency Management and Climate Change Adaptation (p. 218). Routledge. Retrieved
from http://books.google.fr/books?id=M4UF2i493qwC
Hayashi, Y., Suzuki, Y., Sato, S., & Tsukahara, K. (2016). Disaster Resilient Cities: Concepts
and Practical Examples (1st ed.). Elsevier.
Hilhorst, D. and G. Bankoff (2004) ‘‘Introduction: Mapping Vulnerability’’, in G. Bankoff, G.
Frerks and D. Hilhorst, eds, Mapping Vulnerability: Disasters, Development and People,
London: Earthscan
H.R. 1748 (114th): Safe Building Code Incentive Act of 2015
Jackson School of Geoscience, University of Texas Austin. (2017, November 20). Seafloor
Sediments Appear to Enhance Earthquake and Tsunami Danger in Pacific Northwest.
Retrieved March, 2018, from http://www.jsg.utexas.edu/news/2017/11/seafloor-
sediments-appear-to-enhance-earthquake-and-tsunami-danger-in-pacific-northwest/
King County. (2005). King County Regional Hazard Mitigation Plan Update; Planning-Area-
Wide Elements. (Volume 1).
63
Lei, Y., Wang, J., Yue, Y., Zhou, H., & Yin, W. (2014). Rethinking the relationships of
vulnerability, resilience, and adaptation from a disaster risk perspective. Natural Hazards,
70(1), 609–627. https://doi.org/10.1007/s11069-013-0831-7
Manyena, S. (2006). The concept of resilience revisited. Disasters 30(4): 433–450.
McGuire, L. C., Fors, E. S., & Okaro, C. A. (2007). Natural disasters and older US adults with
disabilities: Implications for evacuation. Disasters, 31(1), 49-56. Retrieved April, 2018,
from https://doi.org/10.1111/j.1467-7717.2007.00339.x.
Musungu, K., Motala, S., & Smit, J. (2012). Using Multi-criteria Evaluation and GIS for Flood
Risk Analysis in Informal Settlements of Cape Town : The Case of Graveyard Pond.
South African Journal of Geomatics, 1(1), 77–91.
Nelson, D. R. (2011). Adaptation and resilience: Responding to a changing climate. Wiley
Interdisciplinary Reviews: Climate Change, 2(1), 113–120.
https://doi.org/10.1002/wcc.91
Norris, F. H., Stevens, S. P., Pfefferbaum, B., Wyche, K. F., & Pfefferbaum, R. L. (2008).
Community resilience as a metaphor, theory, set of capacities, and strategy for disaster
readiness. American Journal of Community Psychology, 41(1-2), 127-150. Retrieved
February, 2018.
Noy, I., & Yonson, R. (2015). Economic Vulnerability and Resilience to Natural Hazards.
Oxford University Press. https://doi.org/10.1093/acrefore/9780199389407.013.76
Patrick, S. M. (2012, August 15). Cities Are Making Natural Disasters Deadlier. Retrieved April,
2018, from https://www.citylab.com/equity/2012/08/cities-are-making-natural-disasters-
deadlier/2957/
Pereira, S. (2017, November 27). PACIFIC NORTHWEST MAY BE AT MOST RISK FOR
THE 'BIG ONE' BECAUSE OF SEAFLOOR SEDIMENTS. Retrieved April, 2018, from
http://www.newsweek.com/pacific-northwest-may-be-most-risk-big-one-due-seafloor-
sediments-717632
RCW 28a.320.125: Safe school plans—Requirements—Duties of school districts, schools, and
educational service districts—Reports—Drills—Rule (2018)
Sanderson, D., Kayden, J. S., & Leis, J. (2016). Urban Disaster Resilience: New Dimensions
from International Practice in the Built Environment. (pp. 1–216). Taylor and Francis Inc.
https://doi.org/10.4324/9781315725420

64
Sebastian E. Heath, Philip H. Kass, Alan M. Beck, Larry T. Glickman; Human and Pet-related
Risk Factors for Household Evacuation Failure During a Natural Disaster, American
Journal of Epidemiology, Volume 153, Issue 7, 1 April 2001, Pages 659–665,
Shim, J. H., & Kim, C. I. (2015). Measuring resilience to natural hazards: Towards sustainable
hazard mitigation. Sustainability (Switzerland), 7(10), 14153–14185.
https://doi.org/10.3390/su71014153
Smith, Gavin B., and Wenger. (2007). Sustainable disaster recovery: Operationalizing an
existing agenda. In Handbook of Disaster Research. Havidan Rodriguez, Enrico L
Quarantelli and Russell R Dynes. New York: Springer
Store, R., & Kangas, J. (2001). Integrating spatial multi-criteria evaluation and expert knowledge
for GIS-based habitat suitability modelling. Landscape and Urban Planning, 55(2), 79–93.
https://doi.org/10.1016/S0169-2046(01)00120-7
Suárez, M., Gómez-Baggethun, E., Benayas, J., & Tilbury, D. (2016). Towards an Urban
Resilience Index: A Case Study in 50 Spanish Cities. Sustainability, 8(8), 774.
https://doi.org/10.3390/su8080774
Szlafsztein, C., & Sterr, H. (2007). A GIS-based vulnerability assessment of coastal natural
hazards, state of Pará, Brazil. Journal of Coastal Conservation, 11(1), 53–66.
https://doi.org/10.1007/s11852-007-0003-6
Uitto, J. (1998). The geography of disaster vulnerability in megacities: A theoretical framework.
Applied Geography. Retrieved March, 2018, from
https://www.researchgate.net/publication/222344920_The_geography_of_disaster_vulner
ability_in_megacities_A_theoretical_framework.
United Nations Economic and Social Commission for Asia and the Pacific (UNESCAP). (2017).
Sharing Space-based Information: Procedural Guidelines for Disaster Emergency
Response in ASEAN Countries
United Nations. (2012). ECONOMIC AND SOCIAL COUNCIL 19 th UNITED NATIONS
REGIONAL CARTOGRAPHIC CONFERENCE FOR ASIA AND THE PACIFIC FOR
DISASTER MANAGEMENT National Mapping and Resource Information Authority, 6.
Voogd, H. (1983). Multicriteria Evaluation for Urban and Regional planning. Pion (p. 125).
Delft: Delftsche Uitgevers Maatschappij. https://doi.org/10.6100/IR102252
Westley, C., Murphy, R. P., & Anderson, W. L. (2008). Institutions, incentives, and disaster
relief. International Journal of Social Economics, 35(7), 501–511.
https://doi.org/10.1108/03068290810886902

65
Winderl, T. (2014). Disaster resilience measurments: Stocktaking of ongoing efforts in
developing systems for measuring resilience. United Nation Development Programme
(pp. 1–59). https://doi.org/10.1007/978-1-4020-6359-6_3359
Zahran, S., Brody, S. D., Peacock, W. G., Vedlitz, A., & Grover, H. (2008). Social vulnerability
and the natural and built environment: A model of flood casualties in Texas. Disasters,
32(4), 537–560. https://doi.org/10.1111/j.1467-7717.2008.01054.x