a genome-scale integrated approach aids in genetic ... panel (92 diverse desi and kabuli accessions)...
TRANSCRIPT

1 3
Plant Mol BiolDOI 10.1007/s11103-015-0377-z
A genome‑scale integrated approach aids in genetic dissection of complex flowering time trait in chickpea
Hari D. Upadhyaya1 · Deepak Bajaj2 · Shouvik Das2 · Maneesha S. Saxena2 · Saurabh Badoni2 · Vinod Kumar3 · Shailesh Tripathi4 · C. L. L. Gowda1 · Shivali Sharma1 · Akhilesh K. Tyagi2 · Swarup K. Parida2
Received: 15 April 2015 / Accepted: 2 September 2015 © Springer Science+Business Media Dordrecht 2015
associated (34 % combined PVE) with flowering time. Six flowering time-associated major genomic loci harbour-ing five robust QTLs mapped on a high-resolution intra-specific genetic linkage map were validated (11.6–27.3 % PVE at 5.4–11.7 LOD) further by traditional QTL map-ping. The flower-specific expression, including differential up- and down-regulation (>three folds) of eight flowering time-associated genes (including six genes validated by QTL mapping) especially in early flowering than late flow-ering contrasting chickpea accessions/mapping individuals during flower development was evident. The gene haplo-type-based LD mapping discovered diverse novel natural allelic variants and haplotypes in eight genes with high trait association potential (41 % combined PVE) for flow-ering time differentiation in cultivated and wild chickpea. Taken together, eight potential known/candidate flowering time-regulating genes [efl1 (early flowering 1), FLD (Flow-ering locus D), GI (GIGANTEA), Myb (Myeloblastosis), SFH3 (SEC14-like 3), bZIP (basic-leucine zipper), bHLH (basic helix-loop-helix) and SBP (SQUAMOSA promoter binding protein)], including novel markers, QTLs, alleles and haplotypes delineated by aforesaid genome-wide inte-grated approach have potential for marker-assisted genetic improvement and unravelling the domestication pattern of flowering time in chickpea.
Keywords Chickpea · Flowering time · GBS · GWAS · QTL · SNP
Introduction
Chickpea (Cicer arietinum L.) is an annual self-pollinated and diploid crop species with a genome size of ~ 740 Mbp whose domestication can be traced to regions of South
Abstract A combinatorial approach of candidate gene-based association analysis and genome-wide association study (GWAS) integrated with QTL mapping, differential gene expression profiling and molecular haplotyping was deployed in the present study for quantitative dissection of complex flowering time trait in chickpea. Candidate gene-based association mapping in a flowering time asso-ciation panel (92 diverse desi and kabuli accessions) was performed by employing the genotyping information of 5724 SNPs discovered from 82 known flowering chick-pea gene orthologs of Arabidopsis and legumes as well as 832 gene-encoding transcripts that are differentially expressed during flower development in chickpea. GWAS using both genome-wide GBS- and candidate gene-based genotyping data of 30,129 SNPs in a structured population of 92 sequenced accessions (with 200–250 kb LD decay) detected eight maximum effect genomic SNP loci (genes)
Hari D. Upadhyaya, Deepak Bajaj, and Shouvik Das have contributed equally to this work.
Electronic supplementary material The online version of this article (doi:10.1007/s11103-015-0377-z) contains supplementary material, which is available to authorized users.
* Swarup K. Parida [email protected]; [email protected]
1 International Crops Research Institute for the Semi-Arid Tropics (ICRISAT), Patancheru, Telangana 502324, India
2 National Institute of Plant Genome Research (NIPGR), Aruna Asaf Ali Marg, New Delhi 110067, India
3 National Research Centre on Plant Biotechnology (NRCPB), New Delhi 110012, India
4 Division of Genetics, Indian Agricultural Research Institute (IARI), New Delhi 110012, India

Plant Mol Biol
1 3
Eastern Turkey and adjacent Syria (Fertile Crescent) around 10,000 years ago (Kumar and Abbo 2001; Abbo et al. 2003; Berger et al. 2005; Burger et al. 2008; Toker 2009; Jain et al. 2013; Kujur et al. 2013; Varshney et al. 2013; Saxena et al. 2014a). Chickpea is broadly categorized into two cultivar types- desi (purple flower and small seed size with yellow brown to light brown coloured seed coat) and kabuli (white flower and large seed size with beige col-oured seed coat) in accordance with their distinctive plant architectures and diverse gene pools-derived domestica-tion patterns. Globally, chickpea is the third most important food legume complementing cereals and considered a sta-ple protein source for human diet (Kumar and Abbo 2001; Kumar et al. 2011; Gaur et al. 2012; Varshney et al. 2013). To meet the ever increasing dietary demand of fast growing population, the chickpea production needs to be enhanced. However, several abiotic stress factors, including drought impart a serious threat to the production of chickpea. Chickpea being a rainfed crop is more prone to drought (Kumar et al. 1996). Therefore, it is imperative to develop chickpea cultivars with early flowering, growth vigor and maturity to escape the end-of-season drought stress affect-ing their plant types (Kumar and Abbo 2001). The number of days to flowering is a key yield contributing trait that determines the rate of pod setting and thus seed/pod yield in chickpea under rainfed cropping patterns facing termi-nal drought conditions, specifically in the semi-arid tropi-cal regions (Turner et al. 2007; Aryamanesh et al. 2010; Kashiwagi et al. 2013). The flowering time, a defining feature of vegetative-to-reproductive transition, is highly attuned with changing climates and diverse environmental factors in chickpea. This is also accompanied with signifi-cant changes in a wide range of other developmental traits, including maturity time and pod/seed yield and therefore, complex genetic interaction of flowering time with other developmental processes in chickpea is anticipated.
Vernalization is an important key response of flowering time that has been considered the most crucial evolutionary bottleneck during chickpea domestication leading towards evolution of presently cultivated vernalization insensitive desi and kabuli cultivars especially from the vernalization sensitive wild progenitor Cicer reticulatum (Summerfield et al. 1989; Abbo et al. 2003; Berger et al. 2005; Burger et al. 2008; Toker 2009; Abbo et al. 2014). This implicates that flowering time is a major adaptive domestication trait targeted in selective breeding of chickpea. Collectively, flowering time in chickpea is a major component of its adaptability in diverse agro-climatic conditions beside playing a pivotal role in defining its productivity, especially under short season environments encountering terminal drought and heat stress (Subbarao et al. 1995; Kumar and Abbo 2001; Hegde 2010). It is thus desirable to genetically dissect the flowering time in order to fine-tune chickpea
cultivars grown under rainfed farming system and uncover the domestication pattern of this trait. The cues obtained from these studies will be useful to develop early flower-ing/maturing chickpea cultivars by which the overall agro-nomic practices, including fertilizer and labour cost and time involved in raising their plants in field as well as the effect of various abiotic and biotic stresses, including end-of season terminal drought can be minimized in chickpea (Lichtenzveig et al. 2006; Turner et al. 2007; Zaman-Allah et al. 2011). This will subsequently serve as a beneficial strategy to achieve the prime objectives of current genom-ics and breeding research with an aim to develop high-yielding stress tolerant chickpea cultivars.
The flowering time is a complex quantitative trait gov-erned by multiple genes. In model crop plants like Arabi-dopsis, around 100 potential genes controlling flowering time have been identified and their complex regulatory interactions/networks underlying the target trait are being deciphered (Andres and Coupland 2012; Song et al. 2013). In legumes, a diverse array of gene (gene families) homologs that are known to control flowering time path-ways in A. thaliana have been catalogued. A few selected genes (~20) of these, have been functionally characterized and utilized for understanding the genetic control of flow-ering time-related traits particularly in pea and soybean (Weller et al. 2009; Kim et al. 2012; Watanabe et al. 2012; Weller and Martínez 2015). Considering the well-docu-mented functional roles of FT (Flowering Locus T) genes in integration of signals from environments with that of photoperiod detection sites during vegetative to reproduc-tive phase transition at the time of flowering, these genes are of much interest for pea, Medicago, Lotus and soybean (Kong et al. 2010; Laurie et al. 2011; Pin and Nilsson 2012; Yamashino et al. 2013; Zhai et al. 2014).
Till date, very limited attentions have been paid towards understanding of the genetic inheritance pattern and dis-section of the genetic architecture of this complex flower-ing time trait in chickpea (Or et al. 1999; Kumar and Van Rheenen 2000; Anbessa et al. 2006; Cobos et al. 2007; Pierre et al. 2008; Aryamanesh et al. 2010; Pierre et al. 2011; Zhang et al. 2013). The classical genetic analyses, for instance, documented different major gene loci [efl1 (ICCV 2), efl2/ppd (photoperiod) (ICC 5810), efl3 (BGD 132) and efl4 (ICC 16641 and ICC 16644)] with varied allelic segregation patterns, which have got distinct impact on flowering time adaptation in diverse chickpea acces-sions (Or et al. 1999; Hegde 2010; Gaur et al. 2014; Weller and Martínez 2015). Molecular mapping of a very small number (about 10 QTLs) of low-resolution QTLs (quantita-tive trait loci) governing flowering time on multiple chro-mosomes and their colocalization with diverse known flow-ering time gene homologs [like Efl1, Efl2, LFY (LEAFY) and FT gene families] have been documented in chickpea
Plant Mol Biol
1 3
(Cho et al. 2002; Lichtenzveig et al. 2006; Anbessa et al. 2006; Cobos et al. 2007, 2009; Radhika et al. 2007; Ary-amanesh et al. 2010; Hossain et al. 2010; Gowda et al. 2011; Rehman et al. 2011; Cho et al. 2012; Hiremath et al. 2012; Vadez et al. 2012; Jamalabadi et al. 2013; Varshney et al. 2014). Unfortunately, until yet none of these identi-fied major QTLs controlling flowering time have been uti-lized for genomics-assisted crop improvement in chickpea.
The available draft genome sequences of desi (ICC 4958) and kabuli (CDC Frontier) chickpea (Jain et al. 2013; Varshney et al. 2013) have accelerated the genome and transcriptome resequencing of diverse desi, kabuli and wild accessions at a genome-wide scale. This has subse-quently led to the identification and large-scale genotyp-ing of numerous sequence-based informative markers via multiple cost-effective array- and NGS (next generation sequencing)-based high-throughput genotyping assays, including GBS (genotyping-by-sequencing) (Gaur et al. 2012; Hiremath et al. 2012; Jhanwar et al. 2012; Agar-wal et al. 2012; Roorkiwal et al. 2013; Deokar et al. 2014; Stephens et al. 2014; Jaganathan et al. 2015; Kujur et al. 2015). Recent efforts have also been made towards deci-phering the complex and interacting transcriptional gene regulatory networks controlling flower developmental process in a desi chickpea accession (ICC 4958) through global transcriptomics approach (Singh et al. 2013). This NGS-based whole genome transcriptome sequencing study has identified a large number (~1500) of preferential and tissue/stage (flower bud/flower)-specific known/candidate gene-encoding transcripts that are differentially expressed (up- and down-regulated) distinctly from the vegetative tissues during flower development in chickpea. In addi-tion to these genomic resources, diverse genetic resources, including natural (core/minicore germplasm lines) and mapping populations (advanced generation back-cross and recombinant inbred lines) exhibiting a wide range of phe-notypic diversity for flowering time are available in chick-pea (Upadhyaya et al. 2001, 2008; Gaur et al. 2014). It would be thus interesting to adopt an integrative genomic approach involving SNP (single nucleotide polymorphism) marker-mediated candidate gene-based and genome-wide association mapping, QTL mapping, differential expression profiling, gene haplotype-specific LD (linkage disequilib-rium) mapping for rapid delineation of potential candidate genes regulating flowering time at a whole genome level in chickpea. In recent years, such integrative approach has been successfully implemented to identify potential major candidate genes harbouring robust QTLs regulating seed size/100-seed weight and pod number/plant in chickpea (Kujur et al. 2013, 2014; Saxena et al. 2014b; Bajaj et al. 2015a). Interestingly, the efficacy of QTL mapping/map-based cloning and trait association analysis in combina-tion to scan the potential candidate genes/QTLs governing
complex flowering time trait at a genome-wide scale is well documented in Arabidopsis and legumes (Liu et al. 2007; Pierre et al. 2008; Ehrenreich et al. 2009; Jung and Müller 2009; Brachi et al. 2010; Watanabe et al. 2011; Xia et al. 2012; Yeoh et al. 2013; Zhang et al. 2013). Collectively, the aforesaid strategy will assist us to dissect the molecular basis of complex gene regulatory networks underlying the flowering time quantitative trait and understand its evolu-tionary pattern during chickpea domestication.
In light of the above, the present study made an effort to integrate GWAS (genome-wide association study) and can-didate gene (known/candidate gene-encoding transcripts differentially expressed during flower development in chickpea and chickpea gene orthologues governing known flower development pathway majorly in Arabidopsis, Med-icago, soybean and pea)-based association analysis for identification of potential genomic loci (genes) associated with flowering time in chickpea. Further, we integrated the trait association analysis with traditional QTL mapping, transcript profiling and gene-based haplotyping/LD (link-age disequilibrium) mapping to scale-down the function-ally relevant novel molecular tags (markers, genes, QTLs, alleles and haplotypes) regulating flowering time and deci-pher their haplotype-specific evolutionary pattern in culti-vated and wild accessions during chickpea domestication.
Materials and methods
Mining and genotyping of genome‑wide and gene‑derived SNPs
For genome-wide mining and genotyping of SNPs, the genomic DNA isolated from 92 (39 desi and 53 kabuli) diverse chickpea accessions (flowering time association panel, Table S1) were used to constitute a 96-plex GBS library (three accessions as biological replicates and one non-template control) and sequenced (100-bp single end) employing Illumina HiSeq 2000 NGS platform as per the modified methods of Elshire et al. (2011) and Kujur et al. (2015). The de-multiplexing and mapping of high-quality FASTQ sequence reads onto the reference kabuli draft chickpea genome (Varshney et al. 2013) and detection of high-quality SNPs from 92 accessions were performed using Bowtie v2.1.0 (Langmead and Salzberg 2012) and reference-based GBS pipeline/genotyping approach of STACKS v1.0 (http://creskolab.uoregon.edu/stacks) (fol-lowing Kujur et al. 2015). The sequence reads unmapped with the reference kabuli chickpea genome were analysed through de novo-based GBS pipeline/genotyping approach of STACKS. Subsequently, SNPs with their putative physical positions (bp) were discovered from the high-confidence unique stacks (reassembled sequence reads)

Plant Mol Biol
1 3
generated among accessions following the detailed meth-ods of Kujur et al. (2015). The reference genome GBS-based SNPs identified in different coding and non-coding sequence components of genes and genomes (chromo-somes/pseudomolecules and scaffolds) were structurally and functionally annotated according to kabuli genome annotation (Varshney et al. 2013).
For large-scale mining and genotyping of gene-based SNPs in chickpea, a set of 1572 (including 290 flower tissue/stage-, 38 lineage- and 96 chickpea-specific tran-scripts) known/candidate gene-encoding transcripts that are differentially expressed during flower development in desi chickpea accession (ICC 4958) were obtained (Singh et al. 2013). In addition, a selected set of 150 known cloned genes involved in regulation of flower development (known flower development pathway) in Arabidopsis thaliana, Glycine max, Medicago truncatula and Pisum sativum (Ehrenreich et al. 2009; Jung and Müller 2009; Brachi et al. 2010; Jung et al. 2012; Andres and Coupland 2012; Weller and Martínez 2015) were acquired. The transcripts, including coding sequence (CDS) of these known flower-ing genes were BLAST searched against the CDS of kabuli genes to find out the best possible gene orthologs in chick-pea. The CDS and 2000-bp URRs (upstream regulatory regions), exons, introns and 1000-bp DRRs (downstream regulatory regions) of these identified true chickpea gene orthologs (E-value: 0 and bit score ≥500) were targeted to design the multiple overlapping forward and reverse prim-ers with expected amplification product size of 400–600 bp per primer. The genomic DNA of 12 chickpea accessions (selected from 92 accessions used for GBS assay, Table S1) were PCR amplified with the gene-based primers and the amplified PCR products were sequenced through auto-mated 96 capillary ABI 3730xl DNA Analyzer (Applied Biosystems, USA). The high-quality gene sequences were aligned and compared to detect SNPs among accessions following Kujur et al. (2013) and Saxena et al. (2014a). The Illumina GoldenGate assay was utilized for large-scale validation and high-throughput genotyping of these mined SNPs in the genomic DNA of 92 accessions (flower-ing time association panel, Table S1) following Bajaj et al. (2015a).
Phenotyping for flowering time
For phenotyping, 92 desi and kabuli chickpea accessions belonging to a flowering time association panel were grown in the field according to RCBD (randomised com-plete block design) for two consecutive years (2011 and 2012) with at least two replications during crop growing season at two diverse geographical locations (Patancheru, Hyderabad: latitude 17°3′N/longitude 77°2′E and New Delhi: 28°4′N/77°2′E) of India. Moreover, greenhouse trail
was conducted to evaluate the flowering time response of these natural chickpea accessions under both long (16 h light/8 h dark)- and short (10 h light/14 h dark) -day condi-tions at 22 ± 2 °C. The days to 50 % flowering time (DF) of each accession (10–15 representative plants from each accession) was measured individually by counting the num-ber of days from sowing (first irrigation) to the stage when 50 % of their plants have begun to flower. The frequency distribution, coefficient of variation (CV), broad-sense her-itability (H2) and analysis of variance (ANOVA) of DF trait among accessions were estimated using SPSSv17.0 as per Saxena et al. (2014b).
Flowering time association mapping
The construction of unrooted neighbour-joining (NJ)-based phylogenetic tree, principal component analysis (PCA), and determination of population genetic structure and genome-wide/population-specific LD patterns and LD decay among 92 chickpea accessions (flowering time association panel) were performed as per Kujur et al. (2015). To perform DF trait association mapping, the genome-wide and candidate gene-based SNP genotyping information were correlated with the DF phenotyping, population structure ancestry coefficient (Q matrix), kinship matrix (K) and PCA (P) data of 92 cultivated desi and kabuli accessions (Kujur et al. 2013, 2014; Kumar et al. 2015). In addition, GWAS was conducted by use of mixed model (P + K, K and Q + K)-based P3D/EMMAX (mixed model association expedited) and CMLM (compressed mixed linear model) approaches of GAPIT as per Kumar et al. (2015). The quantile–quan-tile plot was compared individually with the relative distri-bution of observed and expected -log10(P) value for each SNP marker-trait association to ensure their accuracy and robustness. The adjusted P value threshold of significance was corrected for multiple comparisons in accordance with false discovery rate (FDR cut-off ≤0.05) (Benjamini and Hochberg 1995). We integrated all four model-based outputs of TASSEL and GAPIT to identify potential SNP loci in the target genomic (gene) regions exhibiting signifi-cant association with DF trait at highest R2 (degree of SNP marker-trait association) and lowest FDR adjusted P values (threshold P < 1 × 10⁻⁷).
QTL mapping
An intra-specific 190 F6 mapping population (ICC 16374 × ICC 762) was utilized for validating the genomic loci associated with DF trait by QTL mapping. The chick-pea accessions ICC 16374 (originated from Malawi) and ICC 762 (originated from India) are early (38 days) and late (65) flowering desi traditional cultivars/landraces. The multi-location/years replicated field phenotyping for

Plant Mol Biol
1 3
DF was performed in each mapping individual (10–12 representative plants from each individual) following the aforementioned methods. The homogeneity of mapping population across two seasons and their genetic inheritance patterns, including CV, broad-sense heritability (H2) of DF trait was determined according to Bajaj et al. (2015a). A selected set of parental polymorphic 384 GBS-based SNPs and 32 previously reported SSR markers (Winter et al. 1999, 2000; Cho et al. 2002; Lichtenzveig et al. 2006; Anbessa et al. 2006; Cobos et al. 2007, 2009; Radhika et al. 2007; Aryamanesh et al. 2010; Hossain et al. 2010; Gowda et al. 2011; Rehman et al. 2011; Thudi et al. 2011; Cho et al. 2012; Hiremath et al. 2012; Vadez et al. 2012; Jamal-abadi et al. 2013; Varshney et al. 2014) (as anchors) physi-cally/genetically mapped on eight LGs (linkage groups)/chromosomes were genotyped using Illumina GoldenGate assay (Bajaj et al. 2015a) and fluorescent dye-labelled auto-mated fragment analyzer (Kujur et al. 2013), respectively. The construction of high-density intra-specific genetic link-age map and QTL mapping [composite interval mapping (CIM)] at significant LOD (logarithm of odds threshold >5.0) was performed (as per Saxena et al. 2014b) to iden-tify and map the major genomic loci harbouring the robust QTLs controlling DF trait in chickpea. The additive/pleio-tropic effect and confidence interval (CI) of each significant major flowering time QTL were determined as per Bajaj et al. (2015a).
Differential expression profiling
To determine the regulatory pattern of genes associated (validated by association and QTL mapping) with flower-ing time, the differential expression profiling of these genes was performed using the semi-quantitative and quantita-tive RT-PCR assays. The RNA was isolated from vegeta-tive young leaf and shoot apical meristem (SAM) tissues, and four flower development stages (FB1 and FB2: flower buds with 4 and 10 mm size, respectively and FL1 and FL2: young flowers with close petals and mature flow-ers with opened petals, defined as per Singh et al. 2013) of early (kabuli cv. ICC 12,968 with DF: 32.3 ± 0.81) and late (desi cv. ICCX-810800 with DF: 61.2 ± 1.2) flower-ing two contrasting chickpea accessions as well as mapping parents (ICC 16374 and ICC 762) and four homozygous mapping individuals. The isolated RNA was amplified with the gene-specific primers in RT-PCR assay following Bajaj et al. (2015b).
Molecular haplotyping
To perform gene-based marker haplotyping/LD mapping, the 2 kb URRs, exons, introns and 1 kb DRRs of flowering time-regulating potential genes (validated by association/
QTL mapping and expression profiling) amplified from 92 cultivated desi and kabuli chickpea accessions and 10 wild accessions (two accessions each from C. reticulatum, C. echinospermum, C. judaicum, C. bijugum and C. pin-natifidum) (Table S1) were cloned and sequenced following Kujur et al. (2013, 2014) and Saxena et al. (2014b). The SNPs discovery from high-quality sequences, marker-based haplotypes constitution, LD patterns determination, and haplotype-based trait association mapping and evolutionary study of flowering time-associated genes were performed following Saxena et al. (2014b) and Bajaj et al. (2015b).
Results
Identification and annotation of genome‑wide GBS‑ and candidate gene‑based SNPs
A total of 246.5 million sequence reads with a mean of 2.5 million reads per accession (ranging from 2.1 to 8.9 mil-lion reads) were generated by GBS-based sequencing of 96-plex ApeKI libraries constructed from 92 diverse desi and kabuli chickpea accessions (constituted flowering time association panel). This produced 215.8 (87.5 %) million high-quality sequence reads (~18-fold sequence depth of coverage) that varied from 1.91 to 4.53 with a mean of 3.10 million reads per accession. On an average 84.7 % (rang-ing from 80.7 to 89.5 %) high-quality sequence reads of these, evenly distributed across 92 chickpea accessions, were mapped to unique physical locations on kabuli refer-ence genome. The use of kabuli reference genome- and de novo-based GBS approaches discovered 24,405 high-qual-ity SNPs (as defined by Kujur et al. 2015) from 92 chick-pea accessions (Fig. 1A; Table S2). This includes 16,376 and 8029 reference genome- and de novo-based SNPs, respectively. The reference genome-based SNPs further comprised of 14,115 and 2261 SNPs that were physically mapped across eight chromosomes (average map den-sity: 24.6 kb) and unanchored scaffolds of kabuli genome, respectively (Fig. 1A; Table S2). These 16,376 reference kabuli genome-based SNPs have been submitted to NCBI dbSNP (http://www.ncbi.nlm.nih.gov/SNP/snp_viewTable.cgi?handle=NIPGR) with SNP submission (ss) accession numbers 974751673–974768048. The minor allele fre-quency (MAF) of GBS-based SNPs (with <10 % missing data) varied from 2 to 24 % with an average of 15 %.
To discover candidate gene-derived SNPs, the PCR amplicons-based sequencing of 832 known/candidate gene-encoded by 1572 transcripts (differentially expressed during flower development in ICC 4958) and 82 known cloned flowering gene orthologues of chickpea (involved in regulation of flower development in Arabidopsis and leg-umes) was performed (Table S3). The comparison of these

Plant Mol Biol
1 3
high-quality gene amplicon sequences among 12 represent-ative desi and kabuli chickpea accessions and subsequent high-throughput genotyping of mined SNPs in a constituted flowering time association panel (92 desi and kabuli acces-sions) by Illumina GoldenGate assay successfully identi-fied 5724 SNPs in 914 genes with an average frequency of 6.3 SNPs/gene (Fig. 1A). This includes 4890 and 834 SNPs mined from 832 differentially expressed genes-encoding transcripts (mean frequency: 5.9 SNPs/gene) and 82 known
cloned flowering chickpea gene orthologues (10.2 SNPs/gene), respectively.
The structural annotation of 22,100 SNPs (including 16,376 kabuli reference genome- and 5724 gene-based SNPs) exhibited the presence of 16,380 and 5720 SNPs in 5558 genes and intergenic regions, respectively (Fig. 1B). Further, detailed annotation of SNPs in the genes depicted the presence of a maximum number of 7702 SNPs (6183 genome-wide and 1519 gene-derived SNPs in 4094 genes) in the exons (CDS). A minimum of 1168 SNPs (17 genome-wide and 1151 gene-based SNPs in 923 genes) were identi-fied in the DRRs. The mined coding SNPs included 4128 synonymous and 3574 non-synonymous (missense and nonsense) SNPs in 2706 and 3093 genes, respectively. A maximum correspondence of 5558 SNPs-carrying genes with growth, development and metabolism-related proteins (46 %), followed by transcription factors (21.2 %) and sig-nal transduction proteins (5 %) was evident.
Association mapping of flowering time
To perform GWAS and candidate gene-based associa-tion mapping, 30,129 informative SNPs (revealing poly-morphism among 92 desi and kabuli chickpea accessions) identified based on genome-wide GBS- (24,405 SNPs) and candidate gene-based SNP genotyping (5724 SNPs) were utilized. The use of these 30,129 SNPs for neighbour-joining phylogenetic tree construction and determination of high-resolution population genetic structure and PCA, differentiated all 92 accessions from each other and clus-tered into two distinct populations; POP I (kabuli) and POP II (desi). The LD patterns in two population groups of 92 accessions using 19,839 SNPs (14,115 genome-wide and 5724 gene-based SNPs) physically mapped on eight chromosomes were determined. This exhibited a higher LD estimate [average frequency correlation among pair of alleles across a pair of SNP loci (r2): 0.30–0.56] and extended LD decay (r2 decreased half of its maximum value nearly at 250 kb physical distance on chromosomes) in kabuli as compared to desi population [LD estimate (r2): 0.26–0.49 with ~200 kb LD decay)] (Fig. 2).
We observed a broader phenotypic variation (34–88 days, mean CV: 26 % and mean H2: 80 %) along with normal frequency distribution for DF in 92 chick-pea accessions grown at multiple geographical locations/years in field and green house (long- and short-day) condi-tions (Fig. 3A; Table S4). The use of CMLM model-based approach at FDR cut-off ≤0.05 in association analysis (Figure S1) overall detected eight genomic loci (gene-derived SNPs) revealing strong association with DF at a highly significant P ≤ 10−7 (Fig. 4A; Table 1). Three SNPs from these were identified from genome-wide GBS data, while five SNPs derived from known flowering genes
Fig. 1 A Relative distribution of 30,129 SNPs mined through refer-ence kabuli genome (eight chromosomes and scaffolds)- and de novo GBS-based (24,405 SNPs) and candidate gene (DEGT and KCFG)-derived (5724 SNPs) SNP genotyping assays. DEGT differentially expressed gene-encoding transcripts and KCFG known cloned flow-ering genes. B Detailed annotation of SNPs in the diverse non-cod-ing (intron, URR and DRR) and coding (synonymous and non-syn-onymous) sequence components of genes and intergenic regions of kabuli genome. The CDS (coding sequences), URR (upstream regula-tory region) and DRR (downstream regulatory region) of genes were defined according to gene annotation information of reference kabuli genome (Varshney et al. 2013). The numbers with red and black col-our fonts mentioned within bars indicate the structural annotation of genome-wide GBS- and candidate gene-based SNPs, respectively. Value mentioned in the parenthesis indicates the number of SNPs-containing genes

Plant Mol Biol
1 3
(three SNPs) and differentially expressed candidate gene-encoding transcripts (two SNPs). Seven and one DF-asso-ciated genomic loci were physically mapped on four chro-mosomes (3, 4, 5 and 6) and scaffold of kabuli genome, respectively (Fig. 4A; Table 1). A maximum of two DF-associated SNPs was derived from kabuli chromosomes 4 and 5. Five and three of eight DF-associated genomic SNP loci were represented from diverse coding (three non-syn-onymous SNPs) as well as non-coding [intronic (one SNP) and URR/DRR (two SNPs)] sequence components of eight genes, respectively.
The proportion of phenotypic variance for DF explained (R2) by maximum effect eight SNP loci in eight known/candidate genes [efl1 (early flowering 1), FLD (Flower-ing locus D), GI (GIGANTEA), Myb (Myeloblastosis), SFH3 (SEC14-like 3), bZIP (basic-leucine zipper), bHLH (Helix-loop-helix) and SBP (SQUAMOSA promoter bind-ing protein)] among 92 chickpea accessions varied from 8 to 17 % (Table 1). The percentage of DF phenotypic vari-ance explained (R2) by all significant eight SNP loci was 34 %. Three (including one non-synonymous coding SNPs) SNPs of these, in three known cloned flowering genes (efl1, FLD and GI) had significant association (P: 1.5 × 10⁻⁸ to 1.1 × 10⁻⁹ with R2 of maximum effect and all significant SNP loci: 14–17 and 31 %, respectively) with DF in chick-pea (Table 1). Strong association of two regulatory (URR/DRR) SNPs derived from two differentially expressed genes (SFH3 and Myb protein-coding genes)-encoding transcripts (P: 2.0 × 10⁻⁸ to 1.0 × 10⁻⁹ with R2 of maxi-mum effect and all significant SNP loci: 8–13 and 28 %,
respectively) and three (including two non-synonymous coding SNP) genome-wide SNPs identified in three genes (bZIP, bHLH and SBP transcription factors) (P: 1.5 × 10⁻⁸ to 1.2 × 10⁻⁹ with R2 of maximum effect and all signifi-cant SNP loci: 7–13 and 25 %, respectively) was evident (Table 1). Interestingly, non-synonymous coding and regu-latory SNPs detected in efl1, FLD and GI known flower-ing genes, SFH3 candidate gene-encoding transcripts (dif-ferentially expressed during flower development) and SBP transcription factor gene (identified by GWAS) exhibited strong association (P ≤ 10−8 with R2 ≥ 10 %) with flow-ering time as compared to three other DF-associated SNPs identified in chickpea (Table 1).
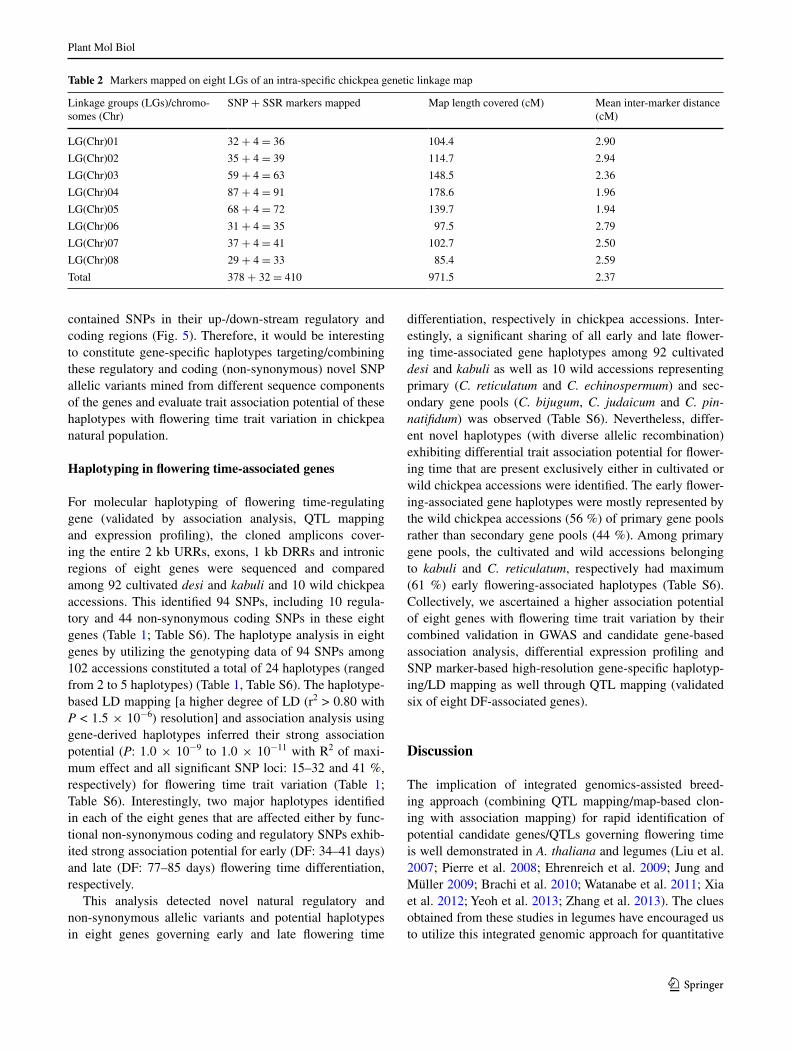
Validation of flowering time‑associated genes through QTL mapping and expression profiling
A high-density intra-specific genetic linkage map (ICC 16374 × ICC 762) was constructed by assigning 410 (including 378 SNP and 32 previously reported SSR mark-ers) parental polymorphic markers across eight chickpea LGs (LG1 to LG8) (Table 2). Our constructed genetic map covered a total map length of 971.5 cM with a mean inter-marker distance of 2.37 cM. The LG5 (average inter-marker distance: 1.94 cM) and LG2 (2.94 cM) had most and least saturated genetic maps, respectively (Table 2). A signifi-cant variation (31–73 days with mean CV: 25 % and mean H2: 80 %) of DF along with its bi-directional transgressive segregation-based normal frequency distribution in a devel-oped mapping population grown at multiple geographical
Fig. 2 LD decay (mean r2) estimated in a flowering time association panel (92 chickpea accessions) belonging to desi and kabuli populations using 19,839 genome-wide and gene-based SNPs physically mapped on eight chromosomes. The plotted curved lines depicted the mean r2 values among SNPs spaced with uniform 50 kb physical interval from 0 to 1000 kb

Plant Mol Biol
1 3
locations/years in field and green house (long- and short-day) conditions was observed (Fig. 3B; Table S4).
For flowering time QTL mapping, the genotyping data of 410 SNP and SSR markers genetically mapped on eight LGs was correlated with multilocation/years DF field/green house phenotyping data of mapping individu-als and parental accessions. Based on this analysis, five major (LOD: 5.4–11.7) genomic regions underlying robust QTLs (CaqDF3.1, CaqDF3.2, CaqDF4.1, CaqDF4.2, CaqDF5.1) (validated across two locations/years and mul-tiple growth conditions) governing DF were identified and mapped on three (3, 4 and 5) kabuli chromosomes (Fig. 4B; Tables 1, S5). A maximum number (two QTLs) of DF QTLs was mapped on LG3 and LG4. The phenotypic vari-ance explained (PVE) by individual DF QTL (R2) ranged
from 11.6 to 27.3 %. The combined PVE measured for all six major DF QTLs was 36.8 %. The additive gene effects (ranging 1.8–2.7) of all DF QTLs based on the effective contributions of ICC 16374 alleles for early flowering trait was observed. Interestingly, six non-synonymous and regu-latory SNPs in the six known/candidate genes (efl1, FLD, GI, SFH3, bZIP and SBP) revealing tight linkage with all major five robust DF QTLs were identified, which also had high trait association potential for flowering time based on our association analysis (Fig. 4A, B; Tables 1, S5). In sum-mary, we selected eight non-synonymous and regulatory SNP-containing eight known/candidate genes (efl1, FLD, GI, SFH3, Myb, bZIP, bHLH and SBP; validated by genetic association analysis), including six genes (efl1, FLD, GI, SFH3, bZIP and SBP; validated by QTL mapping) as target
Fig. 3 Frequency distribution of average DF trait variation measured in 92 desi and kabuli chickpea accessions (flowering time association panel) A as well as in 190 individuals and parental accessions of a F6 mapping population (ICC 16374 × ICC 762) B, grown at multi-
ple geographical locations/years in field and green house (long- and short-day) conditions. This distribution curve depicted a goodness of fit to the normal distribution

Plant Mol Biol
1 3
candidates for flowering time trait regulation (Table 1) by their further validation through differential expression pro-filing and molecular haplotyping in chickpea.
These SNP-containing eight flowering time-associated known/candidate genes were analysed for differential expression profiling to determine the regulatory patterns of the target genes for flowering time (Fig. 5; Table 1). The RNA was isolated from vegetative young leaf and shoot apical meristem (SAM) tissues, and four flower devel-opment stages (FB1, FB2, FB3 and FB4) of early (ICC 12968) and late (ICCX-810800) flowering two contrasting desi and kabuli chickpea accessions as well as mapping parents (ICC 16374 and ICC 762) and four homozygous mapping individuals. The isolated RNA was amplified
with gene-specific primers using semi-quantitative and quantitative RT-PCR assays. All eight known cloned/can-didate flowering genes showing strong association with flowering time (validated by association and/or QTL map-ping) exhibited flower-specific [compared with vegetative tissues (young leaves and SAM)] expression, including their differential up- (>threefolds, P ≤ 0.001 in efl1, FLD, GI, bZIP, bHLH and SBP genes) and down-(>3.5-folds, P ≤ 0.001 in SFH3 and Myb genes) regulation specifi-cally in four flower development stages of early flowering desi and kabuli chickpea accessions/mapping individuals as compared to that of late flowering accessions/individu-als (Fig. 5; Table 1). Interestingly, all the flower-specific genes differentially expressed during flower development
Fig. 4 A GWAS-based Manhatton plot revealing significant P values (estimated by CMLM model) associated with DF employing 30,129 genome-wide GBS- and candidate gene-based SNPs. The x-axis depicts the relative density of reference genome- and de novo-based SNPs physically mapped on eight chromosomes and scaffolds of kabuli genome. The y-axis represents the -log10 (P) value for signifi-cant association of SNP loci with DF. The SNPs exhibiting significant association with DF at cut-off P value ≤1 × 10⁻⁶ are indicated with dotted lines. B Five major genomic regions underlying five significant QTLs (PVE 11.3–25.2 %) associated with DF identified and mapped on three LGs/chromosomes (with a significant LOD > 6.3, P < 0.05) using a 190 F6 mapping population (ICC 16374 × ICC 762). The genetic distance (cM) and identity of the marker loci integrated on
the LGs are indicated on the above and below of the chromosomes, respectively. Six genes harbouring five robust QTLs associated strongly with DF based on GWAS are indicated by colour coded circles. CaqDF3.1 (Cicer arietinum QTL for days to 50 % flower-ing time on chromosome 3 number 1), CaqDF3.2 (Cicer arietinum QTL for days to 50 % flowering time on chromosome 3 number 2), CaqDF4.1 (Cicer arietinum QTL for days to 50 % flowering time on chromosome 4 number 1), CaqDF4.2 (Cicer arietinum QTL for days to 50 % flowering time on chromosome 4 number 2) and CaqDF5.1 (Cicer arietinum QTL for days to 50 % flowering time on chromo-some 5 number 1). *CaqDF4.1, CaqDF4.2 and CaqDF5.1 cor-respond to known QTLs reported previously for flowering time in chickpea

Plant Mol Biol
1 3
Tabl
e 1
Eig
ht S
NPs
-con
tain
ing
gene
s re
gula
ting
DF
delin
eate
d by
com
bini
ng G
WA
S an
d ca
ndid
ate
gene
-bas
ed a
ssoc
iatio
n m
appi
ng w
ith Q
TL
map
ping
, dif
fere
ntia
l ex
pres
sion
pro
filin
g an
d ge
ne-b
ased
mar
ker
hapl
otyp
ing/
LD
map
ping
in c
hick
pea
TF
tran
scri
ptio
n fa
ctor
Flow
erin
g tim
e-re
gula
ting
gene
s id
entifi
ed th
roug
h a G
WA
S an
d ca
ndid
ate
gene
(b kn
own
flow
erin
g ch
ickp
ea g
ene
orth
olog
s an
d c ge
ne-e
ncod
ing
tran
scri
pts
diff
eren
tially
exp
ress
ed d
urin
g flo
wer
de
velo
pmen
t in
chic
kpea
)-ba
sed
asso
ciat
ion
map
ping
* V
alid
ated
thro
ugh
QT
L m
appi
ng# D
etai
ls o
f ha
plot
ypes
con
stitu
ted
in th
e ge
nes
are
prov
ided
in th
e Ta
ble
S6
Gen
es d
iffe
rent
ially
d up-
and
e dow
n-re
gula
ted
duri
ng fl
ower
dev
elop
men
t
SNP
IDs
SNPs
(E
DF/
LD
F)C
hrom
osom
esPh
ysic
al
posi
tions
(bp
)K
abul
i gen
e ac
cess
ion
IDs
Ann
otat
ion
Puta
tive
func
tions
Ass
ocia
tion
pote
ntia
l of
SN
PsSN
Ps
(hap
loty
pes)
di
scov
ered
Ass
ocia
tion
pote
ntia
l of
hap
loty
pes#
P v
alue
R2 (
%)
P v
alue
R2 (
%)
Cak
SNP4
313a*
T/A
Ca_
kabu
li_ch
r329
,844
,509
Ca0
7292
Intr
onbZ
IP (
Bas
ic-
leuc
ine
zipp
er)
TFd
2.0 ×
10−
87
6 (2
)1.
0 ×
10−
915
Cak
SNP1
5256
aG
/AC
a_ka
buli_
sc
affo
ld30
02,
213,
710
Ca0
7844
CD
S (n
on-
syno
nym
ous)
Gly
cine
(G
GA
)-A
rgin
ine
(A
GA
)
bHL
H (
Bas
ic
helix
-loo
p-
helix
) T
Fd
1.5 ×
10−
89
7 (3
)1.
2 ×
10−
919
Cak
SNP4
801a*
A/T
Ca_
kabu
li_ch
r337
,101
,339
Ca0
1036
CD
S (n
on-
syno
nym
ous)
C
yste
ine
(TG
T)-
Se
rine
(A
GT
)
SBP
(SQ
UA
MO
SA
prom
oter
bin
ding
pr
otei
n) T
Fd
1.2 ×
10−
913
12 (
4)1.
4 ×
10−
1021
Cak
SNP6
699b*
G/A
Ca_
kabu
li_ch
r430
,308
,812
Ca1
4192
CD
S
(syn
onym
ous)
efl1
(ear
ly
flow
erin
g 1)
d1.
1 ×
10−
917
28 (
5)1.
0 ×
10−
1132
Cak
SNP1
0106
b*G
/AC
a_ka
buli_
chr6
11,6
65,2
33C
a250
61C
DS
(s
ynon
ymou
s)F
LD
(Fl
ower
ing
lo
cus
D)d
2.3 ×
10−
815
6 (2
)1.
7 ×
10−
931
Cak
SNP5
900b*
G/C
Ca_
kabu
li_ch
r411
,277
,574
Ca0
4359
CD
S
(non
-syn
onym
ous)
V
alin
e (G
TT
)-L
euci
ne
(CT
T)
GI
(GIG
AN
TE
A)d
1.5 ×
10−
814
25 (
4)1.
2 ×
10−
929
Cak
SNP8
428c
A/T
Ca_
kabu
li_ch
r530
,443
,858
Ca0
4722
DR
RM
yb (
Mye
lobl
asto
sis)
T
Fe2.
0 ×
10−
88
4 (2
)1.
3 ×
10−
916
Cak
SNP8
449c*
G/A
Ca_
kabu
li_ch
r530
,755
,584
Ca0
4769
UR
RSF
H3
(SE
C
14-l
ike
3)e
1.0 ×
10−
913
6 (2
)1.
0 ×
10−
1027
Plant Mol Biol
1 3
contained SNPs in their up-/down-stream regulatory and coding regions (Fig. 5). Therefore, it would be interesting to constitute gene-specific haplotypes targeting/combining these regulatory and coding (non-synonymous) novel SNP allelic variants mined from different sequence components of the genes and evaluate trait association potential of these haplotypes with flowering time trait variation in chickpea natural population.
Haplotyping in flowering time‑associated genes
For molecular haplotyping of flowering time-regulating gene (validated by association analysis, QTL mapping and expression profiling), the cloned amplicons cover-ing the entire 2 kb URRs, exons, 1 kb DRRs and intronic regions of eight genes were sequenced and compared among 92 cultivated desi and kabuli and 10 wild chickpea accessions. This identified 94 SNPs, including 10 regula-tory and 44 non-synonymous coding SNPs in these eight genes (Table 1; Table S6). The haplotype analysis in eight genes by utilizing the genotyping data of 94 SNPs among 102 accessions constituted a total of 24 haplotypes (ranged from 2 to 5 haplotypes) (Table 1, Table S6). The haplotype-based LD mapping [a higher degree of LD (r2 > 0.80 with P < 1.5 × 10⁻⁶) resolution] and association analysis using gene-derived haplotypes inferred their strong association potential (P: 1.0 × 10⁻⁹ to 1.0 × 10⁻¹¹ with R2 of maxi-mum effect and all significant SNP loci: 15–32 and 41 %, respectively) for flowering time trait variation (Table 1; Table S6). Interestingly, two major haplotypes identified in each of the eight genes that are affected either by func-tional non-synonymous coding and regulatory SNPs exhib-ited strong association potential for early (DF: 34–41 days) and late (DF: 77–85 days) flowering time differentiation, respectively.
This analysis detected novel natural regulatory and non-synonymous allelic variants and potential haplotypes in eight genes governing early and late flowering time
differentiation, respectively in chickpea accessions. Inter-estingly, a significant sharing of all early and late flower-ing time-associated gene haplotypes among 92 cultivated desi and kabuli as well as 10 wild accessions representing primary (C. reticulatum and C. echinospermum) and sec-ondary gene pools (C. bijugum, C. judaicum and C. pin-natifidum) was observed (Table S6). Nevertheless, differ-ent novel haplotypes (with diverse allelic recombination) exhibiting differential trait association potential for flower-ing time that are present exclusively either in cultivated or wild chickpea accessions were identified. The early flower-ing-associated gene haplotypes were mostly represented by the wild chickpea accessions (56 %) of primary gene pools rather than secondary gene pools (44 %). Among primary gene pools, the cultivated and wild accessions belonging to kabuli and C. reticulatum, respectively had maximum (61 %) early flowering-associated haplotypes (Table S6). Collectively, we ascertained a higher association potential of eight genes with flowering time trait variation by their combined validation in GWAS and candidate gene-based association analysis, differential expression profiling and SNP marker-based high-resolution gene-specific haplotyp-ing/LD mapping as well through QTL mapping (validated six of eight DF-associated genes).
Discussion
The implication of integrated genomics-assisted breed-ing approach (combining QTL mapping/map-based clon-ing with association mapping) for rapid identification of potential candidate genes/QTLs governing flowering time is well demonstrated in A. thaliana and legumes (Liu et al. 2007; Pierre et al. 2008; Ehrenreich et al. 2009; Jung and Müller 2009; Brachi et al. 2010; Watanabe et al. 2011; Xia et al. 2012; Yeoh et al. 2013; Zhang et al. 2013). The clues obtained from these studies in legumes have encouraged us to utilize this integrated genomic approach for quantitative
Table 2 Markers mapped on eight LGs of an intra-specific chickpea genetic linkage map
Linkage groups (LGs)/chromo-somes (Chr)
SNP + SSR markers mapped Map length covered (cM) Mean inter-marker distance (cM)
LG(Chr)01 32 + 4 = 36 104.4 2.90
LG(Chr)02 35 + 4 = 39 114.7 2.94
LG(Chr)03 59 + 4 = 63 148.5 2.36
LG(Chr)04 87 + 4 = 91 178.6 1.96
LG(Chr)05 68 + 4 = 72 139.7 1.94
LG(Chr)06 31 + 4 = 35 97.5 2.79
LG(Chr)07 37 + 4 = 41 102.7 2.50
LG(Chr)08 29 + 4 = 33 85.4 2.59
Total 378 + 32 = 410 971.5 2.37

Plant Mol Biol
1 3
Fig. 5 Hierarchical cluster display illustrating the differential expres-sion profiles of non-synonymous and regulatory SNPs-carrying eight genes (identified by association and genetic mapping) in diverse veg-etative young leaf (L) and shoot apical meristem (SAM) as well as four flower development stages (FB1, FB2, FL1 and FL2) of early and late flowering two contrasting chickpea accessions (ICC 12968 and ICCX-810800), mapping parental accessions (ICC 16374 and ICC 762) and four representative homozygous mapping individuals. The average log signal expression values of genes in various tissues/stages are mentioned at the top with a colour scale; in which green, black and red color denote low, medium and high level of expres-sion, respectively. The expression values across different tissues/development stages of accessions/mapping individuals were normal-ized using an endogenous control elongation factor-1 alpha in RT-PCR assay. The differential expression profiling of SNP-carrying genes in four flower development stages of early and late flowering accessions/mapping individuals was compared with their respective vegetative leaf and SAM tissues by considering the gene expression
in these vegetative tissues as reference calibrator (assigned 1). The genes exhibiting flower-specific expression, including pronounced differential up- and down-regulation in early and late flowering acces-sions/mapping individuals during flower development are indicated with red and black boxes, respectively. The detail structural and functional annotation of SNPs-containing eight genes are provided in the Table 1. The tissues/stages and genes utilized for expression profiling are mentioned on the right and top side of expression map, respectively. EDFHM1 and EDFHM2: early days to 50 % flowering homozygous mapping individuals 1 and 2, respectively. LDFHM1 and LDFHM2: late days to 50 % flowering homozygous mapping individuals 1 and 2, respectively. Numbers of mentioned in the ver-tical and horizontal bars depict the range (minimum, optimum and maximum) of correlation coefficient varying among tissues/stages of diverse contrasting accessions/mapping individuals during flower development and across flowering time-associated genes, respec-tively. NS non-synonymous SNP, S synonymous SNP, DRR down-stream regulatory region, URR upstream regulatory region
Plant Mol Biol
1 3
dissection of complex flowering time trait in chickpea. In current study, we have integrated genome-wide and candi-date gene-based association mapping with QTL mapping, differential gene expression profiling and gene-based hap-lotyping/LD mapping to delineate candidate genes under-lying the major QTLs regulating flowering time in chick-pea. Initially, to perform genome-wide association study (GWAS), a high-throughput GBS assay that is well-estab-lished for simultaneous large-scale discovery and genotyp-ing of SNPs at a genome-wide scale in chickpea (Deokar et al. 2014; Jaganathan et al. 2015; Kujur et al. 2015), was utilized. The use of this optimized GBS approach in a con-stituted flowering time chickpea association panel (92 desi and kabuli accessions) thus altogether identified 24,405 reference kabuli genome- and de novo-based SNPs for GWAS. More recently, the potential utility of GWAS and candidate gene-based association mapping in combina-tion for efficient dissection of complex quantitative traits and identification of high-resolution trait-associated genes/QTLs in a larger genome of chickpea with narrow genetic base (400-500 kb of longer chromosomal LD decay) has been realized (Kujur et al. 2015). A diverse array of known cloned genes/QTLs controlling flower development path-way in A. thaliana and legumes (Weller et al. 2009; Kong et al. 2010; Laurie et al. 2011; Andres and Coupland 2012; Kim et al. 2012; Pin and Nilsson 2012; Watanabe et al. 2012; Song et al. 2013; Yamashino et al. 2013; Zhai et al. 2014; Weller and Martínez 2015) as well as numerous gene-encoded transcripts that are differentially expressed (exhibiting preferential and flower-specific expression) during flower development in chickpea (Singh et al. 2013) are well documented. Primarily, for candidate gene-based association mapping, we scanned diverse coding and non-coding (introns, URRs and DRRs) sequence components of 914 selected known/candidate flowering gene-orthologs of chickpea in 12 representative desi and kabuli accessions based on amplicon sequencing to mine potential genic SNP allelic variants. The subsequent large-scale validation and high-throughput genotyping of these genic SNPs in a flow-ering time chickpea association panel (92 desi and kabuli accessions) detected 5724 SNPs, which were further uti-lized for flowering time candidate gene-based association mapping. Henceforth, a total of 30,129 genome-wide and flowering gene-derived SNPs (non-synonymous and regu-latory SNPs) discovered by us have profound potential to be utilized for multi-dimensional large-scale genotyping applications in chickpea. These SNPs, once validated and genotyped in large-scale natural and mapping populations, could be utilized for trait association mapping, construc-tion of high-density integrated genetic and physical link-age maps and fine-mapping/map-based cloning to iden-tify potential genes/QTLs controlling traits of agronomic importance in chickpea.
The use of 30,129 genome-wide and flowering gene-based SNPs scanned from a structured population (with 200–250 kb chromosomal LD decay) of chickpea in CMLM-based GWAS and candidate gene-based associa-tion mapping identified eight genomic loci associated with flowering time in chickpea. In line with Kujur et al. (2013), we observed a faster LD decay (~200 kb) and lower LD estimate (mean r2: 0.35) in diverse desi population group than that of kabuli population. All the chickpea accessions included in the association panel for flowering time associ-ation mapping are self-pollinating and underwent selective sweeps along with sequential evolutionary bottlenecks dur-ing their domestication from wild common ancestors (Jain et al. 2013; Varshney et al. 2013; Kujur et al. 2013, 2015; Saxena et al. 2014a). Therefore, extensive LD estimate and extended chromosomal LD decay observed in two desi and kabuli chickpea populations of association panel is expected. Collectively, the GBS-SNP genotyping-based population-specific LD patterns documented in this study at a genome-wide scale implicates deep insight regarding the SNP marker density needed for efficient GWAS to scan potential genomic loci (gene-associated targets) govern-ing important agronomic traits, including flowering time in a larger chickpea genome with narrow genetic base. The CMLM model-based approach deployed in this study for GWAS usually considers all compression levels of popu-lation structure, kinship and PCA algorithms for efficient estimation/detection of potential genomic loci associated with DF trait in chickpea. Therefore, this computation-ally efficient model-based strategy had potential for rapid genome-wide scanning of non-spurious SNP marker-trait association with maximal statistical power and high predic-tion accuracy (Lipka et al. 2012). Considering its added-advantages over other association model-based approaches as documented hitherto, the CMLM remains most widely adopted in GWAS for genetic dissection of complex traits in multiple crop plants (Stanton-Geddes et al. 2013; Sax-ena et al. 2014a, b; Kumar et al. 2015; Thudi et al. 2014). The flowering time trait-associated eight SNP loci being derived from diverse non-synonymous coding and regula-tory sequence components of the eight known/candidate flowering genes are considered to be functionally relevant. Such non-synonymous and regulatory SNPs are known to be involved in regulation of diverse complex seed/grain size and weight quantitative traits in chickpea (Kujur et al. 2013, 2014; Saxena et al. 2014b; Bajaj et al. 2015a, b). Henceforth, the potential molecular tags (novel SNP allelic variants in genes) identified by integrating GWAS and can-didate gene-based association mapping could essentially be employed for establishing quick marker-trait linkages and efficient identification/mapping of genes/QTLs governing flowering time trait in chickpea.

Plant Mol Biol
1 3
To ascertain the validity and robustness of the eight identified flowering time-associated candidate/known genes, the outcome of trait association mapping was fur-ther correlated with QTL mapping, differential gene expression profiling and gene-based molecular haplotyp-ing/LD mapping. The molecular mapping of QTLs in an intra-specific high-density genetic linkage map (average inter-marker distance: 2.37 cM) constructed using a large advanced generation flowering time contrasting mapping population (ICC 16374 × ICC 762), validated six major genes harboring five robust QTLs (CaqDF3.1, CaqDF3.2, CaqDF4.1, CaqDF4.2, CaqDF5.1) controlling flowering time in chickpea. In order to evaluate the accuracy and nov-elty of eight genomic loci and five major QTLs regulating flowering time detected by association and QTL mapping, respectively, we compared outcomes of the present study with that of previous reports. For this, the markers linked/flanking the flowering time known QTLs/genes (reported earlier in QTL mapping studies), were selected for their validation in flowering time natural (92 diverse desi and kabuli chickpea accessions) and mapping population (ICC 16374 × ICC 762) constituted in our study. This revealed correspondence of four genomic SNP loci underlying three known QTLs (CaqDF4.1, CaqDF4.2 and CaqDF5.1) gov-erning flowering time between past and our present study (Table S5) based on congruent flanking/linked marker physical/genetic positions on chromosomes (LGs) 4, 5 and 6. Therefore, four genomic loci and two QTLs controlling flowering time detected through high-resolution GWAS/candidate gene-based association and QTL mapping are novel, which possibly reflected their population-specific genetic inheritance pattern for flowering time trait regula-tion in chickpea. The flower-specific differential up/down-regulation of eight, including six (validated by QTL map-ping) flowering time-associated genes specifically in flower developmental stages of early flowering contrasting desi and kabuli accessions and mapping parents/homozygous mapping individuals based on differential gene expression profiling was apparent. The effective integration of expres-sion profiling further with SNP marker-based gene haplo-typing delineated diverse natural allelic variants and major haplotypes in eight known/candidate genes (including six genes harboring five robust QTLs) exhibiting strong asso-ciation with early and late flowering time differentiation in chickpea.
The flowering time is a complex quantitative trait and being regulated through a complex genetic network involv-ing diverse array of genes in crop plants (Andres and Cou-pland 2012; Song et al. 2013). The floral signal florigens encoding FT (Flowering Locus T) genes (gene families) and their homologs are the key mobile flowering integra-tors that stimulate/promote floral transition in the shoot apex of multiple plant species, including A. thaliana (Abe
et al. 2005; Wigge et al. 2005; Ito et al. 2012; Kumar et al. 2012; Liu et al. 2013; Nan et al. 2014). In the present study, by the use of a combinatorial strategy involving GWAS/candidate gene-based trait association mapping, QTL map-ping, differential gene expression profiling and gene-based molecular haplotyping/LD mapping, we scaled down eight known/candidate genes (efl1, FLD, GI, SFH3, Myb, bZIP, bHLH and SBP), including six genes (efl1, FLD, GI, SFH3, bZIP and SBP) harboring five robust QTLs regulating flow-ering time in chickpea. Among these, diverse major known flowering development pathway and FT genes like efl1, FLD and GI harboring the QTLs associated with flower-ing time have been identified through molecular mapping of flowering time QTLs in different intra- and inter-specific mapping population-derived genetic linkage maps of chick-pea (Cho et al. 2002; Lichtenzveig et al. 2006; Anbessa et al. 2006; Cobos et al. 2007, 2009; Radhika et al. 2007; Aryamanesh et al. 2010; Hossain et al. 2010; Gowda et al. 2011; Rehman et al. 2011; Cho et al. 2012; Hiremath et al. 2012; Vadez et al. 2012; Jamalabadi et al. 2013; Zhang et al. 2013; Varshney et al. 2014). A number of known FT genes, including photoperiod-independent early flowering 1 (efl1) and photoperiod-dependent circadian-clock-related gene GIGANTEA (GI) have been isolated and function-ally characterized to ascertain their role in flowering time regulation in legumes and A. thaliana (Hecht et al. 2007; Liu et al. 2008; Weller et al. 2009; Kong et al. 2010; Laurie et al. 2011; Watanabe et al. 2009; 2011; 2012; Andres and Coupland 2012; Kim et al. 2012; Pin and Nilsson 2012; Song et al. 2013; Yamashino et al. 2013; Zhai et al. 2014; Weller and Martínez 2015). The potential involvement of bHLH and bZIP transcription factors as well as FLD genes in controlling flowering time has been well deciphered in A. thaliana and legumes (Abe et al. 2005; Wigge et al. 2005; Searle et al. 2006; Udvardi et al. 2007; Li and Dub-covsky 2008; Yu et al. 2011; Ito et al. 2012; Kumar et al. 2012; Liu et al. 2013; Hu et al. 2014; Nan et al. 2014; Kawamoto et al. 2015). The transcriptional up-regulation, including elevated expression/accumulation of transcripts of these transcription factor genes in governing early flow-ering regardless of photoperiod is mediated through their preferential interactions (homo- and hetero-dimers)/bind-ing with the cis-acting elements in the promoters of dif-ferent genes like CO (CONSTANS), AP1 (APETALA1) and CRY2 (CRYPTOCHROME), which in turn activate the tran-scription of key flowering regulator FT genes. A potential FLD (MtFD) gene governing flowering time has been iden-tified by utilizing an integrated approach of whole genome sequence-based association genetics and QTL mapping in Medicago (Stanton-Geddes et al. 2013). The finding of flowering time-associated similar FLD gene in chickpea inferred the potential utility of identifying various homol-ogous genes contributing for natural allelic variations in

Plant Mol Biol
1 3
multiple legume/dicot species (Arabidopsis thaliana, Gly-cine max, Medicago truncatula and Pisum sativum) towards flowering time trait regulation. More interestingly, bZIP transcription factor forming complex with protein encoded by FT gene is known to play a central role in activation of genes governing floral transition from vegetative to repro-ductive development (Wang et al. 2009; Sussmilch et al. 2015; Weller and Martínez 2015). The SBP transcription factor gene is a direct upstream activator of floral meristem identity gene AP1 and flower promoting MADS box genes are known to be involved in its constitutive expression for floral transition and regulation of early flowering in A. thal-iana (Cardon et al. 1997; Guo et al. 2008; Yamaguchi et al. 2009; Wang et al. 2009). The SFH3 gene is predominantly expressed in the flowers and usually involved in the transfer of phosphatidylinositol/phosphatidylcholine phospholipids during flower development for transcriptional regulation of flowering time in A. thaliana (Mo et al. 2007; Wang et al. 2014). The photoperiod-dependent circadian-clock-related gene Myb transcription factor plays a crucial role in flower-ing time regulation in the presence of light and temperature by directly repressing the expression of ‘florigen’-encoding FT gene and gibberellin-encoding GA20ox2 (gibberellin 20 oxidase 2) gene and activating FLC (Flowering Locus C) gene in Arabidopsis and legumes (Hecht et al. 2007; Dubos et al. 2010; Zhao et al. 2011; Liu et al. 2013; Yan et al. 2014). The aforementioned overview concerning flowering time-associated known/candidate genes identified by the present and past studies inferred that differential regulation of these eight known/candidate genes-encoding transcripts is vital for their effective interactions as well as transcrip-tional activation of FT genes in controlling flowering time in chickpea.
The gene-based haplotyping/LD mapping among 102 cultivated (desi and kabuli) and wild chickpea accessions identified numerous novel natural allelic variants (94) and haplotypes (24) in eight flowering time-associated genes (identified by an integrated genomic approach) with vary-ing potential for flowering time trait regulation and evolu-tion. Therefore, the flowering time with regard to differ-ential vernalization response in cultivated desi and kabuli and wild chickpea accessions (evolved due to domestica-tion-led bottlenecks, Abbo et al. 2003; Berger et al. 2003, 2005, Burger et al. 2008; Toker 2009; Meyer et al. 2012; Jain et al. 2013; Kujur et al. 2013; Varshney et al. 2013; Saxena et al. 2014a) possibly represents an important com-ponent of domestication trait in chickpea. The flowering time-regulating functionally relevant molecular tags (mark-ers, genes, QTLs, alleles and haplotypes) identified in our study with an integrated genomic approach can be useful for quantitative dissection of complex flowering time trait and eventually marker-assisted genetic enhancement to develop early flowering cultivars of chickpea.
Acknowledgments The authors gratefully acknowledge the finan-cial support by the core grant of National Institute of Plant Genome Research (NIPGR), New Delhi, India. Shouvik Das acknowledges the Department of Biotechnology (DBT), Government of India for Junior Research Fellowship award.
References
Abbo S, Berger J, Turner NC (2003) Evolution of cultivated chickpea: four bottlenecks limit diversity and constrain adaptation. Funct Plant Biol 30:1081–1087
Abbo S, Pinhasi van-Oss R, Gopher A, Saranga Y, Ofner I, Peleg Z (2014) Plant domestication versus crop evolution: a concep-tual framework for cereals and grain legumes. Trends Plant Sci 19:351–360
Abe M, Kobayashi Y, Yamamoto S, Daimon Y, Yamaguchi A, Ikeda Y, Ichinoki H, Notaguchi M, Goto K, Araki T (2005) FD, a bZIP protein mediating signals from the floral pathway integrator FT at the shoot apex. Science 309:1052–1056
Agarwal G, Jhanwar S, Priya P, Singh VK, Saxena MS, Parida SK, Garg R, Tyagi AK, Jain M (2012) Comparative analysis of kabuli chickpea transcriptome with desi and wild chickpea pro-vides a rich resource for development of functional markers. PLoS ONE 7:e52443
Anbessa Y, Warkentin T, Vandenberg A, Ball R (2006) Inheritance of time to flowering in chickpea in a short-season temperate envi-ronments. J Hered 97:55–61
Andres F, Coupland G (2012) The genetic basis of flowering responses to seasonal cues. Nat Rev Genet 13:627–639
Aryamanesh N, Nelson MN, Yan G, Clarke HJ, Siddique KHM (2010) Mapping a major gene for growth habit and QTLs for Ascochyta blight resistance and flowering time in a popula-tion between chickpea and Cicer reticulatum. Euphytica 173:307–319
Bajaj D, Upadhyaya HD, Khan Y, Das S, Badoni S, Shree T, Kumar V, Tripathi S, Gowda CLL, Singh S, Sharma S, Tyagi AK, Chat-topdhyay D, Parida SK (2015a) A combinatorial approach of comprehensive QTL-based comparative genome mapping and transcript profiling identified a seed weight-regulating candidate gene in chickpea. Sci Rep 5:9264
Bajaj D, Saxena MS, Kujur A, Das S, Badoni S, Tripathi S, Upad-hyaya HD, Gowda CLL, Sharma S, Singh S, Tyagi AK, Parida SK (2015b) Genome-wide conserved non-coding microsatel-lite (CNMS) marker-based integrative genetical genomics for quantitative dissection of seed weight in chickpea. J Exp Bot 66:1271–1290
Benjamini Y, Hochberg Y (1995) Controlling the false discovery rate: a practical and powerful approach to multiple testing. J R Stat Soc B 57:289–300
Berger JD, Abbo S, Turner NC (2003) Ecogeography of annual wild Cicer species: the poor state of the world collection. Crop Sci 43:1076–1090
Berger JD, Buck R, Henzell JM, Turner NC (2005) Evolution in the genus Cicer vernalisation response and low temperature pod set in chickpea (C. arietinum L.) and its annual wild relatives. Aust J Agric Res 56:1191–1200
Brachi B, Faure N, Horton M, Flahauw E, Vazquez A, Nordborg M, Bergelson J, Cuguen J, Roux F (2010) Linkage and associa-tion mapping of Arabidopsis thaliana flowering time in nature. PLoS Genet 6:e1000940
Burger JC, Champan MA, Burke JM (2008) Molecular insights into the evolution of crop plants. Am J Bot 95:113–122
Cardon GH, Hohmann S, Nettesheim K, Saedler H, Huijser P (1997) Functional analysis of the Arabidopsis thaliana SBP-box gene

Plant Mol Biol
1 3
SPL3: a novel gene involved in the floral transition. Plant J 12:367–377
Cho SH, Kumar J, Shultz JL, Anupama K, Tefera F, Muehlbauer FJ (2002) Mapping genes for double podding and other morpho-logical traits in chickpea. Euphytica 128:285–292
Cho SH, Coruh C, Axtell MJ (2012) miR156 and miR390 regulate tasiRNA accumulation and developmental timing in Physcom-itrella patens. Plant Cell 24:4837–4849
Cobos MJ, Rubio J, Fernández-Romero MD, Garza R, Moreno MT, Millán T, Gil J (2007) Genetic analysis of seed size, yield and days to flowering in a chickpea recombinant inbred line population derived from a kabuli x desi cross. Ann Appl Biol 151:33–42
Cobos MJ, Winter P, Kharrat M, Cubero JI, Gil J, Milian T, Rubio J (2009) Genetic analysis of agronomic traits in a wide cross of chickpea. Field Crops Res 111:130–136
Deokar AA, Ramsay L, Sharpe AG, Diapari M, Sindhu A, Bett K, Warkentin TD, Tar’an B (2014) Genome-wide SNP identi-fication in chickpea for use in development of a high density genetic map and improvement of chickpea reference genome assembly. BMC Genomics 15:708
Dubos C, Stracke R, Grotewold E, Weisshaar B, Martin C, Lepiniec L (2010) MYB transcription factors in Arabidopsis. Trends Plant Sci 15:573–581
Ehrenreich IM, Hanzawa Y, Chou L, Roe JL, Kover PX, Purugganan MD (2009) Candidate gene association mapping of Arabidopsis flowering time. Genetics 183:325–335
Elshire RJ, Glaubitz JC, Sun Q, Poland JA, Kawamoto K, Buck-ler ES, Mitchell SE (2011) A robust, simple genotyping-by-sequencing (GBS) approach for high diversity species. PLoS ONE 6:e19379
Gaur R, Azam S, Jeena G, Khan AW, Choudhary S, Jain M, Yadav G, Tyagi AK, Chattopadhyay D, Bhatia S (2012) High-through-put SNP discovery and genotyping for constructing a satu-rated linkage map of chickpea (Cicer arietinum L.). DNA Res 19:357–373
Gaur PM, Samineni S, Tripathi S, Varshney RK, Gowda CLL (2014) Allelic relationships of flowering time genes in chickpea. Euphytica 203:295–308
Gowda SJM, Radzika P, Mhase LB, Jamadagni BM, Gupta VS, Kadro NY (2011) Mapping of QTLs governing agronomic and field traits in chickpea. J Appl Genet 52:9–21
Guo AY, Zhu QH, Gu X, Ge S, Yang J, Luo J (2008) Genome-wide identification and evolutionary analysis of the plant specific SBP-box transcription factor family. Gene 418:1–8
Hecht V, Knowles CL, Schoor JKV, Liew LC, Jones SE, Lambert MJM, Weller JL (2007) Pea LATE BLOOMER1 is a GIGANTEA ortholog with roles in photoperiodic flowering, deetiolation and transcriptional regulation of circadian clock gene homologs. Plant Physiol 144:648–661
Hegde VS (2010) Genetics of flowering time in chickpea in a semi-arid environment. Plant Breed 129:683–687
Hiremath PJ, Kumar A, Penmetsa RV, Farmer A, Schlueter JA, Chamarthi SK, Whaley AM, Carrasquilla-Garcia N, Gaur PM, Upadhyaya HD, Kavi Kishor PB, Shah TM, Cook DR, Varsh-ney RK (2012) Large-scale development of cost-effective SNP marker assays for diversity assessment and genetic mapping in chickpea and comparative mapping in legumes. Plant Biotech-nol J 10:716–732
Hossain S, Ford R, McNeil DL, Pittock C, Pannozzo JF (2010) Devel-opment of a selection tool for seed shape and QTL analysis of seed shape with other morphological traits for selective breed-ing in chickpea (Cicer arietinum L.). Aust J Crop Sci 4:278–288
Hu JY, Zhou Y, He F, Dong X, Liu LY, Coupland G, Turck F, de Meaux J (2014) miR824-regulated AGAMOUS-LIKE16
contributes to flowering time repression in Arabidopsis. Plant Cell 26:2024–2037
Ito S, Song YH, Josephson-Day AR, Miller RJ, Breton G, Olmstead RG, Imaizumi T (2012) FLOWERING BHLH transcriptional activators control expression of the photoperiodic flowering regulator CONSTANS in Arabidopsis. Proc Natl Acad Sci USA 109:3582–3587
Jaganathan D, Thudi M, Kale S, Azam S, Roorkiwal M, Gaur PM, Kishor PB, Nguyen H, Sutton T, Varshney RK (2015) Geno-typing-by-sequencing based intra-specific genetic map refines a ‘‘QTL-hotspot” region for drought tolerance in chickpea. Mol Genet Genomics 290:559–571
Jain M, Misra G, Patel RK, Priya P, Jhanwar S, Khan AW, Shah N, Singh VK, Garg R, Jeena G, Yadav M, Kant C, Sharma P, Yadav G, Bhatia S, Tyagi AK, Chattopadhyay D (2013) A draft genome sequence of the pulse crop chickpea (Cicer arietinum L.). Plant J 74:715–729
Jamalabadi JG, Saidi A, Karami E, Kharkesh M, Talebi R (2013) Molecular mapping and characterization of genes governing time to flowering, seed weight and plant height in an intra-spe-cific genetic linkage map of chickpea (Cicer arietinum). Bio-chem Genet 51:387–397
Jhanwar S, Priya P, Garg R, Parida SK, Tyagi AK, Jain M (2012) Transcriptome sequencing of wild chickpea as a rich resource for marker development. Plant Biotechnol J 10:690–702
Jung C, Müller AE (2009) Flowering time control and applications in plant breeding. Trends Plant Sci 14:563–573
Jung CH, Wong CE, Singh MB, Bhalla PL (2012) Comparative genomic analysis of soybean flowering genes. PLoS ONE 7:e38250
Kashiwagi J, Krishnamurthy L, Gaur PM, Upadhyaya HD, Varshney RK, Tobita S (2013) Traits of relevance to improve yield under terminal drought stress in chickpea (C. arietinum L.). Field Crops Res 145:88–95
Kawamoto N, Sasabe M, Endo M, Machida Y, Araki T (2015) Cal-cium-dependent protein kinases responsible for the phosphoryl-ation of a bZIP transcription factor FD crucial for the florigen complex formation. Sci Rep 5:8341
Kim MY, Shin JH, Kang YJ, Shim SR, Lee SH (2012) Divergence of flowering genes in soybean. J Biosci 37:857–870
Kong F, Liu B, Xia Z, Sato S, Kim BM, Watanabe S, Yamada T, Tabata S, Kanazawa A, Harada K, Abe J (2010) Two coor-dinately regulated homologs of FLOWERING LOCUS T are involved in the control of photoperiodic flowering in soybean. Plant Physiol 154:1220–1231
Kujur A, Bajaj D, Saxena MS, Tripathi S, Upadhyaya HD, Gowda CLL, Singh S, Jain M, Tyagi AK, Parida SK (2013) Function-ally relevant microsatellite markers from chickpea transcription factor genes for efficient genotyping applications and trait asso-ciation mapping. DNA Res 20:355–374
Kujur A, Bajaj D, Saxena MS, Tripathi S, Upadhyaya HD, Gowda CLL, Singh S, Jain M, Tyagi AK, Parida SK (2014) An effi-cient and cost-effective approach for genic microsatellite marker-based large-scale trait association mapping: identifica-tion of candidate genes for seed weight in chickpea. Mol Breed 34:241–265
Kujur A, Bajaj D, Upadhyaya HD, Das S, Ranjan R, Shree T, Sax-ena MS, Badoni S, Kumar V, Tripathi S, Gowda CLL, Sharma S, Singh S, Tyagi AK, Parida SK (2015) Employing genome-wide SNP discovery and genotyping strategy to extrapolate the natural allelic diversity and domestication patterns in chickpea. Front Plant Sci 6:162
Kumar J, Abbo S (2001) Genetics of flowering time in chickpea and its bearing on productivity in semiarid environments. Adv Agron 72:107–138
Plant Mol Biol
1 3
Kumar J, Van Rheenen HA (2000) A major gene for time of flowering in chickpea. J Hered 91:67–68
Kumar J, Sethi SC, Johansen C, Kelly TG, Rehman MM, van Rheenen HA (1996) Potential of short-duration chickpea varie-ties. J Dryland Agri Res Dev 11:28–32
Kumar J, Choudhary AK, Solanki RK, Pratap A (2011) Towards marker-assisted selection in pulses: a review. Plant Breed 130:297–313
Kumar SV, Lucyshyn D, Jaeger KE, Alos E, Alvey E, Harberd NP, Wigge PA (2012) Transcription factor PIF4 controls the ther-mosensory activation of flowering. Nature 484:242–245
Kumar V, Singh A, Amitha Mithra SV, Krishnamurthy SL, Parida SK, Jain S, Tiwari KK, Kumar P, Rao AR, Sharma SK, Khurana JP, Singh NK, Mohapatra T (2015) Genome-wide association mapping of salinity tolerance in rice (Oryza sativa). DNA Res 22:133–145
Langmead B, Salzberg SL (2012) Fast gapped-read alignment with Bowtie 2. Nat Methods 9:357–359
Laurie RE, Diwadkar P, Jaudal M, Zhang L, Hecht V, Wen J, Tadege M, Mysore KS, Putterill J, Weller JL, Macknight RC (2011) The Medicago truncatula Flowering Locus T homolog, MtFTa1, is a key regulator of flowering time. Plant Physiol 156:2207–2224
Li C, Dubcovsky J (2008) Wheat FT protein regulates VRN1 tran-scription through interactions with FDL2. Plant J 55:543–554
Lichtenzveig J, Bonfil DJ, Zhang HB, Shtienberg D, Abbo S (2006) Mapping quantitative trait loci in chickpea associated with time to flowering and resistance to Didymella rabiei the causal agent of Ascochyta blight. Theor Appl Genet 113:1357–1369
Lipka AE, Tian F, Wang Q, Peiffer J, Li M, Bradbury PJ, Gore MA, Buckler ES, Zhang Z (2012) GAPIT: genome association and prediction integrated tool. Bioinformatics 28:2397–2399
Liu F, Quesada V, Crevillen P, Bäurle I, Swiezewski S, Dean C (2007) The Arabidopsis RNA-binding protein FCA requires a lysine-specific demethylase 1 homolog to downregulate FLC. Mol Cell 28:398–407
Liu B, Kanazawa A, Matsumura H, Takahashi R, Harada K, Abe J (2008) Genetic redundancy in soybean photoresponses asso-ciated with duplication of the phytochrome A gene. Genetics 180:995–1007
Liu Y, Li X, Li K, Liu H, Lin C (2013) Multiple bHLH proteins form heterodimers to mediate CRY2-dependent regulation of flower-ing-time in Arabidopsis. PLoS Genet 9:e1003861
Meyer RS, DuVal AE, Jensen HR (2012) Patterns and processes in crop domestication: an historical review and quantitative analy-sis of 203 global food crops. New Phytol 196:29–48
Mo P, Zhu Y, Liu X, Zhang A, Yan C, Wang D (2007) Identification of two phosphatidylinositol/phosphatidylcholine transfer pro-tein genes that are predominately transcribed in the flowers of Arabidopsis thaliana. J Plant Physiol 164:478–486
Nan H, Cao D, Zhang D, Li Y, Lu S, Tang L, Yuan X, Liu B, Kong F (2014) GmFT2a and GmFT5a redundantly and differentially regulate flowering through interaction with and upregulation of the bZIP transcription factor GmFDL19 in soybean. PLoS ONE 9:e97669
Or E, Hovav R, Abbo S (1999) A major gene for flowering time in chickpea. Crop Sci 39:315–322
Pierre JB, Huguet T, Barre P, Huyghe C, Julier B (2008) Detection of QTLs for flowering date in three mapping populations of the model legume species Medicago truncatula. Theor Appl Genet 117:609–620
Pierre JB, Bogard M, Herrmann D, Huyghe C, Julier B (2011) A CONSTANS-like gene candidate that could explain most of the genetic variation for flowering date in Medicago truncatula. Mol Breed 28:25–35
Pin PA, Nilsson O (2012) The multifaceted roles of FLOWERING LOCUS T in plant development. Plant Cell Environ 35:1742–1755
Radhika P, Gowda SJM, Kadoo NY, Mhase LB, Jamadagni BM, Sai-nani MN, Chandra S, Gupta VS (2007) Development of an inte-grated intraspecific map of chickpea (Cicer arietinum L.) using two recombinant inbred line populations. Theor Appl Genet 115:209–216
Rehman AU, Malhotra RS, Bett K, Tar’an B, Bueckert R, Warkentin TD (2011) Mapping QTL associated with traits affecting grain yield in chickpea (Cicer arietinum L.) under terminal drought stress. Crop Sci 51:450–463
Roorkiwal M, Sawargaonkar SL, Chitikineni A, Thudi M, Saxena RK, Upadhyaya HD, Vales MI, Riera-Lizarazu O, Varshney RK (2013) Single nucleotide polymorphism genotyping for breed-ing and genetics applications in chickpea and pigeonpea using the BeadXpress platform. Plant Genome 6:1–10
Saxena MS, Bajaj D, Kujur A, Das S, Badoni S, Kumar V, Singh M, Bansal KC, Tyagi AK, Parida SK (2014a) Natural allelic diver-sity, genetic structure and linkage disequilibrium pattern in wild chickpea. PLoS ONE 9:e107484
Saxena MS, Bajaj D, Das S, Kujur A, Kumar V, Singh M, Bansal KC, Tyagi AK, Parida SK (2014b) An integrated genomic approach for rapid delineation of candidate genes regulating agro-mor-phological traits in chickpea. DNA Res 21:695–710
Searle I, He YH, Turck F, Vincent C, Fornara F, Krober S, Amasino RA, Coupland G (2006) The transcription factor FLC confers a flowering response to vernalization by repressing meristem competence and systemic signaling in Arabidopsis. Genes Dev 20:898–912
Singh VK, Garg R, Jain M (2013) A global view of transcriptome dynamics during flower development in chickpea by deep sequencing. Plant Biotechnol J 11:691–701
Song YH, Ito S, Imaizumi T (2013) Flowering time regulation: pho-toperiod- and temperature-sensing in leaves. Trends Plant Sci 18:575–583
Stanton-Geddes J, Paape T, Epstein B, Briskine R, Yoder J, Mudge J, Bharti AK, Farmer AD, Zhou P, Denny R, May GD, Erlandson S, Yakub M, Sugawara M, Sadowsky MJ, Young ND, Tiffin P (2013) Candidate genes and genetic architecture of symbiotic and agronomic traits revealed by whole-genome, sequence-based association genetics in Medicago truncatula. PLoS ONE 8:e65688
Stephens A, Lombardi M, Cogan NOI, Forster JW, Hobson K, Materne M, Kaur S (2014) Genetic marker discovery, intraspe-cific linkage map construction and quantitative trait locus analy-sis of Ascochyta blight resistance in chickpea (Cicer arietinum L.). Mol Breed 33:297–313
Subbarao GV, Johansen C, Slinkard AE, Rao RCN, Saxena NP, Chau-han YS (1995) Strategies for improving drought resistance in grain legumes. Crit Rev Plant Sci 14:469–523
Summerfield RJ, Ellis RH, Roberts EH (1989) Vernalization in chick-pea (Cicer arietinum); Fact or artefact? Annal Bot 64:599–604
Sussmilch F, Berbel A, Hecht V, Schoor JKV, Ferrandiz C, Madueño F, Weller JL (2015) Pea VEGETATIVE2 is an FD homolog that is essential for flowering and compound inflorescence develop-ment. Plant Cell 27:1046–1060
Thudi M, Bohra A, Nayak SN, Varghese N, Shah TM, Penmetsa RV, Thirunavukkarasu N, Gudipati S, Gaur PM, Kulwal PL, Upad-hyaya HD, Kavi kishor PB, Winter P, Kahl G, Town CD, Kil-ian A, Cook DR, Varshney RK (2011) Novel SSR markers from BAC-end sequences, DArT arrays and a comprehensive genetic map with 1,291 marker loci for chickpea (Cicer arietinum L.). PLoS ONE 6:e27275
Thudi M, Upadhyaya HD, Rathore A, Gaur PM, Krishnamurthy L, Roorkiwal M, Nayak SN, Chaturvedi SK, Basu PS, Gangarao NV, Fikre A, Kimurto P, Sharma PC, Sheshashayee MS, Tobita S, Kashiwagi J, Ito O, Killian A, Varshney RK (2014) Genetic dissection of drought and heat tolerance in chickpea through

Plant Mol Biol
1 3
genome-wide and candidate gene-based association mapping approaches. PLoS ONE 9:e96758
Toker C (2009) A note on the evolution of kabuli chickpeas as shown by induced mutations in Cicer reticulatum Ladizinsky. Genet Resour Crop Evol 56:7–12
Turner NC, Abbo S, Berger JD, Chaturvedi SK, French RJ, Ludwig C, Mannur DM, Singh SJ, Yadava HS (2007) Osmotic adjust-ment in chickpea (Cicer arietinum L.) results in no yield benefit under terminal drought. J Exp Bot 58:187–194
Udvardi MK, Kakar K, Wandrey M, Montanari O, Murray J, Andrian-kaja A, Zhang JY, Benedito V, Hofer JMI, Chueng F, Town CD (2007) Legume transcription factors: global regulators of plant development and response to the environment. Plant Physiol 144:538–549
Upadhyaya HD, Bramel PJ, Singh S (2001) Development of a chick-pea core subset using geographic distribution and quantitative traits. Crop Sci 41:206–210
Upadhyaya HD, Dwivedi SL, Baum M, Varshney RK, Udupa SM, Gowda CLL, Hoisington D, Singh S (2008) Genetic structure, diversity and allelic richness in composite collection and refer-ence set in chickpea (Cicer arietinum L.). BMC Plant Biol 8:106
Vadez V, Krishnamurthy L, Thudi M, Anuradha C, Colmer TD, Turner NC, Siddique KHM, Gaur PM, Varshney RK (2012) Assessment of ICCV2 x JG62 chickpea progenies shows sen-sitivity of reproduction to salt stress and reveals QTL for seed yield and yield components. Mol Breed 30:9–21
Varshney RK, Song C, Saxena RK et al (2013) Draft genome sequence of chickpea (Cicer arietinum) provides a resource for trait improvement. Nat Biotechnol 31:240–246
Varshney R, Thudi M, Nayak S, Gaur P, Kashiwagi J, Krishnamur-thy L, Jaganathan D, Koppolu J, Bohra A, Tripathi S, Rathore A, Jukanti A, Jayalakshmi V, Vemula A, Singh SJ, Yasin M, Sheshshayee MS, Viswanatha KP (2014) Genetic dissection of drought tolerance in chickpea (Cicer arietinum L.). Theor Appl Genet 127:445–462
Wang JW, Czech B, Weigel D (2009) miR156-regulated SPL tran-scription factors define an endogenous flowering pathway in Arabidopsis thaliana. Cell 138:738–749
Wang H, You C, Chang F, Wang Y, Wang L, Qi J, Ma H (2014) Alter-native splicing during Arabidopsis flower development results in constitutive and stage-regulated isoforms. Front Genet 5:25
Watanabe S, Hideshima R, Xia Z, Tsubokura Y, Sato S, Nakamoto Y, Yamanaka N, Takahashi R, Ishimoto M, Anai T, Tabata S, Harada K (2009) Map-based cloning of the gene associated with the soybean maturity locus E3. Genetics 182:1251–1262
Watanabe S, Xia Z, Hideshima R, Tsubokura Y, Sato S, Yamanaka N, Takahashi R, Anai T, Tabata S, Kitamura K, Harada K (2011) A map-based cloning strategy employing a residual heterozygous line reveals that the GIGANTEA gene is involved in soybean maturity and flowering. Genetics 188:395–407
Watanabe S, Harada K, Abe J (2012) Genetic and molecular bases of photoperiod responses of flowering in soybean. Breed Sci 61:531–543
Weller JL, Martínez RO (2015) Genetic control of flowering time in legumes. Front Plant Sci 6:207
Weller JL, Hecht V, Liew LC, Sussmilch FC, Wenden B, Knowles CL, Schoor JKV (2009) Update on the genetic control of flow-ering in garden pea. J Exp Bot 60:2493–2499
Wigge PA, Kim MC, Jaeger KE, Busch W, Schmid M, Lohmann JU, Weigel D (2005) Integration of spatial and temporal information during floral induction in Arabidopsis. Science 309:1056–1059
Winter P, Pfaff T, Udupa SM, Hüttel B, Sharma PC, Sahi S, Arreguin-Espinoza R, Weigand F, Muehlbauer FJ, Kahl G (1999) Charac-terization and mapping of sequence-tagged microsatellite sites in the chickpea (Cicer arietinum L.) genome. Mol Gen Genet 262:90–101
Winter P, Benko-Iseppon AM, Hüttel B, Ratnaparkhe M, Tullu A, Sonnante G, Pfaff T, Tekeoglu M, Santra D, Sant VJ, Rajesh PN, Kahl G, Muehlbauer FJ (2000) A linkage map of chickpea (Cicer arietinum L.) genome based on recombinant inbred lines from a C. arietinum x C. reticulatum cross:localization of resist-ance genes for Fusarium wilt races 4 and 5. Theor Appl Genet 101:1155–1163
Xia Z, Watanabe S, Yamada T, Tsubokura Y, Nakashima H, Zhai H, Anai T, Sato S, Yamazaki T, Lu S, Wu H, Tabata S, Harada K (2012) Positional cloning and characterization reveal the molec-ular basis for soybean maturity locus E1 that regulates photo-periodic flowering. Proc Natl Acad Sci USA 109:E2155–E2164
Yamaguchi A, Wu M, Yang L, Wu G, Poethig RS, Wagner D (2009) The microRNA-regulated SBP-box transcription factor SPL3 is a direct upstream activator of LEAFY, FRUITFULL and APETALA1. Dev Cell 17:268–278
Yamashino T, Yamawaki S, Hagui E, Ueoka-Nakanishi H, Nakamichi N, Ito S, Mizuno T (2013) Clock-controlled and FLOWER-ING LOCUS T (FT)-dependent photoperiodic pathway in Lotus japonicus I: verification of the flowering-associated function of an FT homolog. Biosci Biotechnol Biochem 77:747–753
Yan Y, Shen L, Chen Y, Bao S, Thong Z, Yu H (2014) A MYB-domain protein EFM mediates flowering responses to environmental cues in Arabidopsis. Dev Cell 30:437–448
Yeoh CC, Balcerowicz M, Zhang L, Jaudal M, Brocard L, Ratet P, Putterill J (2013) Fine mapping links the FTa1 flowering time regulator to the dominant spring1 locus in Medicago. PLoS ONE 8:e53467
Yu CW, Liu X, Luo M, Chen C, Lin X, Tian G, Lu Q, Cui Y, Wu K (2011) HISTONE DEACETYLASE6 interacts with FLOWER-ING LOCUS D and regulates flowering in Arabidopsis. Plant Physiol 156:173–184
Zaman-Allah M, Jenkinson DM, Vadez V (2011) Chickpea genotypes contrasting for seed yield under terminal drought stress in the field differ for traits related to the control of water use. Funct Plant Biol 38:270–281
Zhai H, Lu S, Liang S, Wu H, Zhang X, Liu B, Kong F, Yuan X, Li J, Xia Z (2014) GmFT4, a homolog of FLOWERING LOCUS T, is positively regulated by E1 and functions as a flowering repres-sor in soybean. PLoS ONE 9:e89030
Zhang D, Cheng H, Hu Z, Wang H, Kan G, Liu C, Yu D (2013) Fine mapping of a major flowering time QTL on soybean chromo-some 6 combining linkage and association analysis. Euphytica 191:23–33
Zhao C, Hanada A, Yamaguchi S, Kamiya Y, Beers EP (2011) The Arabidopsis Myb genes MYR1 and MYR2 are redundant nega-tive regulators of flowering time under decreased light intensity. Plant J 66:502–515