officer accessions flow model - apps.dtic.mil
TRANSCRIPT
Officer Accessions Flow Model
Mr. Gene Lesinski, M.S. Lead Analyst, Operations Research Center
Mr. John Pinter, B.S. Analyst, Center for Accessions Research, Marketing and Cohort Division
LTC Paul Kucik, Ph.D.Director, Operations Research Center
LTC Greg Lamm, M.S.Chief, Center for Accessions Research, Marketing and Cohort Di-vision
Operations Research Center of ExcellenceWest Point, NY 10996July 2011
ORCEN Technical Report: DSE-TR-1103DTIC: ADA546536

Executive Summary
Problem Definition
Each year, the Army accesses more than 7000 officers from across all the commissioning sources - West Point, the Reserve Officer Training Corps (ROTC), and Officer Candidate School (OCS). Of those officers, the U.S. Army Accessions Command (USAAC) is directly responsible for supplying more than half of these commissions - those from ROTC and College Option OCS. As the Army made the transition to the ARFORGEN readiness model, it became evident that a greater level of precision was necessary in placing newly commissioned officers in deploying units. The purpose of this modeling effort is to model the current “as is” process that an officer negotiates from pre-commissioning to the first unit of assignment to assist with synchronization of the officer accession and training with the Army Force Generation (ARFORGEN) process. In addition, it will facilitate “what if’ analysis in which operational leaders can model potential changes to the system and the resulting consequences – both intended and unintended
Technical Approach
The methodology employed for this modeling and analysis effort began with a thorough stakeholder analysis to identify key questions of value to stakeholders and uncover the research questions to be addressed via modeling and analysis. Next, a conceptual model of officer flow was developed that started with entry to the sources of commission to the first unit of assignment. Attention then shifted to identification of data requirements necessary to support model development. Significant time was then focused on gathering, cleaning, and formatting the data in a series of spreadsheets to facilitate future data updates and input to the model. A discrete-event simulation model was then developed in ProModel© utilizing a phased programming approach. The simulation model tracks officers from source of commission to first unit of assignment recording relevant statistics and measures while allowing adjustment of key stakeholder variables to determine their impacts on metrics of interest and fundamental research questions. Verification and validation was then conducted to ensure the model was working as intended and in fact reflected reality. Lastly, numerous scenarios were run and analyzed to determine the impacts of stakeholder proposed changes on key enterprise metrics of interest.
Results
In this research effort we developed a discrete-event simulation to replicate the flow of officers from their commissioning source to their first unit of assignment. The model is comprised of a series of Excel macros, updateable Excel input files, and a Promodel© simulation. The model provides a tool for decision makers to conduct “what if” analysis – specifically, exploration of BOLC-B course capacity changes, BOLC-B allocation strategies, BOLC-B scheduling rules, and ROTC commissioning date profile adjustments. A series of output tables and graphics capture the effects of these parameter changes on key stakeholder metrics of interest including: ROTC hold population, BOLC-B wait times, time from commission to first unit, and timing of LT unit arrivals in relation to ARFORGEN cycles.
As we conduct “what if” analysis, we focus particular attention on ROTC officers and Armor (AR), Infantry (IN), and Military Police (MP) Lieutenants. ROTC officers have historically had the longest average BOLC-B wait times (123 days) and a large portion of these officers are placed in a “hold” status
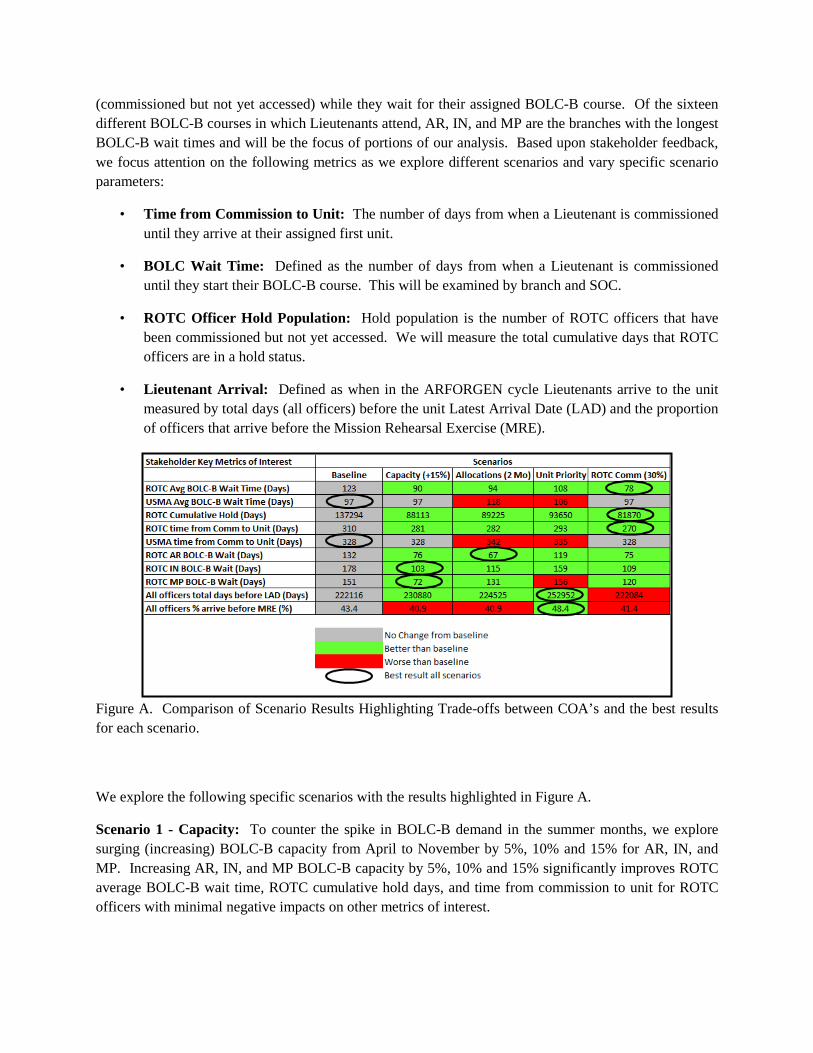
(commissioned but not yet accessed) while they wait for their assigned BOLC-B course. Of the sixteen different BOLC-B courses in which Lieutenants attend, AR, IN, and MP are the branches with the longest BOLC-B wait times and will be the focus of portions of our analysis. Based upon stakeholder feedback, we focus attention on the following metrics as we explore different scenarios and vary specific scenario parameters:
• Time from Commission to Unit: The number of days from when a Lieutenant is commissioned until they arrive at their assigned first unit.
• BOLC Wait Time: Defined as the number of days from when a Lieutenant is commissioned until they start their BOLC-B course. This will be examined by branch and SOC.
• ROTC Officer Hold Population: Hold population is the number of ROTC officers that have been commissioned but not yet accessed. We will measure the total cumulative days that ROTC officers are in a hold status.
• Lieutenant Arrival: Defined as when in the ARFORGEN cycle Lieutenants arrive to the unit measured by total days (all officers) before the unit Latest Arrival Date (LAD) and the proportion of officers that arrive before the Mission Rehearsal Exercise (MRE).
Figure A. Comparison of Scenario Results Highlighting Trade-offs between COA’s and the best results for each scenario.
We explore the following specific scenarios with the results highlighted in Figure A.
Scenario 1 - Capacity: To counter the spike in BOLC-B demand in the summer months, we explore surging (increasing) BOLC-B capacity from April to November by 5%, 10% and 15% for AR, IN, and MP. Increasing AR, IN, and MP BOLC-B capacity by 5%, 10% and 15% significantly improves ROTC average BOLC-B wait time, ROTC cumulative hold days, and time from commission to unit for ROTC officers with minimal negative impacts on other metrics of interest.

Scenario 2 - Allocation: To address the concern of “USMA-centric” BOLC-B allocations in June and July, we shift the first major BOLC-B allocations from USMA to ROTC by one month (June) and two months (June and July). A two month shift improves most of the metrics of interest but negatively affects USMA BOLC-B wait time and time from commission to unit.
Scenario 3 - Unit Priority: A large portion of USMA officers select their own BOLC-B dates completely divorced of their unit assignment and that unit’s ARFORGEN cycle. We reschedule all FY10 cohort LTs for BOLC-B based upon unit priority based upon number of days until LAD. Rescheduling all FY10 cohort LTs for BOLC-B based upon unit priority greatly improves total days before LAD and the proportion of officers that arrive before the MRE but has mixed results regarding some of the other metrics.
Scenario 4 - ROTC Commissioning Date Profile: Only 12% of ROTC officers are commissioned in December. As an additional means to counter the spike in BOLC-B demand in the summer months, we explore shifting a portion (10%,20%, and 30%) of FY10 May commissionees to December. Shifting 30% of ROTC commissionees from May to December greatly improves ROTC average BOLC-B wait time, ROTC cumulative hold days, and time from commission to unit for ROTC officers. However, total days before LAD and proportion of officers arriving before the MRE are negatively affected. This is primarily due to how the May commissionees are currently selected (randomly) to shift to December and could likely be improved with a refined selection process.
In general, scheduling officers to arrive at their first units without regard to the unit ARFORGEN cycle is counter-productive. A recommended future model refinement would be adjusting the model BOLC-B scheduling rules to incorporate this factor.
In summary, this modeling effort captures the “as is” process that an officer must negotiate from commissioning to first unit of assignment (FUA) – allowing “what if” analysis of stakeholder identified variables of interest. Scenario analysis reveals opportunities for increased efficiency in the officer accession process as well as highlighting strategic tradeoffs. This model provides an analytical tool to inform accession policy and a foundation to examine other variables of interest with minimal future refinements.

Acknowledgment
While their names do not explicitly appear on the cover page of this report, this study had many other critical supporters and analysts. Primary among these is the tireless, patient, and consummate professional Mr. Steve Courtney. A senior consultant with the ProModel© Corporation, Steve has been absolutely fundamental as the programmer of this simulation model, consistently performing well beyond any expectations. Mr. Ike Zeitler and CPT Dave Harnass of Human Resources Command provided their valuable time and advice throughout the project as SMEs in the officer management domain. MAJ Adam Albrich, DA G1, was invaluable in providing key personnel data as well as patiently explaining the extremely complex Army personnel processes. MAJ Ed Pitts, Cadet Command Analyst, graciously took the time to explain Cadet Command’s scholarship forecasting model and provided valuable background on the ROTC accessions process. Mr. Lou Lafrenaye, TRADOC-TOMA, kindly explained the BOLC-B allocation process, shared critical data and insights, and allowed us the opportunity to participate in the annual BOLC-B Conference. Finally, there were numerous stakeholders who provided their time and insights regarding the officer accessions process: COL Schamburg, COL George, COL (Ret) Corley, COL Shultis, COL Lessig, and LTC Roederer.
Administratively, this study was funded by the Army Modeling and Simulation Office (AMSO) sponsored by US Army Accessions Command G2/9 as part of a year-long effort in support of the Statement of Work entitled, “ARFORGEN Officer Flow Model.” The U.S. Government is authorized to reproduce and distribute reprints for governmental purposes notwithstanding any copyright annotation thereon. The views and conclusions contained herein are those of the authors and should not be interpreted as representing the official policies or endorsements, either expressed or implied, of Accessions Command, USMA or the U.S. Government.

Table of Contents
1.0 Introduction 1 1.1 Background ……………………………………………………………………………...……...….1 1.2 Motivation………………………………………………………………………………...……...….2 1.3 Purpose of the Model...…………………………………………………………………...……...….2 1.4 Previous Related Research...……………………………………………………………...……...….3 2.0 Methodology 4 3.0 Stakeholder Feedback 4 3.1 Stakeholder Identification.………………………………………………………………...……...….4 3.2 Stakeholder Feedback...…………………………………………………………………...……...….5 3.3 Research Questions…...…………………………………………………………………...……...….6 3.4 Key Metrics…………...…………………………………………………………………...……...….6 4.0 Model Development 7 4.1 Model Scope………...…….………………………………………………………………...……….7 4.1.1 Source of Commission………………………………………………………………...……...….7 4.1.2 Reserve Component Level of Detail ………..………………………………………...……...…8 4.1.3 Unit Level of Detail…...….…………………………………………………………...……...….8 4.1.4 Branch level of Detail….……………………………………………………………...……...….8 4.1.5 Starting Point…….....……….………………………………………………………...……...….8 4.1.6 Time Horizon.…….....………………………………………………………………...……...….8 4.2 Conceptual Model Framework…….……………………………………………………...……...…. 9 4.3 Functional Decomposition…..…….……………………………………………………...……...…. 9 4.3.1 Generate Officer Cohort.……………………………………………………………...……...….9 4.3.1.1 Inputs……………………………………………………………………………...……...…10 4.3.1.2 Controls……………………………………………………………………….....……...…..10 4.3.1.2 Outputs…………………………………………………………………………...……...….11 4.3.2 Assign Branch, Unit, and BOLC-B………………………………………………...……..……11 4.3.2.1 Inputs……………………………………………………………………………...……...…12 4.3.2.2 Controls……………………………………………………………………….....……...…..13 4.3.2.2 Outputs…………………………………………………………………………...……...….14 4.3.3 Assign Branch, Unit, and BOLC-B………………………………………………...……..……14 4.3.3.1 Inputs……………………………………………………………………………...……...…14 4.3.3.2 Controls……………………………………………………………………….....……...…..15 4.3.3.2 Outputs…………………………………………………………………………...……...….15 4.3.4 Assign Branch, Unit, and BOLC-B………………………………………………...……..……15 4.3.4.1 Inputs……………………………………………………………………………...……...…16 4.3.4.2 Controls……………………………………………………………………….....……...…..16 4.3.4.3 Outputs…………………………………………………………………………...……...….16 4.4 High Level Simulation Structure ...……………………………………………………...……...….16
4.4.1 Phase I Entity Flow ……..….……..………………………………………………...……...… 17 4.4.2 Model Initialization…………………………………………………………………..……...…17
4.4.3 Entities ..……………………………………………………………………………...…….......17 4.4.4 Entity Attributes.……………………………………………………………...……...…………17

4.4.4 Assumptions and Clarifications……………………………………………………...……...….18 4.4.4.1 Assumptions.……………………………………………………………………...……...…18 4.4.4.2 Clarifications………………………………………………………………….....……...…..18 4.4.5 Model Operation …………………………………………………………………...……...…...19 4.4.6 Model Output………………………………………………………………………...……...….21 4.4.7 Verification and Validation ………………………………………………………...……...….22 4.4.7.1 Verification ....…………………………………………………………………...……..… 22 4.4.7.2 Validation…………………………………………………………………….....……...…..23 5.0 Analysis 23 5.1 BOLC-B Wait Times.…….……………………………………………………………...……...….24 5.2 BOLC-B Demand ..……………………………………………………………………...……...….24 5.3 BOLC-B Capacity Scenario.……………………………………………………………...……...…25 5.4 BOLC-B Allocation Scenario.…………………………………………………………...……...….26 5.5 BOLC-B Schedule by Unit Priority Scenario….………………………………………...……...….28 5.6 Shifting ROTC Commissioning Date Profile Scenario………………………………….……...….29 6.0 Potential Future Work 31 7.0 Conclusion 32 Appendix A: Stakeholder Feedback 34 Appendix B: System IDEF0 Diagram 38 Appendix C: Entity Flow Diagram 39 Appendix D: Running the Model 40 Appendix E: Model Outputs 42 Nomenclature 44 References 46

1
1.0 Introduction
Each year, the Army accesses more than 7000 officers from across all the commissioning sources - West
Point, the Reserve Officer Training Corps (ROTC), and Officer Candidate School (OCS). Of those
officers, the U.S. Army Accessions Command (USAAC) is directly responsible for supplying more than
half of these commissions - those from ROTC and College Option OCS. As the Army made the
transition to the ARFORGEN readiness model, it became evident that a greater level of precision was
necessary in placing newly commissioned officers in deploying units. USAAC, being the largest supplier
of commissioned Lieutenants, took some steps within the command to attempt a greater synchronization
with ARFORGEN. However, it soon became clear that a larger, enterprise-level solution would be
necessary to make noticeable gains. The different commissioning sources are “stove-piped” with no
central authority to coordinate internally between the three, or externally with Human Resources
Command (HRC) and the Training and Doctrine Command (TRADOC), so meaningful decisions were
challenging. In order to aid in decision-making which would be more holistic in nature and to add
analytical capability for leadership, USAAC acquired research funds to complete a simulation model of
Officer Flow that would bridge the gap between all stakeholders in this process.
1.1 Background
Persistent conflict and limited resources were the primary factors that drove the Army toward
transformational change in the way it manages the global commitment of forces. In 2006, the Army
replaced the Cold War-era linear readiness and deployment model with Army Force Generation
(ARFORGEN), a “supply-based model” that builds unit readiness over time. ARFORGEN is defined
as ” the structured progression of increased unit readiness over time, resulting in recurring periods of
availability of trained , ready and cohesive units prepared for operational deployment in support of civil
authorities and combatant commander requirements. “ (Department of the Army [18]) General Charles
Campbell noted that , although…. “the Army has a system for organizing, staffing, equipping, training,
deploying, sustaining, modernizing and mobilizing - these systems are not, in themselves, self-
synchronizing.” (Campbell [2]). Senior Army leadership is now leveraging ARFORGEN as a common
institutional model and process with which to synchronize these numerous complex components.
In 2009, Forces Command (FORSCOM) identified numerous internal and external disconnects with
ARFORGEN execution. Some of these “disconnects” include: difficulty synchronizing NCO and
officer education requirements, coordination of command tours at all echelons, and timely delivery of
equipment training sets. (Campbell [3]) In addition to efforts to improve the functioning of
ARFORGEN, there has been significant effort toward institutionalizing ARFORGEN by codifying
policy, procedures, processes, definitions, roles and responsibilities in AR-525-9 and other key
documents. A major challenge to synchronizing initial military training (IMT) and manning with unit
cycles in ARFORGEN is the fact that the IMT and manning are linear processes which we are attempting
to synchronize with the cyclical progression of units through the ARFORGEN process. Figure 1
graphically depicts this challenge. The Army Campaign Plan (ACP) 2009 directs CG USAAC and DCoS
Army G1 to adapt recruiting and manning practices and processes to better support creating whole,
cohesive units in ARFORGEN.

2
Figure 1. Synchronizing Individual and Unit Cycles.
1.2 Motivation
Current Generating Force processes, policies, and procedures do not enable the most efficient and
effective implementation of ARFORGEN. Given current and projected demands on the force, The
Human Capital enterprise (HCE) must be able to synchronize Officer flow through the accessions process
to first unit of assignment, accurately analyze key metrics, and predict initial entry Officer shortfalls with
respect to the ARFORGEN fill requirements of operating force units. Army Campaign Plan Decision
Point 97 (ARFORGEN Knowledge Management) and Decision Point 98 (ARFORGEN Automation
Integration), specifically direct action in these areas. The Accessions Officer ARFORGEN Flow Model
simulation will be a key enabling tool for the HCE and will help synchronize accessions within the
ARFORGEN construct.
1.3 Model Purpose
The purpose of this modeling effort is to model the current path that an officer negotiates from pre-
commissioning to the first unit of assignment to assist with synchronization of the officer accession and
training with the Army Force Generation (ARFORGEN) process. The model allows key stakeholder
variables to be adjusted to facilitate "what-if" analysis. Figure 2 highlights the general flow from pre-
commissioning to first unit of assignment. Officer candidates receive Basic Officer Leader Course
(BOLC-A) training at their commissioning sources. Upon commissioning, officers attend BOLC-B, a
course that provides technical training for their specific branch (i.e. Infantry, Armor, etc.). Following
BOLC-B, based upon branch and unit skill requirements, officers may then attend additional functional
training (i.e. Airborne, Stryker Leader, etc.)

3
Figure 2. General Officer Flow from SOC to First unit.
1.4 Previous Related Research
CAA MARATHON Model. In 2005 the Center for Army Analysis (CAA) developed a discrete-event
simulation as a means of replicating the cyclical unit readiness that would that will exist under
ARFORGEN. MARATHON operated at the Standard Requirement Code (SRC) level of detail, implying
that BCTs would be scheduled by their type (i.e., IBCT, HBCT, etc.) and not by their designation (e.g.,
3rd Brigade, 101st Airborne Division (IBCT)).
Enlisted Flow Model. USAAC developed a discrete-event simulation model Enlisted Flow using
ProModel©. The intent of this modeling effort is to determine if there are enough officer and enlisted
Soldiers in the accessions pipeline, along with the right mix, to fill deploying units in support of
ARFORGEN. Current model scope is limited to Regular Army enlisted skill level 10 Soldiers and
deploying Brigade Combat Team (BCT) units. This model currently portrays the enlisted accessions
process from appointment conduct through distribution to the BCTs. Key input data includes US Army
recruiting Command (USAREC) contracting mission by month by Military Occupation Specialty (MOS),
basic training & Advanced Individual training (AIT) class schedules, and the BCT ARFORGEN schedule
provided by FORSCOM. Many adjustable model parameters are available within the AFM and these
parameters provide a “what-if” analysis capability. In addition, attrition percentages can be adjusted
throughout the accessions process. Training base parameters like type/quantity of classes by MOS and
minimum/maximum class seat sizes can also be adjusted. Adjusting these levers will help to determine
impacts and allow for follow-on trade off analyses.
BOG:Dwell Model. DA G1 and the Operations Research Center of Excellence (ORCEN) developed a
discrete-event simulation model that replicated unit personnel turnover and operation tempo
(OPTEMPO). The purpose of the model was to replicate the BOG:Dwell of enlisted personnel in key
MOSs within BCTs. Features of commonality include: use of AST output as a demand signal,
organizational manning authorization data from Force Management System Web Site (FMSWeb), unit
inventory data from TAPDB, and fill of units in accordance with ARFORGEN manning guidance, and
tracking of units at DMSL level.
Dynamic Accessions Resource Trade-off Simulation Model. In 2006, the Office of the Secretary of
Defense (OSD) sponsored research that concluded "the key to continued [recruiting] success is the ability
to provide the right level and mix of recruiting resources to meet recruiting market challenges promptly."
The Army has begun to develop the Dynamic Accessions Resource Trade-off Simulation (DARTS), a

4
fully functional analytical tool designed with an System Dynamics (SD)-based analysis approach and
capabilities. It provides the Army an integrated resource allocation tool to conduct the trade-off analysis
necessary to provide informed, synchronized, and defendable resource allocation recommendations. The
model also provides the capability to quantify the impact of reduced resources or changes in the recruiting
environment on the Amy's ability to meet its current and future accessions missions.
Army Variable Enlistment Length Model. Current enlistment contract lengths are not synchronized
with particular unit ARFORGEN cycles. The result is that approximately 10% of the first term skill level
1 Soldiers assigned to BCTs end up with non-distributable time after returning from deployment. To
address this problem, USAAC is developed a simulation & tracking tool that studies the relationship
between ARFORGEN planning cycles, the length of service/enlistment contracts, and the relationship
with ARFORGEN requirements. This simulation will test the feasibility of writing precision contracts
that align Soldier enlistments with BCT requirements along with looking at future BCT requirements and
enumerating the needed contracts, by length and MOS, which will synchronize with the ARFORGEN
demand. Additionally, the model can simulate the outcome of executing the proposed contracts taking
into account all types of attrition along the way, latest arrival date (LAD) variability, and other factors
that can influence the outcome of where a soldier is eventually assigned.
2.0 Methodology
The methodology employed for this modeling and analysis effort began with a thorough stakeholder
analysis to identify key questions of value to stakeholders and uncover the research questions to be
addressed via modeling and analysis. Next, a conceptual model of officer flow was developed that started
with entry to the sources of commission to the first unit of assignment. Attention then shifted to
identification of data requirements necessary to support model development. Significant time was then
focused on gathering, cleaning, and formatting the data in a series of spreadsheets to facilitate future data
updates and input to the model. A discrete-event simulation model was then developed in ProModel©
utilizing a phased programming approach. The intent of the phased programming approach was to start
with the portion of the model that answered key stakeholder questions and allow decision makers to judge
the value of the modeling effort before proceeding with the next phases of programming. The simulation
model tracks officers from source of commission to first unit of assignment recording relevant statistics
and measures while allowing adjustment of key stakeholder variables to determine their impacts on
metrics of interest and fundamental research questions. Verification and validation was then conducted to
ensure the model was working as intended and in fact reflected reality. Lastly, numerous scenarios were
run and analyzed to determine the impacts of stakeholder proposed changes on key enterprise metrics of
interest.
3.0 Stakeholder Identification, Feedback, and Analysis A thorough stakeholder analysis was
conducted to gain an understanding of the process, identify key metrics of interest, and identify
fundamental research questions.
3.1 Stakeholder Identification The Army officer accessions process is a very complex system. As with
all complex systems, there are numerous stakeholders that have an interest in or are impacted by the
system. Figure 3 highlights the major stakeholders of the officer accessions flow process. The
organizations highlighted in light green are those that we consulted and collaborated with throughout the
modeling effort.

5
Figure 3. Major Officer Flow Model Stakeholders.
3.2 Stakeholder Feedback
Stakeholder interviews were conducted with the organizations highlighted in Figure 3 above. The
feedback was analyzed to identify common themes and points of emphasis. The results are consolidated
and organized into major findings, conclusions, and recommendations and are included in Appendix A.
The major takeaways are highlighted below.
• ARFORGEN Unit Fill and Timing: ARFORGEN manning guidance highlights the specific
manning levels for officer and enlisted personnel by unit type and phase within the ARFORGEN
cycle. Stakeholders want to identify and track unit fill rates as well as when, in the ARFORGEN
cycle, Lieutenants arrive (i.e. days before the MRE or early in the Train/Ready phase) to their
first units of assignment.
• BOLC –B Allocations and Scheduling: BOLC-B training seats are allocated to the sources of
commission at an annual conference co-hosted by Training and Doctrine Command (TRADOC)
TOMA and Department of the Army G1. The allocations are USMA- centric in the June to
October time period. Stakeholders are interested in varying the SOC BOLC-B allocations.
Additionally, ROTC officers are assigned BOLC-B course dates according to the first to
commission first to BOLC-B rule. Stakeholders would like the ability to explore alternative
scheduling business rules.
• BOLC Wait Time and LT idle time: As of 4 Aug 2010, the average wait time for AC ROTC
officers was 122 days, and was on a 4 year upward trend. The FORSCOM goal, as stated in 350-
1, is a 90 day wait time for BOLC-B. The actual wait times vary by branch. Armor, Military
Police, Infantry, and Aviation had average wait times exceeding 140 days. Stakeholders are
FORSCOMMPO
DA G3/5/7 DA G8DA G1
TRADOC
BOLC
DCG/IMT
TOMA
HQDA
G3/5/7
Accessions
Cadet Command
USCC
OCS
USMA
G2/9G3
HRC
OPMD
G5
DMI
G2G1
IMT
G3/5/7
BCTsBCTs
BCTs
DOAC

6
interested in adjusting course capacities and course allocations to reduce BOLC-B wait time and
Lieutenant idle time.
• Source of Commission (SOC) Mix: Each SOC has a typical commissioning date distribution.
OCS commissions an equal amount throughout the year while ROTC and USMA commission the
vast majority in the May-July time frame and varying amounts at other points in the year.
Feedback from units indicates that this sometimes results in SOC over representation or pooling
in BCT-level units. Stakeholders are interested in both adjusting the commissioning date profile
for ROTC and monitoring SOC mix in units.
• LT Utilization during Wait Time: While Lieutenants are waiting for BOLC-B they perform a
wide variety of duties ranging from Gold Bar Recruiting to snowbird duty at their BOLC-B post.
These duties vary in developmental value to the Lieutenant. Stakeholders are interested in
identifying developmental opportunities for Lieutenants to perform during this idle time that
provide value to Lieutenants and the Army. A separate Cadet Capstone project will research this
topic.
3.3 Research Questions The fundamental research questions derived from stakeholder feedback are
listed below.
Can changes in training capacity improve key enterprise performance metrics?
Can adjustments to course allocations and scheduling business rules improve key enterprise
performance metrics?
What impacts do adjustments in accessions commissioning date profile have on key enterprise
performance metrics?
3.4 Key Enterprise Metrics Stakeholders identified several factors or model outputs that were of
interest. They include the following.
• Unit Fill: Defined as percentage of ARFORGEN manning requirements versus actual assigned.
• Lieutenant Arrival: Defined as when in the ARFORGEN cycle Lieutenants arrive to the unit.
• Time from Commission to Unit: The number of days from when a Lieutenant is commissioned
until they arrive at their assigned first unit.
• BOLC Wait Time: Defined as the number of days from when a Lieutenant is commissioned
until they start their BOLC-B course. This will be examined by branch and SOC.
• ROTC Officer Hold Population: Defined as the number of ROTC officers that have been
commissioned but not yet accessed.
• SOC Mix in Units: Defined as the SOC ratio in the BCTs.

7
4.0 Model Development
4.1 Model Scope
As mentioned previously, the Army Human Resourcing Enterprise is an extremely large and complex
system. Ideally, we would attempt to create a model that replicates every possible detail across the Army
throughout the entire process. However, this is not prudent or necessary for several reasons: 1) the added
detail does not contribute to answering the key research questions, 2) valid, authoritative data does not
exist to support this level of detail , and 3) it will be computationally prohibitive as the model is expanded
in subsequent phases. In every modeling effort, proper scope of the modeling effort is important; the
philosophy for this modeling effort is to start small and create a functioning model that focuses on key
research questions. Figure 4 below highlights the range of scoping alternatives with those cells
highlighted in yellow as the focus for this effort. A detailed discussion of model scope follows Figure 4.
Figure 4. Morphological Box of Model Characteristics.
4.1.1 Source Of Commission.
The Army accesses the officer corps from several sources: Reserve Officer Training Corps (ROTC),
United States Military Academy (USMA), Officer Candidate School (OCS), and Direct Commissioning
(DC). ROTC, USMA, and OCS are the SOCs of interest for this effort while DC accessions are
excluded from this model for the following reasons.
In FY10, DCs comprise approximately 13% of total officer accessions. DCs are primarily
associated with specialty branches (doctors, lawyers, nurses, chaplains, etc) which have minimal
representation in BCT-level units.
DCs are not generally accessed as Lieutenants.

8
4.1.2 Reserve Component Level of Detail
Although it is acknowledged that the Reserve Component plays a vital role in the current operating
environment and that we are “One Army”, this modeling effort is limited to the Active Component for the
following reasons. However, the framework is in place to expand the model in the future to include this
level of detail.
The Reserve component utilizes vastly different personnel management policies and systems.
There are numerous factors (controllable and uncontrollable) that impact Reserve Component
training allocation and attendance that make it extremely difficult to model in a generalized
manner.
The Military Personnel Management-Officer division of DA G1 does not track or forecast
Reserve Component strength. The Office of the Chief, Army Reserves performs these functions.
4.1.3 Unit Level of Detail
In determining the scope of units to include in the model we first analyzed the concentration of
Lieutenants in various unit types. Based upon the FY10 Personnel Manning Authorization Document
(PMAD), 60% of Lieutenant Authorizations are in Brigade Combat Teams (BCTs), Combat Aviation
Brigades (CABs), or Division Headquarters (DIV HQs). Given that there are several hundred other units
that do not fall within these categories, the largest concentration of Lieutenants are in the BCTs, CABs,
and DIV HQs. BCTs, CABs, and DIV HQs are tracked, scheduled, and closely managed by FORSCOM
via the ARFORGEN Synchronization Tool (AST) which is not the case for all other unit types. Based
upon the concentration of Lieutenants and ARFORGEN tracking we limit detailed modeling and analysis
to BCTs, CABs, and DIV HQs. All remaining units are classified as either Non-BCT MTOE or TDA and
tracked at a macro level.
4.1.4 Branch Level of Detail
Given that the units of primary focus of the model are BCTs, CABs, and DIV HQs, the overwhelming
majority of branches represented within these units are those of the Army Competitive Category (ACC).
Therefore, the sixteen branches that compromise the ACC are the focus of this modeling effort.
4.1.5 Starting Point
Based upon stakeholder feedback and the potential for future model expansion, it was determined that the
officer flow modeling begin at post-commissioning. Additionally, 1 April 2010 was selected as the
starting date for the model as April is before the commissioning surge in May and has the smallest
BOLC-B queues.
4.1.6 Time Horizon
The desire of Accessions Command is to create a model of the “as is” process to facilitate what-if
analysis. Additionally, FY09 was a transition year from the BOLC I,II,II paradigm to the current BOLC-

9
A:BOLC-B system. We therefore, focused modeling efforts on replicating the FY10 process and system.
Because the commissioning cycle begins in May we chose to initialize the model on 1 April 2010. This
provides the added benefit of starting the model at a point in which the BOLC-B queue is historically the
smallest. The model will run for three years which allows the entire FY10 cohort to move completely
through the process flow.
4.2 Conceptual Model Framework
In developing the conceptual model framework we identified four major subcomponents of officer flow
from SOC to First unit of Assignment (FUA). These major subcomponents are formed into modules for
model development and are shown in Figure 5, below. A functional decomposition of each module is
presented in subsequent sections.
Generate Officer
Cohort
Assign Branch, Unit,
BOLC-B
BOLC-B and
Functional Training
LT Distribution and
Unit Manning
Module 1 Module 2 Module 3 Module 4
Commissioned LTs
Assigned LTs
Trained LTs
Unit and BranchRequirements
IncomingCandidates
Figure 5. Conceptual Model Flow.
4.3 Functional Decomposition
Before constructing a model of officer flow, we functionally decomposed the process into its major
inputs, controls, outputs, and mechanisms reflected in the series of Integrated Definition for Functional
Modeling diagrams (IDEF0) in Figures 6 through 10 below. The mechanism for each module is a
discrete-event simulation model. The model is separated into four modules for both conceptual clarity
and with the intent of running the modules separately if so desired. The system IDEF0 model for the
entire process is included in Appendix B.
4.3.1 Generate Officer Cohort
Module 1 begins with candidate arrival at the SOC and ends with commissioning. The module
incorporates historical SOC progression and loss rates resulting in a commissioning cohort. Figure 6
below is the IDEF0 model for Module 1.

10
Figure 6. IDEF0 Model of Module 1.
4.3.1.1 Inputs – Module 1
SOC Current Strength. At model initialization (1 April 2010), the numbers of candidates at each SOC
are populated within the model. Since this data is not tracked or recorded in a centralized Army database,
it was necessary to gather the information from several sources. Cadet Command provided a 1 November
2009 annual record of ROTC cadets by MS-level; with the additional classification of scholarship status
(scholarship or non-scholarship). USMA G5 provided the monthly strength, by class (Freshmen,
Sophomore, etc.) from which April 2010 data was extracted. OCS strength was generated using ATRRS
to determine the number of OCS students in training on 1 April 2010 in addition to their course start and
finish dates.
4.3.1.2 Controls – Module 1
Progressions and Losses. As the simulation clock moves forward cadets or candidates will either
progress or become a loss to the SOC. Historic SOC progression and loss rates are used to dictate what
proportion of candidates or cadets progress to the next state and eventual graduation/commission. Cadet
Command maintains a model that documents the three year average state transition rates from which the
appropriate data was extracted. USMA G5 provided monthly progression and loss data by class. OCS
progression and loss rates were generated using ATRRS historic course completion rates.
Arrivals. The Army Accessions mission is generated and published annually by the DA G1. This
document provides detailed guidance regarding the five year projected requirements and missions by
SOC, number, component, specialty branches, specialty skill requirements, etc. Cadet Command uses
this guidance to update the model - combining historic attrition rates, mission guidance, and financial
constraints to determine the number cadets to bring in by MS-level and scholarship type. This data is
used as the ROTC arrival data. USMA arrivals are limited by the congressionally mandated size of the
Corps and range from 1200 to 1350 incoming cadets each year. USMA arrivals occur in July of each
year. OCS arrivals are simply a reflection of the ATTRS actual course enrollments on the course start
date.
Obtained from Cadet Command
Assess AC Dwell Time at Steady
State
Obtained from USMA
Derived from ATRRS
Discrete Event
Simulation
GenerateOfficer Cohort
USMA Strength
ROTC Strength
CC
SAM
S Mo
del
CC
14
5-1
RO
TC In
centives P
olicy
Commissioned LT
AR
21
0-2
6U
nited
States Military
Acad
emy
OCS Strength
AR
35
1-5
Officer C
and
idate
Scho
ol
SOC
Missio
n G
uid
ance
USM
A P
rogressio
n
Loss
ATR
RS
OC
S Co
urse A
ttirion
Source of Commission
Year Group
Component
Commission Date
Accession Date
Military Qualification Skills
Special Duty Assignment

11
SOC Governing Regulations. Each SOC maintains appropriate policy and regulations that govern their
education, training, and administrative requirements for their cadets or candidates. AR 210-26 is the
governing document for USMA. Cadet Command maintains several policy documents with CC 145-1
outlining the ROTC scholarship and incentive programs. AR 351-5 documents the major policies and
requirements of the Officer Candidate School.
Military Skill Qualifications. It is common for USMA and ROTC cadets to attend military training
(airborne, air assault, etc.) while they are cadets. In fact, 34% of the FY10 ROTC cohort was airborne
qualified upon graduation and commissioning. Additionally, OCS-IS candidates often possess military
qualifications prior to entering OCS. These prior qualifications impact whether a new LT will attend
unit/branch specific functional training following BOLC-B. The qualification data was derived by cross
referencing the FY10 cohort roster with ATTRS.
Special Duty Assignments. A portion of ROTC graduates participate in a special duty assignment after
graduation. Potential special duty assignments include Leader Development and Assessment Course
(LDAC), Leadership Training Course (LTC), or Gold Bar (GB) recruiter duty. Cadet Command provided
FY10 ROTC cohort special duty assignment data with beginning and end dates for each assignment.
USMA is authorized to assign 20 graduates as athletic interns (10 Fall/10 Spring). Fall interns are
assigned to an athletic team for duty following graduation and then attend their BOLC-B course in
Dec/Jan at the completion of the season. Spring interns attend BOLC-B following graduation and return
to USMA in Dec/Jan to begin duty with their assigned athletic team. In FY10, USMA tasked 50
graduates with supporting Cadet Summer Training (CST). Lastly, approximately 5 – 10 USMA
graduates are awarded academic scholarships each year and pursue an advanced degree after graduation.
The scholarships range in duration from 6 months to 2 years. USMA S1 provided special duty
assignment data for the FY10 cohort.
4.3.1.3 Outputs - Module 1
Commissioned Lieutenants. The outputs of Module 1 are commissioned Lieutenants. These
commissioned Lieutenants carry with them the following key attributes or information as they progress
through the model: Source of Commission, Year Group, Component, Commission Date, Accession Date,
Military Skill Qualifications, and Special Duty assignment (if appropriate).
4.3.2 Assign Branch, Unit, and BOLC-B This module takes the list of commissioned officers from all
sources of commission and “stamps” each Lieutenant with a branch, unit of assignment, and a BOLC-B
course. Figure 7 is the IDEF0 model for Module 2.

12
Figure 7. IDEF0 Model of Module 2.
4.3.2.1 Inputs – Module 2
Commissioned Lieutenants. The output of commissioned Lieutenants ( Module 1) is an input to
Module 2.
Branch Requirements. HRC determines the annual Active Duty (AD) branch requirements for the
upcoming commissioning cohort by utilizing an in-house model to forecast requirements for AD Captains
three years in the future. The model accounts for branch detail Lieutenants who serve their first 3 years in
a control branch then revert to a basic branch. These branch requirements are then allocated to the three
commissioning sources. HRC provided historical branch requirement data from FY07 to FY10 with
Figure 8 below depicting the FY10 branch requirements.
Figure 8. FY10 Branch Allocations.
Unit Requirements. HRC projects unit requirements three times a year targeting December graduates,
spring graduates, and end-of-summer commissionees. The projections are made for a window of 8 to 12
2
Assess AC Dwell Time at Steady
State
Discrete Event
Simulation
Assign Branch/UnitBOLC Class
CommissionedLieutenants
HR
C SO
C U
nit
Allo
cation
s
DA
G1
Bran
ch
Gu
idan
ce
Assigned LT
BO
LC A
ssignm
ent
Bu
siness R
ules
BO
LC-B
Allo
cation
C
on
ference
MIL P
ER 0
8-2
19
AR
FOR
GEN
Focu
sed
Man
nin
g
Module 1
Unit Requirements
Branch Requirements
Unit Manning Module
Source of Commission
Year Group
Component
Commission Date
Accession Date
Military Qualification Skills
Special Duty Assignment
Branch
Unit
BOLC-B
HRC FY07-FY10Branch Requirements

13
months following the particular commissioning cycle since this is when those commissioned in that cycle
could be expected to arrive at their units after completion of BOLC-B and functional training. The
projection starts with a Total Officer personnel management Information System (TOPMIS) query of
current unit inventory versus authorizations. Positions with the following criteria are considered vacant:
An unfilled position with no Valid Open Requisition (VOU).
Positions currently filled by Lieutenants that will be promoted before the target window.
A position currently filled by a Lieutenant with an available to move date (YMAV) earlier than
the target window.
A position filled by a Lieutenant eligible to return from overseas (DEROS) earlier than the than
the target window.
All of these vacant positions are rolled up by unit and by branch to determine unit “needs.” Unit
“requirements” are determined by finding the percentage of fill that is authorized by Army Manning
Guidance with respect to ARFORGEN. HRC then proportionally allocates the unit requirements across
the three commissioning sources. Module 4 of the model tracks current unit strength and unit
ARFORGEN cycle. The model will apply the vacancy rules above to determine unit requirements.
4.3.2.2 Controls – Module 2
SOC Branch Allocations. HRC develops a recommended SOC branch allocation which is codified in a
DA G1 Branch Guidance memorandum issued to the sources of commission. USMA has historic branch
allocations in proportion to the USMA population that are largely driven by the 80/20 rule. The
remaining branch allocations are proportionally split between ROTC and OCS. OCS aviation (AV)
accessions are typically capped and the remaining allocations are proportionally split between ROTC and
USMA. HRC provided FY07-FY10 historic SOC branch allocations. The historic allocations can be
used to replicate SOC branch allocation within the model.
BOLC-C Allocation Conference. TRADOC (TOMA) and DA G1 co-host the annual BOLC-B
conference where the training seats dictated by the SMDR are apportioned to the three sources of
commission and other agencies. TOMA provided the historical Active Duty BOLC-B allocations for the
3 sources of commission. Additionally, these allocations and actual course attendance rates can be
obtained from ATRRS. The FY10 allocations are used as the baseline from which allocation adjustments
will be made.
BOLC-B Assignment Business Rules. Cadet Command assigns apportioned ROTC BOLC-B
allocations utilizing a FIFO (First In First Out) rule. Within a given branch, those with the earliest
commission dates are assigned to BOLC-B courses within allocation constraints. A small portion of
USMA unit allocations come with a NLT BOLC-B date and cadets select their unit with an
accompanying BOLC-B date. The remainders of the USMA BOLC-B slots are selected by cadets in
accordance with the USMA branch OML. OCS typically sends an OCS graduate to the soonest available
BOLC-B course date 45 days after graduation (within allocation constraints). HRC provided the FY10
cohort listing with SOC, commission date, accession date, and BOLC-B dates.

14
SOC Unit Allocations. HRC proportionally allocates the unit requirements across the SOCs. The
allocations are passed to the SOCs for fill. Aviators are not assigned a unit until after they have
completed BOLC-B and have been assigned a specific airframe. Consequently, aviators will be tracked
at the macro level regarding unit assignment within the model. The FY10 cohort listing, discussed
earlier, includes the unit of assignment for most of the commissioning cohort.
4.3.2.3 Outputs – Module 2 The outputs of Module 2 are assigned Lieutenants. These Lieutenants
carry with them the following key attributes or information as they progress through the model: Source
of Commission, Year Group, Component, Commission Date, Accession Date, Military Skill
Qualifications, and Special Duty assignment, Branch, Unit (with the exception of Aviators), and BOLC-B
Course assignment.
4.3.3 BOLC-B and Functional Training This module takes the list of commissioned officers with
assigned branch, unit, and BOLC-B date and routes them through the appropriate BOLC-B course and
required functional training enroute to their unit. Figure 9 below is the IDEF0 model for Module 3.
Figure 9. IDEF0 Model of Module 3.
4.3.3.1 Inputs – Module 3
Assigned Lieutenants. The output of assigned Lieutenants (Module 2) is an input to Module 3.
BOLC-B Schedules. A query of ATTRS provided the FY09 to FY11 course schedules (start date and
end date) as well as the designed course capacities for the 16 BOLC-B courses.
Additional Skill Identifier Requirements. FMSWeb maintains all Army unit authorization data
including skill requirements (ASI) and duty position titles. The FY10 FMSWeb data is used to create a
special skill requirement matrix. The matrix captures the ASIs required by branch and DMSL. This
matrix is the primary model reference for required functional training.
Obtained from ATTRS
Assess AC Dwell Time at Steady
State
Discrete Event
Simulation
BOLC-B and Functional Training
Assigned LTs
BOLC-B Schedules
DMSL/Branch ASIRequirements
MTO
E
Trained LTs
BO
LC –
B C
on
ference
SMD
R
BOLC-B SOCAllocations
Obtained from FMSWeb
BOBC/ATTRS
Module 2
BOLC-B Wait Time
BOLC-B Student Load
15
4.3.3.2 Controls – Module 3
Senior Management Decision Review (SMDR). The SMDR is the process that determines, validates,
and directs the TRADOC training mission. TRADOC uses this information to schedule and resource
courses for the upcoming and future FYs. The scheduling and resourcing is reflected in the ATRRS
database of course offerings and capacities.
BOLC-B SOC Allocations. As discussed previously, TRADOC (TOMA) and DA G1 co-host the annual
BOLC-B conference where the training seats dictated by the SMDR are apportioned to the three sources
of commission and other agencies. TOMA provided the historical Active Duty BOLC-B allocations for
the 3 sources of commission. Additionally, these allocations and actual course attendance rates can be
obtained from ATRRS. The FY10 allocations are used as the baseline from which allocation adjustments
will be made.
4.3.3.3 Outputs – Module 3 The outputs of Module 3 are trained Lieutenants. No additional attributes
are assigned during this particular module. However, these Lieutenants carry with them the following
key attributes or information as they progress through the model: Source of Commission, Year Group,
Component, Commission Date, Accession Date, Military Skill Qualifications, and Special Duty
assignment, Branch, Unit (with the exception of Aviators), and BOLC-B Course assignment.
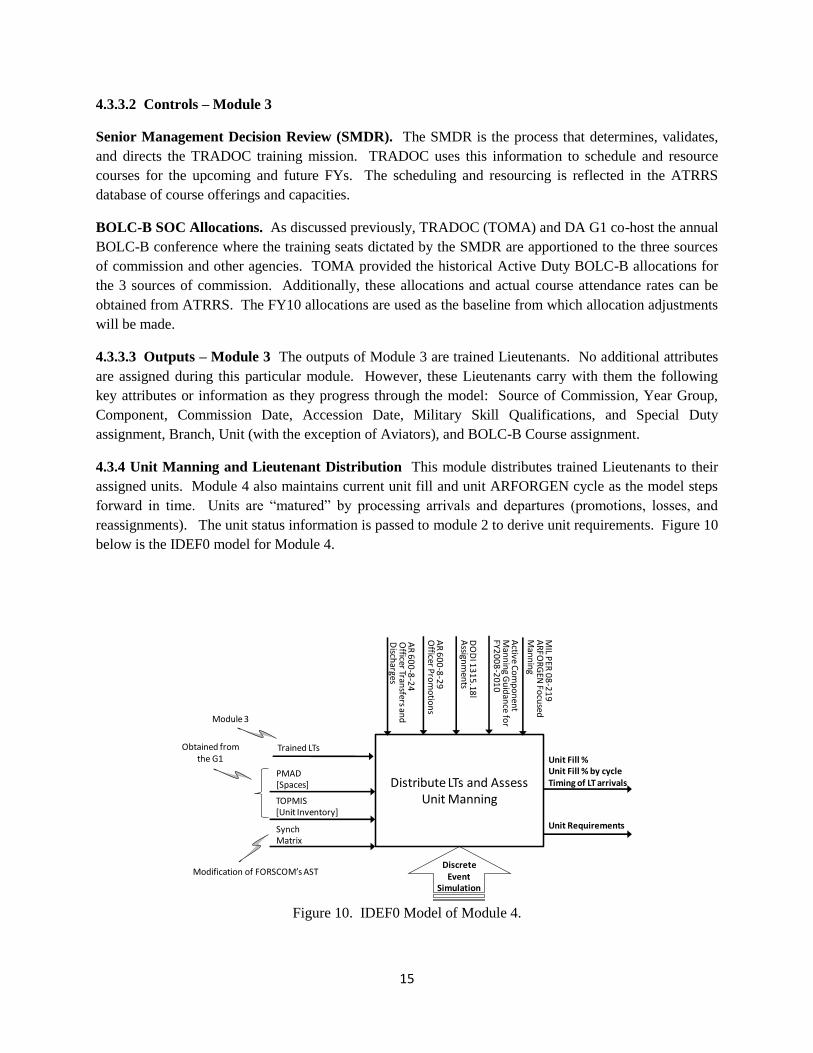
4.3.4 Unit Manning and Lieutenant Distribution This module distributes trained Lieutenants to their
assigned units. Module 4 also maintains current unit fill and unit ARFORGEN cycle as the model steps
forward in time. Units are “matured” by processing arrivals and departures (promotions, losses, and
reassignments). The unit status information is passed to module 2 to derive unit requirements. Figure 10
below is the IDEF0 model for Module 4.
Figure 10. IDEF0 Model of Module 4.
Obtained from the G1
Assess AC Dwell Time at Steady
State
Modification of FORSCOM’s ASTDiscrete
Event Simulation
Distribute LTs and Assess Unit Manning
Synch Matrix
PMAD[Spaces]
AR
60
0-8
-24
O
fficer Transfers an
d
Disch
arges
Unit Fill % Unit Fill % by cycleTiming of LT arrivals
AR
60
0-8
-29
O
fficer Pro
mo
tion
s
DO
DI 1
31
5.18
l A
ssignm
ents
Active C
om
po
nen
t M
ann
ing G
uid
ance fo
r FY2
00
8-2
010
TOPMIS[Unit Inventory]
Unit Requirements
Trained LTs
MIL P
ER 0
8-2
19
AR
FOR
GEN
Focu
sed
Man
nin
g
Module 3

16
4.3.4.1 Inputs – Module 4
Trained Lieutenants. The output of BOLC-B and Functional Training ( Module 3) is an input to
Module 4.
Personnel Management Authorization Document (PMAD). The PMAD provides the authorized
positions for officers by MOS and grade. DA G1 provided the 31 March 2010 authorization data by Unit
Identification Code (UIC), Distribution Management Level (DML) and Distribution Management Sub
Level (DMSL ).
Total Officer Personnel Management Information System (TOPMIS). TOPMIS maintains officer
inventory by MOS and grade. DA G1 provided the 1 April 2010 inventory data by Unit Identification
Code (UIC), Distribution Management Level (DML) and Distribution Management Sub Level (DMSL ).
The key additional elements of information included in the inventory file were: Time on Station (TOS),
Date of Rank (PDOR), Date Expected to Return from Overseas (DEROS), branch, unit, and rank.
Unit ARFORGEN Schedules. We employed a modified version of the AST, utilized by HRC, to
replicate unit ARFORGEN scheduling for FY09-FY11. This spreadsheet file maintains the following key
dates for each unit included in our model: Redeploy date (R), Redeploy date +90 (R+90), Redeploy date
+180 (R+180), Mission Rehearsal Exercise-45 (MRE-45), Mission Rehearsal Exercise, , and Deployment
Date (LAD).
4.3.4.2 Controls – Module 4
Losses. The policy and guidelines for officer losses are dictated by AR 600-8-24, Officer Transfers and
Discharges. DA G1 provided three years of monthly Lieutenant inventory and the corresponding
monthly loss data. The loss data was for all loss codes, less reassignment and promotion. This data was
translated into a monthly Lieutenant loss rate by branch.
Promotions. The policy and guidelines for officer promotions are dictated by AR 600-8-29, Officer
Promotions. DA G1 provided the FY10 promotion timelines and promotion rates for Lieutenants and
Captains.
Reassignments. DODI 1315.18I provides the policy and guidelines for officer assignments.
ARFORGEN Manning Guidance. ARFORGEN Focused Manning (AFM) directs that the Army “man
and prioritize units based on deployment (LAD), major training exercises (MRE/MRX), and
Redeployment (R) dates” (Department of the Army, 2008e, [15]). Specific manning goals are derived
from this guidance and published in the HQDA Active Component Manning Guidance.
4.3.4.3 Outputs – Module 4 The outputs of module 4 are unit fill information as well as timing of
Lieutenant arrival. The unit fill information is passed to module 2 to derive necessary unit requirement
information.
4.4 High Level Simulation Structure (Phase I) As mentioned earlier, a phased approach to
programming is implemented that begins with a scaled, workable model that answers the key research
questions. The gray box in Figure 11 highlights the focus of Phase I. A phased approach allows
decision makers the chance to decide whether the value added of Phase I merits pursuit of follow on
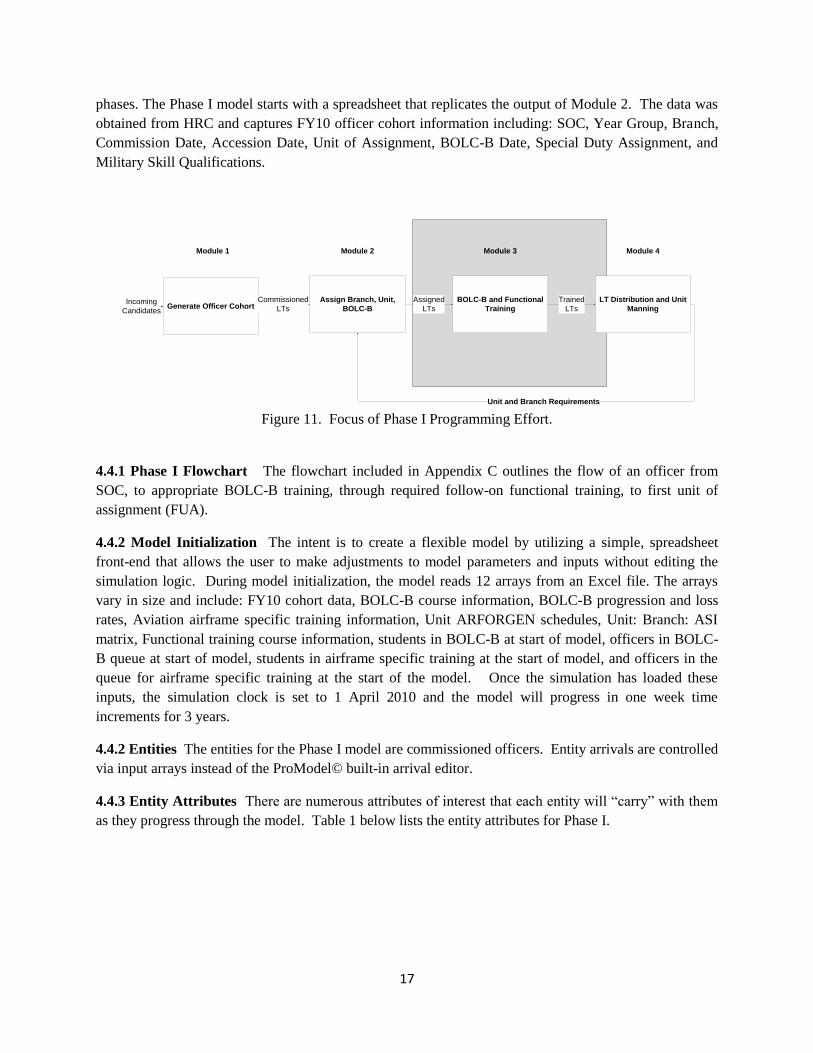
17
phases. The Phase I model starts with a spreadsheet that replicates the output of Module 2. The data was
obtained from HRC and captures FY10 officer cohort information including: SOC, Year Group, Branch,
Commission Date, Accession Date, Unit of Assignment, BOLC-B Date, Special Duty Assignment, and
Military Skill Qualifications.
Generate Officer CohortAssign Branch, Unit,
BOLC-B
BOLC-B and Functional
Training
LT Distribution and Unit
Manning
Module 1 Module 2 Module 3 Module 4
Commissioned LTs
Assigned LTs
Trained LTs
Unit and Branch Requirements
IncomingCandidates
Figure 11. Focus of Phase I Programming Effort.
4.4.1 Phase I Flowchart The flowchart included in Appendix C outlines the flow of an officer from
SOC, to appropriate BOLC-B training, through required follow-on functional training, to first unit of
assignment (FUA).
4.4.2 Model Initialization The intent is to create a flexible model by utilizing a simple, spreadsheet
front-end that allows the user to make adjustments to model parameters and inputs without editing the
simulation logic. During model initialization, the model reads 12 arrays from an Excel file. The arrays
vary in size and include: FY10 cohort data, BOLC-B course information, BOLC-B progression and loss
rates, Aviation airframe specific training information, Unit ARFORGEN schedules, Unit: Branch: ASI
matrix, Functional training course information, students in BOLC-B at start of model, officers in BOLC-
B queue at start of model, students in airframe specific training at the start of model, and officers in the
queue for airframe specific training at the start of the model. Once the simulation has loaded these
inputs, the simulation clock is set to 1 April 2010 and the model will progress in one week time
increments for 3 years.
4.4.2 Entities The entities for the Phase I model are commissioned officers. Entity arrivals are controlled
via input arrays instead of the ProModel© built-in arrival editor.
4.4.3 Entity Attributes There are numerous attributes of interest that each entity will “carry” with them
as they progress through the model. Table 1 below lists the entity attributes for Phase I.

18
Source of Commission BOLC-B Start/End Dates
Component BOLC-B Wait Time
Commission Date Aviation Airframe Assigned
Accession Date Aviation Airframe Start/End Date
Special Duty Additional Military Training Required
Military Skill Qualification Functional Training Start/End
Branch Date of Arrival at Unit
Unit
Table 1. Model Entity Attributes.
4.4.4 Model Assumptions and Clarifications Throughout the course of model development,
assumptions were made to streamline the modeling process. Model assumptions and points of
clarification are described below.
4.4.4.1 Assumptions
Historic BOLC-B, Functional training, and Airframe specific training attrition and recycle rates
are indicative of future rates.
There will be no major changes in BCT, CAB, or DIV HQ structure (Officers, grade, skills, etc.).
Although it is possible to participate in some functional training prior to BOLC-B, functional
training is assumed to occur after BOLC-B.
The proportion of aviators assigned to specific aviation platforms for each cohort is proportional
to the historic proportion of active duty officers attending this training.
No time lapse between MS BOLC-B Phase 1 and Phase 2; the courses are treated as one course
with duration equal to the sum of the individual courses.
If an officer recycles in his BOLC-B course or aviation specialty training more than once they are
considered a loss. Recycles occur at the end of a course and the officer is slotted for the next
course.
4.4.4.2 Clarifications
There is no distinction made between OCS-In Service and OCS-College option candidates.
Branch detail is not modeled as an attribute in the model as the intent of the model was to track
LTs to their first unit of assignment.
The model does not schedule individuals for functional training or airframe specific training
therefore, specific course schedules, capacities and queues are not considered. However, an
officer’s time spent in either category of training is accounted for in the model.
Airborne is the only ASI that an entity can leave their SOC with. As new data becomes available,
additional ASIs can be added.
Since aviators are not assigned a unit until completion of BOLC-B, the FY10 cohort data did not
include units for the vast majority of aviators. Aviators without units are instead assigned to a
“dummy” unit and their arrival date is recorded.

19
As adjustments to course capacity and SOC course allocations are made, all changes will be made
to the benefit of ROTC. Specifically, if a course capacity is increased by 10 seats, all 10 seats
will be added to ROTC’s current allocation for that course.
4.4.5 Model Operation
The model displays two graphical images that update during model operation. Figure 12 is the model
Counter View which updates numerous counters, during the model run, for stakeholder variables of
interest.
1. The first set of counters below Label 1 tracks the number of FY10 commissionees from each
SOC as the simulation clock advances.
2. After commissioning, ROTC graduates are either accessed or placed in a hold status until their
special duty begins or prior to their BOLC-B course. The set of counters below Label 2 display
the number of ROTC cadets on hold or performing special duty and USMA graduates performing
special duty.
3. ROTC commissionees spend differing amounts of time in hold status. The blue highlighted
counter at Label 3 displays the cumulative hold time for ROTC commissionees.
4. The counters below Label 4 track the number of commissionees, by SOC, that are waiting for
their assigned BOLC-B course.
5. The series of counters below Label 5 display the number of officers (all SOC) waiting for each
particular BOLC-B course.
6. The series of counters below Label 6 display the average wait times (all SOC) for each BOLC-B
course.
7. The series of counters below Label 7 display the number of officers (all SOC) that are training at
their particular BOLC-B course.
8. The series of blue highlighted counters next to Label 8 track the average BOLC-B wait time, by
SOC (all branches).
9. The counters above Label 9 track the number of officers (all SOC) that are waiting for and
participating in basic rotary wing training (IERW).
10. Following BOLC-B, large numbers of officers participate in additional training that is specific to
their branch and unit. The counter above label 10 tracks the number of officers that are
participating in this additional “functional” training.
11. After completing basic rotary wing training, aviators are assigned a specific platform they will fly
and then attend the specialty training for that specific aircraft.
12. The last set of counters below Label 12 track the average time for an officer, by SOC, to arrive at
their assigned unit following commissioning.

20
Figure 12. Model Counter View.
Figure 13. Model Flow View.

21
Figure 13 is the model Flow View which represents entities with colored dots that are color coded by
SOC (ROTC=Red, USMA=Blue, and OCS=Green). This color coding facilitates SOC specific
verification efforts.
1. Label 1 simply highlights the color coded dots for each SOC.
2. The yellow highlighted counters at Label 2 display the number of FY10 cohort OCS candidates
awaiting OCS and in OCS training.
3. The blue highlighted counter next to Label 3 displays the cumulative number of ROTC officers
that were placed in a hold status.
4. The counters next to Label 4 aid in model verification and track total number of officer records
from the input file and the number of officers in the process flow.
5. There are several counters throughout the Flow View that capture losses at the various locations
in the model. Losses are generally represented by ovals in the diagram. The counter below Label
5 is an example of one of these loss counters and depicts losses at functional training.
6. The counters below Label 6 display the numbers, of officers, by SOC, that have arrived at their
units.
4.4.6 Model Outputs
The model tracks the statistics of 200+ variables of interest. Each of these variables can be graphed via
several techniques utilizing the ProModel© output viewer. However, a smaller set of pre-programmed
graphs were developed and are generated each time the model is run. An example of these pre-
programmed output graphs are highlighted in Figure 14 below. A complete listing of the pre-
programmed graphs is highlighted in Table 2 with examples of each included in Appendix E.
Average BOLC-B Wait Time by Branch LT Arrivals by ARFORGEN cycles
Figure 14. Sample Pre-programmed Output Graphs.

22
Table 2. Model Pre-Programmed ProModel© Output Graphs
In addition to the outputs generated in ProModel©, the model also creates several useful Excel output
files. The name and contents of each Excel file are highlighted in Table 3 below.
Table 3. Model generated Excel Output Files.
4.4.7 Verification and Validation
4.4.7.1 Verification Model verification confirms whether the model operates as intended. We utilized
three primary techniques to verify the Phase I model: animation, numerical observation, and entity trace.
On the simulation main layout we dynamically update several counters and graphics. These items permit
us to observe changes in the counter as the model runs. We check to see if these changes are logical. For
example, we expect the number of ROTC commissioned officers in “hold” status to be no larger than the
ROTC commissioning cohort and it should gradually decrease to zero as all ROTC officers have
completed BOLC-B. ProModel© also provides an entity trace feature; allowing us to trace a particular
entity from arrival all the way through the model to FUA. Finally, we created a trace output file (Figure
15) that recorded the DTG for each entity at each location throughout the model.

23
Figure 15. Entity Trace File.
4.4.7.2 Validation Model validation confirms whether the model reflects reality. We utilized two
primary techniques to validate the Phase I model: numerical observation and historical comparisons. On
the simulation main layout we dynamically update several counters and graphics. These items permit us
to observe changes in the counter as the model runs. We check to see if these changes reflect historical
values. For example, we compare the BOLC-B wait times by branch with the historical (FY09 and
FY10) wait times. Additionally, our time from commission to FUA roughly corresponds with the HRC
estimate; 8 to 12 months from commission to FUA. Lastly, the commission to FUA averages across the
sources of commission are logical in that OCS has the lowest average time compared to ROTC and
USMA.
5.0 Analysis
We derived the fundamental research questions and key model outputs from the stakeholder analysis
described earlier. Stakeholders were interested in the following key model outputs:
BOLC-B wait times by branch and SOC
ROTC “commissioned but not accessed” population
Time from commission to FUA
Officer arrivals in relation to unit ARFORGEN cycles
Although there are numerous other outputs included within the model, these are the ones which we will
focus primary attention as we make adjustments to key model variables or factors.

24
5.1 BOLC-B Wait Times
BOLC-B wait times are a function of course capacity, demand, and timing of demand. While AR 350-1
establishes a goal of 90 days BOLC-B wait time, in FY10, the average active duty ROTC BOLC-B wait
time was 123 days. Figure 16 below highlights the active duty ROTC BOLC-B wait times by branch at
several key points throughout the year. Note that Infantry (IN), Armor (AR), Military Police (MP), and
Aviation (AV) are highlighted in red because of their deviation from the 90 day goal. Aviation wait
times are driven largely by limited airframe availability and will not be explored here. We will increase
IN, AR, and MP capacities in the model by 5%, 10%, and 15% to determine the effect on the key
model outputs highlighted above.
Figure 16. FY10 ROTC Active Duty BOLC-B Wait Times.
5.2 BOLC Demand
Figure 17 below highlights the BOLC-B demand for the FY10 cohort as derived from cohort
commissioning dates. Note that OCS BOLC-B demand is relatively constant throughout the year while
ROTC and USMA have large spikes in May/June. Although the model allows adjustments to any time
period, we will focus any course capacity or SOC allocation adjustments on the April-October time
period; corresponding to the greatest demand and backlog.

25
Figure 17. BOLC-B Aggregate Demand by SOC.
5.3 BOLC-B Capacity
We increase IN, AR, and MP BOLC-B course capacities in the model by 5%, 10%, and 15% during the
April-October time period which corresponds to the greatest demand and backlog. As discussed in the
model clarifications section, increased capacity is allocated exclusively to ROTC. We expect ROTC
average BOLC-B wait time, ROTC BOLC-B (IN, AR, and MP) wait time, ROTC cumulative hold time,
and ROTC average time from commission to unit to decrease as a result of increased capacity. Figures 18
through 20 highlight the impacts of 5%, 10%, and 15% increases to AR, IN, and MP BOLC-B capacity.
A 5% increase in AR, IN, and MP BOLC-B capacity can reduce overall ROTC BOLC-B average wait
time by 3 weeks and reduce ROTC cumulative hold days by 43,000 days which equates to approximately
20 days per ROTC officer.
Figure 18. ROTC BOLC-B Wait Time and Hold Days.
Figure 19 highlights a 5% increase in AR, IN, and MP BOLC-B capacity for the courses conducted from
April-October can get ROTC LTs to their units over 3 weeks earlier and reduce average ROTC Infantry
BOLC-B wait time by over one month.

26
Figure 19. ROTC Time from Commission to Unit and BOLC-B Wait Time by Branch.
Figure 20 illustrates that increasing BOLC-B capacity for IN, AR, and MP by 5% in the summer months
can have a positive effect on Lieutenant arrival to units. A 5% increase increases total number of of days
between BOLC-B and unit LAD date for all officers by 5,000 days. However, when we look at
proportion of LTs arriving before the MRE – getting LTs to their units earlier without regard to their unit
cycle actually results in more LTs arriving between LAD and R+90.
Figure 20. ROTC Time from Commission to Unit and BOLC-B Wait Time by Branch.
5.4 BOLC-B Seat Allocations
We will adjust IN, AR, and MP BOLC-B course allocations in the model during June and July. USMA
receives its first post-graduation BOLC-B allocations in late June or early July. We will delay this first
allocation by one and two months, shifting these allocations instead to ROTC. We expect ROTC average
BOLC-B wait time, ROTC BOLC-B (IN, AR, and MP) wait time, ROTC cumulative hold time, and
ROTC average time from commission to unit to decrease as a result of increased capacity. However, we
expect these same USMA metrics to increase.
Figures 21 through 23 highlight the impacts of shifting these allocations away from USMA in June and
July. A one month shift of USMA allocations for AR, IN, and MP BOLC-B seats levels USMA and
ROTC average BOLC-B wait time and, while slightly increasing USMA BOLC-B wait time, can
27
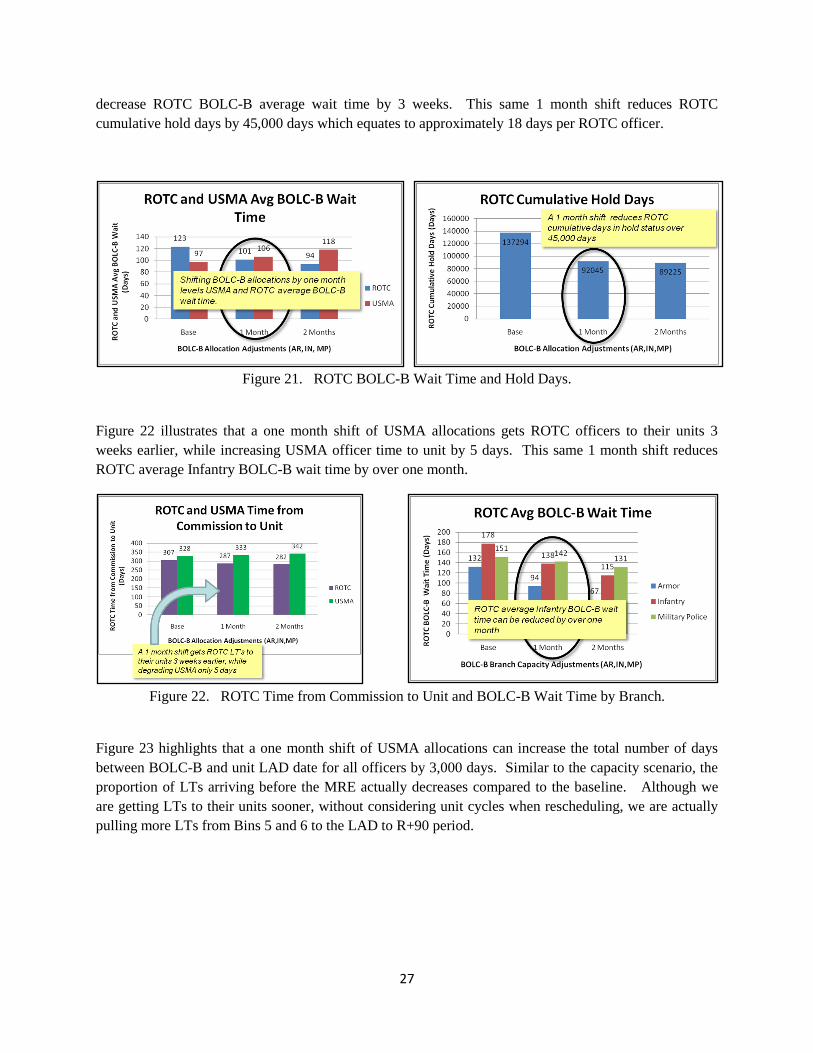
decrease ROTC BOLC-B average wait time by 3 weeks. This same 1 month shift reduces ROTC
cumulative hold days by 45,000 days which equates to approximately 18 days per ROTC officer.
Figure 21. ROTC BOLC-B Wait Time and Hold Days.
Figure 22 illustrates that a one month shift of USMA allocations gets ROTC officers to their units 3
weeks earlier, while increasing USMA officer time to unit by 5 days. This same 1 month shift reduces
ROTC average Infantry BOLC-B wait time by over one month.
Figure 22. ROTC Time from Commission to Unit and BOLC-B Wait Time by Branch.
Figure 23 highlights that a one month shift of USMA allocations can increase the total number of days
between BOLC-B and unit LAD date for all officers by 3,000 days. Similar to the capacity scenario, the
proportion of LTs arriving before the MRE actually decreases compared to the baseline. Although we
are getting LTs to their units sooner, without considering unit cycles when rescheduling, we are actually
pulling more LTs from Bins 5 and 6 to the LAD to R+90 period.

28
Figure 23. ROTC Time from Commission to Unit and BOLC-B Wait Time by Branch.
5.5 BOLC-B Scheduling By Unit Priority
The vast majority of USMA officers select their BOLC-B dates independent of the unit to which they will
be assigned. Stakeholders were interested in examining the impact of scheduling BOLC-B attendance
based upon unit priority; determined by days until LAD. The model allows rescheduling of the entire
FY10 by unit priority. Figures 24 through 26 highlight the effects of this change.
Figure 24. ROTC BOLC-B Wait Time and Hold Days.
Figure 24 illustrates that if we schedule officers for BOLC-B based upon unit priority we can level
USMA and ROTC BOLC-B wait time and reduce ROTC cumulative hold days by 43,500 days.
29
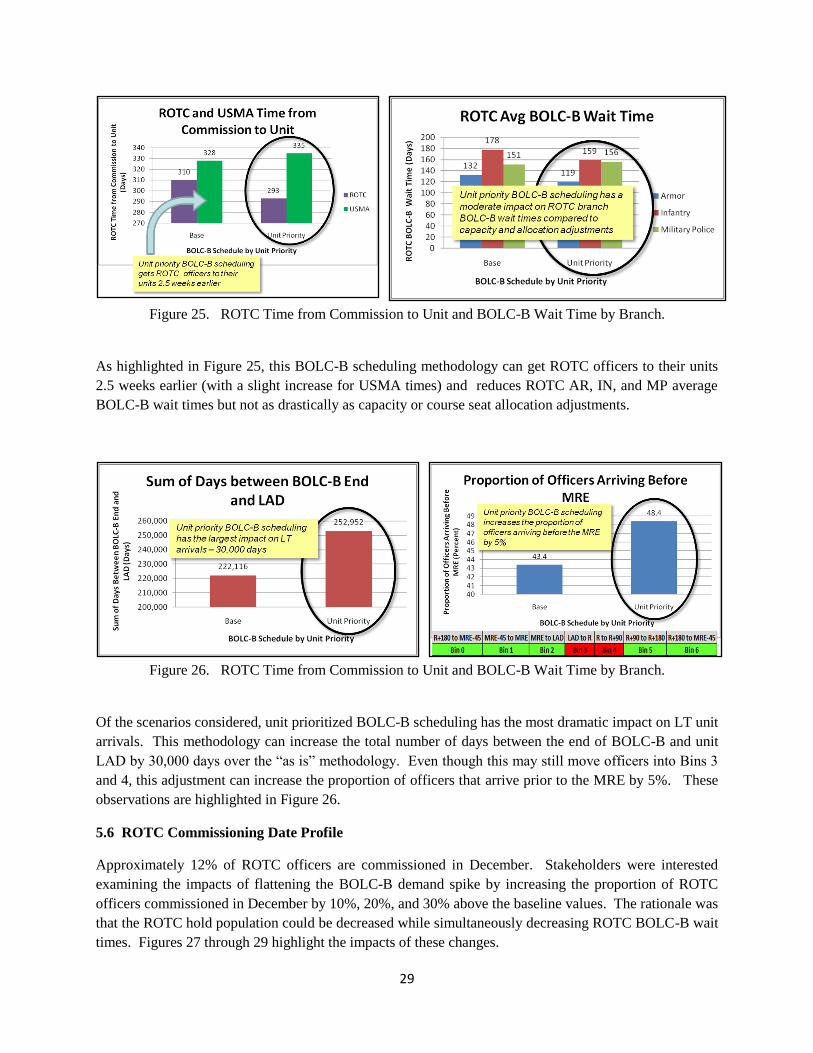
Figure 25. ROTC Time from Commission to Unit and BOLC-B Wait Time by Branch.
As highlighted in Figure 25, this BOLC-B scheduling methodology can get ROTC officers to their units
2.5 weeks earlier (with a slight increase for USMA times) and reduces ROTC AR, IN, and MP average
BOLC-B wait times but not as drastically as capacity or course seat allocation adjustments.
Figure 26. ROTC Time from Commission to Unit and BOLC-B Wait Time by Branch.
Of the scenarios considered, unit prioritized BOLC-B scheduling has the most dramatic impact on LT unit
arrivals. This methodology can increase the total number of days between the end of BOLC-B and unit
LAD by 30,000 days over the “as is” methodology. Even though this may still move officers into Bins 3
and 4, this adjustment can increase the proportion of officers that arrive prior to the MRE by 5%. These
observations are highlighted in Figure 26.
5.6 ROTC Commissioning Date Profile
Approximately 12% of ROTC officers are commissioned in December. Stakeholders were interested
examining the impacts of flattening the BOLC-B demand spike by increasing the proportion of ROTC
officers commissioned in December by 10%, 20%, and 30% above the baseline values. The rationale was
that the ROTC hold population could be decreased while simultaneously decreasing ROTC BOLC-B wait
times. Figures 27 through 29 highlight the impacts of these changes.

30
Figure 27. ROTC BOLC-B Wait Time and Hold Days.
Figure 27 indicates that moving 20% of ROTC commissionees from May to December reduces ROTC
average BOLC-B wait time to 85 days (below the 90 day Army goal) and reduces cumulative hold days
by 51000 days; approximately 21 days per ROTC officer.
Figure 28. ROTC Time from Commission to Unit and BOLC-B Wait Time by Branch.
Adjusting the ROTC commissioning date profile reduces ROTC branch (AR, IN, and MP) BOLC-B wait
times and gets ROTC LTs to their units over one month earlier.

31
Figure 29. ROTC Time from Commission to Unit and BOLC-B Wait Time by Branch.
Figure 29 highlights that shifting 20% of ROTC commissionees from May to December has a negative
effect on both the total number of days between BOLC-B completion and unit LAD for all officers as
well as the proportion of officers that arrive before the MRE. This can likely be attributed to randomly
selecting ROTC May commissionees to shift to December without regard to their current unit/BOLC-B
course pairings. For example, we may randomly select a May ROTC commissionee with a July BOLC-B
date scheduled to go to a unit with a June 2011 LAD date. By shifting this individual to a December
commission date, the best case is that they would arrive in August which is well after unit LAD.
6.0 Potential Future Work. As mentioned previously, although a model construct and supporting data
for Modules 1 through 4 was developed, the programming effort was limited to Module 3.
Recommended future work includes both programming additional modules as well as refining the
existing model. Current model refinements could include: a) an improved user interface for selecting and
running scenarios, b) adding additional BOLC-B scheduling rules beyond FIFO and unit priority based
upon days until LAD, c) adding possible variations in allocation methodologies amongst the three SOCs,
d) develop a macro to optimize BOLC-B allocations for various objective functions, and e) refining
metrics for LTs arrival to units. The recommended priority of effort for programming additional modules
would be Modules 4 and 2 then Module 1. Major tasks required include reconciling the differences in
unit inventory versus authorization accounting as well as codifying unit allocation business rules to
facilitate coding within the model. The reserve component was not included in the scope of this effort but
may be something that could be added to the existing model. However, capturing generalizable business
rules for personnel assignments and scheduling of training for the reserve component may prove
challenging. Units that were not BCTs, CABs, or Division HQs were also not in the scope of this effort
but may be something that could be added to the existing model. This requires a validated, non-classified
source of AST output that includes the ARFORGEN schedules for additional units of interest. Lastly,
additional fidelity (i.e. course schedules and capacities, demand –based aviation platform assignments)
regarding aviation specialty training could also be added to provide additional detail to the current model.

32
7.0 Conclusion
In this research effort we developed a discrete-event simulation to replicate the flow of officers from their
commissioning source to their first unit of assignment. The model is comprised of a series of Excel
macros, updateable Excel input files, and a Promodel© simulation. The model provides a tool for
decision makers to conduct “what if” analysis – specifically, exploration of BOLC-B course capacity
changes, BOLC-B allocation strategies, BOLC-B scheduling rules, and ROTC commissioning date
profile adjustments. A series of output tables and graphics capture the effects of these parameter changes
on key stakeholder metrics of interest including: ROTC hold population, BOLC-B wait times, time from
commission to first unit, and timing of LT unit arrivals in relation to ARFORGEN cycles.
As we conduct “what if” analysis, we focus particular attention on ROTC officers and Armor (AR),
Infantry (IN), and Military Police (MP) Lieutenants. ROTC officers have historically had the longest
average BOLC-B wait times (123 days) and a large portion of these officers are placed in a “hold” status
(commissioned but not yet accessed) while they wait for their assigned BOLC-B course. Of the sixteen
different BOLC-B courses in which Lieutenants attend, AR, IN, and MP are the branches with the longest
BOLC-B wait times and will be the focus of portions of our analysis. Based upon stakeholder feedback,
we focus attention on the following metrics as we explore different scenarios and vary specific scenario
parameters:
• Time from Commission to Unit: The number of days from when a Lieutenant is commissioned
until they arrive at their assigned first unit.
• BOLC Wait Time: Defined as the number of days from when a Lieutenant is commissioned
until they start their BOLC-B course. This will be examined by branch and SOC.
• ROTC Officer Hold Population: Hold population is the number of ROTC officers that have
been commissioned but not yet accessed. We will measure the total cumulative days that ROTC
officers are in a hold status.
• Lieutenant Arrival: Defined as when in the ARFORGEN cycle Lieutenants arrive to the unit
measured by total days (all officers) before the unit Latest Arrival Date (LAD) and the proportion
of officers that arrive before the Mission Rehearsal Exercise (MRE).

33
Figure A. Comparison of Scenario Results Highlighting Trade-offs between COA’s and the best results
for each scenario.
We explore the following specific scenarios with the results highlighted in Figure A.
Scenario 1 - Capacity: To counter the spike in BOLC-B demand in the summer months, we explore
surging (increasing) BOLC-B capacity from April to November by 5%, 10% and 15% for AR, IN, and
MP. Increasing AR, IN, and MP BOLC-B capacity by 5%, 10% and 15% significantly improves ROTC
average BOLC-B wait time, ROTC cumulative hold days, and time from commission to unit for ROTC
officers with minimal negative impacts on other metrics of interest.
Scenario 2 - Allocation: To address the concern of “USMA-centric” BOLC-B allocations in June and
July, we shift the first major BOLC-B allocations from USMA to ROTC by one month (June) and two
months (June and July). A two month shift improves most of the metrics of interest but negatively
affects USMA BOLC-B wait time and time from commission to unit.
Scenario 3 - Unit Priority: A large portion of USMA officers select their own BOLC-B dates
completely divorced of their unit assignment and that unit’s ARFORGEN cycle. We reschedule all FY10
cohort LTs for BOLC-B based upon unit priority based upon number of days until LAD. Rescheduling
all FY10 cohort LTs for BOLC-B based upon unit priority greatly improves total days before LAD and
the proportion of officers that arrive before the MRE but has mixed results regarding some of the other
metrics.
Scenario 4 - ROTC Commissioning Date Profile: Only 12% of ROTC officers are commissioned in
December. As an additional means to counter the spike in BOLC-B demand in the summer months, we
explore shifting a portion (10%,20%, and 30%) of FY10 May commissionees to December. Shifting
30% of ROTC commissionees from May to December greatly improves ROTC average BOLC-B wait
time, ROTC cumulative hold days, and time from commission to unit for ROTC officers. However, total
days before LAD and proportion of officers arriving before the MRE are negatively affected. This is
34
primarily due to how the May commissionees are currently selected (randomly) to shift to December and
could likely be improved with a refined selection process.
In general, scheduling officers to arrive at their first units without regard to the unit ARFORGEN cycle is
counter-productive. A recommended future model refinement would be adjusting the model BOLC-B
scheduling rules to incorporate this factor.
In summary, this modeling effort captures the “as is” process that an officer must negotiate from
commissioning to first unit of assignment (FUA) – allowing “what if” analysis of stakeholder identified
variables of interest. Scenario analysis reveals opportunities for increased efficiency in the officer
accession process as well as highlighting strategic tradeoffs. This model provides an analytical tool to
inform accession policy and a foundation to examine other variables of interest with minimal future
refinements.
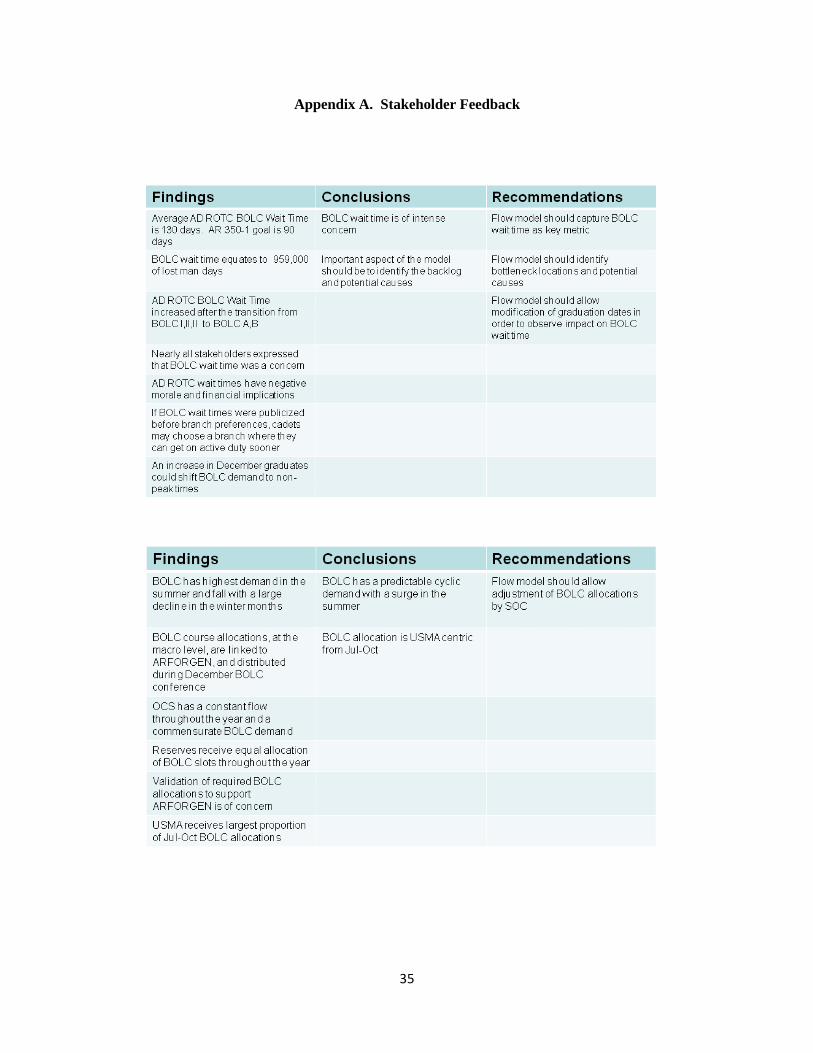
35
Appendix A. Stakeholder Feedback
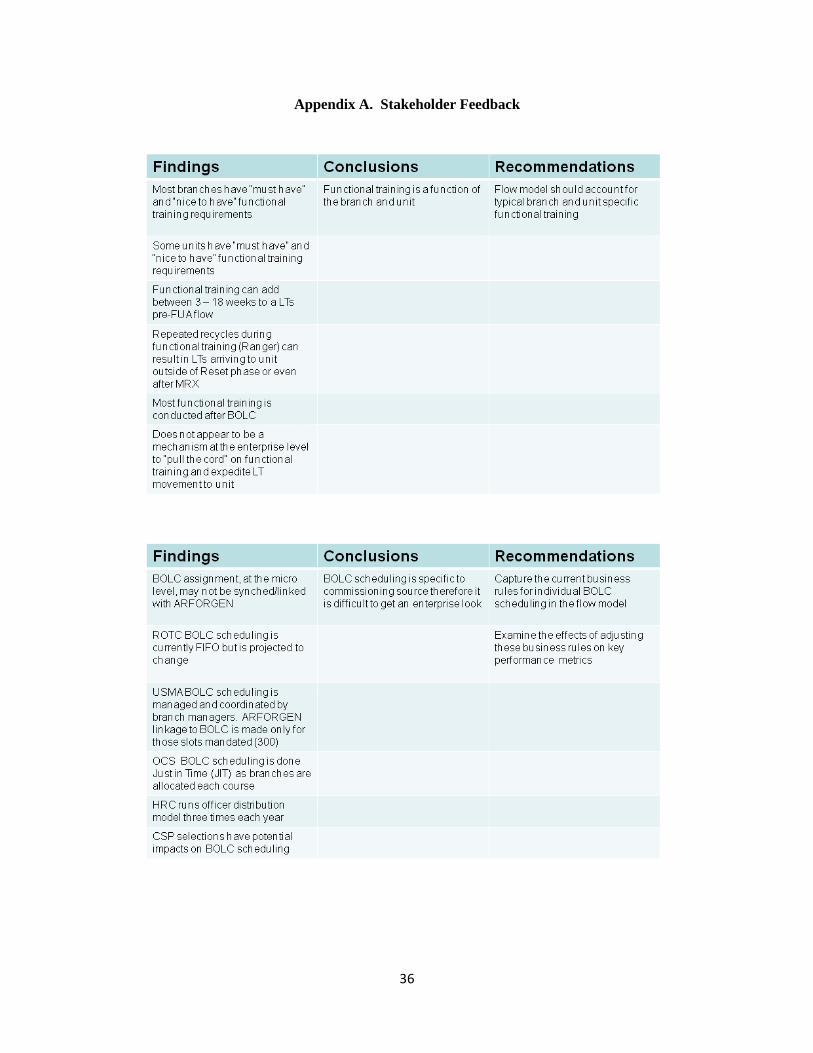
36
Appendix A. Stakeholder Feedback

37
Appendix A. Stakeholder Feedback

38
Appendix A. Stakeholder Feedback

39
Appendix B. IDEF0 System Model
Module 2
Assign Branch/Unit/BOLC-B
Module 1
Generate Officer Cohort
Module 3
BOLC-B and Functional Training
Module 4
Dirstibute LTs/Unit Manning
Commissioned LT
Commissioned LT w/Branch/Unit/BOLC-B
Trained LT
Unit Requirements
USMA Strength
ROTC Strength
OCS Strength
CC
145-1R
OTC
Incentives P
olicy
CC
SA
MS
Model
AR
210-26 US
MA
AR
351-5 OC
S
SO
C M
ission G
uidance
Branch Requirements
DA
G1 B
ranch G
uidance
HR
C S
OC
Unit
Allocations
BOLC-B Schedules
DMSL/Branch ASI Requirements
BOLC-B SOC Allocations
BO
LC-B
A
ssignment
Business R
ules
BO
LC-B
A
llocation Conf
MILP
ER
08-219 A
RFO
RG
EN
M
anning
Discrete Event Simulation
Discrete Event Simulation
Discrete Event Simulation
Discrete Event Simulation
Unit Fill By CyclePMAD
TAPDB-O
PM
AD
BO
LC-B
A
llocation Conf
SM
DR
Synch matrix
Timing of LT Arrivals
AR
600-8-24 O
fficer Discharges
AR
600-8-29 O
fficer Prom
otions
DO
DI 1315.18I
Assignm
ents
FY08 -FY
10 Active
Com
ponent Manning
Guidance
MILP
ER
08-219 A
RFO
RG
EN
Manning
BOLC-B Wait Time

40
Appendix C. Phase I Flowchart
OCS Accessed
Wait @ BOLC
Loss
AV BOLC
__ BOLC
MS
BOLC
Recycle
Recycle
Recycle
Loss Loss
Loss
IERW
Recycle
AV
Special 1
AV
Special 2
AV
Special 3
AV
Special 4
Recycle
Recycle
Recycle
Recycle
Functional Tng
Recycle
Unit
Loss
Loss
Assign Airframe
CommissionROTC Accessed
Hold
Loss
GB
LDAC
LTC
Loss
USMACommissioned/
Accessed
CST
Loss
Scholar
AI
Fall
AI
Spring
AV
Special 5
Recycle
Wait
AV
Special 1
Wait
AV
Special 2
Wait
AV
Special 3
Wait
AV
Special 4
Wait
AV
Special 5
Wait
IERW
Additional
Functional Tng
Recycle

41
Appendix D. Use of the Model
To Run “As is” baseline model:
Open the data template.
Enable Macros.
Go to Tab Y, Cell AK:5520 and click “Run Program.” This slots all FY10 cohort members in
the appropriate BOLC-B courses in accordance with historical records.
Save the workbook.
Run ProModel. Ensure that the Excel Reports output file is closed before running the model or
those specific model outputs will not be updated.
To Run BOLC-B capacity adjustments to the model:
Open the data template.
Enable Macros.
Go to Tab W, Column M and enter new course capacities. This will adjust ROTC course
allocations for each course with added capacity.
Go to Tab BOLC Constrained Analysis, Cell A:1 and click “Run Program.” This slots all
FY10 cohort members in the appropriate BOLC-B courses utilizing First to Commission: First
to BOLC scheduling rule and the adjusted capacities. At the first and second prompts enter 0.
Save the workbook.
Run ProModel. Ensure that the Excel Reports output file is closed before running the model or
those specific model outputs will not be updated.
To Run BOLC-B specific course allocation adjustments to the model:
Open the data template.
Enable Macros.
Go to Tab W, Column P and enter new ROTC course allocation. Any increase over the
current ROTC allocation will be subtracted from USMA. You must remember to add this
USMA allocation deduction to a subsequent class, then subtract that amount from ROTC
allocation for the same course. Highlight these changes in red so you can return to the
baseline data.
Go to Tab BOLC Constrained Analysis, Cell A:1 and click “Run Program.” This slots all
FY10 cohort members in the appropriate BOLC-B courses utilizing First to Commission: First
to BOLC scheduling rule and the new allocations. At the first and second prompts enter 0.
Save the workbook.
Run ProModel. Ensure that the Excel Reports output file is closed before running the model
or those specific model outputs will not be updated.

42
To Run Unit priority BOLC-B Scheduling:
Open the data template.
Enable Macros.
Go to Tab BOLC Constrained Analysis, Cell A:1 and click “Run Program.” At the first
prompt enter “1” at the second prompt enter “0”. This slots all FY10 cohort members
utilizing the current allocations and unit priority based upon number of days until unit
LAD.
Save the workbook.
Run ProModel. Ensure that the Excel Reports output file is closed before running the
model or those specific model outputs will not be updated.
To Run Adjustment of ROTC Commission Profile:
Open the data template.
Enable Macros.
Go to Tab BOLC Constrained Analysis, Cell A:1 and click “Run Program.” At the first
prompt enter “0” at the second prompt enter a whole number between 0 and 100 that
represents the percentage of ROTC May graduates that you want to shift to December
graduates. This slots all FY10 cohort members utilizing the current allocations and shift
the designated percentage to December.
Save the workbook.
Run ProModel. Ensure that the Excel Reports output file is closed before running the
model or those specific model outputs will not be updated.

43
Appendix E. Model Outputs
ROTC Hold Population BOLC-B Wait Time by Branch (all officers)
Officers Waiting for BOLC-B by branch ROTC Time from Commission to Unit
USMA Time from Commission to Unit OCS Time from Commission to Unit

44
BOLC-B Wait by Branch (all officers) Unit Arrivals by ARFORGEN Cycle
Variable Summary Table (Includes Statistics on 200+ Model variables)

45
Nomenclature
AC Active Component ACC Army Competitive Category ACP Army Campaign Plan AD Active Duty ADSO Active Duty Service Obligation AFM ARFORGEN Focused Manning AHRC Army Human Resources Command AI Athletic intern ARFORGEN Army Force Generation ASI Additional Skill Identifier AST ARFORGEN Synchronization Tool ATRRS Army Training Requirements and Resource System AV Aviation BASD Basic Active Service Date BCT Brigade Combat Team BOG Boots on the Ground BOLC Basic Officer Leader Course BOLC-A Basic Officer Leader Course (pre-commissioning training) BOLC-B Basic Officer Leader Course (branch specific training) CAA Center for Army Analysis COMPO Component CONUS Continental US DA Department of the Army DCG-IMT Deputy Commanding General, Initial Military Training DEROS Date Expected to Return from Overseas DML Distribution Manning Level DMSL Distribution Manning Sub-Level DoD Department of Defense ETS Expiration Term of Service FMSWeb Force Management System Web Site FORSCOM U.S. Forces Command FSA Force Structure Allowance FUA First unit of Assignment FY Fiscal Year GB Gold Bar Recruiter GWOT Global War on Terror HBCT Heavy Brigade Combat Team HRC Human Resources Command IBCT Infantry Brigade Combat Team IDEF0 Integrated . . . IERW Initial Entry Rotary Wing IET Initial Entry Training LAD Latest Arrival Date LDAC Leader development and Assessment Course LTC Leader Training Course MARATHON Modeling the Army at Home or Not MOS Military Occupational Specialties MRE Mission Rehearsal Exercise MRX Mission Readiness Exercise MSL Military Science Level MTOE Modified Table of Organization and Equipment NG National Guard OCONUS Outside the Continental US

46
OCS Officer Candidate School OEMA Office of Economic and Manpower Analysis OPTEMPO Operational Tempo ORCEN Operations Research Center of Excellence OS Operating Strength PCS Permanent Change of Station PMAD Personnel Management Authorization Document R Return Date RC Reserve Component REFRAD Release from Active Duty ROTC Reserve Officers Training Corps SBCT Stryker Brigade Combat Team SECDEF Secretary of Defense SMDR Senior Management Decision Review SOC Source of Commission SRC Standard Requirement Code TAPDB Total Army Personnel Database TDA Table of Distribution and Allowances TIS Time in Service TOPMIS Total Officer Personnel Management Information System TOS Time on Station TRADOC U.S. Army Training and Doctrine Command UIC Unit Identification Code USANG U.S. Army National Guard USAR U.S. Army Reserve USMA United States Military Academy USAAC U.S. Army Accessions Command USACC U.S. Army Cadet Command V-and-V Verification and Validation

47
References
[1] Camm, Frank, Cook, Cynthia R., Masi, Ralph, & Wong, Anny. 2007. What the Army Needs to Know to Align Its Operational and Institutional Activities: Executive Summary. RAND Arroyo Center, Santa Monica, CA. [2] Campbell, C. 2009. ARFORGEN: Maturing the Model, Refining the Process. Army Magazine, June
2009, 49-54.
[3] Campbell, C. 2010. Cementing Change-Institutionalizing ARFORGEN. Army Magazine, April 2010, 41-
50.
[4] Dabkowski, Matthew, Zais, Mark, Kewley, Robert, Miller, Kent. 2009. Analysis of Unit and Individual BOG:Dwell in Steady-State ARFORGEN.
[5] Department of Defense. 2005 (12 January). DODI 1315.18p: Procedures for Military Personnel
Assignments. [6] Department of the Army. 2001 (11 June). AR 350-51: Officer Candidate School. [7] Department of the Army. 2005 (25 February). AR 600-8-29: Officer Promotions. [8] Department of the Army. 2006a (12 April). AR 600-8-24: Officer Transfers and Discharges. [9] Department of the Army. 2006b. FM 3-90.6: The Brigade Combat Team. [10] Department of the Army. 2007. Army Posture Statement: Addendum H (Army Force Generation). [11] Department of the Army. 2008a (16 June). Army Campaign Plan 2008 EXORD. A-1. [12] Department of the Army. 2008b. FM 1-01: Generating Force Support for Operations. [13] Department of the Army. 2008c (10 July). HQDA Active Component Manning Guidance for FY 2008-
2010. [14] Department of the Army. 2008d (29 August). MILPER Message Number : 08-219 (AHRC-PL- PN) ARFORGEN Focused Manning. [15] Department of the Army. 2008e(14 November). HQDA Information Pamphlet: ARMY FORCE
GENERATION (ARFORGEN). [16] Department of the Army. 2009a (11 March). Fiscal Year 2010 (FY10) Army Accessions Mission. DA
G1 (DAPE-MP). [17] Department of the Army. 2009b (9 December). AR 210-26: United States Military Academy. [18] Department of the Army. 2011 (14 March). AR 525-9: Army Force Generation.

48
[19] Devore, Jay L. 2008. Probability and Statistics for Engineering and the Sciences. Seventh edition. Thomson Higher Education, Belmont, CA. [20] Forces Command. 2008. ARFORGEN Synchronization Tool, U.S. Forces Command, G3/5/7. [21] Harrell, Charles, Ghosh, Biman K., & Bowden Jr.,Royce O. 2004. Simulation Using ProModel. Second
edition. McGraw Hill, New York. [22] Klimas, J. 2008. Modeling Army Force Generation: Requirements and Capacity Analysis, Center for
Army Analysis.
[23] Lord, Harold (ed). 2007-2008. HOW THE ARMY RUNS: A Senior Leader Reference Handbook. U.S. Army War College, Carlisle, PA. [24] McNeill, Dan K. 2005 (August). Army Force Generation within Joint Force Provider. [25] (OPD-D), Human Resources Command (26 July 2010). LT Distribution, HRC (OPD-D). [26] Parnell, Gregory S., Driscoll, Patrick J., & Henderson, Dale L. (eds). 2008. Decision Making in Sys- tems Engineering and Management. Wiley Series in Systems Engineering and Management. John Wiley & Sons, Inc. [27] Roederer, R. 2010. Army ROTC Scholarship and Mission Set Model (SAMS), U.S. Army Cadet
Command. [28] Sargent, Robert G. 1998. Verification and Validation Of Simulation Models. [29] Stoddard, Steven, Brantley, Mark, Heidelbaugh, Clark, et al. . 2006. Army Force Generation Model Simulation. [30] Training and Doctrine Command. 2010 (16 November). TR 350-36: Basic Officer Leaders Course Training Policies and Administration. [31] United States Army Cadet Command, 2008a (3 March). CCR 145-9: Reserve Officers’ Training Corps
Branching, Commissioning and Accessions. [32] United States Army Cadet Command, 2008b (4 September). CCR 145-1: Reserve Officers’ Training
Corps Army ROTC Incentives Policy. [33] United States Army Cadet Command. 2010. FY10 Cohort AC ROTC BOLC-B Wait Time.
[34] Wark, L. 2007. PRM/Strength Management Briefing. Presented at the Adjutant General School, 2007.

Distribution List The list indicates the complete mailing address of the individuals and organizations receiving copies of the report and the number of copies received. Due to the Privacy Act, only use business addresses; no personal home addresses. Distribution lists provide a permanent record of initial distribution. The distribution information will include the following entries:
NAME/AGENCY ADDRESS COPIES
Author(s)
Department of Systems Engineering Mahan Hall West Point, NY 10996
2
Client
1
Dean, USMA Office of the Dean Building 600 West Point, NY 10996
1
Defense Technical Information Center (DTIC)
ATTN: DTIC-O Defense Technical Information Center 8725 John J. Kingman Rd, Suite 0944 Fort Belvoir, VA 22060-6218
1
Department Head-DSE Department of Systems Engineering Mahan Hall West Point, NY 10996
1
ORCEN
Department of Systems Engineering Mahan Hall West Point, NY 10996
5
ORCEN Director Department of Systems Engineering Mahan Hall West Point, NY 10996
1
USMA Library USMA Library Bldg 757 West Point, NY 10996
1

Standard Form 298 (Rev. 8/98)
REPORT DOCUMENTATION PAGE
Prescribed by ANSI Std. Z39.18
Form Approved OMB No. 0704-0188
The public reporting burden for this collection of information is estimated to average 1 hour per response, including the time for reviewing instructions, searching existing data sources, gathering and maintaining the data needed, and completing and reviewing the collection of information. Send comments regarding this burden estimate or any other aspect of this collection of information, including suggestions for reducing the burden, to Department of Defense, Washington Headquarters Services, Directorate for Information Operations and Reports (0704-0188), 1215 Jefferson Davis Highway, Suite 1204, Arlington, VA 22202-4302. Respondents should be aware that notwithstanding any other provision of law, no person shall be subject to any penalty for failing to comply with a collection of information if it does not display a currently valid OMB control number. PLEASE DO NOT RETURN YOUR FORM TO THE ABOVE ADDRESS. 1. REPORT DATE (DD-MM-YYYY) 2. REPORT TYPE 3. DATES COVERED (From - To)
4. TITLE AND SUBTITLE 5a. CONTRACT NUMBER
5b. GRANT NUMBER
5c. PROGRAM ELEMENT NUMBER
5d. PROJECT NUMBER
5e. TASK NUMBER
5f. WORK UNIT NUMBER
6. AUTHOR(S)
7. PERFORMING ORGANIZATION NAME(S) AND ADDRESS(ES) 8. PERFORMING ORGANIZATION REPORT NUMBER
9. SPONSORING/MONITORING AGENCY NAME(S) AND ADDRESS(ES) 10. SPONSOR/MONITOR'S ACRONYM(S)
11. SPONSOR/MONITOR'S REPORT NUMBER(S)
12. DISTRIBUTION/AVAILABILITY STATEMENT
13. SUPPLEMENTARY NOTES
14. ABSTRACT
15. SUBJECT TERMS
16. SECURITY CLASSIFICATION OF: a. REPORT b. ABSTRACT c. THIS PAGE
17. LIMITATION OF ABSTRACT
18. NUMBER OF PAGES
19a. NAME OF RESPONSIBLE PERSON
19b. TELEPHONE NUMBER (Include area code)

INSTRUCTIONS FOR COMPLETING SF 298
1. REPORT DATE. Full publication date, including day, month, if available. Must cite at least the year and be Year 2000 compliant, e.g. 30-06-1998; xx-06-1998; xx-xx-1998.
2. REPORT TYPE. State the type of report, such as final, technical, interim, memorandum, master's thesis, progress, quarterly, research, special, group study, etc.
3. DATES COVERED. Indicate the time during which the work was performed and the report was written, e.g., Jun 1997 - Jun 1998; 1-10 Jun 1996; May - Nov 1998; Nov 1998.
4. TITLE. Enter title and subtitle with volume number and part number, if applicable. On classified documents, enter the title classification in parentheses.
5a. CONTRACT NUMBER. Enter all contract numbers as they appear in the report, e.g. F33615-86-C-5169.
5b. GRANT NUMBER. Enter all grant numbers as they appear in the report, e.g. AFOSR-82-1234.
5c. PROGRAM ELEMENT NUMBER. Enter all program element numbers as they appear in the report, e.g. 61101A.
5d. PROJECT NUMBER. Enter all project numbers as they appear in the report, e.g. 1F665702D1257; ILIR.
5e. TASK NUMBER. Enter all task numbers as they appear in the report, e.g. 05; RF0330201; T4112.
5f. WORK UNIT NUMBER. Enter all work unit numbers as they appear in the report, e.g. 001; AFAPL30480105.
6. AUTHOR(S). Enter name(s) of person(s) responsible for writing the report, performing the research, or credited with the content of the report. The form of entry is the last name, first name, middle initial, and additional qualifiers separated by commas, e.g. Smith, Richard, J, Jr.
7. PERFORMING ORGANIZATION NAME(S) AND ADDRESS(ES). Self-explanatory.
8. PERFORMING ORGANIZATION REPORT NUMBER. Enter all unique alphanumeric report numbers assigned by the performing organization, e.g. BRL-1234; AFWL-TR-85-4017-Vol-21-PT-2.
9. SPONSORING/MONITORING AGENCY NAME(S) AND ADDRESS(ES). Enter the name and address of the organization(s) financially responsible for and monitoring the work.
10. SPONSOR/MONITOR'S ACRONYM(S). Enter, if available, e.g. BRL, ARDEC, NADC.
11. SPONSOR/MONITOR'S REPORT NUMBER(S). Enter report number as assigned by the sponsoring/ monitoring agency, if available, e.g. BRL-TR-829; -215.
12. DISTRIBUTION/AVAILABILITY STATEMENT. Use agency-mandated availability statements to indicate the public availability or distribution limitations of the report. If additional limitations/ restrictions or special markings are indicated, follow agency authorization procedures, e.g. RD/FRD, PROPIN, ITAR, etc. Include copyright information.
13. SUPPLEMENTARY NOTES. Enter information not included elsewhere such as: prepared in cooperation with; translation of; report supersedes; old edition number, etc.
14. ABSTRACT. A brief (approximately 200 words) factual summary of the most significant information.
15. SUBJECT TERMS. Key words or phrases identifying major concepts in the report.
16. SECURITY CLASSIFICATION. Enter security classification in accordance with security classification regulations, e.g. U, C, S, etc. If this form contains classified information, stamp classification level on the top and bottom of this page.
17. LIMITATION OF ABSTRACT. This block must be completed to assign a distribution limitation to the abstract. Enter UU (Unclassified Unlimited) or SAR (Same as Report). An entry in this block is necessary if the abstract is to be limited.
Standard Form 298 Back (Rev. 8/98)