a fully convolutional network for weed mapping of unmanned
TRANSCRIPT

RESEARCH ARTICLE
A fully convolutional network for weed
mapping of unmanned aerial vehicle (UAV)
imagery
Huasheng Huang1,2, Jizhong Deng1,2, Yubin Lan1,2*, Aqing Yang3, Xiaoling Deng2,3,
Lei Zhang2,4
1 College of Engineering, South China Agricultural University, Guangzhou, China, 2 National Center for
International Collaboration Research on Precision Agricultural Aviation Pesticide Spraying Technology,
Guangzhou, China, 3 College of Electronical Engineering, South China Agricultural University, Guangzhou,
China, 4 College of Agriculture, South China Agricultural University, Guangzhou, China
Abstract
Appropriate Site Specific Weed Management (SSWM) is crucial to ensure the crop yields.
Within SSWM of large-scale area, remote sensing is a key technology to provide accurate
weed distribution information. Compared with satellite and piloted aircraft remote sensing,
unmanned aerial vehicle (UAV) is capable of capturing high spatial resolution imagery,
which will provide more detailed information for weed mapping. The objective of this paper
is to generate an accurate weed cover map based on UAV imagery. The UAV RGB imagery
was collected in 2017 October over the rice field located in South China. The Fully Convolu-
tional Network (FCN) method was proposed for weed mapping of the collected imagery.
Transfer learning was used to improve generalization capability, and skip architecture was
applied to increase the prediction accuracy. After that, the performance of FCN architecture
was compared with Patch_based CNN algorithm and Pixel_based CNN method. Experi-
mental results showed that our FCN method outperformed others, both in terms of accuracy
and efficiency. The overall accuracy of the FCN approach was up to 0.935 and the accuracy
for weed recognition was 0.883, which means that this algorithm is capable of generating
accurate weed cover maps for the evaluated UAV imagery.
Introduction
Many agricultural crops require the use of herbicides as essential tools for maintaining the
quality and quantity of crop production [1]. However, the inappropriate use of herbicides
could cause yield reduction and environmental pollution. The main reason for this problem is
that, the usual practice of weed management is to broadcast herbicides over the entire field,
even within the weed-free areas [2]. In the field of Site Specific Weed Management (SSWM),
there is a need for developing a new strategy to solve the problem of current weed control
practices.
PLOS ONE | https://doi.org/10.1371/journal.pone.0196302 April 26, 2018 1 / 19
a1111111111
a1111111111
a1111111111
a1111111111
a1111111111
OPENACCESS
Citation: Huang H, Deng J, Lan Y, Yang A, Deng X,
Zhang L (2018) A fully convolutional network for
weed mapping of unmanned aerial vehicle (UAV)
imagery. PLoS ONE 13(4): e0196302. https://doi.
org/10.1371/journal.pone.0196302
Editor: Jose Luis Gonzalez-Andujar, Instituto
Agricultura Sostenible, SPAIN
Received: January 4, 2018
Accepted: April 10, 2018
Published: April 26, 2018
Copyright: © 2018 Huang et al. This is an open
access article distributed under the terms of the
Creative Commons Attribution License, which
permits unrestricted use, distribution, and
reproduction in any medium, provided the original
author and source are credited.
Data Availability Statement: Data available from
the Figshare Repository (DOIs: 10.6084/m9.
figshare.5739669), and the URLs is: https://
figshare.com/articles/The_dataset_of_the_
manuscript_A_Fully_Convolutional_Network_for_
weed_mapping_of_Unmanned_Aerial_Vehicle_
UAV_Imagery_/5739669.
Funding: This work was supported by: 1. the
National Key Research and Development Plan:
High Efficient Ground and Aerial Spraying
Technology and Intelligent Equipment,
China; grant number: 2016YFD0200700;
To achieve this goal, it is necessary to generate an accurate weed cover map for precise
spraying of herbicide. In the practice of SSWM, a weed cover map can be used to decide where
the chemicals are needed most, least, or where it should not be used at all [3]. Usually, the
weed cover map can be developed using remote sensing technology. Through image process-
ing, remote sensing imagery can be converted to a weed cover map [3] which could be applied
for accurate spraying.
In the past few years, piloted aircraft and satellite remote sensing have been employed for
weed detection and mapping [4, 5]. However, it is hard to obtain a satisfactory result because
of the insufficient spatial resolution of the remote sensing imagery. Today, the insufficiency of
spatial resolution can be appropriately solved by using UAV-based remote sensing technology.
UAVs can fly at a low altitude and capture ultra-high spatial resolution imagery, which may
significantly improve the overall accuracy of weed mapping. Perez-Ortiz et al. [6] utilized the
UAV imagery for weed mapping, and an excellent performance was obtained using a semi-
supervised approach. Castaldi et al. [7] applied UAV multispectral imagery for maize/weed
classification. The classification results used in the weed management of the maize field leaded
to a decrease in the use of herbicide without negative consequences in terms of crop yield.
Weed detection in crop fields is a difficult task. This task is even complex in rice fields due
to that the rice and weeds share similarities in spectral characteristics and general appearance,
and due to the variability and changing conditions in rice fields. Even using OBIA method,
accurate weed mapping is still a challenging task. In recent few years, machine learning meth-
ods have been successfully applied in weed mapping based of UAV imagery. Alexandridis
et al. [8] applied four novelty detection classifiers for weed detection and mapping of Silybum
marianum (S. marianum) weed based on UAV multispectral imagery, and the identification
accuracy using One Class Support Vector Machine (OC-SVM) reached an overall accuracy of
96%. Tamouridou et al. [9] used the Multilayer Perceptron with Automatic Relevance Deter-
mination (MLP-ARD) to identify the S. marianum among other vegetation based on UAV
remote sensing, and the S. marianum identification rate was up to 99.54%.
As the varieties of machine learning approaches, Convolutional Neural Network (CNN) is
now the dominating method for most remote sensing applications [10–12]. However, tradi-
tional CNN architecture is an “image-label” mode that maps an image into a 1-D probability
distribution related to different classes [13], while what we expect in our application is a dense
class map, which is a “pixel-label” pattern. In order to generate a weed cover map, the output
image should have the same resolution with the input image, and the output map is a 2-D
probability distribution. To perform the “pixel-label” classification task, Shelhamer et al.[14]
proposed a Fully Convolutional Network (FCN) which is capable of providing dense class map
in image analysis. Gang Fu et al.[13] applied FCN method for classification of satellite imagery
and proved that this approach outperformed other existing methods in terms of accuracy.
Sherrah et al.[15] used an adapted FCN without downsampling for semantic labeling of aerial
imagery and proved that the proposed network yielded state-of-the-art accuracy for the ISPRS
Vaihingen and Potsdam benchmark data sets. However, to the best of our knowledge, the
potential of FCN method for weed mapping of UAV imagery is not yet been accessed.
The objectives of this paper are to: (1) Evaluate the feasibility of FCN method, which is usu-
ally used in computer vision field, on application of accurate weed mapping from the UAV
imagery; (2) Apply transfer learning method to improve the generalization capability; (3) Use
skip architecture to increase the prediction accuracy; (4) Compare the proposed method with
other methods in the application of weed mapping.
The rest of this paper is organized as followed: Section 2 introduces the data collection and
analyzing methods; Section 3 describes and discusses the experimental results; and Section 4
draws the conclusion and future perspective.
Weed mapping based on UAV imagery
PLOS ONE | https://doi.org/10.1371/journal.pone.0196302 April 26, 2018 2 / 19
http://service.most.gov.cn/2015tztg_all/
20160622/1108.html; funding institution: Ministry
of Agriculture of the People’s Republic of China;
the author receiving the funding: Yubin Lan; role
of funder in this study: study design, decision to
publish. 2: Science and Technology Planning
Project of Guangdong Province, China; grant
number: 2017A020208046; http://www.gdstc.
gov.cn/; funding institution: Department of
Science and Technology of Guangdong Province,
China; the author receiving the funding: Jizhong
Deng; role of funder in this study: study design,
decision to publish. 3: The National Natural
Science Fund, China; grant number: 61675003;
http://www.nsfc.gov.cn/publish/portal0/; funding
institution: National Natural Science Foundation of
China; the author receiving the funding: Xiaoling
Deng; role of funder in this study: study design,
preparation of the manuscript.
Competing interests: The authors have declared
that no competing interests exist.

Materials and methods
Study site
The study site was located at Zengcheng Teaching and Research Bases, South China Agricul-
tural University (Guangzhou city, Guangdong province, China, coordinates 23.240 N, 113.637
E, datum WGS84). The UAV data from a rice field was studied. This plot had an area of 0.54
ha, and was divided into 172 subplots of approximately the same size of 20 m2 (Fig 1). These
subplots were all irrigated and sown (Huahang No. 31 [16]) on August 21th 2017, at 60 Kg ha-1
in rows spaced 50 cm apart. The fertilizer (50 Kg N ha-1, 50 Kg P2O5 ha-1 and 40 Kg K20 ha-1)
was drilled at the seedling stage, and N at 40 Kg ha-1 was top-dressed at the active tillering
stage. The studied field was naturally infested with Leptochloa chinensis Nees (L. chinensis) [17]
and Cyperus iric [18] (Fig 2), and the weed species were mixed in the field.
Data collection
A multi-rotor UAV (Phantom 4, SZ DJI Technology Co., Ltd., Shenzhen, China) was used to
collect all of the imagery used in this study. The Phantom 4 camera uses 1-inch CMOS sensor
to capture 12 megapixel imagery [19] with the resolution of 4000�3000 pixels. During the
flight, a 3-axis gimbal on Phantom 4 provided a steady platform to keep the attached camera
pointed close to nadir. An overview of the UAV and the captured imagery were shown in Fig
3. DJI GS PRO (also known as the ground station of UAV) is an Ipad app designed for DJI air-
crafts, and was used to plan and control automatic flight [20] of UAV in this study.
Field campaigns were conducted on October 2th 2017, just when the rice and the infested
weeds were both in growing stage and the herbicide treatments were recommended. The
flights were conducted with the permission from Prof. Guohua Zhong, who was the authority
responsible for the experiment site. An rectangle region of 60 ╳ 50 m was selected as the
Fig 1. The general location of the study site and the brief overview of the studied rice field.
https://doi.org/10.1371/journal.pone.0196302.g001
Weed mapping based on UAV imagery
PLOS ONE | https://doi.org/10.1371/journal.pone.0196302 April 26, 2018 3 / 19

experimental area to perform the flights. According to the results of ground investigation, the
selected region was composed of 90 subplots (1800 m2) of rice, 8 subplots (160 m2) of weeds
and 38 subplots (760 m2) of weed-rice combination with different weed densities, as shown in
Fig 4. During the ground investigation, the weed density was obtained by visual judges under
the instruction of agronomy experts. It can be seen from Fig 4 that, the experimental site con-
tained much variability in weed-rice combinations.
The coordinate of each corner was collected as a boundary point and the flight plan was
automatically planed by DJI GS PRO. During data collection, the flight altitude was kept 6
meters above the ground, and the spatial resolution was around 0.3 cm. Meanwhile, the
Fig 2. In-field photograph of the study site. (a) The cultivated rice and some patches of L. chinensis; (b) The cultivated rice and some patches of Cyperus iric.
https://doi.org/10.1371/journal.pone.0196302.g002
Fig 3. An overview of UAV and the collected imagery. (a) The Phantom 4 UAV flying over the rice field; (b) Aerial imagery (with RGB channels) captured by the
UAV at an altitude of 6 m, showing the cultivated rice and some patches of weeds.
https://doi.org/10.1371/journal.pone.0196302.g003
Weed mapping based on UAV imagery
PLOS ONE | https://doi.org/10.1371/journal.pone.0196302 April 26, 2018 4 / 19

forward-lap and side-lap were set to 60% and 50% respectively. In this work, 91 imagery were
collected in total.
Since the resolution of our imagery is 4000 ╳ 3000 and much larger than other FCN experi-
ments like [14, 15], directly exporting the imagery into our FCN network can easily exhaust
the GPU’s memory. Therefore, each original imagery was divided into 12 tiles of size 1000 ╳1000, and 1092 tiles were obtained in total. Among the whole imagery tiles, 892 titles were ran-
domly selected as training dataset, and the other 200 tiles were chosen as validation dataset.
In the UAV imagery, all the objects were divided into 3 classes: Rice, Weeds and Others(including cement ground, water, et al.). Since the resolution of imagery is high enough to
visually distinguish different classes from the imagery, we manually label the Ground Truth
(GT) labels using specified colors: color green for Rice class, color red for Weeds class, and
color gray for Others class, as shown in Fig 5(b).
Methods
Similar with other supervised machine learning approaches, our method could be divided into
training and validation stage, as Fig 6. In the training stage, the image-labels pairs in the train-
ing set, with pixel-to-pixel corresponds, are input into the FCN network, as is shown in the
upper part of Fig 6. The network maps the input image into a same sized output image, and
the output image as well as the ground truth label (GT label) are used to compute the loss as an
objective function. After that, the gradient of the objective function with respect to the weights
of all the network modules are computed using the chain rule for derivatives, and then the net-
work parameters are updated by gradient descend method. The above training process will be
Fig 4. An overview of the results from ground investigation. (a) The ground truth map of the experimental site; (b) Sampling zone for division of the subplots in
the rice field.
https://doi.org/10.1371/journal.pone.0196302.g004
Weed mapping based on UAV imagery
PLOS ONE | https://doi.org/10.1371/journal.pone.0196302 April 26, 2018 5 / 19

Fig 5. Demonstration for imagery labeling. (a) UAV imagery; (b) GT labels corresponding to the imagery in (a).
https://doi.org/10.1371/journal.pone.0196302.g005
Weed mapping based on UAV imagery
PLOS ONE | https://doi.org/10.1371/journal.pone.0196302 April 26, 2018 6 / 19

iterated until the loss is less than a threshold or the maximum iterations reach. In the valida-
tion stage, the trained FCN network will map the validation image into a prediction class map
with per-pixel classification, as is shown in lower part of Fig 6.
The FCN network was proposed as the basic architecture for our dense prediction task.
Based on the basic of FCN network, transfer learning is introduced to improve the generaliza-
tion capability, and skip architecture is applied to increase the prediction accuracy.
Fully convolutional network. The general structure of a typical CNN is composed of
multiple convolutional layers interlaced with pooling layers [21], followed by some fully-con-
nected layers in the end [22], as shown in the upper part of Fig 7. The convolutional layer auto-
matically extract the hierarchical and high-level feature representation [21], while pooling
layer reduces the image resolution and help achieve spatial invariance, and the fully-connected
layer reduces the image dimension and outputs a 1-D distribution over classes. In general, the
maximum output in the 1-D distribution corresponds to the predicted result, which classifies
one image to one single label. This “image-label” mode has achieved success in the scene classi-
fication of high-resolution satellite imagery by the study of Hu et al [11].
However, the goal of this work is not a single label of the input image, but a dense predic-
tion map, which could generate a weed cover map for our UAV imagery. Therefore, the FCN
method was proposed for our study. Compared with CNN, FCN network transforms all the
fully-connected layers into convolutional layers and enables a classification net to output a
heatmap [14]. Using this transformation, the 2-D spatial information of the original image is
properly maintained, which contributes to output a dense prediction map. In the last convolu-
tional layer, the number of feature maps corresponds to the quantity of classes, where each fea-
ture map represents the spatial probabilities with regard to a certain class, as shown in the
lower part of Fig 7.
Fig 6. Overview of our methodology: The training stage and validation stage are illustrated in the upper and lower parts, respectively.
https://doi.org/10.1371/journal.pone.0196302.g006
Weed mapping based on UAV imagery
PLOS ONE | https://doi.org/10.1371/journal.pone.0196302 April 26, 2018 7 / 19

Though FCN network could maintain the 2-D spatial information, the size of output is typi-
cally reduced using the pooling operation. To compensate the resolution reduction, the decon-
volution operation is applied to the coarse output, as introduced by Shelhamer et al.[14]. A
deconvolutional layer is initialized using bilinear interpolation and learned for nonlinear
regression during the training stage. As the upsampling approach, the deconvolutional layers
restore the output to full resolution, thus an end-to-end, pixel-to-pixel prediction architecture
was established, as shown in Fig 8. The channels of the last deconvolutional layer is equal to
the quantity of classes, and each feature map represents the heat map for a certain class (the 3
feature maps corresponds to Rice, Weeds and Others, respectively). For every pixel in the pre-
diction feature maps, the class with maximum probability along the whole channels is used as
the predicted labels [15], and the predicted labels of all the pixels in the image form the output
result.
During the training process, the entropy-loss was calculated by comparing the target label
vectors y and predicted label vectors y (assuming there are n samples and T possible classes),
Fig 7. Overview of architecture of CNN (upper part) and FCN (lower part).
https://doi.org/10.1371/journal.pone.0196302.g007
Fig 8. Overview of deconvolutional operation for per-pixel classification tasks.
https://doi.org/10.1371/journal.pone.0196302.g008
Weed mapping based on UAV imagery
PLOS ONE | https://doi.org/10.1371/journal.pone.0196302 April 26, 2018 8 / 19

as defined by (1):
L ¼ �1
n
Xn
i¼1
XT
k¼1yðiÞklogy
ðiÞk ð1Þ
After the loss calculation, the gradient of the loss with respect to the weights of all modules
in the network was computed using chain rules [22], and used for network parameter updat-
ing, as define by (2) and (3):
Wðnþ1Þ ¼WðnÞ � DWðnþ1Þ ð2Þ
DWðnþ1Þ ¼ Z � dw �WðnÞ þ d
LðWÞWðnÞ
� �
þm � DWðnÞ ð3Þ
Where W(n) and W(n+1) denoted the previous weights and current weights, ΔW(n) and ΔW(n+1)
were the previous increment and current increment, η was the learning rate, and dw and mdenoted the weight decay and momentum, respectively.
Transfer learning. As a fully-supervised method, FCN achieves great success in computer
vision field as well as remote sensing. However, with limited training data, fully-supervised
training will generally cause the problem of overfitting [23], resulting in pool generalization
capability.
Transfer learning uses the existing weights from the model that is fully-trained in a specific
dataset like ImageNet [24], and retrains it for new classes [25]. Previous studies have proven
that transfer learning is effective in many remote sensing applications [11, 13, 26]. Generally,
transfer learning method discards the last layer of the pre-trained model, and appends a fully-
connected layer where the the neurons corresponds to the number of predicted classes. During
the training stage, final layer is trained from scratch, while the others are initialized from the
pre-trained model and updated by back-propagation rule or kept fixed.
In this work, the AlexNet [27] that won the ILSVRC-2012 champion was considered, as
well as the VGGnet [28] and GoogLeNet [29] that showed great performance in the ILSVRC-
2014. Despite its success, CNNs were largely forsaken by the machine learning communities
until the emergence of AlexNet in 2012 [22]. When applied to the ImageNet in ILSVRC-2012,
AlexNet halved the error rate of the state-of-art. The success came from the efficient use of
GPU, the technique of Local Response Normalization, overlapping pooling, data augmenta-
tion and dropout strategy [27]. VGGnet was developed by increasing the depth to 16–19 and
using very small (3╳3) convolution filters [28], which showed a significant improvement on
the classification accuracy and generalization capability. GoogLeNet was a 22 layers deep net-
work that won the runner-up of ILSVRC-2014 classification and detection challenges. The
hallmark of this architecture was the improved utilization of the computing resources inside
the network, which allowed for increasing the depth and width while keeping the computation
costs constant [29]. Compared with AlexNet and VGGnet, GoogLeNet achieved a similar
accuracy in ILSVRC with less parameters. In the following experiments, the pre-trained Alex-
Net, VGGnet and GoogLeNet were adapted into FCN network for the weed mapping task by
fine-tuning.
Skip architecture. The pooling layers in the FCN network could significantly reduce com-
putation and introduces invariance to small translation of input image [21]. However, 2-D spa-
tial precision is lost during downsampling in pooling layers [30], resulting in an output of
lower resolution. A typical solution is to upsample the output using a learned deconvolution,
as shown in Fig 8. Nevertheless, this is a sub-optimal approach since the start point is the sub-
sample function of the input image [15]. To compensate the resolution loss, we apply a skip
Weed mapping based on UAV imagery
PLOS ONE | https://doi.org/10.1371/journal.pone.0196302 April 26, 2018 9 / 19
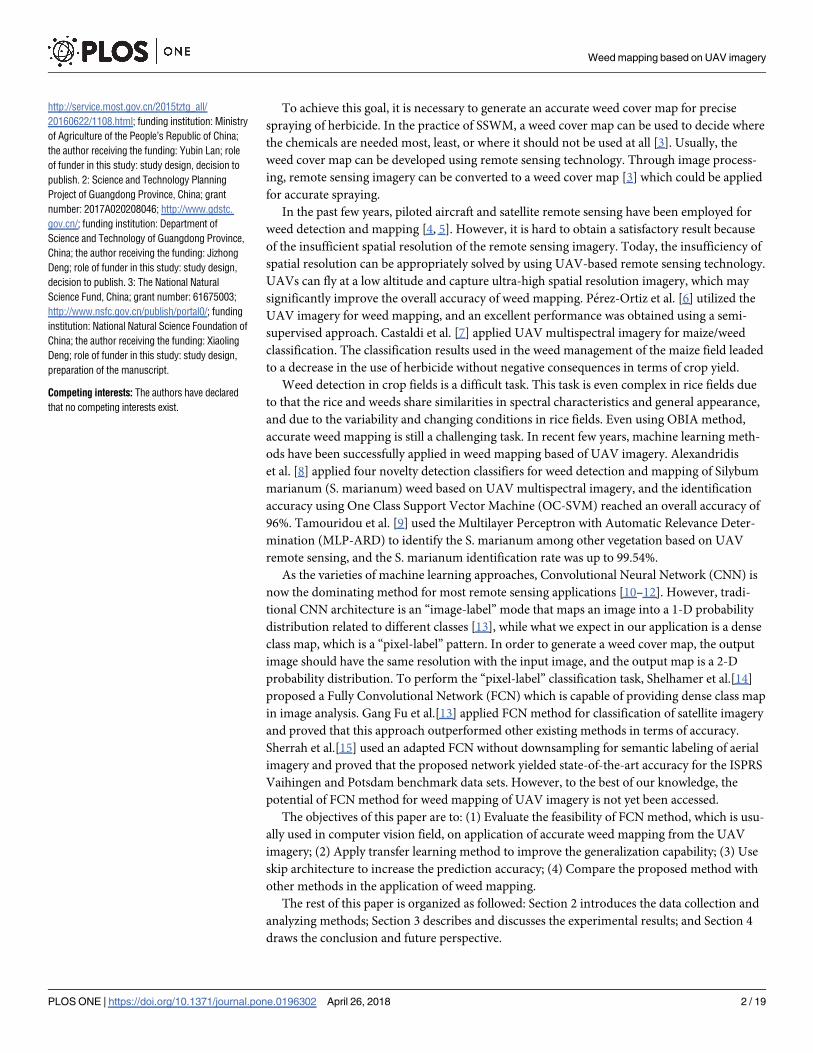
architecture that combines the coarse layer with the shallow layer to refine the spatial precision
of the output, as introduced by Shelhamer et al.[14].
Fig 9 illustrates the basic architecture of FCN transfered from a pre-trained VGG
16-layer net. Like most of the applications of transfer learning, the last classifier layer of
VGG-16 was discarded, and all the fully connected layers was transformed to convolutional
layers. A 1╳1 convolutional layer conv8 was appended and a feature map map8 with dimen-
sion W/32 ╳ H/32 ╳ 3 was generated (3 channels of the feature map respond to 3 classes:
Rice, Weeds and Others class, respectively). However, to generate a weed cover map, the
class map should be the same size as the input image, so the last feature map map8 was
upsampled to full resolution using deconvolutional layer, as introduced by Shelhamer
et al.[14]. The idea of skip architecture can be applied as followed: (1) if the last feature
map map8 is directly upsampled by a factor of 32, then a class map at full resolution is
obtained, which is called FCN32s; (2) if the feature map map4 is fused with 2 ╳ upsampling
of feature map map8 using the element-wise summation and the fusion result is upsampled
by a factor of 16, the result is called FCN-16s; (3) if the feature map map3 is fused with
2 ╳ upsampling of the prediction fused from map4 and map8 and the fusion result is
upsampled by a factor of 8, then the output class map is called FCN-8s; (4) If this fashion is
continued by combining even lower layers, a dense class map containing more detailed
information will be obtained.
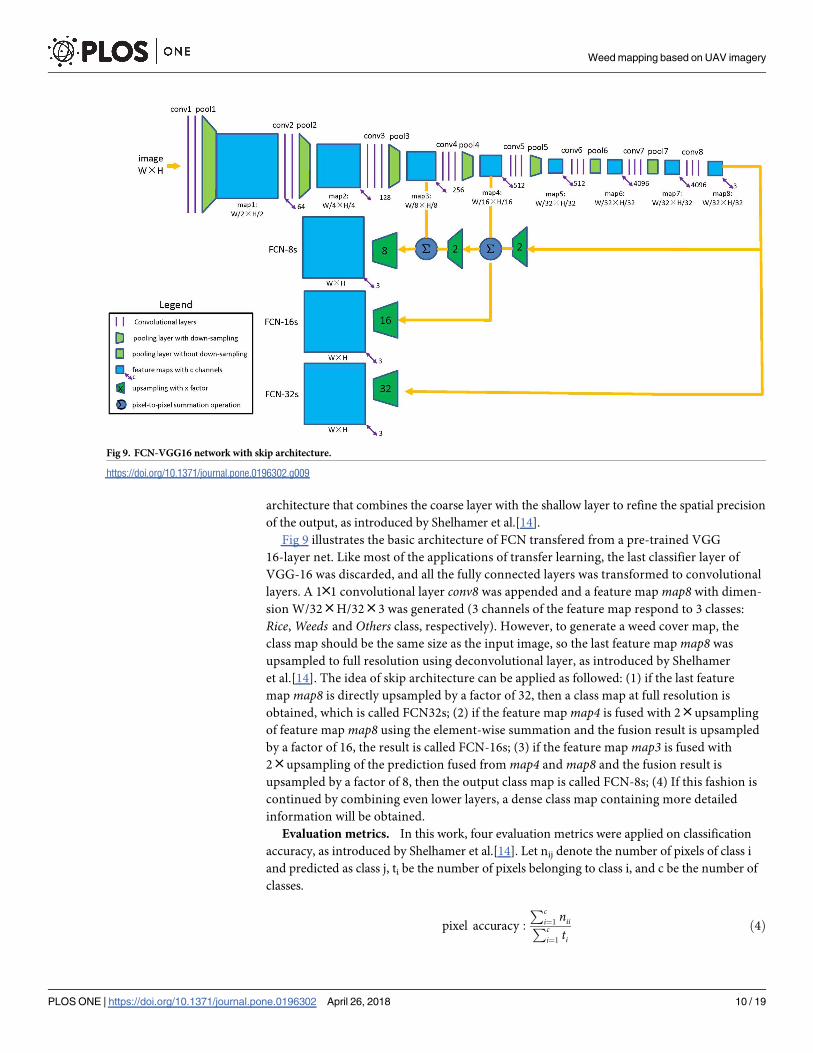
Evaluation metrics. In this work, four evaluation metrics were applied on classification
accuracy, as introduced by Shelhamer et al.[14]. Let nij denote the number of pixels of class i
and predicted as class j, ti be the number of pixels belonging to class i, and c be the number of
classes.
pixel accuracy :
Pci¼1
niiPci¼1
tið4Þ
Fig 9. FCN-VGG16 network with skip architecture.
https://doi.org/10.1371/journal.pone.0196302.g009
Weed mapping based on UAV imagery
PLOS ONE | https://doi.org/10.1371/journal.pone.0196302 April 26, 2018 10 / 19
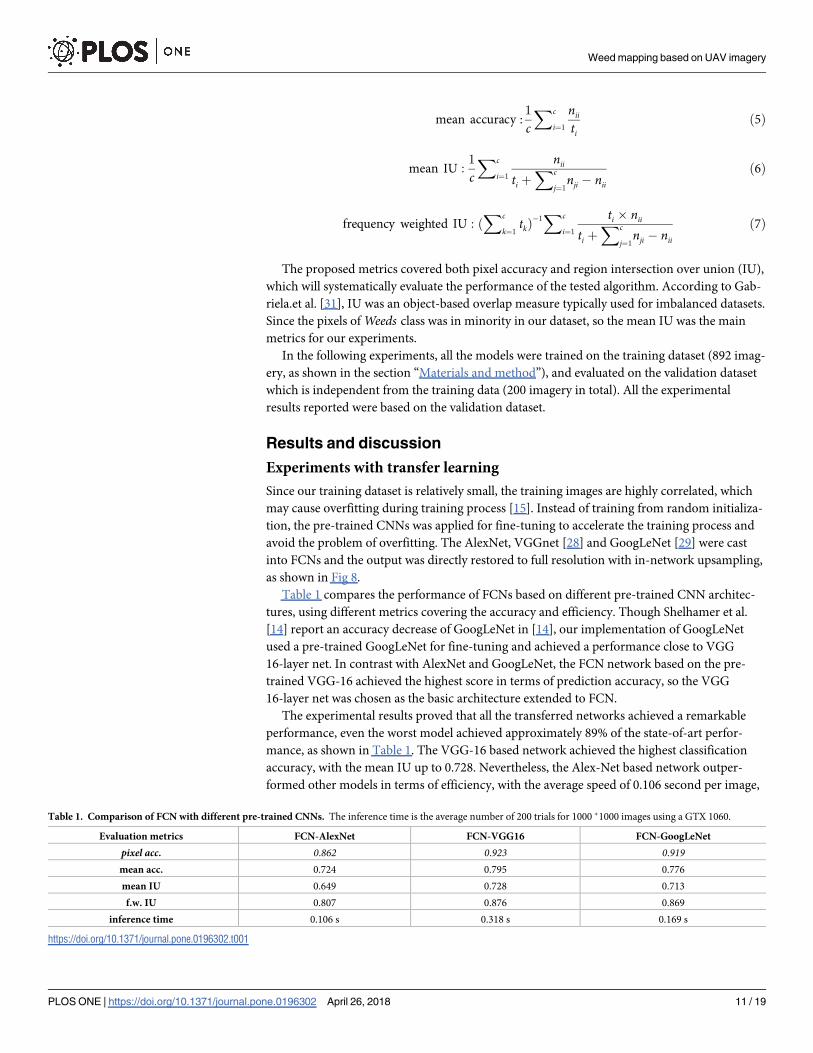
mean accuracy :1
c
Xc
i¼1
nii
tið5Þ
mean IU :1
c
Xc
i¼1
nii
ti þXc
j¼1nji � nii
ð6Þ
frequency weighted IU : ðXc
k¼1tkÞ� 1Xc
i¼1
ti � nii
ti þXc
j¼1nji � nii
ð7Þ
The proposed metrics covered both pixel accuracy and region intersection over union (IU),
which will systematically evaluate the performance of the tested algorithm. According to Gab-
riela.et al. [31], IU was an object-based overlap measure typically used for imbalanced datasets.
Since the pixels of Weeds class was in minority in our dataset, so the mean IU was the main
metrics for our experiments.
In the following experiments, all the models were trained on the training dataset (892 imag-
ery, as shown in the section “Materials and method”), and evaluated on the validation dataset
which is independent from the training data (200 imagery in total). All the experimental
results reported were based on the validation dataset.
Results and discussion
Experiments with transfer learning
Since our training dataset is relatively small, the training images are highly correlated, which
may cause overfitting during training process [15]. Instead of training from random initializa-
tion, the pre-trained CNNs was applied for fine-tuning to accelerate the training process and
avoid the problem of overfitting. The AlexNet, VGGnet [28] and GoogLeNet [29] were cast
into FCNs and the output was directly restored to full resolution with in-network upsampling,
as shown in Fig 8.
Table 1 compares the performance of FCNs based on different pre-trained CNN architec-
tures, using different metrics covering the accuracy and efficiency. Though Shelhamer et al.
[14] report an accuracy decrease of GoogLeNet in [14], our implementation of GoogLeNet
used a pre-trained GoogLeNet for fine-tuning and achieved a performance close to VGG
16-layer net. In contrast with AlexNet and GoogLeNet, the FCN network based on the pre-
trained VGG-16 achieved the highest score in terms of prediction accuracy, so the VGG
16-layer net was chosen as the basic architecture extended to FCN.
The experimental results proved that all the transferred networks achieved a remarkable
performance, even the worst model achieved approximately 89% of the state-of-art perfor-
mance, as shown in Table 1. The VGG-16 based network achieved the highest classification
accuracy, with the mean IU up to 0.728. Nevertheless, the Alex-Net based network outper-
formed other models in terms of efficiency, with the average speed of 0.106 second per image,
Table 1. Comparison of FCN with different pre-trained CNNs. The inference time is the average number of 200 trials for 1000 �1000 images using a GTX 1060.
Evaluation metrics FCN-AlexNet FCN-VGG16 FCN-GoogLeNet
pixel acc. 0.862 0.923 0.919mean acc. 0.724 0.795 0.776
mean IU 0.649 0.728 0.713
f.w. IU 0.807 0.876 0.869
inference time 0.106 s 0.318 s 0.169 s
https://doi.org/10.1371/journal.pone.0196302.t001
Weed mapping based on UAV imagery
PLOS ONE | https://doi.org/10.1371/journal.pone.0196302 April 26, 2018 11 / 19

demonstrating that this model could be considered in the application asking for real-time
processing.
Fig 10 listed the results of FCNs based on different pre-trained CNNs. From Fig 10, it can
be observed that FCN-AlexNet misclassified the Rice as Weeds (with black dashed boundary),
and FCN-GoogLeNet misclassified Others as weeds (with yellow dashed boundary), while
FCN-VGG16 correctly distinguished different classes.
Experiments with skip architectures
To make up the resolution loss caused by downsampling operations of the network, the skip
architecture was applied to improve the prediction accuracy. In this work, FCN-32s, FCN-16s
and FCN-8s were taken for the experiments of skip architectures, as Fig 9.
Table 2 lists the performance of FCN network with different skip architectures. First, the
coarse output of VGG-16 net was directly upsampled to full resolution (FCN-32s), resulting in
a mean IU of 0.728. Following the idea of skip architecture, the lower layer pool4 was fused
with the coarse output before upsampling (FCN-16s). With this architecture, the mean IU was
raised by 0.021 to 0.749, which means that the fusing strategy could actually improve the classi-
fication accuracy. This fashion was continued and even lower layer pool3 was fused to the net-
work (FCN-8s), achieving a minor improvement to 0.752 mean IU. At this time, the FCN
network has met diminishing returns, both in terms of mean IU and other metrics, so we stop
fusing even lower layers.
Fig 11 lists the classification results of FCN-32s, FCN-16s, and FCN-8s. From Fig 11, it can
be observed that FCN-32s misclassifies Rice as Weeds (in black dotted boundary), and FCN-
16s misclassifies the Weeds as Rice (in blue dotted boundary), while FCN-8s achieves the high-
est accuracy in rice recognition and weed detection. Also, the border of FCN-8s output is
more closer to the GT labels, compared with other architectures.
Comparison with other methods
Patch-based CNN. The network architecture of Patch-based CNN is shown in Fig 12. Dif-
ferent from the architecture used in [13, 32], the modified pre-trained VGG-16 network with
1/16 down-sampling factor was applied as the feature extractor. The stride of the last pooling
layer was set to 1, because fusing the previous feature map map4 with the coarse output could
significantly improve the classification accuracy, as shown in Table 2. Following the idea of
Mnih V [32], a fully connected layer was appended to the last pooling layer of VGG-16 net-
work, mapping the previous layer to 256 neurons, which is later rearranged into a 16×16 pre-
diction areas. Finally, an upsampling operation was performed by a factor of 4 to restore the
resolution.
Pixel-based CNN. Compared with FCNs and Patch-based CNN, the method of Pixel-
based CNN is a classification method in an “image-label” mode, which will classify a specific
patch into a single label. Following the idea of Sharma et al.[33], classification for the imagery
was processed pixel by pixel, considering the neighboring patch centered at the processed
pixel. Different from the architecture used in [33], the pre-trained AlexNet was applied for
fine-tuning. The reason for this choice is that our data is high-resolution imagery, which is
close to the images in ImageNet database, so directly applying the model pre-trained on Ima-
geNet could significantly speed up the convergence and improve the performance.
Experiments and comparison. In the experiment on Patch-based CNN, the patch size
was set to 200, so the 200×200 patches are imported to the classifier. In the experiment on
Pixel-based CNN, the performance of 5×5, 25×25 and 51×51 neighboring was compared, and
the optimal value 25×25 was selected as our experimental parameter. Table 3 lists the
Weed mapping based on UAV imagery
PLOS ONE | https://doi.org/10.1371/journal.pone.0196302 April 26, 2018 12 / 19

Fig 10. Classification results of FCN with different pre-trained CNNs. (a) UAV imagery; (b) corresponding GT
labels; (c-e) Results obtained by FCN-AlexNet, FCN-VGG16 and FCN-GoogLeNet, respectively.
https://doi.org/10.1371/journal.pone.0196302.g010
Weed mapping based on UAV imagery
PLOS ONE | https://doi.org/10.1371/journal.pone.0196302 April 26, 2018 13 / 19
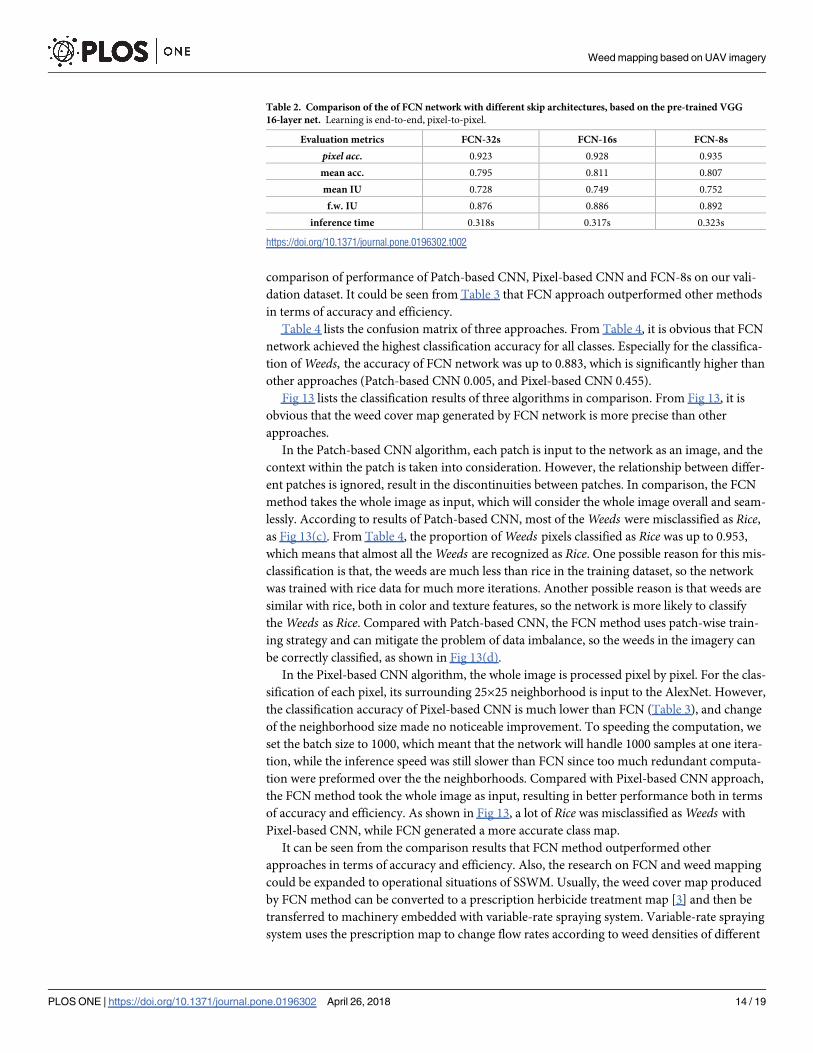
comparison of performance of Patch-based CNN, Pixel-based CNN and FCN-8s on our vali-
dation dataset. It could be seen from Table 3 that FCN approach outperformed other methods
in terms of accuracy and efficiency.
Table 4 lists the confusion matrix of three approaches. From Table 4, it is obvious that FCN
network achieved the highest classification accuracy for all classes. Especially for the classifica-
tion of Weeds, the accuracy of FCN network was up to 0.883, which is significantly higher than
other approaches (Patch-based CNN 0.005, and Pixel-based CNN 0.455).
Fig 13 lists the classification results of three algorithms in comparison. From Fig 13, it is
obvious that the weed cover map generated by FCN network is more precise than other
approaches.
In the Patch-based CNN algorithm, each patch is input to the network as an image, and the
context within the patch is taken into consideration. However, the relationship between differ-
ent patches is ignored, result in the discontinuities between patches. In comparison, the FCN
method takes the whole image as input, which will consider the whole image overall and seam-
lessly. According to results of Patch-based CNN, most of the Weeds were misclassified as Rice,as Fig 13(c). From Table 4, the proportion of Weeds pixels classified as Rice was up to 0.953,
which means that almost all the Weeds are recognized as Rice. One possible reason for this mis-
classification is that, the weeds are much less than rice in the training dataset, so the network
was trained with rice data for much more iterations. Another possible reason is that weeds are
similar with rice, both in color and texture features, so the network is more likely to classify
the Weeds as Rice. Compared with Patch-based CNN, the FCN method uses patch-wise train-
ing strategy and can mitigate the problem of data imbalance, so the weeds in the imagery can
be correctly classified, as shown in Fig 13(d).
In the Pixel-based CNN algorithm, the whole image is processed pixel by pixel. For the clas-
sification of each pixel, its surrounding 25×25 neighborhood is input to the AlexNet. However,
the classification accuracy of Pixel-based CNN is much lower than FCN (Table 3), and change
of the neighborhood size made no noticeable improvement. To speeding the computation, we
set the batch size to 1000, which meant that the network will handle 1000 samples at one itera-
tion, while the inference speed was still slower than FCN since too much redundant computa-
tion were preformed over the the neighborhoods. Compared with Pixel-based CNN approach,
the FCN method took the whole image as input, resulting in better performance both in terms
of accuracy and efficiency. As shown in Fig 13, a lot of Rice was misclassified as Weeds with
Pixel-based CNN, while FCN generated a more accurate class map.
It can be seen from the comparison results that FCN method outperformed other
approaches in terms of accuracy and efficiency. Also, the research on FCN and weed mapping
could be expanded to operational situations of SSWM. Usually, the weed cover map produced
by FCN method can be converted to a prescription herbicide treatment map [3] and then be
transferred to machinery embedded with variable-rate spraying system. Variable-rate spraying
system uses the prescription map to change flow rates according to weed densities of different
Table 2. Comparison of the of FCN network with different skip architectures, based on the pre-trained VGG
16-layer net. Learning is end-to-end, pixel-to-pixel.
Evaluation metrics FCN-32s FCN-16s FCN-8s
pixel acc. 0.923 0.928 0.935
mean acc. 0.795 0.811 0.807
mean IU 0.728 0.749 0.752
f.w. IU 0.876 0.886 0.892
inference time 0.318s 0.317s 0.323s
https://doi.org/10.1371/journal.pone.0196302.t002
Weed mapping based on UAV imagery
PLOS ONE | https://doi.org/10.1371/journal.pone.0196302 April 26, 2018 14 / 19

Fig 11. Classification results of FCN network with different skip architectures. (a) UAV imagery; (b)
corresponding GT labels; (c-e) Results obtained by FCN-32s, FCN-16s and FCN-8s, respectively.
https://doi.org/10.1371/journal.pone.0196302.g011
Weed mapping based on UAV imagery
PLOS ONE | https://doi.org/10.1371/journal.pone.0196302 April 26, 2018 15 / 19

sites, which may significantly promote the herbicide saving while enhancing the herbicide
effectiveness.
Conclusions
In this paper, UAV imagery was collected over a rice field, and then the FCN method was pro-
posed for semantic labeling and weed mapping of the imagery. Transfer learning was used to
improve the generalization capability and skip architecture was applied to increase the predic-
tion accuracy. After that, the FCN network was compared with another two deep learning
approaches. Experimental results demonstrated that our FCN network outperformed others,
both in terms of accuracy and efficiency. Especially for the recognition of weeds, our FCN
approach achieved the highest accuracy compared with other methods.
However, FCN is a fully supervised algorithm, and the training and updating of the network
rely on large amount of labeled images, which requires extensive manual labeling work. This
requirement limits the application of this method. So in the future of this work, we plan to
Fig 12. The network architecture of Patch-based CNN.
https://doi.org/10.1371/journal.pone.0196302.g012
Table 3. Performance comparison of Patch-based CNN, Pixel-based CNN and FCN-8s.
Evaluation metrics Patch-based CNN Pixel-based CNN FCN-8s
pixel acc. 0.727 0.651 0.935
mean acc. 0.611 0.608 0.807
mean IU 0.528 0.446 0.752
f.w. IU 0.651 0.551 0.892
inference time 0.338s 721.776s 0.323s
https://doi.org/10.1371/journal.pone.0196302.t003
Table 4. Confusion matrix of three approaches for the validation dataset.
Algorithm GT/ Predicted class Rice Weed Others
Patch-based CNN Rice 0.971 0.005 0.024
Weed 0.953 0.005 0.042
Others 0.154 0.016 0.830
Pixel-based CNN Rice 0.445 0.261 0.295
Weed 0.122 0.455 0.423
Others 0.006 0.020 0.974
FCN-8s Rice 0.956 0.017 0.027
Weed 0.054 0.883 0.063
Others 0.050 0.010 0.940
https://doi.org/10.1371/journal.pone.0196302.t004
Weed mapping based on UAV imagery
PLOS ONE | https://doi.org/10.1371/journal.pone.0196302 April 26, 2018 16 / 19

Fig 13. Classification results of three algorithms in comparison. (a) UAV imagery; (b) corresponding GT labels; (c-
e) Results obtained by Patch-based CNN, Pixel-based CNN and FCN-8s, respectively.
https://doi.org/10.1371/journal.pone.0196302.g013
Weed mapping based on UAV imagery
PLOS ONE | https://doi.org/10.1371/journal.pone.0196302 April 26, 2018 17 / 19
introduce the weak-supervised learning and unsupervised learning algorithm to reduce the
manual labeling work and enhance the ease of application.
Acknowledgments
The authors thank Prof. Guohua Zhong for granting permission for imagery collection and
field investigation of the studied site and Mr. Yuancheng Liang for providing professional
instruction in Ground Truth labeling.
Author Contributions
Conceptualization: Jizhong Deng, Yubin Lan, Lei Zhang.
Formal analysis: Yubin Lan, Aqing Yang, Xiaoling Deng.
Funding acquisition: Jizhong Deng, Yubin Lan.
Investigation: Jizhong Deng, Yubin Lan, Aqing Yang, Lei Zhang.
Methodology: Huasheng Huang, Jizhong Deng, Yubin Lan, Aqing Yang, Xiaoling Deng.
Project administration: Jizhong Deng, Yubin Lan.
Software: Huasheng Huang.
Supervision: Jizhong Deng, Yubin Lan.
Validation: Huasheng Huang.
Writing – original draft: Huasheng Huang.
Writing – review & editing: Jizhong Deng, Yubin Lan, Aqing Yang, Xiaoling Deng, Lei
Zhang.
References1. Pena JM, Torres-Sanchez J, de Castro AI, Kelly M, Lopez-Granados F. Weed mapping in early-season
maize fields using object-based analysis of unmanned aerial vehicle (UAV) images. PLOS ONE. [Jour-
nal Article; Research Support, Non-U.S. Gov’t]. 2013 2013-01-20; 8(10):e77151.
2. Lopez-Granados F, Torres-Sanchez J, Serrano-Perez A, de Castro AI, Mesas-Carrascosa FJ, Peña J.
Early season weed mapping in sunflower using UAV technology: variability of herbicide treatment maps
against weed thresholds. PRECIS AGRIC. 2016; 17(2):183–99.
3. Lan Y, Thomson SJ, Huang Y, Hoffmann WC, Zhang H. Current status and future directions of precision
aerial application for site-specific crop management in the USA. COMPUT ELECTRON AGR. 2010; 74
(1):34–8.
4. KOGER CH, SHAW DR, WATSON CE, REDDY KN. Detecting Late-Season Weed Infestations in Soy-
bean (Glycine max)1. WEED TECHNOL. 2003; 17(4):696–704.
5. Castro A, Jurado-Exposito M, A-Barragan JP, Lopez-Granados F. Airborne multi-spectral imagery for
mapping cruciferous weeds in cereal and legume crops. Precision Agric. 2012; 13:302–21.
6. Perez-Ortiz M, Peña JM, Gutierrez PA, Torres-Sanchez J, Hervas-Martınez C, Lopez-Granados F. A
semi-supervised system for weed mapping in sunflower crops using unmanned aerial vehicles and a
crop row detection method. APPL SOFT COMPUT. 2015; 37:533–44.
7. Castaldi F, Pelosi F, Pascucci S, Casa R. Assessing the potential of images from unmanned aerial vehi-
cles (UAV) to support herbicide patch spraying in maize. PRECIS AGRIC. 2017; 18(1):76–94.
8. Alexandridis TK, Tamouridou AA, Pantazi XE, Lagopodi AL, Kashefi J, Ovakoglou G, et al. Novelty
Detection Classifiers in Weed Mapping: Silybum marianum Detection on UAV Multispectral Images.
SENSORS-BASEL. 2017; 17(9):2007.
9. Tamouridou A, Alexandridis T, Pantazi X, Lagopodi A, Kashefi J, Kasampalis D, et al. Application of
Multilayer Perceptron with Automatic Relevance Determination on Weed Mapping Using UAV Multi-
spectral Imagery. SENSORS-BASEL. 2017; 17(12):2307.
Weed mapping based on UAV imagery
PLOS ONE | https://doi.org/10.1371/journal.pone.0196302 April 26, 2018 18 / 19

10. Bejiga MB, Nouffidj AZA, Melgani F. A Convolutional Neural Network Approach for Assisting Avalanche
Search and Rescue Operations with UAV Imagery. REMOTE SENS-BASEL. 2017; 100(9).
11. Hu F, Xia GS, Hu J, Zhang L. Transferring Deep Convolutional Neural Networks for the Scene Classifi-
cation of High-Resolution Remote Sensing Imagery. REMOTE SENS-BASEL. 2015(7):14680–707.
12. Langkvist M, Kiselev A, Alirezaie M, Loutfi A. Classification and Segmentation of Satellite Orthoimagery
Using Convolutional Neural Networks. REMOTE SENS-BASEL. 2016; 329(8).
13. Fu G, Liu C, Zhou R, Sun T, Zhang Q. Classification for High Resolution Remote Sensing Imagery
Using a Fully Convolutional Network. REMOTE SENS-BASEL. 2017; 6(9):498.
14. Shelhamer E, Long J, Darrell T. Fully Convolutional Networks for Semantic Segmentation. IEEE Con-
ference on Computer Vision & Pattern Recognition. [Journal Article]. 2015 2017-04-01; 79(10):3431–
40.
15. Sherrah J. Fully Convolutional Networks for Dense Semantic Labelling of High-Resolution Aerial Imag-
ery. arXiv:1606.02585. 2016; 9.
16. Liu Y, Wang H, Guo T, Zhang J, Tang X, Chen Z. Breeding and application of high-quality and disea-
seresistant rice variety, huahang No.31. Guangdong Agricultural Sciences. 2013(10):8–11.
17. Yu J, Gao H, Pan L, Yao Z, Dong L. Mechanism of resistance to cyhalofop-butyl in Chinese sprangletop
(Leptochloa chinensis (L.) Nees). PESTIC BIOCHEM PHYS. 2016.
18. Schwartz AM, Paskewitz SM, Orth AP, Tesch MJ, Toong YC. The lethal effects of Cyperus iria on
Aedes aegypti. J AM MOSQUITO CONTR. 1998; 1(14):78–82.
19. Phantom_4_Pro_Pro_Plus_User_Manual_EN. https://dl.djicdn.com/downloads/phantom_4_pro/
20171017/Phantom_4_Pro_Pro_Plus_User_Manual_EN.pdf/ (accessed on 14 November 2017).
20. GS_Pro_User_Manual_EN_V1.8. https://dl.djicdn.com/downloads/groundstation_pro/20170831/GS_
Pro_User_Manual_EN_V1.8.pdf/ (accessed on 14 November 2017).
21. Gao Z, Wang L, Zhou L, Zhang J. HEp-2 Cell Image Classification with Deep Convolutional Neural Net-
works. IEEE Journal of Biomedical & Health Informatics. 2017:91–9.
22. LeCun Y, Bengio Y, Hinton G. Deep learning. NATURE. 2015 2015-05-27; 521(7553):436–44. https://
doi.org/10.1038/nature14539 PMID: 26017442
23. Donahue J, Jia Y, Vinyals O, Hoffman J, Zhang N, Tzeng E, et al. DeCAF: A Deep Convolutional Activa-
tion Feature for Generic Visual Recognition. 2013.
24. Deng J, Dong W, Socher R, Li L, Li K, Fei-Fei L. ImageNet: A large-scale hierarchical image database.
In: Editor, editor; 2009. Pub Place: IEEE; 2009. p. 248–55.
25. How to Retrain Inception’s Final Layer for New Categories. https://www.tensorflow.org/tutorials/image_
retraining/ (accessed on 5 December 2017).
26. Maggiori E, Tarabalka Y, Charpiat G, Alliez P. Convolutional Neural Networks for Large-Scale Remote-
Sensing Image Classification. IEEE T GEOSCI REMOTE. 2016; 55(2):645–57.
27. Krizhevsky A, Sutskever I, Hinton GE. ImageNet classification with deep convolutional neural networks.
International Conference on Neural Information Processing Systems. 2012; 25(2):1097–105.
28. Simonyan K, Zisserman A. VERY DEEP CONVOLUTIONAL NETWORKS FOR LARGE-SCALE
IMAGE RECOGNITION. arXiv:1409.1556v6 [cs.CV]. 2015(4).
29. Szegedy C, Liu W, Jia Y, Sermanet P, Reed S. Going deeper with convolutions. arXiv:1409.4842v1.
2014; 9.
30. Maggiori E, Tarabalka Y, Charpiat G, Alliez P. High-Resolution Semantic Labeling with Convolutional
Neural Networks. arXiv:1611.01962. 2016;11.
31. Csurka G, Larlus D, Perronnin F. What is a good evaluation measure for semantic segmentation?
BMVC. 2013; 27:2013.
32. Mnih V. Machine Learning for Aerial Image Labeling. Toronto, Canada: University of Toronto; 2013.
33. Sharma A, Liu X, Yang X, Shi D. A patch-based convolutional neural network for remote sensing image
classification. Neural Networks. 2017; 95:19–28. https://doi.org/10.1016/j.neunet.2017.07.017 PMID:
28843092
Weed mapping based on UAV imagery
PLOS ONE | https://doi.org/10.1371/journal.pone.0196302 April 26, 2018 19 / 19