a friendly introduction to geographic information systems marc albrecht marc albrecht university of...
Post on 21-Dec-2015
219 views
TRANSCRIPT

A friendly introduction to A friendly introduction to Geographic Information Geographic Information
SystemsSystems
Marc AlbrechtMarc Albrecht
University of Nebraska at KearneyUniversity of Nebraska at Kearney
Department of BiologyDepartment of Biology

Context: Why GIS?Context: Why GIS? Many of the issues in our world have a Many of the issues in our world have a
criticalcritical spatial component!spatial component!– Land managementLand management– Property lines, easements, right of waysProperty lines, easements, right of ways– Data on land values, taxation, assessmentData on land values, taxation, assessment– Business site selection, advertisingBusiness site selection, advertising– Proximity of ‘our’ land to other facilities Proximity of ‘our’ land to other facilities
(pollution, hunting, municipal, federal, state)(pollution, hunting, municipal, federal, state) ““I don’t know what’s over that hill” is a common I don’t know what’s over that hill” is a common
problem. What is adjacent to the land we are problem. What is adjacent to the land we are using?using?

The Space on EarthThe Space on Earth
The Earth isThe Earth is finite!finite!– If not now, within our lifetimes there If not now, within our lifetimes there
may be may be no natural ecosystemsno natural ecosystems. . – Land managers, natural resource Land managers, natural resource
workers, and politicians are and will workers, and politicians are and will continue to make decisions about continue to make decisions about biological systemsbiological systems. .
– Good Good informationinformation and and toolstools are needed are needed to do this. to do this.

Enter GISEnter GIS
A computer-A computer-based tool for based tool for holding, holding, displaying, and displaying, and manipulating manipulating huge amounts of huge amounts of spatial data.spatial data.
Outline of PresentationsOutline of Presentations
““What is GIS?” PresentationWhat is GIS?” Presentation– Part I: Maps and MappingPart I: Maps and Mapping– Part II: Some GIS OperationsPart II: Some GIS Operations
““GIS Resources and Projects” GIS Resources and Projects” PresentationPresentation– Part III: Where do I get data?Part III: Where do I get data?– Part IV: Ongoing Programs, other softwarePart IV: Ongoing Programs, other software– Part V: Project Ideas and ExamplesPart V: Project Ideas and Examples

Part I: Map ConceptsPart I: Map Concepts
What is a map?What is a map?– What are some properties of maps?What are some properties of maps?– Vector vs. raster: two digital mapping Vector vs. raster: two digital mapping
methodsmethods Maps reflect the databases we createMaps reflect the databases we create Mapping the third dimension: Mapping the third dimension:
examples of 3-D mapsexamples of 3-D maps

Representing the World: Representing the World: ProjectionsProjections 3-D to 2-D (at first)3-D to 2-D (at first)
– Projections change a Projections change a round world into a flat round world into a flat one. one.
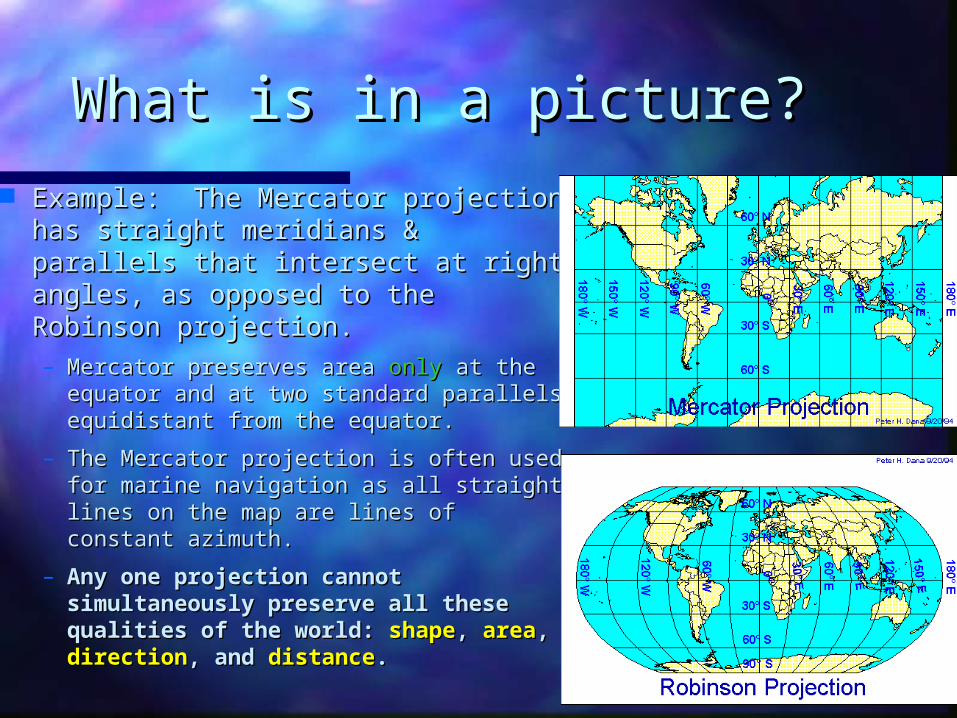
What is in a picture?What is in a picture? Example: The Mercator projection Example: The Mercator projection
has straight meridians & parallels has straight meridians & parallels that intersect at right angles, as that intersect at right angles, as opposed to the Robinson projection. opposed to the Robinson projection. – Mercator preserves area Mercator preserves area onlyonly at the at the
equator and at two standard parallels equator and at two standard parallels equidistant from the equator. equidistant from the equator.
– The Mercator projection is often used The Mercator projection is often used for marine navigation as all straight for marine navigation as all straight lines on the map are lines of constant lines on the map are lines of constant azimuth. azimuth.
– Any one projection cannot Any one projection cannot simultaneously preserve all these simultaneously preserve all these qualities of the world: qualities of the world: shapeshape, , areaarea, , directiondirection, and , and distancedistance..

Projections and Projections and MetadataMetadata There are dozens of types of projects, and about six that There are dozens of types of projects, and about six that
are commonly used.are commonly used. People choose a projection based on which qualities they People choose a projection based on which qualities they
most want to preserve in a map. Sites such as most want to preserve in a map. Sites such as Dr. Dana’s Dr. Dana’s and and National Geographic National Geographic discuss projections discuss projections in more detailin more detail
The point is that you need to know where your data The point is that you need to know where your data (maps) come from and information about it. This is (maps) come from and information about it. This is called called METADATAMETADATA – data about the data. Good – data about the data. Good metadatametadata includes who collected the data, when, to what accuracy, includes who collected the data, when, to what accuracy, how the data are projected, and the collector’s contact how the data are projected, and the collector’s contact information.information.
You should be a responsible GIS user and keep track of You should be a responsible GIS user and keep track of your metadata!your metadata!

The Projection ProblemThe Projection Problem When working with GIS systems you have to know about When working with GIS systems you have to know about
projections in general and what projection the different data projections in general and what projection the different data you are using are in. you are using are in. – This is a metadata issue again.This is a metadata issue again.– It is possible to transform data from one projection to another, but is It is possible to transform data from one projection to another, but is
easier – especially when starting out – to have the different data layers easier – especially when starting out – to have the different data layers in same projection when you obtain them! Agencies are generally in same projection when you obtain them! Agencies are generally helpful about doing this step for you if asked. helpful about doing this step for you if asked.
Another Problem are Datums – basically mathematical Another Problem are Datums – basically mathematical descriptions of the Earth’s size and shape. If either the descriptions of the Earth’s size and shape. If either the projection or the datums of your map layers are not identical:projection or the datums of your map layers are not identical:
YOUR MAP LAYERS WILL NOT LAY ON TOP OF EACH YOUR MAP LAYERS WILL NOT LAY ON TOP OF EACH OTHER, BUT RATHER BE SHIFTED INTO DIFFERENT OTHER, BUT RATHER BE SHIFTED INTO DIFFERENT AREAS!! AREAS!! This is embarrassing and frustrating.This is embarrassing and frustrating.

This is what happens when This is what happens when projections mix!projections mix!
Notice the Notice the boundary boundary lines do not lines do not line upline up
Points that Points that are placed on are placed on the wrong the wrong projection will projection will be misaligned be misaligned as well as well

Raster vs. Vector: types of Raster vs. Vector: types of GIS map representationGIS map representation
VectorVector vs. vs. RasterRaster Two basic ways that spatial data can be Two basic ways that spatial data can be
representedrepresented Raster:Raster:
– Data represented by pixels with Data represented by pixels with values, creating a gridvalues, creating a grid
– Allows certain types of operations not Allows certain types of operations not possible with vector datapossible with vector data
– Map algebra is possible with multiple Map algebra is possible with multiple data layers – creating index mapsdata layers – creating index maps
Vector: Vector: – Data stored as points, lines, and Data stored as points, lines, and
polygonspolygons– Uses less memory than raster formatUses less memory than raster format– Does not loose positional accuracyDoes not loose positional accuracy

How is all this done?How is all this done? GIS stores data in aGIS stores data in a
relational database relational database structurestructure (‘3-D (‘3-D spreadsheets’)spreadsheets’)– e.g. employee names linked e.g. employee names linked
to store number, store to store number, store number linked to shipment number linked to shipment arrivalarrival
– any data can be linked by a any data can be linked by a common attribute to any common attribute to any other data other data
Example shown here is a Example shown here is a list of counties (geographic list of counties (geographic data) by income code data) by income code (demographic data)(demographic data)

High End 3-D High End 3-D RepresentationRepresentation
Surfaces are made Surfaces are made from Triangular from Triangular Irregular Networks Irregular Networks (TIN) that interpolate (TIN) that interpolate 3-D surfaces from 2-D 3-D surfaces from 2-D contour values. contour values.
Uses: Uses: – Hydrology: surface and Hydrology: surface and
underground flowsunderground flows– Line-of-Sight analysisLine-of-Sight analysis– Pollution Plume trackingPollution Plume tracking– Customer analysisCustomer analysis– Soil erosion potentialSoil erosion potential

3-D Rendering Example3-D Rendering Example
Beaty, NV
USGS 7.5 Minute quad in 3-D
A 3-D rendering of the terrain
Elevation measurements can be easily converted into 3-D.
Such elevational data are collected regularly by federal and state agencies.
These data can be downloaded/ ordered at little or no cost.

How many data points are contained in this image? Thousands? More?How many data points are contained in this image? Thousands? More?– Even without statistical measurement (which can be done) the pattern of Even without statistical measurement (which can be done) the pattern of
pollution can be seen. Location and density of wells is also clear.pollution can be seen. Location and density of wells is also clear.– Line of sight analysis allows us to determine where to put a house or Line of sight analysis allows us to determine where to put a house or
power plant where it could or could not be seen from major roads. Notice power plant where it could or could not be seen from major roads. Notice the roads actually track up the hills on the right side of the image.the roads actually track up the hills on the right side of the image.

Part II. What can GIS Part II. What can GIS do?do?
Some general types of GIS operations are listed Some general types of GIS operations are listed on the next few slideson the next few slides– Many more are possible than are shown here and Many more are possible than are shown here and
more are being created every daymore are being created every day– Extensions and scripts created by users (Extensions and scripts created by users (
http://www.esri.com/arcscriptshttp://www.esri.com/arcscripts) ) – Third-party and government developers make Third-party and government developers make
software plug-ins for specific uses (eg. software plug-ins for specific uses (eg. EPA’s BASINS softwareEPA’s BASINS software))

1. Proximity Analysis1. Proximity Analysis Two or more data layers are overlaid GIS creates buffers around features on a particular layer This allows analyses such as flood zone delineation and
features near a route such as hotels along a bike route.

2. Query and Overlay 2. Query and Overlay AnalysesAnalyses
Query building is a data exploration operation– Example statement: ‘([acres] > 500 AND [age] > 55)’– This would highlight all land parcels of greater than 500 acres owned by
people older than 55 years old in a data set loaded into the GIS. Map algebra with raster data, in this type of operation
mathematical operations are done on each pixel of multiple data layers. This results in a new data layer that is calculated from all the input layers.

3. Spatial Analysis3. Spatial Analysis Raster data can also
be used to create surfaces
Other raster data uses: – Density analysis– Proximity analysis– Least-cost paths– Line-of-sight– Hydrology
analysis

Part II: Data ExamplesPart II: Data Examples Here is
Atlanta– Highways– Roads– Census
Tracts

Close up of downtown– Map contains data for each
street– Each address in the city can
be geocoded – that is its location estimated in a systematic way
– Length of each street segment - block
– Streets can be sorted by length, name, income, home value, race, age - all provided by the Census Bureau (TIGER)

Atlanta ExampleAtlanta Example Hypothetical population Hypothetical population
of opossums.of opossums.– Data can be sorted by Data can be sorted by
attribute, such as sex, attribute, such as sex, females are females are yellow in yellow in this examplethis example
– Hmmm, why are Hmmm, why are males found closer to males found closer to populated areas?populated areas?
– We do not know – We do not know – but but how else would we how else would we discover the pattern?discover the pattern?

Atlanta Same population now
reclassified by some other attribute.– a genetic marker?– age?, size?
Other operations: – I can make a chart of any
of the attributes.– I can compute density of
points to see where the animals are most clustered
– Measure distances between individual locations


Thanks for viewing this presentation. Please Thanks for viewing this presentation. Please emailemail me with any me with any comments or questions you have. comments or questions you have.
If you want to learn more about doing your own GIS projects, and If you want to learn more about doing your own GIS projects, and more capabilities of GIS, please view the presentation “GIS more capabilities of GIS, please view the presentation “GIS Resources and Projects” in this folder. Resources and Projects” in this folder.
A number of the images and figures in this presentation are reproduced A number of the images and figures in this presentation are reproduced with permission from the with permission from the ESRI websiteESRI website. Please visit there to learn more!. Please visit there to learn more!
Other images used with the permission as stated of Peter H. Dana, The Other images used with the permission as stated of Peter H. Dana, The Geographer's Craft Project, Department of Geography, The University of Geographer's Craft Project, Department of Geography, The University of Texas at Austin. All commercial rights reserved. Copyright 1995 Peter H. Texas at Austin. All commercial rights reserved. Copyright 1995 Peter H. Dana. Dana.