a finite element study on the effective width …etd.lib.metu.edu.tr/upload/12612180/index.pdf ·...
TRANSCRIPT

A FINITE ELEMENT STUDY ON THE EFFECTIVE WIDTH OF FLANGED SECTIONS
A THESIS SUBMITTED TO THE GRADUATE SCHOOL OF NATURAL AND APPLIED SCIENCES
OF MIDDLE EAST TECHNICAL UNIVERSITY
BY
SERTAÇ KÜÇÜKARSLAN
IN PARTIAL FULFILLMENT OF THE REQUIREMENTS FOR
THE DEGREE OF MASTER OF SCIENCE IN
CIVIL ENGINEERING
JULY 2010

ii
Approval of the thesis:
A FINITE ELEMENT STUDY ON THE EFFECTIVE WIDTH OF FLANGED SECTIONS
submitted by SERTAÇ KÜÇÜKARSLAN in partial fulfillment of the requirements for the degree of Master of Science in Civil Engineering Department, Middle East Technical University by,
Prof. Dr. Canan Özgen _____________________ Dean, Graduate School of Natural and Applied Sciences
Prof. Dr. Güney Özcebe _____________________ Head of Department, Civil Engineering
Prof. Dr. Mehmet Utku _____________________ Supervisor, Civil Engineering Dept., METU Examining Committee Members:
Prof. Dr. Sinan Altın Civil Engineering Dept., Gazi University Prof. Dr. Mehmet Utku Civil Engineering Dept., METU
Assoc. Prof. Dr. Uğur Polat Civil Engineering Dept., METU Asst. Prof. Dr. Ayşegül Askan Gündoğan Civil Engineering Dept., METU Asst. Prof. Dr. Afşin Sarıtaş Civil Engineering Dept., METU
Date: 07.07.2010

iii
I hereby declare that all information in this document has been obtained and presented in accordance with academic rules and ethical conduct. I also declare that, as required by these rules and conduct, I have fully cited and referenced all material and results that are not original to this work.
Name, Last name : Sertaç Küçükarslan
Signature :

iv
ABSTRACT
A FINITE ELEMENT STUDY
ON THE EFFECTIVE WIDTH OF FLANGED SECTIONS
Küçükarslan, Sertaç
M.Sc., Department of Civil Engineering
Supervisor: Prof. Dr. Mehmet Utku
July 2010, 63 pages
Most of the reinforced concrete systems are monolithic. During construction,
concrete from the bottom of the deepest beam to the top of slab, is placed at
once. Therefore the slab serves as the top flange of the beams. Such a beam is
referred to as T-beam. In a floor system made of T-beams, the compressive
stress is a maximum over the web, dropping between the webs. The
distribution of compressive stress on the flange depends on the relative
dimensions of the cross section, span length, support and loading conditions.
For simplification, the varying distribution of compressive stress can be
replaced by an equivalent uniform distribution. This gives us an effective
flange width, which is smaller than the real flange width. In various codes
there are recommendations for effective flange width formulas. But these
formulas are expressed only in terms of span length or flange and web
thicknesses and ignore the other important variables.

v
In this thesis, three-dimensional finite element analysis has been carried out on
continuous T-beams under different loading conditions to assess the effective
flange width based on displacement criterion. The formulation is based on a
combination of the elementary bending theory and the finite element method,
accommodating partial interaction in between. The beam spacing, beam span
length, total depth of the beam, the web and the flange thicknesses are
considered as independent variables. Depending on the type of loading, the
numerical value of the moment of inertia of the transformed beam cross-
section and hence the effective flange width are calculated. The input data and
the finite element displacement results are then used in a nonlinear regression
analysis and two explicit design formulas for effective flange width have been
derived. Comparisons are made between the proposed formulas and the ACI,
Eurocode, TS-500 and BS-8110 code recommendations.
Keywords: Flange, Building Codes, T-beam, Compressive Stress, Effective
Flange Width, Finite Element Analysis, Nonlinear Regression Analysis.

vi
ÖZ
TABLALI KESİTLERİN ETKİLİ TABLA GENİŞLİĞİNİN SONLU
ELEMANLAR YÖNTEMİ İLE ANALİZİ
Küçükarslan, Sertaç
Yüksek Lisans, İnşaat Mühendisliği Bölümü
Tez Yöneticisi: Prof. Dr. Mehmet Utku
Temmuz 2010, 63 sayfa
Çoğu betonarme sistemler monolitikdir. İnşa sırasında beton en derindeki
kirişin altından, döşemenin üstüne kadar bir kerede dökülür. Bu yüzden
döşeme, kirişlerin üst tablası gibi çalışır. Böyle kirişlere T-kiriş denir. T-
kirişlerden oluşmuş döşeme sistemlerinde basınç gerilimi kiriş gövdesi
üzerinde maksimum olup, gövde aralarında düşer. Tabla üzerindeki basınç
gerilimi dağılımı kesit boyutlarına, kiriş açıklığına, mesnet ve yükleme
koşullarına bağlıdır. Basitleştirmek için değişen basınç gerilimi dağılımı
eşdeğer düzgün dağılımla yer değiştirilebilir. Bu bize gerçek tabla
genişliğinden daha küçük olan etkili tabla genişliğini verir. Çeşitli
yönetmeliklerde etkili tabla genişliği formülleri için öneriler mevcuttur. Ancak
bu formüller diğer önemli değişkenler ihmal edilerek, sadece kiriş açıklığı
veya gövde ve tabla kalınlıkları cinsinden ifade edilmişlerdir.
Bu çalışmada, deplasmana dayalı etkili tabla genişliğinin belirlenmesi için
sürekli T-kirişlerin üç boyutlu sonlu elemanlar analizi gerçekleştirilmiştir.
Formulasyon, basit eğilme teorisi ile sonlu elemanlar methodunun kısmi

vii
etkileşimine dayanmaktadır. Kirişler arasındaki uzaklık, kiriş açıklığı, kiriş
derinliği, tabla ve gövde kalınlığı bağımsız değişkenler olarak alınmıştır.
Sonlu elemanlar analizinden elde edilen desplasman değerleri kullanılarak,
belirtilen değişkenlerin çeşitli değerleri için etkili tabla genişlikleri
hesaplanmıştır. Yükleme durumuna bağlı olarak, dönüştürülmüş kiriş kesitinin
atalet momenti ve dolayısıyla etkili tabla genişliği hesaplanmıştır. Veriler ve
sonlu eleman deplasman sonuçları kullanılarak, doğrusal olmayan regresyon
analizi yapılmış ve etkili tabla genişliği için açık tasarım formülleri
türetilmiştir. Bu formüller ile ACI, Eurocode, TS-500 ve BS-8110
yönetmeliklerinin önerileri karşılaştırılmıştır.
Anahtar Kelimeler: Tabla, Yapı Yönetmelikleri, T-kiriş, Basınç Gerilimi,
Etkili Tabla Genişliği, Sonlu Elemanlar Analizi, Doğrusal Olmayan
Regresyon Analizi.

viii
To My Wife

ix
ACKNOWLEDGEMENTS
The author wishes to express his deepest appreciation to his supervisor Prof.
Dr. Mehmet UTKU for his guidance, criticism, encouragements and helpful
advice throughout the research.
The author would also like to thank Prof. Dr. Semih YÜCEMEN for his
suggestions and comments.
The author offers sincere thanks to his wife for her unshakable faith in him,
her patience and confidence in him. She receives many indebted thanks.

x
TABLE OF CONTENTS
ABSTRACT .............................................................................................................. IV
ÖZ .......................................................................................................................... VII
ACKNOWLEDGEMENTS ..................................................................................... IX
TABLE OF CONTENTS .......................................................................................... X
LIST OF TABLES .............................................................................................. XIIII
LIST OF FIGURES .............................................................................................. XIII
LIST OF SYMBOLS ............................................................................................. XV
CHAPTERS
1. INTRODUCTION .................................................................................................. 1
1.1. PRELIMINARY REMARKS .................................................................................... 1
1.2. SURVEY OF PREVIOUS STUDIES ........................................................................... 5
1.3. SCOPE OF THESIS ................................................................................................ 5
2. EFFECTIVE FLANGE WIDTH AND CODE RECOMMENDATIONS ........ 7
2.1. CONCEPT OF EFFECTIVE FLANGE WIDTH ............................................................. 7
2.2. CODE RECOMMENDATIONS ................................................................................. 9
2.2.1. ACI BUILDING CODE ................................................................................... 9
2.2.2. EUROCODE ............................................................................................... 11
2.2.3. TS-500 ..................................................................................................... 13
2.2.4. BRITISH STANDARDS BS-8110 .................................................................... 14
3. FORMULATION OF THE PROBLEM ............................................................ 15
3.1. EFFECTIVE FLANGE WIDTH BASED ON DEFLECTION CRITERION ........................ 15
3.2. POINT LOAD AT MIDSPAN ................................................................................ 15
3.3. UNIFORMLY DISTRIBUTED LOAD ON FLANGE ................................................. 19
3.4. TRANSFORMED T-SECTION ............................................................................. 22

xi
4. FINITE ELEMENT ANALYSIS ........................................................................ 26
4.1. THE SOLID ELEMENT ....................................................................................... 26
4.2. PARAMETERS INFLUENCING THE EFFECTIVE FLANGE WIDTH ........................ 28
4.3. FINITE ELEMENT MODEL ................................................................................. 29
4.4. NUMERICAL STUDIES ...................................................................................... 36
5. MULTIPLE NONLINEAR REGRESSION ANALYSIS ................................ 46
5.1. MULTIPLE NONLINEAR REGRESSION .............................................................. 46
5.2. NONLINEAR REGRESSION MODEL ................................................................... 47
5.3. COMPARISON WITH THE CODE EQUATIONS .................................................... 50
6. CONCLUSIONS .................................................................................................. 60
REFERENCES ......................................................................................................... 62
xii
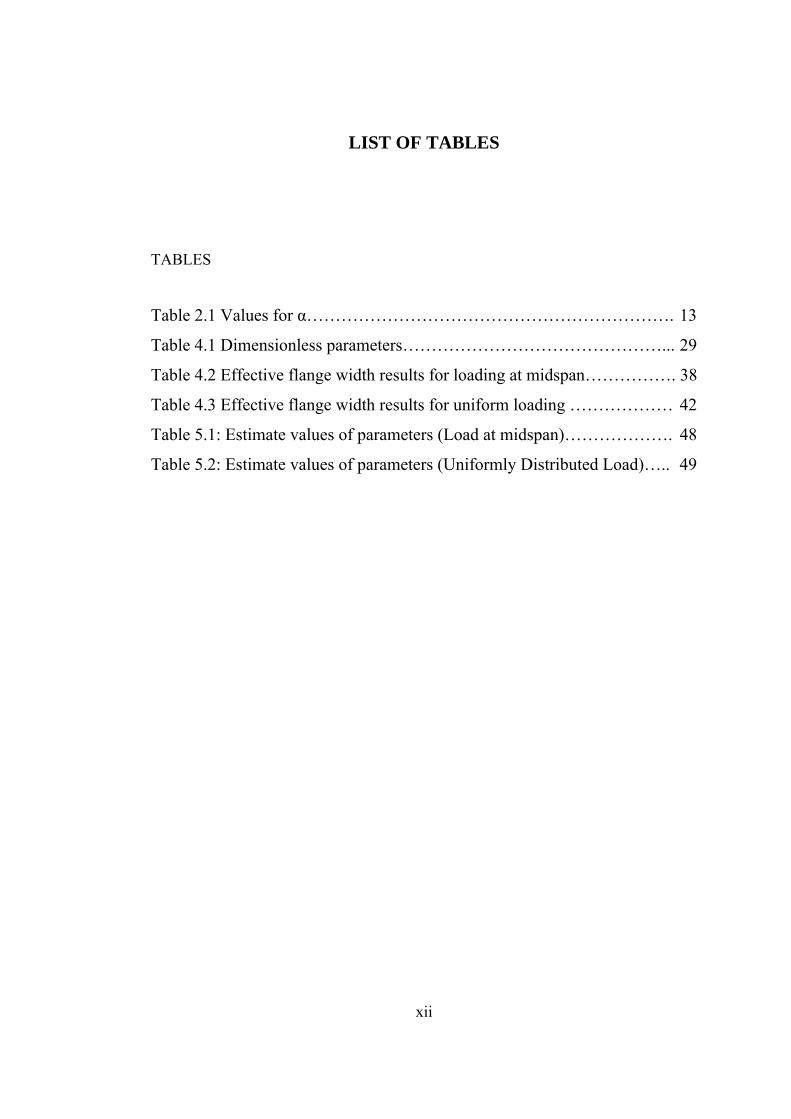
LIST OF TABLES
TABLES
Table 2.1 Values for α………………………………………………………. 13
Table 4.1 Dimensionless parameters………………………………………... 29
Table 4.2 Effective flange width results for loading at midspan……………. 38
Table 4.3 Effective flange width results for uniform loading ……………… 42
Table 5.1: Estimate values of parameters (Load at midspan)………………. 48
Table 5.2: Estimate values of parameters (Uniformly Distributed Load)….. 49

xiii
LIST OF FIGURES
FIGURES
Figure 1.1: T-beams in a one-way slab floor………………………………….2
Figure 1.2: Typical cross-section and dimensions of a T-beam……...………. 2
Figure 1.3: Forces on a T-beam……………………………………………….3
Figure 1.4: Distribution of maximum flexural compressive stresses………....4
Figure 1.5: Uniform stress distribution and “effective flange width”……….. .4
Figure 2.1: Compressive stress block of T-section……………………………8
Figure 2.2: Elevation showing definition of l0 for calculation of flange
width …………………………………………………………… 11
Figure 2.3: Section showing effective flange width parameters …………….12
Figure 2.4: Definition of dimensions in T-beams…………………………... 14
Figure 3.1: Load at midspan…………...……………………………………. 16
Figure 3.2: Shear, moment, and deflection diagrams for load at midspan… 18
Figure 3.3: Uniformly distributed load…………………………………….... 19
Figure 3.4: Shear, moment, and deflection diagrams for uniform loading…. 21
Figure 3.5: Neutral axis passing through the web…………………………… 22
Figure 3.6a: Part A1 of the cross-section…………………………….………. 23
Figure 3.6b: Part A2 of the cross-section…………………………………….. 23
Figure 3.6c: Part A3 of the cross-section…………………………………….. 23
Figure 3.7: Neutral axis passing through the flange…………………………. 25
Figure 4.1a: Three-dimensional state of stress………………………………. 26
Figure 4.1b: Eight-node solid element…………………………………….... 26
Figure 4.1c: Degrees of freedom at a typical node (i= 1, 2... 8)…………….. 26

xiv
Figure 4.2: Eight-node isoparametric solid element………………………… 27
Figure 4.3: Dimensions of a T-beam………………………………………… 28
Figure 4.4: Longitudinal view of the finite element model………………….. 30
Figure 4.5a: Cross section of the finite element model……………………... 31
Figure 4.5b: Three dimensional finite element model……………………… 31
Figure 4.6: Flexural stress distribution for uniform loading………………... 32
Figure 4.7: Deformed shape under uniform loading………………………... 33
Figure 4.8: Flexural stress distribution for loading at midspan……………... 34
Figure 4.9: Deformed shape under loading at midspan……………………...35
Figure 5.1: Comparison of design formulas with the code equations for
load at midspan ……………………………………………...... 50
Figure 5.2: “S/L” versus “be/S” for Case1, Case2 and Case3……………..…52
Figure 5.3: Effective flange width based on stress criterion and deflection
consideration (Point load) ……………………………………... 53
Figure 5.4: Comparison of design formulas with the code equations for
uniformly distributed load …..…………………………….. …... 55
Figure 5.5: “S/L” versus “be/S” for Case1, Case2 and Case3………………. 57
Figure 5.6: Effective flange width based on stress criterion and deflection
consideration (Uniform loading) ………………………………. 58

xv
LIST OF SYMBOLS
a : Coefficient for determining zero moment distance of beam span.
be ,beff : Effective flange width
h : Flange thickness of the beam
S : Beam spacing between two adjacent beams
D : Beam total depth
L : Beam span length
bw : Web thickness of the beam
σymax : Maximum flexural stress
l0 , lz ,lp : Span length between two zero moment points
v : Analytic displacement value
vFE : Displacement value based on finite element analysis
E : Modulus of elasticity
I : Moment of inertia of the beam
f : A function of the covariate vector
Yi : Response
ε : Random error

1
CHAPTER 1
INTRODUCTION
1.1. Preliminary Remarks
Reinforced concrete structural systems such as floors and roofs are almost
monolithic, except precast systems. In a one-way beam-and-slab floor
system, the slab is assumed to carry the loads in the direction perpendicular
to the supporting beams. Under different service loading types, beams under
slabs will have negative moment at support regions whereas they will have
positive moment along unsupported span zone. This positive internal
moment will cause compression in the upper part of the beam. Due to
monolithic property of such systems where beam stirrups and top reinforcing
bars of beams extend up into the slab, monolithically placed part of the slab
and supporting beam will interact as a single unit in resisting the flexural
compressive stresses caused by the positive moment. This results in a T-
shaped beam cross section rather than a rectangular beam. Such a beam is
referred to as a T-beam. The slab forms the beam flange while the part of the
beam projecting below the slab forms the web. These details are described in
such texts as Nilson and Winter (1991), Ersoy (1994) and MacGregor
(2005). The typical monolithic structural system is shown in Figure 1.1 and a
cross-section passing through such a T-beam defining the parameters is
shown in Figure 1.2.

2
Figure 1.1 T-beams in a one-way slab floor (From MacGregor (2005))
Figure 1.2 Typical cross-section and dimensions of a T-beam
in this directionslab carries load
T- beams

3
Figure 1.3 Forces on a T-beam
Figure 1.3 shows the forces acting on the flange of a simply supported
T-beam. There are no compressive stresses in the flange at the supports
because of zero moment value. However, when the midspan section is
examined, the flexural compressive stresses will be observed to be
distributed over the full width. This increment in flange from zero stress to
full compressive stress causes horizontal shear stresses on the web-flange
interface. As a result, there is what is called a “shear-lag” effect within the
beam. This shear-lag effect causes higher stresses in the flange closest to the
web and lower stresses in the flange away from the web as shown in Figure
1.3.
For a series of parallel beams, the flexural compressive stress distribution in
the slab at a section of maximum positive moment is shown in Figure 1.4.
The compressive stress reaches its maximum value over the web and
decreases between the webs.
compressionFlexural
Transversetension
flowShear
Support
Midspan
Transversecompression

4
Magnitude of compressive stress in flange
Figure 1.4 Distribution of maximum flexural compressive stresses
(From MacGregor (2005))
Considering the actual stress distribution in a T-beam, the exact solution of
T-beam problems is too time consuming for practical engineering
calculations. Therefore, the familiar concept of effective width offers
remarkable advantages in design. The actual stress distribution is replaced by
a uniform linear stress distribution which provides the same compression.
The width of this uniform stress block in the flange is called as “effective
flange width”, be. The stress block for the effective width concept is
illustrated in Figure 1.5.
Figure 1.5 Uniform stress distribution and “effective flange width”
Sbe

5
1.2. Survey of Previous Studies
The effective width of wide beam flanges was investigated by Theodore von
Karman which is discussed in Timoshenko’s (1970) “Theory of Elasticity”
book. The problem has been analyzed by minimum- energy principle using
theory of elasticity.
In earlier attempts, folded plate theory or its equivalent was used to assess
the effective width. The analysis were based either on stress criterion or
deflection consideration. For example, Brendel (1964) used stress criterion
in his analysis to determine the effective width. By contrast, the analysis
done by Fraser and Hall (1973) was based on deflection considerations. A
similar strategy was also used by Pecknold (1975) to assess the slab effective
width for equivalent frame analysis.
Later on, Loo and Sutandi (1986) used a finite element analysis for simply
supported T-beams utilizing solid elements. From the resulting data on the
effective width, they derived empirical design formulas using statistical
means.
In a quite recent investigation, a similar approach has been used by Utku and
Aygar (2002) who extended this to derive design formulas for the effective
flange width of continuous T-beams using a three-dimensional finite element
analysis.
1.3. Scope of Thesis
In the present study, a new formulation is proposed for the evaluation of the
effective flange width formulas for continuous T-beams. The analysis is

6
based on a deflection criterion. The codes of various countries have certain
limitations and may be considered as approximate, since they are expressed
only in terms of span length or flange and web thicknesses, but they ignore
the loading conditions and other significant parameters. In this study, a
three-dimensional finite element analysis is carried out on continuous T-
beams. The beam spacing, span length, overall depth, web thickness and
flange thickness are considered as independent variables in the analysis. The
derivation of the effective flange width employs usual elastic beam theory
and the displacement results of the finite element solution. The effective
flange width for each beam is calculated analytically and design formulas are
derived for the corresponding two different loading conditions by using
nonlinear regression analysis. The proposed formulas are compared with the
available code recommendations and presented in graphical format.
The study is organized as follows. In Chapter 1, an introduction to the thesis
and a limited survey of previous work done on the subject is presented. In
Chapter 2 the concept of effective flange width and theoretical basis for
determination of effective width are given. TS-500, Eurocode 2, ACI and
BS-8110 code recommendations are also presented in this chapter. The
proposed formulation is then presented in Chapter 3. Analytic solutions are
given for deflection, shear and moments of continuous beams for two
different load cases. Finite element analysis for two different loading
conditions is also given in Chapter 3 and Chapter 4. In Chapter 5, empirical
design formulas are derived using nonlinear regression analysis. The new
formulation is compared with the code recommendations. Finally, Chapter 6
discusses the results and includes conclusions and recommendations.

7
CHAPTER 2
EFFECTIVE FLANGE WIDTH
AND CODE RECOMMENDATIONS
2.1. Concept of Effective Flange Width
Considering the number of factors affecting the actual stress distribution in a
T-beam such as the type of loading (uniform, concentrated), the type of
supports, the spacing of the beams, the dimensions of the cross section, the
T-beam design is a rather complex problem. Therefore the familiar concept
of “effective flange width” has been accepted by the profession for many
decades. Effective flange width offers remarkable advantages; it enables the
designer to apply simple bending formulas of rectangular sections to T-
beams. Under the assumption of a straight neutral axis and the
proportionality of all stresses to the distance from this axis, the effective
width of the flanges can be defined. Simple bending formulas can now be
used to furnish the actual extreme fiber stress σymax of the concrete at the top
of the section and the actual total compressive force. The stress block for
effective width concept is indicted in Figure 2.1.
Because of simplicity, its use is still being recommended in all known codes
of practice. Three of them are going to be presented in the following
sections. The code equations can only be very approximate as they are

8
expressed merely in terms of span length or flange and web thicknesses, but
they ignore other significant variables mentioned above.
Figure 2.1 Compressive stress block of T-section (From Brendel (1964))
real neutralaxis
ideal neutralaxis
bw
stress envelopestress volume or
ideal
heb
S
real

9
2.2 Code Recommendations
2.2.1. ACI Building Code
T-Beam construction:
This section contains provisions identical to those of previous ACI Building
Codes for limiting dimensions related to stiffness and flexural calculations.
Special provisions related to T-beams and other flanged members are stated
in part 11.6.1.of the code with regard to torsion.
• In T-beam construction, the flange and web shall be built integrally or
otherwise effectively bonded together.
• Width of slab effective as a T-beam flange shall not exceed one-quarter
of the span length of the beam, and the effective overhanging flange
width on each side of the web shall not exceed:
(a) eight times the slab thickness, and
(b) one-half the clear distance to the next web.
• For beams with a slab on one side only, the effective overhanging flange
width shall not exceed:
(a) one-twelfth the span length of the beam,
(b) six times the slab thickness, and
(c) one-half the clear distance to the next web.
• Isolated beams, in which the T-shape is used to provide a flange for
additional compression area, shall have a flange thickness not less than
one-half the width of web and an effective flange width not more than
four times the width of web.
• Where primary flexural reinforcement in a slab that is considered as a T-
beam flange (excluding joist construction) is parallel to the beam,

10
reinforcement perpendicular to the beam shall be provided in the top of
the slab in accordance with the following:
• Transverse reinforcement shall be designed to carry the factored
load on the overhanging slab width assumed to act as cantilever.
• For isolated beams, the full width of overhanging flange shall be
iiiiiiiconsidered. For other T-beams, only the effective overhanging slab
width needs to be considered.
• Transverse reinforcement shall be spaced not farther apart than five
times the slab thickness, or 18 in (45.7 cm).

11
2.2.2. Eurocode
Effective Flange Width:
• The effective flange width of a flange, beff, should be based on the
distance, l0, between points of zero moments as shown in Figure 2.2 and
defined in Figure 2.3.
2,1, effeffweff bbbb ++= (2.1)
where
)1.02.0( 011, lbbeff += but 02.0 l≤ and 1b≤ (2.2)
=2,effb to be calculated in a similar manner to 1,effb but 2b should be
substituted for 2b in the above
Figure 2.2 Elevation showing definition of l0 for calculation of flange
width
• The distance lo between points of zero moment may be obtained from
Figure 2.2 for typical cases.

12
Figure 2.3 Section showing effective flange width parameters

13
2.2.3. TS 500
In dimensioning the flanged sections, the flange width, which is required to
calculate the necessary moment of inertia for structural analysis and in
finding the deflections must be calculated by using the equations below,
referring to Figure 2.4.
In symmetrical sections:
In nonsymmetrical sections:
On the other hand, the overhanging flange width on each side of the web
shall not exceed six times the flange thickness and one-half the clear distance
to the next web (≤ 6hf or 1/2an). In equations (2.3) and (2.4), lp is the distance
between the points of zero moments and l is the span length (lp= αl). For
analysis, when a great accuracy is not required, the following values for α
can be used.
Table 2.1 Values for α
Simply supported beams α = 1.0
Continuous beams (edge span) α = 0.8
Continuous beams (middle span) α = 0.6
Cantilever beams α = 1.5
pw lbb51
+= (2.3)
pw lbb101
+= (2.4)

14
Figure 2.4 Definition of dimensions in T-beams
2.2.4. British Standards BS-8110
In the absence of any more accurate determination effective flange width
should be taken as:
a) for T-beams: web width +lz/5 or actual flange width if less;
b) for L-beams: web width + lz /10 or actual flange width if less;
where
lz is the distance between points of zero moment (which, for a continuous
beam, may be taken as 0.7 times the effective span).
b
wb wbna
1b
bf
h

15
CHAPTER 3
FORMULATION OF THE PROBLEM
3.1 Effective Flange Width Based on Deflection Criterion
In this study, the effective flange width of T-beams is investigated based on
displacement criterion. The derivation of effective width employs usual
elastic beam theory and matching the equation of the elastic curve with the
beam deflections obtained from finite element analysis.
As mentioned in Chapter 1, two types of loading are considered. As the first
case, the beam is exposed to point loads at midspan. Uniformly distributed
load on the flange is the second load case. Analytical (Closed Form)
solutions for both cases are given in the following sections.
3.2 Point Load at Midspan
In this type of loading, point loads are applied at midpoint of each span as
shown in Figure 3.1.

16
Figure 3.1 Load at midspan
The differential equation of the elastic curve of the beam is obtained by
direct integration. Due to symmetry, only the left span is considered in the
calculations. For the beam considered, the bending moment equations for the
intervals 0 ≤ x ≤ L/2 and L/2 ≤ x ≤ L are substituted into the differential
equation of the elastic curve. The two differential equations are integrated
twice to obtain the equations of the elastic curve for each interval. These
equations contain four constants of integration which are evaluated by using
the boundary conditions
0)()0( 21 == Lvv
and the continuity conditions
,
)2/()2/( 21
dxLdv
dxLdv
= )2/()2/( 21 LvLv =
where v1 is the deflection for 0 ≤ x ≤ L/2 and v2 is the deflection for L/2 ≤ x
≤ L. Shear, moment, and deflection diagrams for this beam are shown in
Figure 3.2.

17
The elastic curve for interval 0 ≤ x ≤ L/2 becomes
)35(
96)( 23 xLx
EIPxv −= (3.1a)
For L/2 ≤ x ≤ L:
⎩⎨⎧
⎭⎬⎫−−−= xLLxx
EIPxv 233 3)
2(165
96)( (3.1b)
The point of maximum deflection is at x = L / √5, which follows from setting
the expression for the slope equal to zero. The deflection at this point is
EIPLv
548
3
max= (3.2)
For the point load case, the maximum flexural stress occurs at the loading
points. The deflection at applied load P, which will be used later for the
effective width calculations, is
EIPLLv
7687)2/(
3
−= (3.3)

18
(Shear Diagram)
(Moment Diagram)
(Deformed Shape)
Figure 3.2 Shear, moment, and deflection diagrams for load at midspan

19
3.3 Uniformly Distributed Load on Flange
As a second load case, the uniformly loaded continuous beam shown in
Figure 3.3 is considered. The beam supports a uniform load of w per unit
length which results from a uniform pressure p applied on the flange.
Figure 3.3 Uniformly distributed load
The length of each span is L, and because of symmetry, the solution is
obtained by considering the deflection for either span. Following similar
steps as in the point load case, shear, moment, and deflection diagrams
appear as shown in Figure 3.4.
The elastic curve for interval 0 ≤ x ≤ L becomes
)23(48
)( 323 xLxLEI
wxxv +−−= (3.4)
The largest deflection occurs at x = 0.422 L, which follows from setting the
expression for the slope equal to zero. The deflection at this point is

20
EIwLxv
43
max10416.5 −−= (3.5)
For the uniformly distributed load, the maximum compressive stress occurs
at x = 3L / 8 from the left support. The deflection at x = 3L / 8, which will be
used later for the effective width calculations, is
EIwLxLv
43103406.5)8/3( −−= (3.6)

21
(Shear Diagram)
(Moment Diagram)
(Deformed Shape)
Figure 3.4 Shear, moment, and deflection diagrams for uniform loading

22
3.4 Transformed T-Section
An interior beam of a beam-and-slab floor system develops positive
moments at midspan and negative moments over the support. At midspan,
the compression zone is in the flange. For the computation of effective width
two cases are possible:
1) the neutral axis may shift down into the web, giving a T-shaped
compression zone, and
2) the neutral axis is in the flange and hence, the compression zone is
rectangular.
For the first case where the neutral axis passes through the web
(see Figure 3.5) , the calculation is as follows.
Figure 3.5 Neutral axis passing through the web
The beam cross-section is examined in three parts. The first part is a
rectangular area defined by the flange width be and flange thickness h. The
second part is that portion of the web with height x and web thickness bw as
shown in Figure 3.6b. Finally; the third part consists of the web below the
Neutral axis

23
neutral axis as illustrated in Figure 3.6c. Area moments of these three parts
are calculated separately and place of centerline is determined.
Figure 3.6a Part A1 of the cross-section
Figure 3.6b Part A2 of the cross-section
Figure 3.6c Part A3 of the cross-section
The area of each component part and the moments of the component areas
with respect to the neutral axis are then computed.
Neutral axis
Neutral axis
Neutral axis

24
ebhA ×=1 )2
(1 zhbhM eA +××=
zbA w ×=2 )2
(2zzbM wA ××=
)(3 zdbA w −×= 2
)( 2
3zdbM wA
−×=
For the third part (D-h) term is replaced by d in order to simplify the
expressions. Equating the first moment of the area on one side of the neutral
axis to the first moment of the area on the other side,
321 AAA MMM =+ (3.7)
2)(
2)
2(
22 zdbzbzhbh wwe−
×=⎟⎟⎠
⎞⎜⎜⎝
⎛×++××
It has to be noted that z in the above formula represents the distance between
the neutral axis and the bottom of the flange. By solving Eq.(3.7) with flange
thickness h equal to 12 cm, the distance z is obtained as
dbb
bdb
zwe
ew
×+×
×−×
=12
722
2
(3.8)
It is observed that the distance z given by Eq. (3.8) depends on the effective
width be which is an unknown quantity at the moment. Finally, the moment
of inertia for the transformed T-section can be written in terms of z and be as
))((3
)3
( 332
2 zdzbhhzzbhI w
ebeam −+×+++××= (3.9)

25
For the second case where the neutral axis is passing through the flange (see
Figure 3.7), the steps for the calculation of the neutral axis and the moment
of inertia are same as the first case where centerline was within the web.
Figure 3.7 Neutral axis passing through the flange
After the necessary calculations, the following expressions are obtained for
the position of the neutral axis, and the moment of inertia.
dbb
dbb
zwe
we
×+×
×−×
=12
272
2
(3.10)
)3
())((3
2233 dzdzdbzzh
bI w
ebeam ++××++−×= (3.11)
The effective flange width be is calculated by equating the above expression
for the moment of inertia to the numerical value computed from finite
element displacement results as explained in Section 4.4 on “Numerical
Studies”.
Neutral axis

26
(a)
σx
τzx
zσσy
τyz
xyτ
zσ
(b) (c)
x,u
z,w
y,v
1
5
4
3
76
28
w
i
i
ui
iv
CHAPTER 4
FINITE ELEMENT ANALYSIS
4.1 The Solid Element
The finite element method is the most appropriate numerical tool for the
displacement and stress analysis for structural systems. In the finite element
models adopted in this study, the solid elements are used to model the beam-
and-slab floor system. The software SAP2000 v.11.0, which is one of the
widely used finite element analysis programs, is used for the three-
dimensional modeling and displacement analysis. A 2 x 2 x 2 numerical
integration scheme is used for the solid element. Stresses in the element local
coordinate system are evaluated at the integration points and extrapolated to
the joints of the element. Six stress components are calculated as nodal
average stresses, the three normal stresses and the three shear stresses.
Figure 4.1 (a) Three-dimensional state of stress. (b) Eight-node solid
element. (c) Degrees of freedom at a typical node (i= 1, 2... 8)

27
x
z
yr
t
s
1
2 3
45
6
7
8
Cartesian Coordinate System Local Coordinate System
The eight-node element shown in Figure 4.1 has eight nodes located at the
corners and has three translational degrees of freedom at each node. In terms
of generalized coordinates βi , the displacement field can be written as
u = β1+β2 x+β3 y+β4 z+β5 xy+β6 yz+β7 zx+β8 xyz
v = β9+β10 x+β11 y+β12 z+β13 xy+β14 yz+β15 zx+β16 xyz (4.1)
w = β17+β18 x+β19 y+β20 z+β21 xy+β22 yz+β23 zx+β24 xyz
The eight-node element can be of arbitrary shape when it is formulated as an
isoparametric element (Cook et. al. 1989). The coordinates used are shown
in Figure 4.2.
Figure 4.2 Eight-node isoparametric solid element
The displacement expressions can then be written as
u=Σ Ni ui v=Σ Ni vi w=Σ Ni wi (4.2)
where the index i runs from 1 to 8 in each summation. The shape functions
defining the geometry and variation of displacements are given by,
where r, s and t are local (natural) coordinates and ri , si , ti , are the values of
local coordinates for node i.
i=1, 2,…,8 ( )( )( )iiii tt1ss1rr1
81N +++=

28
4.2 Parameters Influencing the Effective Flange Width
It is known from the available literature on T-beams that the effective width
be is affected by sectional dimensions and by the beam span L for both
uniformly distributed and concentrated load. In the following finite element
analysis, the effect of various parameters on the effective flange width is
studied. These parameters include the beam spacing S, beam span length L,
total depth of the beam D, web thickness bw, and flange thickness h, as
shown in Figure 4.3.
Figure 4.3 Dimensions of a T-beam
These parameters are independent variables that influence the effective
flange width be. In addition to the above parameters, the effect of loading
type is also considered as another parameter for the investigation of effective
flange width. Uniformly distributed load and concentrated load at midspan
are the two loading types applied separately on the three dimensional finite
element models.

29
In order to investigate the dependency of effective flange width on these
parameters, they are varied in a systematic way using a combination of the
ratios of the beam parameters. Specifically, the ratios of S/L, L/D, bw/D and
h/D are defined in groups of three to provide data for deriving the design
formulas. In finite element analysis, the flange thickness h is considered as
constant for all T-beams. The flange thickness is assumed to be 120 mm, and
the dimensional parameters are varied as shown in Table 4.1.
Table 4.1 Dimensionless parameters
S/L 0.20 0.25 0.30
L/D 10 15 20
bw/D 0.65 0.70 0.75
h/D 0.20 0.30 0.40
These require 81 T-beams for each of the three loading conditions defined in
Figure 3.1 and Figure 3.3. This results in a total number of 162 finite
element analyses.
4.3 Finite Element Model
This study is performed for a two-span continuous T-beam. Due to double
symmetry only a quarter of the beam over a span length L is modeled by
using solid elements. Boundary conditions are specified taking into
consideration symmetry and the simple-support conditions. The symmetry
boundary conditions are applied on two planes. The vertical yz-plane is a
plane of symmetry. For nodes of the finite element mesh on this plane, the
displacement degree of freedom in x-direction is fixed. Similarly, the
transverse xz-plane at the middle support is another plane of symmetry. For

30
all nodes on this plane, on the other hand, the displacement degree of
freedom in y-direction is fixed.
The finite element beam model is meshed into nearly equal sized elements
which have aspect ratios near unity. This requirement results in a finite
element mesh in which the beam is divided into 64 equal segments along the
beam span. On a transverse section, the flange is divided into 3 segments in
the vertical direction. The symmetrical half of the web below the flange is
divided into 8 equal segments in the vertical dimension. For each transverse
section, there are 27 elements in the flange and 24 elements in the web.
These result in a total of 3264 elements and 4680 nodal points.
In the finite element analysis of the T-beam, the modulus of elasticity for
concrete is taken as 30 GPa. The Poisson’s ratio is assumed to be 0.2 and the
total load intensity is taken as 20 kN/m2. The self weight of the beam is
neglected in the analysis. The distributed load is applied as force per unit
area on the flange for the uniformly distributed load case. For the point load
case, concentrated loads are applied at the appropriate nodes. A longitudinal
view of the model is illustrated in Figure 4.4. A cross section of the model
and a typical three dimensional finite element mesh used for the analysis are
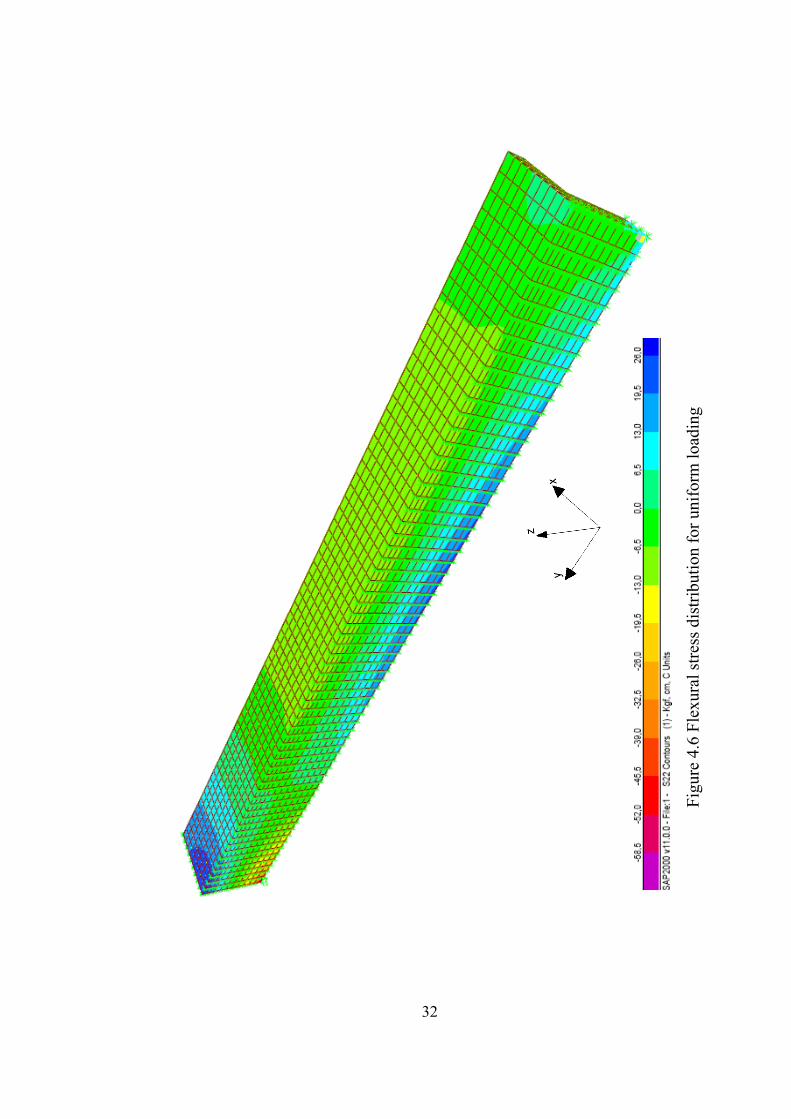
shown in Figure 4.5a and 4.5b respectively. The stress distribution and the
deformed shapes for typical cases are also given in Figures 4.6 through 4.9.
Figure 4.4 Longitudinal view of the finite element model

31
Figu
re 4
.5b
Thre
e di
men
sion
al fi
nite
ele
men
t mod
el
Figu
re 4
.5a
Cro
ss se
ctio
n of
the
finite
ele
men
t mod
el
32
Figu
re 4
.6 F
lexu
ral s
tress
dis
tribu
tion
for u
nifo
rm lo
adin
g

33
Figu
re 4
.7 D
efor
med
shap
e un
der u
nifo
rm lo
adin
g

34
Figu
re 4
.8 F
lexu
ral s
tress
dis
tribu
tion
for l
oadi
ng a
t mid
span

35
Figu
re 4
.9 D
efor
med
shap
e un
der l
oadi
ng a
t mid
span

36
4.4 Numerical Studies
In the concept of effective width, the actual distribution of the flexural
compressive stresses in the flange is replaced by a uniform distribution to
produce the same total compression. Since, almost the full flange width is
stressed in compression at a section of maximum positive moment; the
reduction to effective width is also done at this section.
Motivated by the above strategy, the beam deflections at the section of
maximum positive moment are equated to the displacements obtained from a
three-dimensional finite element analysis of the beam-and-slab floor system.
For point load cases, the maximum positive moment and hence the
maximum compressive stress occurs at the loading points. By using Eq.
(3.3), the equivalence expression for beam deflections at x = L / 2 is
EI
PLLvLvFE 7687)2/()2/(
3
−== (4.3)
Hence, the moment of inertia of the T-section is
)2/(768
7 3
LvEPLI
FET −= (4.4)
For the uniformly distributed load, on the other hand, the maximum
compressive stress occurs at x = 3L / 8 from the left support. Then, equating
the finite element deflections to beam deflections given by Eq. (3.6),
EIwLxLvLvFE
43103406.5)8/3()8/3( −−== (4.5)

37
Solving for the moment of inertia of the T-section gives
)8/3(103406.5
43
LvEwLxI
FET
−−= (4.6)
In Equations (4.4) and (4.6), IT represents the moment of inertia of the
transformed T-section. In a beam-and-slab floor system, the web dimensions
and the slab thickness, and hence the flange thickness of the T-section are
known in advance. However, the effective flange width be remains as an
unknown to be determined.
Depending on the type of loading, the numerical value for IT can easily be
computed either from Eq. (4.4) or Eq. (4.6) using the input data and the finite
element displacement results. The computed value of the moment of inertia
is then substituted into the appropriate expression for the moment of inertia
calculations given in Equations (3.9) and (3.11). As a sample case, for
instance, for the case of point load, and when Eq. (3.9) applies, the resulting
expression for the effective flange width is
[ ])2/(768
7)(3
)33(3
33322
LvEPLzdz
bhhzz
hb
FE
we −=−++++
(4.7)
It should be remembered that in the above equation, the distance z between
the neutral axis and the bottom edge of the flange is also a function of the
effective flange width be. The moment of inertia expression given in Eq.
(4.7) can be solved for the unknown effective width be by using Mathcad
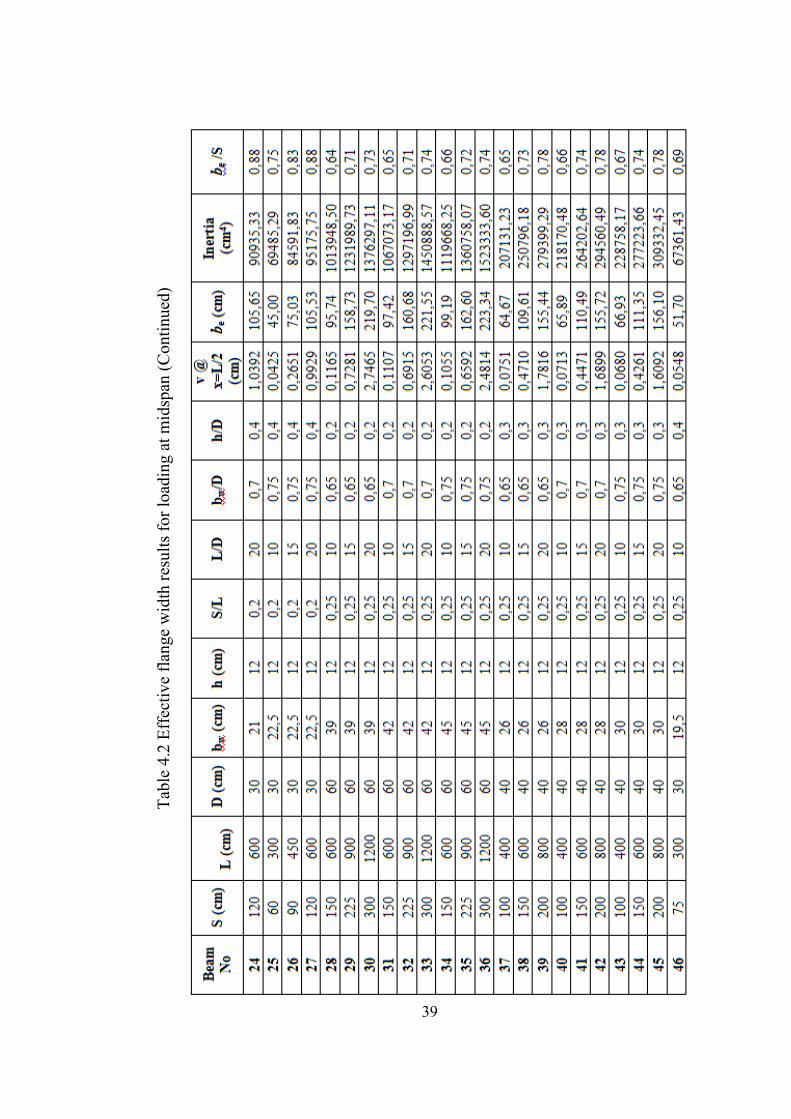
program. The results are given for both loading types in Tables 4.2 and 4.3.

38
Tabl
e 4.
2 Ef
fect
ive
flang
e w
idth
resu
lts fo
r loa
ding
at m
idsp
an
39
Tabl
e 4.
2 Ef
fect
ive
flang
e w
idth
resu
lts fo
r loa
ding
at m
idsp
an (C
ontin
ued)

40
Tabl
e 4.
2 Ef
fect
ive
flang
e w
idth
resu
lts fo
r loa
ding
at m
idsp
an (C
ontin
ued)

41
Tabl
e 4.
2 Ef
fect
ive
flang
e w
idth
resu
lts fo
r loa
ding
at m
idsp
an (C
ontin
ued)

42
Tabl
e 4.
3 Ef
fect
ive
flang
e w
idth
resu
lts fo
r uni
form
load
ing

43
Tabl
e 4.
3 Ef
fect
ive
flang
e w
idth
resu
lts fo
r uni
form
load
ing

44
Tabl
e 4.
3 Ef
fect
ive
flang
e w
idth
resu
lts fo
r uni
form
load
ing

45
Tabl
e 4.
3 Ef
fect
ive
flang
e w
idth
resu
lts fo
r uni
form
load
ing

46
CHAPTER 5
MULTIPLE NONLINEAR REGRESSION ANALYSIS
5.1 Multiple Nonlinear Regression Analysis
The basic idea of nonlinear regression is the same as that of linear
regression, namely to relate a response Y to a vector of predictor variables in
the form x = (x1, ……..,xk)T. Nonlinear regression is characterized by the
fact that the prediction equation depends on one or more unknown
parameters. Whereas linear regression is often used for building a purely
empirical model, nonlinear regression usually arises when there are physical
reasons for believing that the relationship between the response and the
predictors follows a particular functional form. A nonlinear regression model
has the form
( ) iii xfY εθ += , i = 1…, n (5.1)
where Yi are responses, f is a known function of the covariate vector
xi = (xi1, ……..,xik)T and the parameter vector θ = (θ1,…….., θp)T and ε i are
random errors.
Nonlinear regression analysis estimates the coefficients of the nonlinear
equation, involving one or more independent variables that best predict the
value of the dependent variable.

47
In most empirical studies, the value of dependent variable Y is not uniquely
determined when the level of independent variable X is specified. Such
relations are called statistical relations. Statistical relations can be either
linear or nonlinear. In this study, the model that defines the relation between
dependent and independent variables is selected as nonlinear so as to make a
comparison with the previous studies.
5.2 Nonlinear Regression Model
The statistical model used in this study is nonlinear and the regression
equation takes the form as;
5432
43211βββββ AAAAY ××××= (5.2)
This form is considered to fit the model in the same format with the result of
those studies done by Loo and Sutandi (1986), Utku and Aygar (2002). In
the above equation, β1 to β5 represent constant values of the regression
model, which are called as the estimates of the model, and A1 to A4
represent the set of independent predictor variables.
This statistical technique allows us to predict the ratio of effective flange
width to beam spacing (be/S) on the basis of some independent variables.
There are four independent variables which influence this ratio. These
independent variables are obtained as the ratios of beam geometric
parameters. Four independent variables from A1 to A4 are “S/L”, “L/D”,
“h/D” and “bw/D” respectively.
The effective flange width values are given in Table 4.2 and 4.3 for 81
combinations of these four independent variables and for each loading
condition. Then, nonlinear regression analyses were carried out on this

48
available data using the software SPSS, “Statistical Package for the Social
Sciences” (2006).
For the determination of the relation equation, the format of the relationship
is defined by using nonlinear regression in SPSS program. Since the program
will use an iterative method for obtaining such an equation, first values of all
parameters used in this study are assigned to initial values equal to zero.
When the iteration is completed, the estimated values of β1 to β5 are given
as output with their correlations with respect to each other.
For nonlinear regression model of the load at midspan case, 26 iterations
were performed using SPSS program, resulting in the parameter estimates as
given in Table 5.1.
Table 5.1 Estimate values of parameters (Load at midspan)
The use of the above parameters in Eq. (5.2) led to the following nonlinear
equation for effective flange width, be, for point load:
1698.00913.02463.02947.0
322.0 ⎟⎠⎞
⎜⎝⎛×⎟
⎠⎞
⎜⎝⎛×⎟
⎠⎞
⎜⎝⎛×⎟
⎠⎞
⎜⎝⎛×=
−
Dh
Db
DL
LS
Sb we (5.3)

49
Analysis of variance is also performed for the parameters by SPSS, giving
95.1 % value of variance which illustrates that model is a good
representative of the finite element analysis results.
For the nonlinear model of uniformly distributed load case, the parameter
estimates obtained after 26 iterations are given in Table 5.2.
Table 5.2 Estimate values of parameters (Uniformly distributed load)
For the uniformly distributed load case, the substitution the above
parameters into Eq. (5.2) again led to the following nonlinear equation for
effective flange width be:
1473.0086.02746.03058.0
2858.0 ⎟⎠⎞
⎜⎝⎛×⎟
⎠⎞
⎜⎝⎛×⎟
⎠⎞
⎜⎝⎛×⎟
⎠⎞
⎜⎝⎛×=
−
Dh
Db
DL
LS
Sb we (5.4)
Analysis of variance for this model was obtained as 95.6 % which is an
indication of a good correlation between the formulas and the finite element
analyses.

50
5.3. Comparison with the Code Equations
The design formulas defined in Equations (5.3) and (5.4) for effective flange
width are compared with the code equations given in ACI, Eurocode,
BS8110 and TS500. Moreover, these formulas are also compared with the
expressions given by Utku and Aygar (2002). In Figure 5.1 the be/S ratios
permitted by various codes for the assumed cases of L/D, bw/D and h/D are
compared with the proposed formulas against S/L. Three of the typical
curves for load at midspan are shown in Figure 5.1. The cases considered
and the corresponding values of parameters are as follows:
Case 1: L/D = 10, bw/D = 0.75, h/D = 0.4
Case 2: L/D = 15, bw/D = 0.7, h/D = 0.3
Case 3: L/D = 20, bw/D = 0.65, h/D = 0.2
It should be noted that with the chosen values of the parameters, the change
from Case1 to Case 3 represents the change from stubby beams to slender
beams.
(a) L/D = 10 , bw/D = 0.75 , h/D = 0.4

51
(b) L/D = 15 , bw/D = 0.7 , h/D = 0.3
(c) L/D = 20 , bw/D = 0.65 , h/D = 0.2
Figure 5.1 Comparison of design formulas with the code equations
for load at midspan

52
It is observed from Figure 5.1 that for the concentrated load case, the codes
considered here are unsafe for the stubby beams. As the beam gets slender,
this trend changes and smaller effective flange width values are obtained for
increasing values of the beam spacing. However, for all cases the
recommendations given by Eurocode give overestimated results.
The results for be/S obtained from Eq. (5.3) for three cases are shown in
Figure 5.2 over a larger interval of S/L. The comparison of the three cases
shows that as the beam spacing S increases, be/S decreases. Moreover, for
the same value of the beam spacing S, the ratio be/S increases as the span
length L increases. It is also observed from Figure 5.2 that graphs are very
close to each other, and even Cases 2 and 3 happen to lie on top of each
other. Therefore, it can be concluded that the beam spacing S and the beam
span length L affect the effective flange width more significantly than the
other parameters.
Figure 5.2 “S/L” versus “be/S” for Case1, Case2 and Case3

53
In addition to these comparison curves, results of each three cases are also
compared with those of Utku and Aygar (2002) in Figure 5.3. It is observed
that the results of the present work compare well with results based on stress
criterion.
(a) L/D = 10 , bw/D = 0.75 , h/D = 0.4

54
(b) L/D = 15 , bw/D = 0.7 , h/D = 0.3
(c) L/D = 20 , bw/D = 0.65 , h/D = 0.2
Figure 5.3 Effective flange width based on stress criterion and
deflection consideration (Point load)

55
Similar curves are also prepared for uniformly distributed load case and
these curves are represented in Figures 5.4, 5.5 and 5.6.
It is observed from Figure 5.4a that for stubby beams, the proposed formula
gives rather conservative results with respect to the code equations.
However, as the beams get slender all codes give very conservative
assessments of be for uniformly distributed load case except for Eurocode
which gives consistently overestimated results for all cases. For most of the
beams under a uniform distributed load, Eurocode values of be/S are very
close to unity.
(a) L/D = 10 , bw/D = 0.75 , h/D = 0.4

56
(b) L/D = 15 , bw/D = 0.7 , h/D = 0.3
(c) L/D = 20 , bw/D = 0.65 , h/D = 0.2
Figure 5.4 Comparison of design formulas with the code equations
for uniformly distributed load

57
The results for be/S obtained from Eq. (5.4) for the three cases again are
shown in Figure 5.5 over a larger interval of S/L. From the comparison of
Figure 5.2 for point load case and Figure 5.4 for uniform loading, a similar
trend is observed for the variation of effective flange width against the beam
spacing, except a very small increase in the be/S results for the uniform
loading.
Figure 5.5 “S/L” versus “be/S” for Case1, Case2 and Case3
Figure 5.6 shows the comparison between the deflection based results of the
present study and those obtained from stress criterion of Utku and Aygar
(2002). It is observed that the results of the proposed equation for the
uniformly distributed load case exhibit very good agreement with the results
of stress criterion when the beam spacing is small. However, as the beam
spacing increases the proposed equation has a tendency to produce
conservative effective flange width values.

58
(a) L/D = 10 , bw/D = 0.75 , h/D = 0.4
(b) L/D = 15 , bw/D = 0.7 , h/D = 0.3

59
(c) L/D = 20 , bw/D = 0.65 , h/D = 0.2
Figure 5.6 Effective flange width based on stress criterion and
deflection consideration (uniform loading)

60
CHAPTER 6
CONCLUSIONS
In this thesis, three-dimensional finite element analysis has been carried out
on continuous T-beams to assess the effective flange width based on
displacement criterion. The formulation is based on a combination of the
elementary bending theory and the finite element method, accommodating
partial interaction. Eight-node brick elements have been used to model the T-
beams. The beam spacing, beam span length, total depth of the beam, the
web and the flange thicknesses are considered as independent variables.
Depending on the type of loading, the numerical value of the moment of
inertia of the transformed beam cross-section and hence the effective flange
width are calculated. The input data and the finite element displacement
results are then used in a nonlinear regression analysis and two explicit
design formulas for effective flange width have been derived. Comparisons
are made between the proposed formulas and the ACI, Eurocode, TS-500
and BS-8110 code recommendations.
The following conclusions can be drawn from the results obtained in this
study:
1. For the point load case, all codes give highly overestimated values for
the effective flange width particularly for short and deep beams when
the results are compared with the analyses based either on stress
criterion or deflection consideration.
2. As the beam gets slender, this trend changes and smaller effective
flange width values are obtained for increasing values of the beam
61
spacing. However, for all cases the recommendations given by
Eurocode give overestimated results.
3. Using the curves developed from the proposed equations, it is
observed that as the beam spacing S increases, be/S decreases.
Moreover, for the same value of the beam spacing S, the ratio be/S
increases as the span length L increases.
4. It is also concluded that the beam spacing S and the beam span length
L affect the effective flange width more significantly than the other
parameters.
5. For beams under a uniformly distributed load, it is found that the
proposed formula gives underestimated results for stubby beams with
respect to the code equations. However, as the beams get slender all
codes yield very conservative assessments of be for uniformly
distributed load case except for Eurocode which gives consistently
overestimated results for all cases. For most of the beams under a
uniform distributed load, Eurocode values of be/S are very close to
unity.
6. Comparisons are made between the proposed deflection-based
formulas and the formulation based on stress criterion. It is found that
the results of the proposed equation for the uniformly distributed load
case exhibit very good agreement with the results of stress criterion
when the beam spacing is small. However, as the beam spacing
increases the proposed equation has a tendency to produce
conservative effective flange width values.

62
REFERENCES
Brendel, G., “Strength of the Compression Slab of T-Beams Subject to
aaaaaaaaaaaaSimple Bending”, ACI Journal, Proceedings Vol.61, No.1, 57-
aaaaaaaaaaaa75, Jan. 1964.
Cook, R.D., Malkus, D.S. and Plesha, M.E., Concepts and Applications of
aaaaaaaaaaaaFinite Element Analysis, Third Edition, John Wiley and Sons,
aaaaaaaaaaaaNew York. 1989.
Ersoy, U., Reinforced Concrete, Middle East Technical University, Ankara,
aaaaaaaaaaaa1994.
Fraser, D.J. and Hall, A.S., “The Effective Flange Width of Integral T- and
aaaaaaaaaaaaL-Beams ”, Civil Engineering Transactions, Vol.CE15, No.1-2,
aaaaaaaaaaaa74-76, 1973.
Loo, Y.C. and Sutandi, T.D., “Effective Flange Width Formulas For T-
aaaaaaaaaaaaBeams”, Conctrete International: Design & Construction,
aaaaaaaaaaaaVol.8, No.2, 40-45, Feb. 1986.
MacGregor, J.G. and Wight, J.K., Reinforced Concrete: Mechanics and
Design, 4th Edition, Prentice Hall, New Jersey, 2005.
Neter, J., Wassreman, W. and Whitmore, G.A., Applied Statistics, Fourth
aaaaaaaaaaaaEdition, Allyn and Bacon, Massachussets, 1993.

63
Nilson, A.H. and Winter, G., Design of Concrete Structures, Eleventh
aaaaaaaaaaaaEdition, McGraw-Hill Book Company, New York, 1991.
Pecknold, D.A., “Slab Effective Width for Equivalent Frame Analysis”, ACI
aaaaaaaaaaaaJournal, Proceedings Vol.72, No.4, 135-137, Apr. 1975.
Timoshenko, S.P. and Goodier, J.N., Theory of Elasticity, McGraw Hill
aaaaaaaaaaaaBook Company, New York, 1970.
Utku, M. and Aygar, A., “Investigation of Effective Flange Width Formulas
for T-Beams”, Proceedings of the Sixth International
Conference on Computational Structures Technology, Paper
13, Prague, Czech Republic, 4- 6 September 2002.
Betonarme Yapıların Hesap ve Yapım Kuralları, TS500, Türk Standardları
aaaaaaaaaaaaEnstitüsü, Nisan 1984.
Building Code Requirements for Reinforced Concrete Buildings, ACI-318-
aaaaaaaaaaaa95, American Concrete Institute, Michigan, 1995.
Eurocode 2: Design of Concrete Structures-Part 1: General Rules for
aaaaaaaaaaaaBuildings, 1991.
SAP 2000 Advanced V.11.0.0, Computers and Structures, Inc., Berkley,
California, 1976 - 2007.
Statistical Package for the Social Sciences for Windows, Release 15.0.0.,
aaaaaaaaaaaaa2006.