a facile approach for the synthesis of monolithic...
TRANSCRIPT

A Facile Approach for the Synthesis of Monolithic Hierarchical
Porous Carbons - High Performance Materials for Amine Based
CO2 Capture and Supercapacitor Electrode
Luis Estevez,‡a
Rubal Dua,‡b
Nidhi Bhandari,a Anirudh Ramanujapuram,
a Peng Wang,*
b and
Emmanuel P. Giannelis*a
‡ Authors contributed equally. a Department of Materials Science and Engineering, Cornell University, Ithaca, NY 14853
(USA); E-mail:[email protected] b Water Desalination and Reuse Center, Biological and Environmental Science and Engineering
Division, King Abdullah University of Science and Technology (KAUST), Thuwal 23955-6900
(Kingdom of Saudi Arabia) E-mail: [email protected]
Materials employed
Commercially available colloidal silica suspensions in water with different average size silica: 4
nm (15 wt% , Alfa Aesar) 8 nm (LUDOX SM-30, 30 wt%, Sigma Aldrich), 12 nm (LUDOX
HS-30, 30 wt%) 20 nm (40 wt%, Alfa Aesar) were used as received. The carbon precursor was
D-(+)-Glucose, ACS reagent grade, purchased from Sigma Aldrich.
In a typical synthesis, 10 g of a 15 wt% suspension of 4 nm colloidal silica and 1.5 g of glucose
D is added to a 50 mL centrifuge tube and mixed well. Next the centrifuge tube (uncapped) is
plunged into liquid nitrogen. Once the ice front (traveling radially from outside in) meets at the
center of the suspension, the whole tube is submerged in the liquid nitrogen bath. The frozen
sample is then subjected to freeze drying until the sample is completely dry. The freeze-dried
glucose-silica composite is then pyrolyzed at 1000 ºC at a ramp rate of 3 ºC/min for a dwell time
of 3 h under a nitrogen or argon environment, resulting in a carbon-silica composite. This
carbon-silica composite is then placed in a 3M NaOH solution at 80 ºC overnight under medium
stirring to etch out the silica. The sample is finally washed with deionized water until a neutral
pH is reached and dried at 80 ºC for at least 12 hours before use. For convenience the samples
are denoted by KCU-C x-y, where x represents the average colloidal silica size (nm) and y
represents the ratio of silica to glucose (by weight) in the original suspension. To introduce
significant microporosity, CO2 activation is used. Specifically for the CO2 activation, the sample
(after silica etching) is heated first under an inert atmosphere up to a temperature of 950 ºC,
whereupon the inert gas is replaced by CO2 at a flow rate of 50 cc/min. The time for activation
varies from 1 – 4 h. CO2 activated samples are denoted by KCU-C x-y-z, where z represents the
time (h) for CO2 activation.
Characterization Methods
Scanning Electron Microscopy (SEM). The microstructure of the samples was investigated by a
LEO 1550 FESEM operating between 2-20 keV. SEM sample preparation involved polishing the
sample’s surface by a cryo-microtome (Leica EM FC7). The sample was placed in the
microtome’s cryo-chamber, which was kept at a temperature below -80 °C to ensure sufficient
Electronic Supplementary Material (ESI) for Energy & Environmental ScienceThis journal is © The Royal Society of Chemistry 2013

stiffness. Then using a diamond knife Trimming tool (Diatome Cryotrim 45), progressively
thinner slices of material were removed starting from a thickness of 5 microns until reaching a
final polishing thickness of 30-50 nm. This approach allowed the sample to be examined at
various depths.
Transmission Electron Microscopy (TEM). TEM images were obtained using an FEI T12 Spirit
TEM/STEM. The T12 is a 120 kV field emission TEM, equipped with a LaB6 filament and an
SIS Megaview II CCD camera. The sample was grounded and then added into a vial with
ethanol. The sample was then sonicated and physically mixed by shaking the vial. After roughly
45 s, with the larger particles settling to the bottom of the vial, the top of the vial was pipetted
out and placed on a carbon coated copper TEM grid.
Dynamic Mechanical Analysis (DMA). Compression measurements were carried out using a TA
Instruments DMA Q800 Dynamic Thermal Mechanical Analyzer. Cylindrical samples (all
approximately 8 mm in diameter and 10 mm in length) were preloaded at 0.001 N. Stress-strain
measurements were taken at a compression rate of 0.5 N/min until a maximum force of 18 N was
reached. Measurements were taken at ambient temperature and pressure.
Electrical conductivity measurements. Electrical conductivity measurements were obtained by
way of a four point probe setup. The probe was set up so that the sample (in powder form) was in
an insulating cylinder with two conductive pistons on either end able to squeeze the powder
together. By using a spring the amount of force applied to the pistons and thus, the pressure on
the powder could be measured. Two small pinholes in the side of the cylinder allowed for two
narrow conductive pins to contact the KCU-C powder. The pins allowed the voltage drop to be
measured in the compacted powder as a current was applied through the conductive pistons. The
pressure applied to the KCU-C powder was above 8000 psi, to minimize the void space of the
material measured.
Electrochemical Measurement. The electrodes were prepared by mixing 92.5 wt% KCU-C 4-1-4
and 7.5 wt% polytetrafluoroethylene (PTFE) (60 wt% PTFE obtained from Sigma Aldrich) with
ethanol to form a slurry. The slurry was grounded using a mortar and pestle and dried by placing
in an oven at 80 ºC for an hour to obtain a dough like paste. The paste was then rolled into a film
and then pressed onto a stainless steel mesh (Alfa Aesar). The electrochemical performance was
characterized by cyclic voltammetry (CV). The CV experiments were carried out using a three-
electrode configuration with Pt as the counter electrode, Ag/AgCl as the reference electrode and
with 1M H2SO4 as the electrolyte in the potential range between 0-1V. Different sweep rate
values ranging from 2 to 200 mV/s were used. The galvanostatic charge-discharge measurement
was carried out using a two electrode configuration at different current densities (I/m, where m is
the mass of a single electrode) ranging from 1-80 A/g. The electrochemical impedance
spectroscopy measurement was performed using a sinusoidal signal of 10 mV over the frequency
range from 100 kHz to 2 mHz. The specific capacitance, energy density and power density are
calculated using the following formula:
28
1dropS VVCE
Electronic Supplementary Material (ESI) for Energy & Environmental ScienceThis journal is © The Royal Society of Chemistry 2013

m
IVVP drop
22
1
dV
dt
m
ICs 2
where
m is the mass of single electrode
I is the current
V is the maximum applied potential (1V)
Vdrop is the IR drop
dV/dt is the rate of potential decline during the discharge (excluding IR drop)
Cs is the specific capacitance of the material
E is the specific energy density
P is the specific power density
The capacitive frequency response was calculated from the EIS data using the following
formula:
ZjZjZjC
ImRe
11
21
22ImRe CCC
f 2
Sorbent preparation for amine based CO2 capture: Polyethylenimine (PEI) (average Mw ~800,
from Sigma Aldrich) was mixed with absolute methanol to obtain a 20 wt% solution. The
sorbents were prepared by adding a fixed amount of this 20 wt% solution to 25 mg of KCU-C 4-
3. The mixture was then sonicated and kept under 70 mbar at 40 ºC for at least 12h. The CO2
sorption measurement was performed using a TA Instruments Q500 thermal graphic analyzer.
Sorption tests were performed with 1atm of dry CO2. For the sorption tests, 5-10 mg of the PEI-
carbon composite was placed in a platinum pan, heated to 100 ºC @ 10 K/min under N2 (40
ml/min flow rate) and held at 100 ºC for 40 min to remove any moisture and CO2 sorbed from
air. The sorbent was then cooled to 75 ºC @ 10 K/min and the gas was switched over to CO2 and
held at 75 ºC for 45 min. The CO2 capacity of the sorbents (in mmol g-1
) was calculated based on
the weight gain of the sorbent during the adsorption. Tests were also conducted with 10% CO2-
90% N2, under dry and moist (by passing the gas through a water bubbler maintained at room
temperature) conditions.
Mercury porosimetry: Monolithic samples were analyzed using mercury intrusion via a
Micromeritics AutoPore IV (9500 Series) porosimeter. The cylindrical monolith samples were
cut in half (axially) to fit into the penetrometer sample holder. Care was taken to analyze the data
up to a pressure of 3617.27 psia, ensuring that pores with size below 50 nm were not analyzed.
The apparent density was calculated by the AutoPore IV by measuring the volume of the sample
at 0.60 psia and using the weight measured by the operator.
Electronic Supplementary Material (ESI) for Energy & Environmental ScienceThis journal is © The Royal Society of Chemistry 2013

BET
Nitrogen adsorption-desorption tests were carried out at 77K using a Micromeritics ASAP 2020
analyzer. Prior to gas adsorption measurement, the samples were degassed at 180 ºC under
vacuum for at least 12 hours. The specific surface area was calculated using the Brumauer-
Emmett-Teller (BET) method. The pore volume was estimated from single point adsorption at a
relative pressure of 0.994. The pore diameter was determined from the adsorption branch,
according to the Barrett-Joyner-Halanda (BJH) method.
Microporosity characterization via CO2 adsorption:
CO2 adsorption-desorption tests were carried out at 273K using a Micromeritics ASAP 2050
Xtended Pressure Sorption Analyzer. Prior to gas adsorption, the samples were degassed at 180
ºC for 16 hours, under vacuum. The absolute pressure range used was roughly 0.03 bar to 10 bar.
The pore size distribution was calculated using density functional theory, using CO2 at 273K on
carbon and the pores represented as slits for modeling purposes.
Electronic Supplementary Material (ESI) for Energy & Environmental ScienceThis journal is © The Royal Society of Chemistry 2013

Figures
Figure S1. SEM images where the sample was cut and polished via microtome as described
previously. The SEM images reveal (a) a fishbone like structure in the glucose-silica composite
that is also seen in the (b) carbonized HPC material. HR-SEM images show (c) the macroporous
walls of the glucose-silica hybrid material, in which the (d) colloidal silica can clearly be seen.
Electronic Supplementary Material (ESI) for Energy & Environmental ScienceThis journal is © The Royal Society of Chemistry 2013

Figure S2. TEM images of KCU-C x-y samples. Scale bars for all images are 200 nm for the
larger images and 20 nm for the inset images. a) KCU-C 4-1 b) KCU-C 4-2 c) KCU-C 8-1 d)
KCU-C 8-2 e) KCU-C 20-1 f) KCU-C 20-2.
Electronic Supplementary Material (ESI) for Energy & Environmental ScienceThis journal is © The Royal Society of Chemistry 2013

0
6
12
18
0 10 20 30 40 50
Pore Size (mm)
Log D
iffere
ntia
l Intr
usio
n (
mL/g
)
Figure S3. Pore size distribution via mercury porosimetry for the KCU-C 4-1 monolith sample.
The pore size distribution shows macropores present mostly in the range from 3-12 microns.
Some larger (above 15 μm) macropores are present, but to a relatively small degree. The analysis
reveals the monoliths have a porosity of 83% and a bulk density of 0.09 g/mL (at 0.60 psia).
Electronic Supplementary Material (ESI) for Energy & Environmental ScienceThis journal is © The Royal Society of Chemistry 2013

0
1
2
3
4
5
6
7
8
9
10 30 50 70 90
Pore Size (A)
dV
/dlo
g(D
) (c
m3/g
/A)
KCU-C 4-1KCU-C 4-1-1KCU-C 4-1-3KCU-C 4-1-4
300
500
700
900
1100
1300
1500
1700
1900
0 0.5 1
Relative Pressure (P/Po)
Volu
me A
dsorb
ed (
cc/g
)KCU-C 4-1KCU-C 4-1-1KCU-C 4-1-3KCU-C 4-1-4
Figure S4. (a) N2 sorption isotherms and (b) BJH pore size distributions, for KCU-C 4-1
samples that underwent physical activation for 0, 1, 3 and 4 hours at a CO2 flow rate of 50
cc/min. The curves show how the 1.8-4.0 nm (small mesopore/large micropore) shoulder present
in the KCU-C 4-1 sample increases with increased activation time. (c) CO2 sorption isotherms
for both activated and non activated KCU-C 4-1 samples; and (d) the resultant micropore size
distribution via density functional theory (slit pores) model. Both the CO2 sorption curves and
the DFT pore size distribution show a substantial increased microporosity in the KCU-C 4-1-4
sample. This increased microporosity correlates directly with the increased surface areas for
increasing activation times seen in table S1 (below).
Table S1. BET surface area and mesopore volume of KCU-C 4-1 samples under various
physical activation times. As the activation times increase, the surface area and pore volume
increase.
Sample name CO2 activation
time (h)
BET surface
area (m2/g)
N2 adsorption pore
volume (cm3/g)
KCU-C 4-1 0 1316 2.3
KCU-C 4-1-1 1 1703 2.6
KCU-C 4-1-3 3 1935 2.9
KCU-C 4-1-4 4 2096 3.0
a b
c d
Electronic Supplementary Material (ESI) for Energy & Environmental ScienceThis journal is © The Royal Society of Chemistry 2013

Bimodal KCU-C
0
200
400
600
800
1000
1200
1400
1600
1800
0 0.5 1Relative Pressure (P/Po)
Vo
lum
e A
dso
rbe
d (
cc/g
)
Figure S5. (a) N2 sorption isotherm and (b) BJH pore size distribution for a KCU-C synthesized
using both 4 and 20 nm sized colloidal silica (as specified by the manufacturer). The sample was
prepared using equal parts (by weight) of each colloidal silica and adding glucose to the
suspension until the glucose to the combined silica weight ratio was 1:1. The sample has a BET
surface area of 1025 m2/g and a mesopore volume of 2.4 cm
3/g. (c) TEM image of the bimodal
HPC sample with a bimodal pore size distribution consistent with the peaks seen in S5b (8 and
20 nm). Inset image is a higher resolution TEM image that denotes the diameters of the smaller 8
nm pores with green lines and the larger 20 nm pores with red lines.
Bimodal KCU-C
0
0.5
1
1.5
2
2.5
3
3.5
4
10 100 1000
Pore Size (A)
dV
/dlo
g(D
) (c
m3/g
/A)
a b
C
)
Electronic Supplementary Material (ESI) for Energy & Environmental ScienceThis journal is © The Royal Society of Chemistry 2013
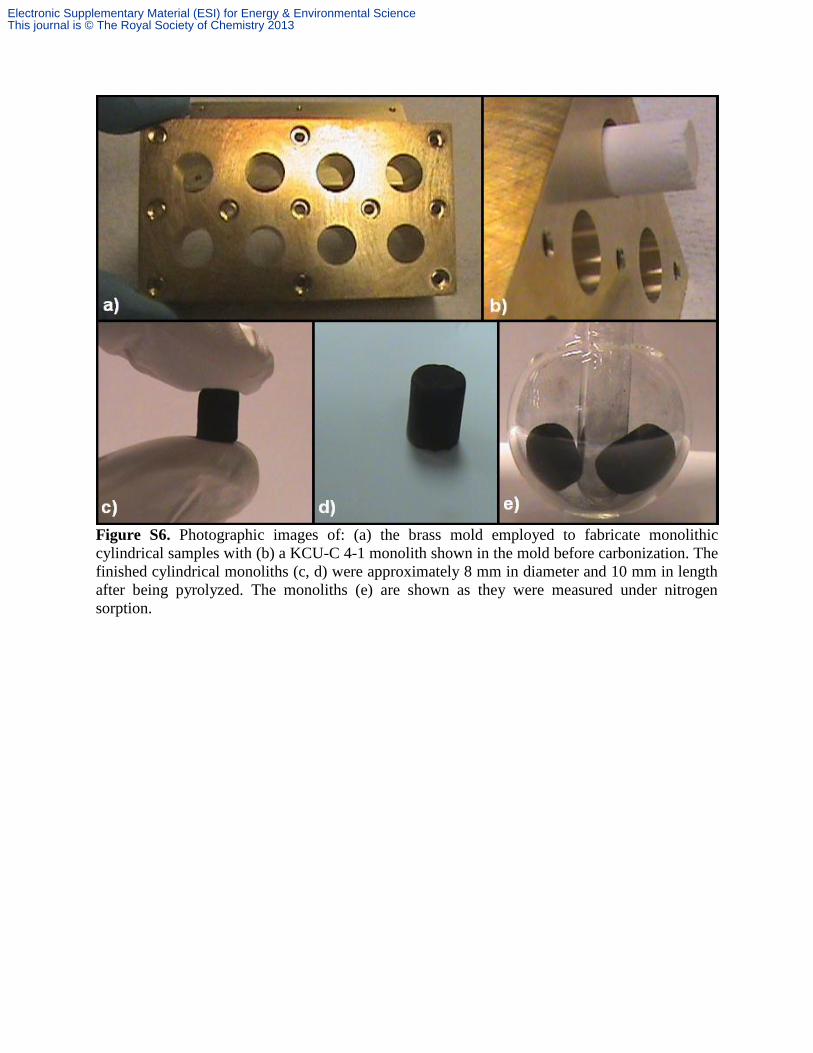
Figure S6. Photographic images of: (a) the brass mold employed to fabricate monolithic
cylindrical samples with (b) a KCU-C 4-1 monolith shown in the mold before carbonization. The
finished cylindrical monoliths (c, d) were approximately 8 mm in diameter and 10 mm in length
after being pyrolyzed. The monoliths (e) are shown as they were measured under nitrogen
sorption.
Electronic Supplementary Material (ESI) for Energy & Environmental ScienceThis journal is © The Royal Society of Chemistry 2013

Figure S7 below shows a typical compressive stress/strain plot. In general, the stress/strain
curves exhibit a behavior typical of porous cellular solids. At small strains the material behaves
elastically and the slope of the curve equals the compressive modulus of the porous material. At
higher strains the material collapses in brittle failure until it starts to reach a maximum
compacted state, whereupon the stress starts to increase sharply.
0.00
0.04
0.08
0.12
0.16
0.20
0 10 20 30 40 50 60 70 80
Strain (%)
Str
ess (
MP
a)
Figure S7. Stress strain curve representative of KCU-C 4-1 cylindrical monoliths. The modulus
was obtained by measuring the slope of the curve before the collapse of the material under brittle
failure.
Electronic Supplementary Material (ESI) for Energy & Environmental ScienceThis journal is © The Royal Society of Chemistry 2013

0
500
1000
1500
2000
2500
0 0.2 0.4 0.6 0.8 1
Relative Pressure (P/Po)
Volu
me A
dsorb
ed (
cc/g
)
KCU-C 4-3
Figure S8. (a) N2 sorption isotherm and (b) BJH pore size distribution for KCU-C 4-3
synthesized using 4nm colloidal silica and silica/glucose ratio of 3. The sample has a BET
surface area of 760 m2/g and a mesopore volume of 3.6 cm
3/g. KCU-C 4-3 sample was
impregnated with amine and used for CO2 capture.
0
1
2
3
4
5
6
7
8
10 100 1000
Pore Size (A)
dV
/dlo
g(D
) (c
m3/g
/A)
KCU-C 4-3
a b
Electronic Supplementary Material (ESI) for Energy & Environmental ScienceThis journal is © The Royal Society of Chemistry 2013

-60.00
-40.00
-20.00
0.00
20.00
40.00
60.00
0 0.2 0.4 0.6 0.8 1
Potential (V vs Ag/AgCl)
Curr
ent D
ensity
(A
/g)
200 mV/s 100 mV/s
50 mV/s 20mV/s
10mV/s 5mV/s
2mV/s
1
Figure S9. (a) Cyclic voltammetry results (b) Nyquist plot for KCU-C 4-1-4 using a sinusoidal
signal of 10 mV over the frequency range from 100 kHz to 2 mHz. Re(Z) represents the real
impedance and Im(Z) represents the imaginary impedance, (c) Galvanostatic charge-discharge
curve for KCU-C 4-1-4 measured using symmetrical two electrode configuration in 1M H2SO4
within the potential range 0-1 V
40 A/g
0
0.2
0.4
0.6
0.8
1
0 1 2 3 4
Time / s
Pote
ntia
l / V
a
b c
Electronic Supplementary Material (ESI) for Energy & Environmental ScienceThis journal is © The Royal Society of Chemistry 2013

S14
0
1000
2000
3000
4000
5000
6000
7000
8000
0 0.2 0.4 0.6 0.8 1
Relative Pressure (P/Po)
Volu
me A
dsorb
ed (
cc/g
)
KCU-C 4-1
KCU-C 4-2
KCU-C 8-1
KCU-C 8-2
KCU-C 12-1
KCU-C 12-2
KCU-C 20-1
KCU-C 20-2
Figure S10. Nitrogen sorption isotherms for the KCU-C samples. The curves for KCU-C 8-y,
KCU-C 12-y, KCU-C 20-y are offset vertically by 1500, 3000, 4500 cc/g respectively.
Electronic Supplementary Material (ESI) for Energy & Environmental ScienceThis journal is © The Royal Society of Chemistry 2013