nickel-based nanomaterials for electrochemical...
TRANSCRIPT
Nickel-based Nanomaterials for
Electrochemical Supercapacitors
Dissertation by
Nuha Alawi Alhebshi
In Partial Fulfillment of the Requirements
For the Degree of
Doctor of Philosophy (Ph.D.) in Materials Science and Engineering
King Abdullah University of Science and Technology
Thuwal, Kingdom of Saudi Arabia
November 2015

2
EXAMINATION COMMITTEE APPROVALS
The Ph.D. dissertation of Nuha Alawi Alhebshi is approved by the examination
committee.
Committee Chairperson
Prof. Husam Niman Alshareef
Committee Members
Prof. Hala Abdulaziz Aljawhari
Prof. Iman Salem Roqan
Prof. Khaled Nabil Salama
Prof. Osman Mohammad Bakr

3
COPYRIGHT
© November 2015
Nuha Alawi Alhebshi
All Rights Reserved
4
ABSTRACT
Nickel-based Nanomaterials for Electrochemical Supercapacitors
Nuha Alawi Alhebshi
The demand for energy storage technologies is rapidly increasing in
portable electronics, transportation, and renewable energy systems. Thus, the
objective of this research is to develop and enhance the performance of Ni-
based electrochemical supercapacitors by optimizing synthesis conditions and
design of the electrode materials. Conventional and on-chip supercapacitors
were developed with notable performance enhancement.
For conventional supercapacitors, a uniform and conformal coating
process was developed to deposit Ni(OH)2 nanoflakes on carbon microfibers in-
situ by a simple chemical bath deposition at room temperature. The
microfibers conformally-coated with Ni(OH)2 make direct physical contacts with
essentially every single nanoflakes, leading to more efficient electron
transport. Using this strategy, we have achieved devices that exhibit five times
higher specific capacitance compared to planar (non-conformal) Ni(OH)2
nanoflakes electrodes prepared by drop casting of Ni(OH)2 on the carbon
microfibers (1416 F/g vs. 275 F/g).
For on-chip storage applications, microfabricated supercapacitors were
developed using a combination of top-down photolithography and bottom-up
CBD. The resulting Ni(OH)2 micro-supercapacitors show high-rate redox activity
5
up to 500 V/s and an areal cell capacitance of 16 mF/cm2 corresponding to a
volumetric stack capacitance of 325 F/cm3. This volumetric capacitance is 2-
fold higher than carbon and metal oxide based micro-supercapacitors.
Furthermore, these micro-supercapacitors show a maximum energy density of
21 mWh/cm3, which is superior to the Li-based thin film batteries.
To enhance cycling stability, Ni-Cu-OH and Ni-Co-OH ternary electrodes
have been prepared with different Ni:Cu and Ni:Co ratios by CBD at room
temperature on carbon microfibers. It is observed that the electrodes with
Ni:Cu and Ni:Co composition ratio of 100:10 results in an optimum capacitance
and cycling stability. For the optimum composition, Ni-Co-OH with graphene
and carbon nanofibers electrode was tested, with resultant improvement in
electrode potential window, equivalent series resistance, and cyclic stability.
To further increase energy density, Ni(OH)2//Graphene asymmetric
supercapacitor were fabricated with areal capacitance of 253 mF/cm2 at 5
mA/cm2 which is higher than NiO//rGO prepared by hydrothermal method. Ni-
Co-OH/G-CNF//Graphene asymmetric supercapacitor results in a maximum
power of 23 mW within an operating voltage of 2.2 V which are higher than of
Ni(OH)2//Graphene (15.94 mW within 1.8 V). Our asymmetric supercapacitors
have flexible-electrodes, low-cost fabrication process and environmentally
friendly materials.

6
ACKNOWLEDGEMENTS
I would like to thank my advisor, Prof. Husam Alshareef. My Ph.D.
research could not be done without his valuable guidance and continued
support. It was a great opportunity for me to work in his advanced laboratory:
Functional Nanomaterials and Devices Laboratory. I acknowledge collaborations
and discussions with Dr. Narendra Kurra and Dr. Rakhi Raghavan-Baby, both of
whom are post-docs in our group.
In addition, it is an honor for me to have several distinguished faculty in
my Ph.D. examination committee, including Prof. Hala Aljawhari, Prof. Iman
Roqan, Prof. Khaled Salama, and Prof. Osman Bakr. I appreciate their valuable
comments on my Ph.D. proposal and dissertation.
Last but not least, I offer my sincere gratitude to my parents, Alawi
Alhebshi and Ameerah Ageel for their continues care and unconditional love.
7
TABLE OF CONTENTS
EXAMINATION COMMITTEE APPROVALS ............................................................................................. 2
COPYRIGHT ............................................................................................................................................ 3
ABSTRACT .............................................................................................................................................. 4
ACKNOWLEDGEMENTS .......................................................................................................................... 6
TABLE OF CONTENTS ........................................................................................................................... 7
LIST OF ABBREVIATIONS .................................................................................................................... 10
LIST OF SYMBOLS ................................................................................................................................ 11
LIST OF FIGURES ................................................................................................................................. 12
LIST OF TABLES ................................................................................................................................... 17
LIST OF PUBLICATIONS....................................................................................................................... 18
CHAPTER 1 . INTRODUCTION ............................................................................................................ 19
1.1. MOTIVATION ....................................................................................... 19 1.2. BACKGROUND ..................................................................................... 20 1.3. LITERATURE REVIEW ............................................................................. 23 1.4. OBJECTIVES ........................................................................................ 29
1.4.1. Conventional Supercapacitors ....................................................................................... 30
1.4.2. On-chip Supercapacitors ................................................................................................. 31
CHAPTER 2 . EXPERIMENTAL TECHNIQUES ..................................................................................... 33
2.1. MATERIALS SYNTHESIS TECHNIQUES.......................................................... 33
2.1.1. Chemical Bath Deposition ............................................................................................... 33
2.1.2. Chemical Exfoliation ....................................................................................................... 34
2.1.3. Photolithography .............................................................................................................. 35 2.2. MATERIALS CHARECRIZATION TECHNIQUES ................................................. 38
2.2.1. Scanning Electron Microscope ........................................................................................ 38
2.2.2. X-ray Diffraction .............................................................................................................. 39
2.2.3. Transmission Electron Microscope ................................................................................ 40
2.2.4. Raman Spectroscopy ........................................................................................................ 40 2.3. ELECTROCHEMICAL PERFORMANCE TECHNIQUES .......................................... 41
2.3.1. Cyclic Voltammetry ......................................................................................................... 41
2.3.2. Galvanostatic Cycling (Chronopotentiometry) ........................................................... 41
2.3.3. Electrochemical Impedance Spectroscopy ................................................................... 42
CHAPTER 3 . CONFORMALLY-COATED NICKEL HYDROXIDE NANOSTRUCTED ELECTRODES ..... 43
ABSTRACT ................................................................................................... 43
8
3.1. INTRODUCTION .................................................................................... 44 3.2. EXPERIMENTAL METHODS ....................................................................... 47
3.2.1. Synthesis of Conformal Ni(OH)2 Nanoflakes ................................................................ 47
3.2.2. Synthesis of Planar Ni(OH)2 Nanoflakes ....................................................................... 48
3.2.3. Materials Characterization ............................................................................................ 49
3.2.4. Electrochemical Measurements ..................................................................................... 50 3.3. RESULTS AND DISCUSSIONS ..................................................................... 51
3.3.1. Materials Properties ........................................................................................................ 51
3.3.2. Electrochemical Performance ........................................................................................ 56 3.4. CONCLUSIONS ..................................................................................... 62 ACKNOWLEDGEMENTS .................................................................................... 63 SUPPORTING INFORMATION ............................................................................. 63
CHAPTER 4 . NICKEL-COPPER AND NICKEL-COBALT HYDORXIDES BASED ELECTRODES .......... 71
ABSTRACT ................................................................................................... 71 4.1. INTRODUCTION .................................................................................... 72 4.2. EXPERIMENTS ...................................................................................... 76
4.2.1. Synthesis of Ni-Cu-OH, Ni-Co-OH and G-CNF .............................................................. 76
4.2.2. Materials Characterization ............................................................................................ 77
4.2.3. Electrochemical Measurements ..................................................................................... 78 4.3. RESULTS AND DISCUSSION ...................................................................... 78
4.3.1. Materials Properties ........................................................................................................ 78
4.3.2. Electrochemical Performance ........................................................................................ 82 4.4. CONCLUSIONS ..................................................................................... 89 ACKNOWLEDGMENT ....................................................................................... 90 SUPPORTING INFORMATION ............................................................................. 90
CHAPTER 5 . NICKEL-BASED ASYMMETRIC SUPERCAPACITORS .................................................... 94
ABSTRACT ................................................................................................... 94 5.1. INTRODUCTION .................................................................................... 95 5.2. EXPERIMENTAL METHODS ....................................................................... 96
5.2.1. Synthesis of Graphene and Carbon Nanofibers Electrodes ....................................... 96
5.2.2. Synthesis of Ni(OH)2 and Ni-Co-OH/G-CN Electrodes ................................................ 96
5.2.3. Materials Characterization ............................................................................................ 97
5.2.4. Electrochemical Measurements ..................................................................................... 97 5.3. RESULTS AND DISCUSSIONS ..................................................................... 98
5.3.1. Materials Properties ........................................................................................................ 98
5.3.2. Electrochemical Performance ........................................................................................ 99 5.4. CONCLUSIONS ....................................................................................106 ACNOWLEDGMENTS ......................................................................................106 SUPPORTING INFORMATION ............................................................................107
CHAPTER 6 . ON-CHIP SUPERCAPACITORS USING NICKEL HYDROXIDE NANOFLAKES ............. 109
ABSTRACT ..................................................................................................109 6.1. INTRODUCTION ...................................................................................110 6.2. EXPERIMENTAL METHODS ......................................................................112
6.2.1. Photolithography of Current Collector Substrates .................................................. 112
9
6.2.2. Chemical Bath Deposition of Ni(OH)2 Nanoflakes .................................................... 113
6.2.3. Materials Characterization .......................................................................................... 114
6.2.4. Electrochemical Measurements ................................................................................... 115 6.3. RESULTS AND DISCUSSIONS ....................................................................116
6.3.1. Materials Properties ...................................................................................................... 116
6.3.2. Electrochemical Performance ...................................................................................... 121 6.4. CONCLUSIONS ....................................................................................132 ACKNOWLEDGEMENTS ...................................................................................133 SUPPORTING INFORMATION ............................................................................133
SUMMARY ........................................................................................................................................... 138
APPENDIX. TERMINOLGY .................................................................................................................. 142
REFERENCES ...................................................................................................................................... 145
10
LIST OF ABBREVIATIONS
AC Activated carbon
BET Brunauer-Emmett-Teller
CBD Chemical bath deposition
CD Charge-discharge
CV Cyclic voltammetry
DI Deionized
EDLC Electrical double layer capacitors
EIS Electrochemical impedance spectroscopy
FC Faradic capacitors
G-CNF Graphene-carbon nanofibers
LED Light emitting diode
Ni(OH)2 Nickel hydroxide
Ni-Co-OH Nickel-cobalt hydroxides
Ni-Cu-OH Nickel-copper hydroxides
PEN Polyethylene naphthalate
rGO Reduced graphene oxide
SAED Selected area electron diffraction
SEM Scanning electron microscope
SCE Saturated calomel electrode
TEM Transmission electron microscope
TMAH Retra-methyl-ammonium-hydroxide
XRD X-ray diffraction
11
LIST OF SYMBOLS
α Alpha-phase
Beta-phase
Dielectric permittivity
Gamma-phase
Micro
Ω Ohm
t Time interval
V Voltage interval
C Capacitance
CA Areal capacitance
Cs Specific capacitance
E Energy
I Current
m Mass
P Power
Q Charge

12
LIST OF FIGURES
Figure 1.1 Global market for electrochemical supercapacitors, 2008-2015. Source:
BCC Research.1 ............................................................................................................................ 19
Figure 1.2 Global market for electrochemical supercapacitors, 2012-2019. Source:
BCC Research.2 ............................................................................................................................ 20
Figure 1.3 Sketch of electrical charge storage mechanism in EDLC. ............................... 22
Figure 1.4 Sketch of electrical charge storage in FC. ......................................................... 23
Figure 2.1 Sketch and photograph of chemical bath deposition (a) on carbon
microfibers substrate. (b) on metallic substrate. ................................................................. 33
Figure 2.2 Sketch of positive and negative photolithography (re-sketched).46 .............. 36
Figure 3.1 Schematic of the synthesis of Ni(OH)2 interconnected nanoflakes by CBD
and fabrication of (a) conformal Ni(OH)2 electrode and (b) planar Ni(OH)2 electrode. 47
Figure 3.2 Structural characterization of Ni(OH)2 nanoflakes by (a) XRD patterns of (i)
conformal Ni(OH)2 on fibrous carbon fabric and (ii) Ni(OH)2 powder, (b) SAED pattern
of Ni(OH)2 powder, and (c) lattice resolved HRTEM image of Ni(OH)2 powder. .............. 51
Figure 3.3 SEM images of (a) fibrous carbon fabric, (b), (c)and (d) conformal Ni(OH)2
nanoflakes on fibrous carbon fabric at different magnifications, (e) and (f) planar
Ni(OH)2 nanoflakes on fibrous carbon fabric at different magnifications. ....................... 53
Figure 3.4 TEM images of (a) Ni(OH)2 interconnected nanoflakes (b) a high resolution
TEM image of (a). ........................................................................................................................ 55
Figure 3.5 CV plots of (a) conformal Ni(OH)2 electrode, (b) planar Ni(OH)2 electrode,
both at lower scan rates, and (c) comparison of CV loops of both samples measured at
1 mV/s (d) Specific capacitance as a function of scan rates for both electrodes. ......... 56
Figure 3.6 Discharge curves of (a) conformal Ni(OH)2 electrode, (b) planar Ni(OH)2
electrode, both at lower current densities, and (c) comparison of discharge curves of
both samples measured at 1A/g. (d) Specific capacitance as a function of current
densities. ...................................................................................................................................... 58
Figure 3.7 (a) Specific capacitance retention of conformal and planar Ni(OH)2
electrodes for 10000 cycles at a current density of 20 A/g. (b) Nyquist plots of
conformal and planar Ni(OH)2 electrodes with an enlarged scale in the inset. .............. 59
Figure 3.8 Krypton adsorption/desorption isotherm, (b) BET surface area plot of
conformal Ni(OH)2 nanoflakes on fibrous carbon fabric. ..................................................... 63
13
Figure 3.9 SEM images of Ni(OH)2 nanoflakes on fibrous carbon fabric prepared at
different synthetic conditions as indicated on the table. ................................................... 64
Figure 3.10 CV plots of (a) conformal Ni(OH)2 electrode and (b) planar Ni(OH)2
electrode, both at higher scan rates. Discharge curves of (c) conformal Ni(OH)2
electrode and (d) planar Ni(OH)2 electrode, both at larger current densities. ............... 65
Figure 3.11 (a) and (c) CD plots of conformal Ni(OH)2 electrode containing 2.07
mg/cm2 of Ni(OH)2 at different current densities. (b) and (d) Discharge plots of
conformal Ni(OH)2 electrode containing 1.11 mg/cm2 of Ni(OH)2 at different current
densities. ...................................................................................................................................... 66
Figure 3.12 Specific capacitance (a) as a function of current densities for conformal
Ni(OH)2 electrodes with different mass loadings, and (b) as a function of mass loading
for conformal Ni(OH)2 electrodes. ........................................................................................... 67
Figure 3.13 Two-electrode measurements of fibrous carbon fabric based symmetric
supercapacitor (a) CV curves at different scan rates. (b) Discharge curves at higher
current densities. (c) Discharge curves at lower current densities. (d) Nyquist plots
with an enlarged scale in the inset. ........................................................................................ 67
Figure 3.14 Two-electrode measurements of conformal Ni(OH)2 based symmetric
supercapacitor (a) CV curves at different scan rates. (b) Discharge curves at higher
current densities. (c) Discharge curves at lower current densities. (d) Specific
capacitance as a function of current densities (scan rate in the inset). (e) Nyquist plots
with an enlarged scale in the inset. (f) Ragone plot. The mass loading per unit of area
is 1.67 mg/cm2 of Ni(OH)2 on each electrode. ...................................................................... 68
Figure 4.1 (a) and (b) EDX elemental mapping images for Ni–Cu–OH and Ni–Co-OH
electrodes, respectively. ........................................................................................................... 79
Figure 4.2 SEM images of (a)–(c) Ni–Cu–OH electrodes of 100:3, 100:10 and 100:25,
respectively. (d)–(f) Ni–Co–OH electrodes of 100:3, 100:10 and 100:25, respectively. (g)
G-CNF electrode. (h) Ni–Co–OH/G–CNF electrode. All electrodes are coated on carbon
microfibers substrates. .............................................................................................................. 80
Figure 4.3 (a) and (b) CD curves of Ni–Cu–OH and Ni-Co–OH electrodes of 100:10,
respectively. (c) and (d) CV curves of Ni–Cu–OH and Ni–Co–OH electrodes of 100:10,
respectively. Enlarged CVs curves after 10000 cycles are shown in the insets. (e) and
(f) CV curves of Ni–Cu–OH and Ni–Co–OH electrodes, respectively, of 100:25, 100:10
and 100:3. .................................................................................................................................... 82
Figure 4.4 (a) and (b) The cycling stability curves of Ni–Cu–OH and Ni–Co–OH
electrodes, respectively. (c) and (d) Areal capacitances of Ni–Cu–OH and Ni–Co–OH
electrodes, respectively. (e) and (f) Specific capacitances of Ni–Cu–OH and Ni–Co–OH
electrodes, respectively. ........................................................................................................... 85
14
Figure 4.5 (a) and (b) Complex impedance (Nyquist) plots of Ni–Cu–OH and Ni–Co–OH
electrodes of 100:10 before and after 10,000 cycles, respectively. Enlarged. Nyquist
plots are shown in the insets. ................................................................................................... 87
Figure 4.6 (a) CD of Ni–Co–OH and Ni–CoOH/ G-CNF electrodes. (b) CV of Ni–Co–OH and
Ni–Co-OH/G-CNF electrodes. (c) Nyquist plot of Ni–Co–OH and Ni–Co–OH/G-CNF
electrodes. Enlarged Nyquist plots are shown in the insets. (d) Cycling stability curves
of Ni–Co–OH and Ni–Co–OH/G-CNF electrodes. (e) and (f) Area and specific
capacitances of Ni–Co–OH and Ni–Co–OH/G-CNF electrodes, respectively. ..................... 88
Figure 4.7 (a)-(c) EDX spectra confirm the presence of C, O, Ni and Cu on all Ni-Cu-OH
electrodes. (d)-(f) EDX spectra confirm the presence of C, O, Ni and Co on all Ni-Co-OH
electrodes. ................................................................................................................................... 90
Figure 4.8 (a), (b) and (C) Small magnification SEM images of Ni-Cu-OH electrodes of
100:3, 100:10 and 100:25 Ni:Cu ratios, respectively. (d), (e) and (f) Small
magnification images of Ni-Co-OH electrodes of 100:3, 100:10 and 100:25 Ni:Co ratios,
respectively. (g) G-CNF electrode. (h) Ni-Co-OH/G-CNF electrode prepared by 2h of
CBD. ............................................................................................................................................... 91
Figure 4.9 (a) XRD pattern of graphite and G-CNF. (b) Raman spectrum of G-CNF. (c)
Photographs of G-CNF in water and methanol. ..................................................................... 91
Figure 4.10 (a), (b) and (c) Charge-discharge plots of Ni-Cu-OH electrodes of 100:3,
100:10 and 100:25 Ni:Cu ratios, respectively. (d), (e) and (f) Charge-discharge plots of
Ni-Co-OH electrodes of 100:3, 100:10 and 100:25 Ni:Co ratios, respectively. ................ 92
Figure 4.11 (a), (b) and (c) CV plots of Ni-Cu-OH electrodes of 100:3, 100:10 and
100:25 Ni:Cu ratios, respectively. (d), (e) and (f) CV plots of Ni-Co-OH electrodes of
100:3, 100:10 and 100:25 Ni:Co ratios, respectively. .......................................................... 92
Figure 4.12 (a) and (b) Areal capacity of Ni-Cu-OH and Ni-Co-OH electrodes,
respectively. (c) Areal capacity of Ni-Co-OH (100:10) and Ni-Co-OH/G-CNF electrodes.
(d) and (e) Specific capacity of Ni-Cu-OH and Ni-Co-OH electrodes, respectively. (f)
Specific capacity of Ni-Co-OH (100:10) and Ni-Co-OH/G-CNF electrodes. ....................... 93
Figure 5.1 SEM images of (a) Carbon nanofibers (graphene in inset). (b) Nickel
hydroxide. (c) Nickel-cobalt hydroxides on graphene and carbon nanofibers. ............... 98
Figure 5.2 (a) SEM images and sketch of Ni(OH)2 and graphene electrodes. (b) SEM
images and sketch of Ni-Co-OH/G-CNF and graphene electrodes. (c) Photographs of an
asymmetric supercapacitor in coin cell. ............................................................................... 100
Figure 5.3 (a) and (b) CV and CD curves of graphene electrode, respectively. (c) and
(d) CV and CD of Ni(OH)2//Graphene asymmetric supercapacitor, respectively. (e)
Capacitance of Ni(OH)2//Graphene asymmetric supercapacitor at different current
values. (d) Energy and power of Ni(OH)2//Graphene asymmetric supercapacitor. ..... 101
Figure 5.4 CV curves of Ni-Co-OH/G-CNF//Graphene asymmetric supercapacitor at
different scan rates. ................................................................................................................. 102

15
Figure 5.5 (a) and (b) CD curves of Ni-Co-OH/G-CNF//Graphene asymmetric
supercapacitor at different current values. (c) Complex plane of electrochemical
impedance spectroscopy (Nyquist plot) of Ni-Co-OH/G-CNF//Graphene asymmetric
supercapacitor with an enlarged scale in the inset. .......................................................... 103
Figure 5.6 (a) Capacitance of Ni-Co-OH/G-CNF//Graphene asymmetric supercapacitor
at different current values. (d) Energy and power diagram (Ragone plot) of Ni-Co-
OH/G-CNF//Graphene asymmetric supercapacitor. (c) Efficiency of Ni-Co-OH/G-
CNF//Graphene asymmetric supercapacitor at different current values. ..................... 104
Figure 5.7 Low magnification SEM images of (a) Graphene and carbon nanofibers. (b)
Nickel hydroxide. (c) Nickel-cobalt hydroxides on graphene and carbon nanofibers. All
are coated on carbon microfibers substrates. ..................................................................... 107
Figure 5.8 (a) Areal capacitance of Ni(OH)2//Graphene asymmetric supercapacitor at
different current values. (b) Areal energy and areal power of Ni(OH)2//Graphene
asymmetric supercapacitor..................................................................................................... 108
Figure 6.1 Fabrication of Ni(OH)2 μ-pseudocapacitor devices. (a)–(c) Schematic
illustration of the conventional photolithography process up to the metal layer
deposition. (d) CBD of Ni(OH)2 over the entire chip before the lift-off process. (e) Lift-
off using acetone after the CBD process. (f) Photographs showing the Ni(OH)2 μ-
pseudocapacitor devices fabricated on glass and PEN substrates. .................................. 117
Figure 6.2 (a) and (b) SEM images showing the Ni(OH)2 finger electrodes. The inset
shows the tilt view of the CBD of Ni(OH)2. (c) Zoom-in image shows the uniform
vertical growth of nanoflakes of Ni(OH)2 over the Ni/Pt/Ti current collectors, inset
shows the interconnected vertically grown Ni(OH)2 nanosheets. (d) XRD pattern and (e)
Raman spectrum of Ni(OH)2 grown by CBD. ......................................................................... 121
Figure 6.3 (a)-(c) Cyclic voltammograms of CBD Ni(OH)2 finger electrodes at different
scan rates in a two-electrode configuration in 1 M KOH electrolyte. The inset shows CV
data collected at higher scan rate of 500 V s–1. Schematic illustrating the d) in-plane
and (e) sandwich configuration of the Ni(OH)2 electrodes. (f) Comparison of CV data
for planar vs sandwich configurations of a Ni(OH)2 pseudosupercapacitor device at 40
mV s–1. ......................................................................................................................................... 122
Figure 6.4 (a)-(d) Cyclic voltammograms of a Ni(OH)2 μ-pseudocapacitor at different
scan rates in 1 M KOH electrolyte. (e) Charge–discharge curves at different current
densities. (f) Ragone plot showing the comparison of energy and power density of Li
thin-film batteries, electrolytic capacitors, carbon and metal oxide based μ-SCs with
respect to Ni(OH)2 μ-pseudocapacitor. ................................................................................. 124
Figure 6.5 Solid state flexible Ni(OH)2 pseudocapacitor. (a) and (b) CVs of the solid
state device with PVA/KOH gel electrolyte at different scan rates. (c) CV scan of the
device under normal and bent conditions at scan rate of 200 mV s-1, The inset shows a
photograph of the bent Ni(OH)2 pseudocapacitor device. (d) Charge–discharge curves
16
at current densities of 12 and 30 μA cm-2. (e) Nyquist plot of the solid state device. (f)
Electrochemical cycling stability of the device over 1000 cycles. .................................. 128
Figure 6.6 (a) and (b) CVs of the series connected Ni(OH)2 μ-pseudocapacitor at
different scan rates. Charge–discharge curves of the tandem configuration of
Ni(OH)2 μ-pseudocapacitor in (c) series and (d) parallel combinations. The inset shows
the red LED powered using a tandem configuration of the Ni(OH)2 μ-pseudocapacitor
devices. ....................................................................................................................................... 130
Figure 6.7 (a) Domain kind of growth of Ni(OH)2 over the Au/Ti/Glass surface. (b)
Uniform growth of Ni(OH)2 over the Ni/Ti/Glass surface. Inset shows the delamination
of Ni finger electrodes during the electrochemical measurements in 1M KOH
electrolyte. By using the tristakc (Ni/Pt/Ti) both uniform and well-adhering N(OH)2
nanosheets were observed, as shown in main mansucrip. The schematic shows the
difference in the nucleation process of Ni(OH)2 over the Au and Ni surfaces,
respectively during the CBD process. .................................................................................... 134
Figure 6.8 CVs of Ni(OH)2 thin film supercapacitor in sandwich geometry at scan rates
of 100 and 500 mV/s. At higher scan rate of 500 mV/s, the redox peaks are not
prominent in this sandwich geometry while in planar interdigitated configuration,
redox behavior is seen even at a scan rate of 500 V/s. ..................................................... 135
Figure 6.9 (a) CVs of bare Ni/Pt/Ti/glass interdigitated finger electrodes in 1M KOH
electrolyte. (b) Areal cell capacitance with frequency of Ni/Pt/Ti µ-SC. ..................... 136
Figure 6.10 (a) CV and (b) CD curves for the 1hr CBD Ni(OH)2 micropseudocapacitor.
..................................................................................................................................................... 136
Figure 6.11 Comparison of (a) CV and (b) CD curves of CBD vs. electrodeposited
Ni(OH)2 micropseudocapacitors. ............................................................................................ 137

17
LIST OF TABLES
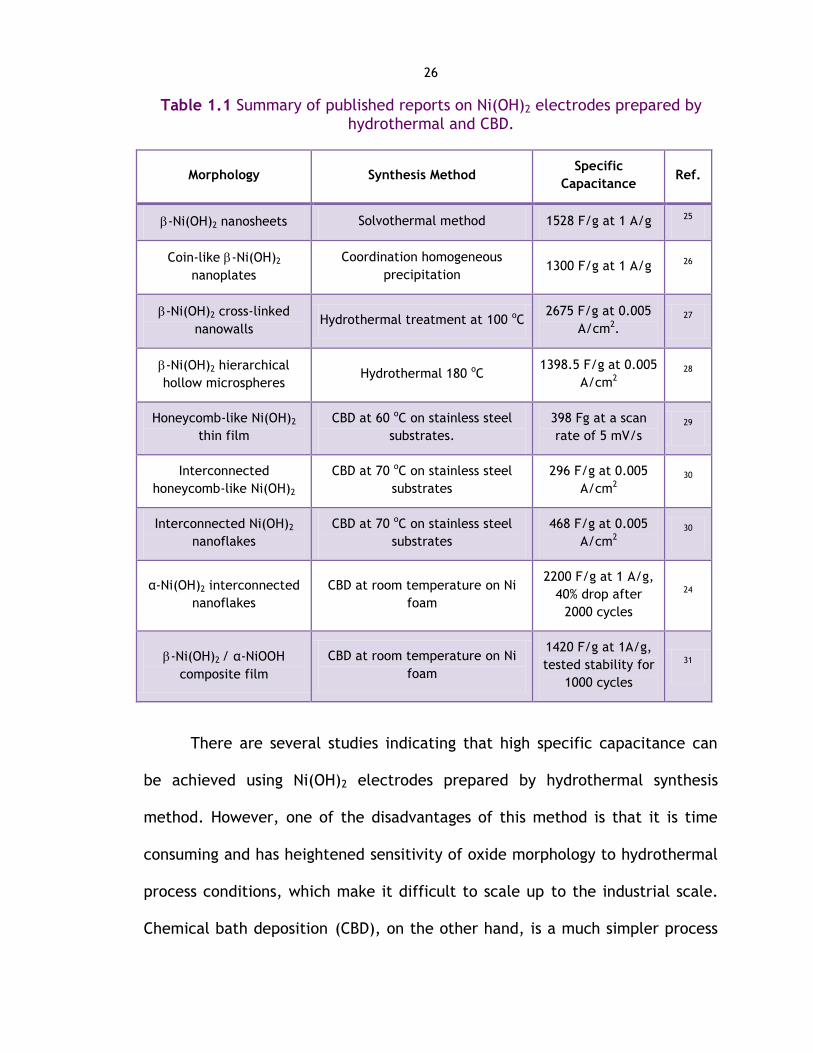
Table 1.1 Summary of published reports on Ni(OH)2 electrodes prepared by
hydrothermal and CBD. .............................................................................................................. 26
Table 1.2 Summary of published reports on Ni-Co-OH//graphene asymmetric
supercpators that thier Ni(OH)2 electrodes were prepared by CBD. ................................. 27
18
LIST OF PUBLICATIONS
1. Nuha A. Alhbeshi and H. N. Alshareef, Flexible and low-cost asymmetric
supercapacitors based on Ni-Co-OH and Graphene-carbon Nanofibers
Electrodes, to be submitted.
2. Nuha A. Alhebshi and H. N. Alshareef, Ternary Ni-Cu-OH and Ni-Co-OH
Electrodes for Electrochemical Energy Storage, Materials for Renewable
and Sustainable Energy, 4(4), 1-9, doi: 10.1007/s4024301500647 (2015).
3. N. Kurra*, Nuha A. Alhebshi* and H. N. Alshareef, Microfabricated
Pseudocapacitors Using Ni(OH)2 Electrodes Exhibit Remarkable
Volumetric Capacitance and Energy Density. Advanced Energy
Materials, 5, 1401303, doi: 10.1002/aenm.201401303 (2015),
*Contributed equally.
4. R. B. Rakhi, Nuha A. Alhebshi, D. H. Anjum and H. N. Alshareef,
Nanostructured cobalt sulfide-on-fiber with tunable morphology as
electrodes for asymmetric hybrid supercapacitors. Journal of Materials
Chemistry A, 2, 16190-16198, doi: 10.1039/C4TA03341H (2014).
5. Nuha A. Alhebshi, R. B. Rakhi and H. N. Alshareef, Conformal coating of
Ni(OH)2 nanoflakes on carbon fibers by chemical bath deposition for
efficient supercapacitor electrodes. Journal of Materials Chemistry A,
1, 14897-14903, doi: 10.1039/C3TA12936E (2013).
19
Chapter 1 . INTRODUCTION
1.1. MOTIVATION
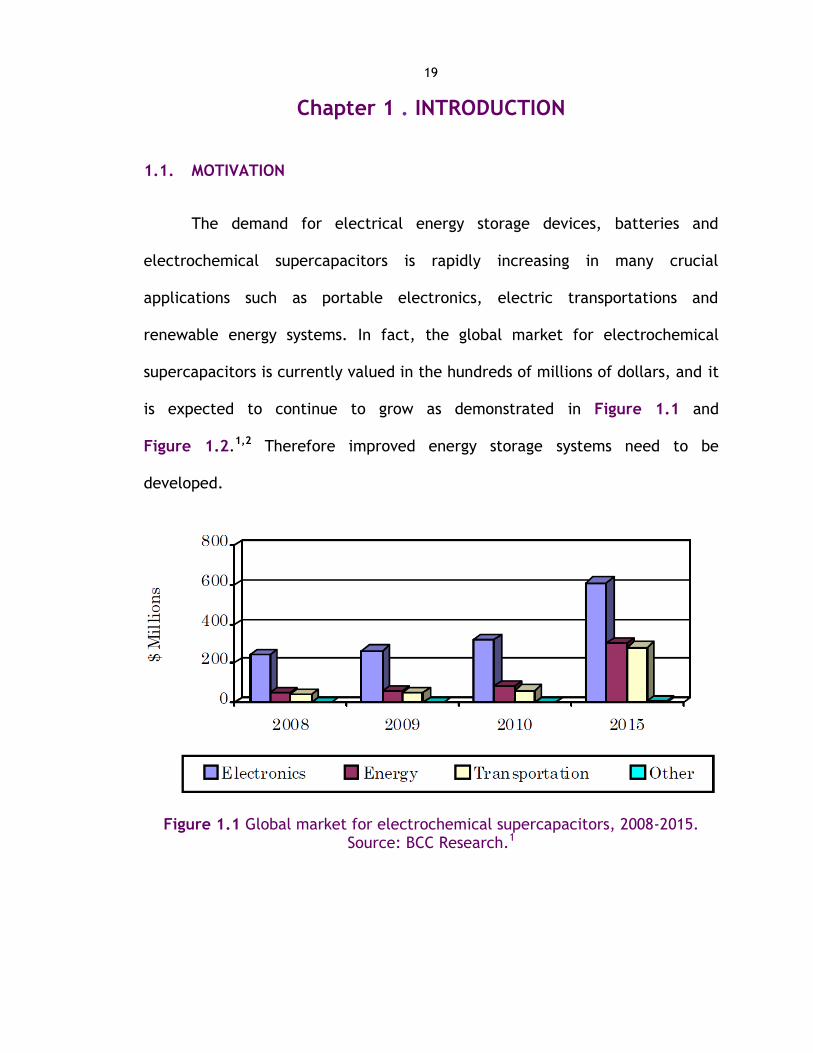
The demand for electrical energy storage devices, batteries and
electrochemical supercapacitors is rapidly increasing in many crucial
applications such as portable electronics, electric transportations and
renewable energy systems. In fact, the global market for electrochemical
supercapacitors is currently valued in the hundreds of millions of dollars, and it
is expected to continue to grow as demonstrated in Figure 1.1 and
Figure 1.2.1,2 Therefore improved energy storage systems need to be
developed.
Figure 1.1 Global market for electrochemical supercapacitors, 2008-2015. Source: BCC Research.1

20
Figure 1.2 Global market for electrochemical supercapacitors, 2012-2019. Source: BCC Research.2
Electrochemical supercapacitors can be useful in many applications
either as stand-alone (e.g., in regenerative braking systems) or in combination
with batteries (e.g., in electric vehicles).3 In addition, electrochemical
supercapacitors find applications as uninterruptible power supplies, DC power
systems, mobile devices and rechargeable toy and camera motors. As a specific
example, electrochemical supercapacitors are considered an alternating power
source in solar watches where electrochemical supercapacitors power the
watch for several nights after being completely charged during days.4
1.2. BACKGROUND
Electrochemical supercapacitors are energy storage devices that
electrochemically store electrical charges with superior capacitance than that
21
of electrostatic capacitors. Electrostatic capacitors consist of two parallel
conductive sheets, called electrodes, separated by an insulator, called
dielectric. When a voltage difference is applied between the electrodes, the
dielectric will be polarized. Therefore, electrical energy is stored on the
electrodes by electrostatic force.5 The capacitance of parallel-plate
electrostatic capacitors can be calculated by:
Equation 1.1
where A is electrode area, is dialectic permittivity and d is the distance
between electrodes (the thickness of the dielectric). The capacitance of
electrostatic capacitors ranges from nanofarads to millifarads, while the
capacitance of electrochemical supercapacitors ranges from millifarads to
kilofarads due to the superior surface area of porous electrodes used in
electrochemical supercapacitors.5
Electrochemical supercapacitors can be classified into electrical double
layer capacitors (EDLC) and Faradic capacitors (FC), also known as
pseudocapacitors. In EDLC, electrical charges are held at the interfacial double
layer between a porous electrode and a liquid electrolyte as illustrated in
Figure 1.3.5 Electrode materials used in EDLC should be porous with large
surface to achieve larger capacitance, with the ideal pore size in the range of
few nanometers.5 The electrode material should also be electrically conducting
to facilitate electron flow to the collector.

22
Figure 1.3 Sketch of electrical charge storage mechanism in EDLC.
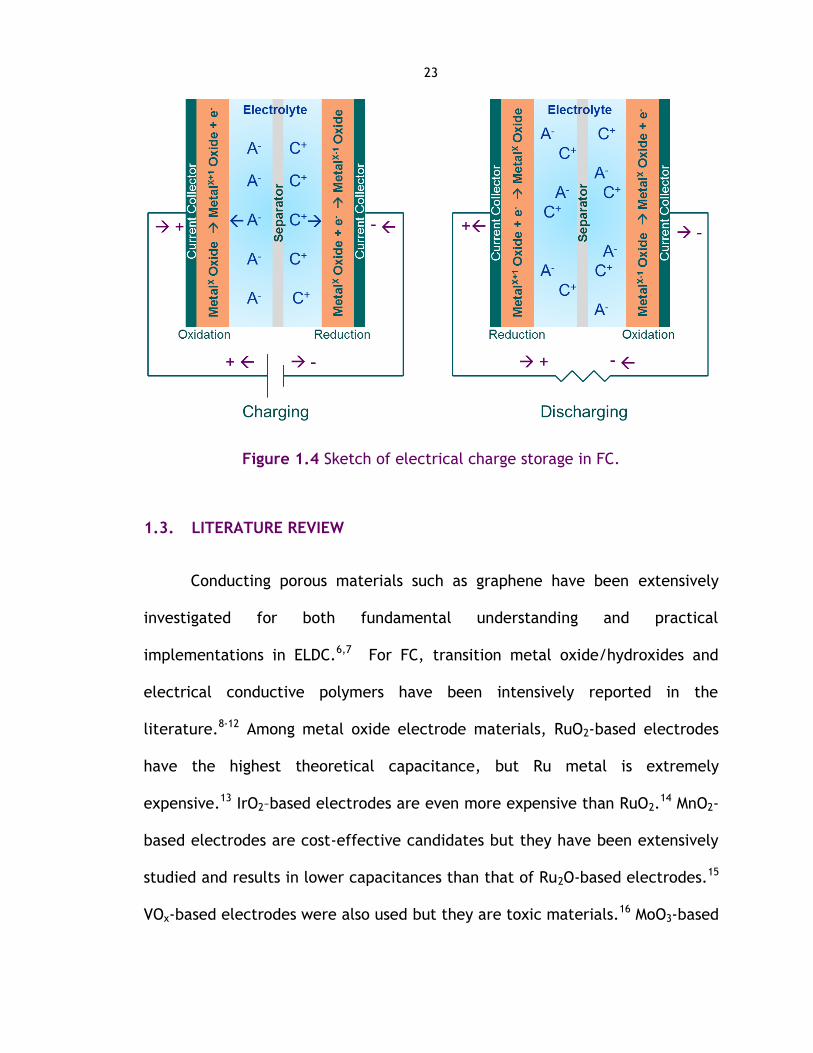
In Faradic capacitors, electrical charges are stored through Faradic
oxidation-reduction (redox) reactions depending upon the electrode potential
as illustrated in Figure 1.4.5 The preferred Faradic electrode materials should
have multi-oxidation states in order to facilitate reversible oxidation and
reduction during the charging and discharging processes. Due to the differences
in the energy storage mechanisms between EDLC and FC, the latter normally
exhibit higher capacitance but weaker cyclic stability than those of ELDC. The
supercapacitor community has recently become interested in combining both
porous materials and transition metals into the same electrode (called a hybrid
electrode) in order to leverage the large surface areas of porous electrodes and
the higher capacitance of some pseudocapacitive (Faradic) materials.
23
Figure 1.4 Sketch of electrical charge storage in FC.
1.3. LITERATURE REVIEW
Conducting porous materials such as graphene have been extensively
investigated for both fundamental understanding and practical
implementations in ELDC.6,7 For FC, transition metal oxide/hydroxides and
electrical conductive polymers have been intensively reported in the
literature.8-12 Among metal oxide electrode materials, RuO2-based electrodes
have the highest theoretical capacitance, but Ru metal is extremely
expensive.13 IrO2–based electrodes are even more expensive than RuO2.14 MnO2-
based electrodes are cost-effective candidates but they have been extensively
studied and results in lower capacitances than that of Ru2O-based electrodes.15
VOx-based electrodes were also used but they are toxic materials.16 MoO3-based
24
electrodes exhibit lower specific capacitance than the previous oxides.17 NiO-
based electrodes18,19 and Co3O4-based electrodes and their hydroxides20 have
higher specific capacitances than MnO2 and MoO3, lower cost than RuO2, much
lower toxicity than VOx, and relatively fewer studies than MnO2 -based
electrodes.
Nickel hydroxide (Ni(OH)2) is one of the most promising electrode materials
for energy storage device due to its electrochemical redox reactivity,21 natural
abundance, environmental friendliness and low cost. Ni(OH)2 has been typically
used for alkaline rechargeable batteries because its Faradic discharge behavior
is characterized by a flat (constant) voltage region over a long discharge time
(in hours).22 The electrical charges are stored on Ni(OH)2 electrodes during
Faradic oxidation-reduction reaction:
NiOOH + e- + H2O ↔ Ni(OH)2 + OH- Equation 1.2
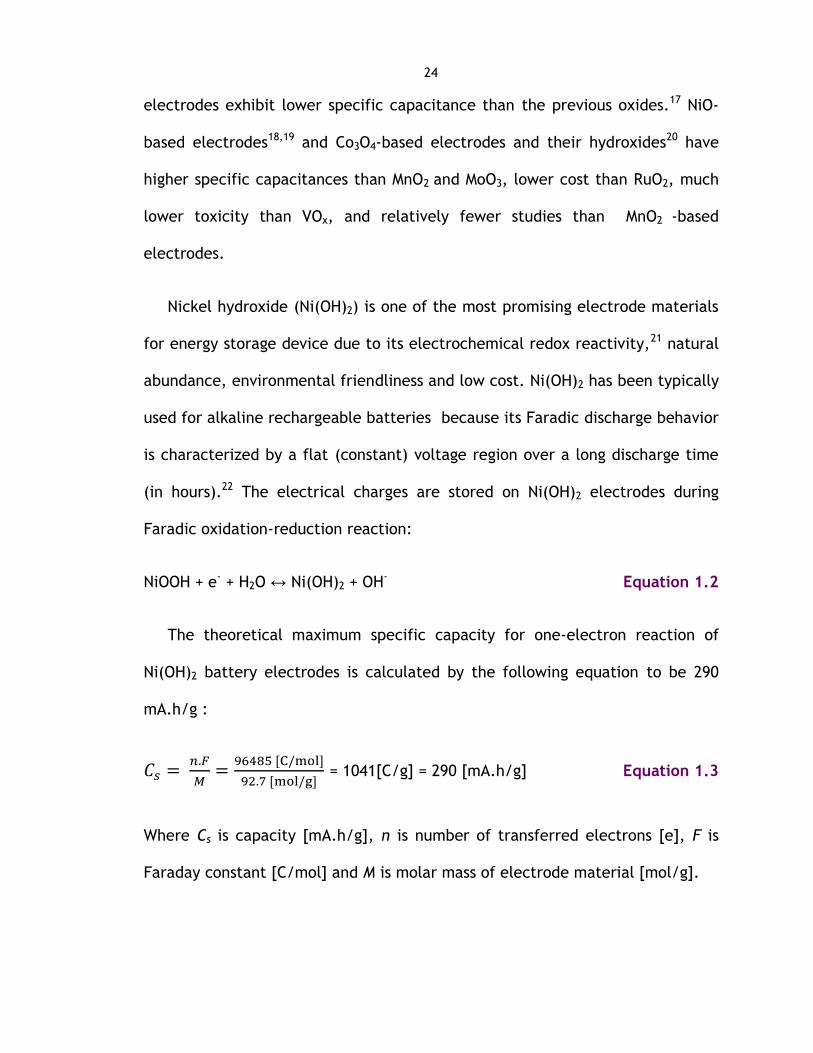
The theoretical maximum specific capacity for one-electron reaction of
Ni(OH)2 battery electrodes is calculated by the following equation to be 290
mA.h/g :
= 1041[C/g] = 290 [mA.h/g] Equation 1.3
Where Cs is capacity [mA.h/g], n is number of transferred electrons [e], F is
Faraday constant [C/mol] and M is molar mass of electrode material [mol/g].
25
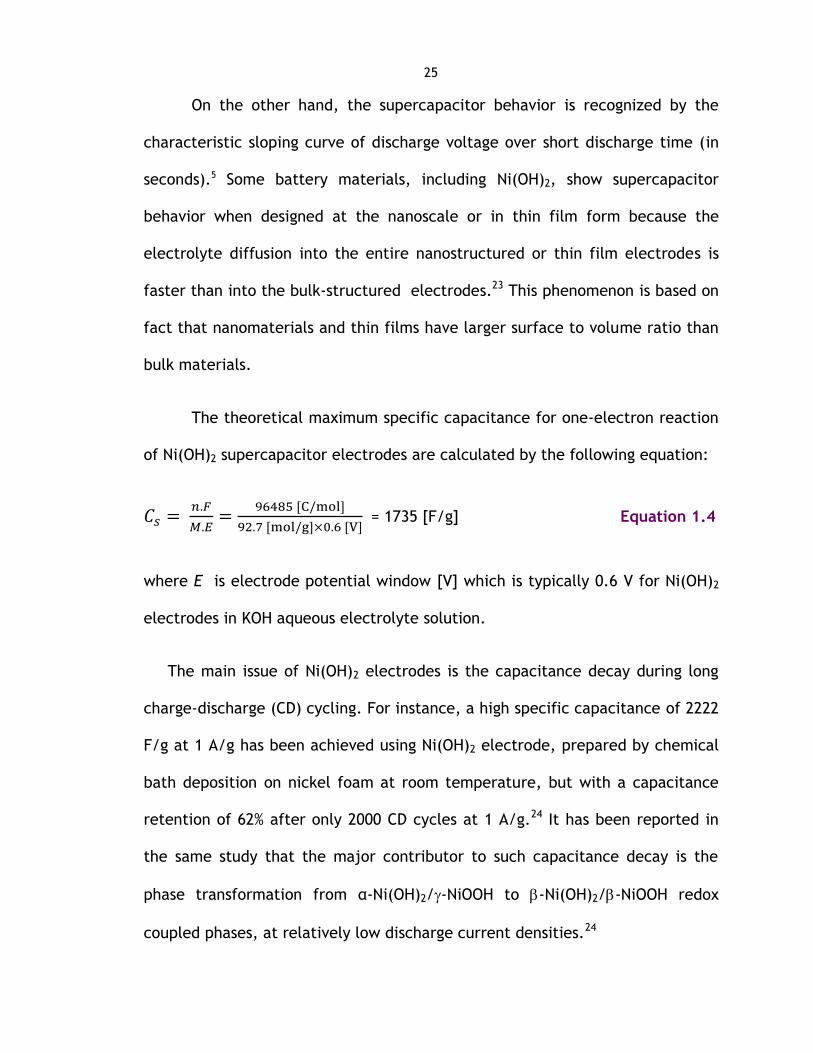
On the other hand, the supercapacitor behavior is recognized by the
characteristic sloping curve of discharge voltage over short discharge time (in
seconds).5 Some battery materials, including Ni(OH)2, show supercapacitor
behavior when designed at the nanoscale or in thin film form because the
electrolyte diffusion into the entire nanostructured or thin film electrodes is
faster than into the bulk-structured electrodes.23 This phenomenon is based on
fact that nanomaterials and thin films have larger surface to volume ratio than
bulk materials.
The theoretical maximum specific capacitance for one-electron reaction
of Ni(OH)2 supercapacitor electrodes are calculated by the following equation:
= 1735 [F/g] Equation 1.4
where E is electrode potential window [V] which is typically 0.6 V for Ni(OH)2
electrodes in KOH aqueous electrolyte solution.
The main issue of Ni(OH)2 electrodes is the capacitance decay during long
charge-discharge (CD) cycling. For instance, a high specific capacitance of 2222
F/g at 1 A/g has been achieved using Ni(OH)2 electrode, prepared by chemical
bath deposition on nickel foam at room temperature, but with a capacitance
retention of 62% after only 2000 CD cycles at 1 A/g.24 It has been reported in
the same study that the major contributor to such capacitance decay is the
phase transformation from α-Ni(OH)2/-NiOOH to -Ni(OH)2/-NiOOH redox
coupled phases, at relatively low discharge current densities.24
26
Table 1.1 Summary of published reports on Ni(OH)2 electrodes prepared by hydrothermal and CBD.
Morphology Synthesis Method Specific
Capacitance Ref.
-Ni(OH)2 nanosheets Solvothermal method 1528 F/g at 1 A/g 25
Coin-like -Ni(OH)2
nanoplates
Coordination homogeneous
precipitation 1300 F/g at 1 A/g 26
-Ni(OH)2 cross-linked
nanowalls Hydrothermal treatment at 100 oC
2675 F/g at 0.005
A/cm2. 27
-Ni(OH)2 hierarchical
hollow microspheres Hydrothermal 180 oC
1398.5 F/g at 0.005
A/cm2 28
Honeycomb-like Ni(OH)2
thin film
CBD at 60 oC on stainless steel
substrates.
398 Fg at a scan
rate of 5 mV/s 29
Interconnected
honeycomb-like Ni(OH)2
CBD at 70 oC on stainless steel
substrates
296 F/g at 0.005
A/cm2 30
Interconnected Ni(OH)2
nanoflakes
CBD at 70 oC on stainless steel
substrates
468 F/g at 0.005
A/cm2 30
α-Ni(OH)2 interconnected
nanoflakes
CBD at room temperature on Ni
foam
2200 F/g at 1 A/g,
40% drop after
2000 cycles
24
-Ni(OH)2 / α-NiOOH
composite film
CBD at room temperature on Ni
foam
1420 F/g at 1A/g,
tested stability for
1000 cycles
31
There are several studies indicating that high specific capacitance can
be achieved using Ni(OH)2 electrodes prepared by hydrothermal synthesis
method. However, one of the disadvantages of this method is that it is time
consuming and has heightened sensitivity of oxide morphology to hydrothermal
process conditions, which make it difficult to scale up to the industrial scale.
Chemical bath deposition (CBD), on the other hand, is a much simpler process

27
and can be performed at room temperatures. It is also highly scalable
suggesting that it has the potential to be more cost effective compared with
other chemical synthesis methods. Substrates used in CBD can be conductive or
nonconductive materials in contrast to those used in electrodeposition. The
first study of using CBD for NiO preparation was carried out by Pramanik et al.32
The chemical bath used in that study, an aqueous mixture of nickel sulfate,
potassium persulfate and ammonia solution, was later used by others to
prepare Ni(OH)2 and NiO.33 Table 1.1 summarizes reported performance for
Ni(OH)2 electrochemical capacitors electrodes prepared by hydrothermal and
CBD.
Table 1.2 Summary of published reports on Ni-Co-OH//graphene asymmetric supercpators that thier Ni(OH)2 electrodes were prepared by CBD.
Positive //Negative
Electrode Synthesis Methods
Specific
Capacitance
Voltage -
Electrolyte Ref.
Ni(OH)2/CNT//rGO Modified hummers method for CNT
CBD for Ni(OH)2
78.33 F/g
At 2 A/g
1.8 V
in KOH
34
Ni(OH)2/CNT//AC CVD for CNT
CBD for Ni(OH)2
110.6 F/g
at 5 mA/cm2
1.8 V
in KOH
35
Ni-Co-OH//rGO Chemical reduction for rGO CBD for
Ni-Co-OH
84.3 F/g
at 5 mV/s
1.5 V
in KOH
36
Co3O4/Ni(OH)2//rGO
Chemical reduction for rGO
Hydrothermal for Co3O4
CBD for Ni(OH)2
95.7 F/g
at 5 mA/cm2
1.7 V
in KOH
37
Another capacitive device structure that has become interesting recently
is the asymmetric supercapacitor.38 Asymmetric supercapacitors consist of two
28
dissimilar types of electrodes: double layer electrode and one Faradic
electrode. For example, a typical two-electrode asymmetric device
construction includes a carbon-based electrode and a Faradic electrode
material. The main feature of asymmetric supercapacitors is a wider cell
voltage than symmetric supercapacitors hence getting higher energy in addition
to utilization of both storage mechanisms of electrical double layer by porous
materials and redox reactions by metal oxides/hydroxides.
An asymmetric supercapacitor of Ni(OH)2/CNT//reduced graphene oxide (rGO),
prepared by modified hummers method and CBD, has been reported with a specific
capacitance of 78.33 F/g and a specific energy of 35.24 Wh/kg at 2 A/g.34 Similar
asymmetric supercapacitor of Ni(OH)2/CNT//activated carbon (AC), prepared by
chemical vapor deposition (CVD) and CBD, has been reported with a specific energy of
50.6 Wh/kg and a cyclic stability of 17% Cs loss after 3000 cycles.35 It has been
achieved a higher specific energy, 77.8 Wh/kg, for a Ni(OH)2/rGO//porous graphene
asymmetric supercapacitor, with a cell voltage of 1.6 V, specific capacitance of 218.4
F/g and 5.7% Cs loss after 3000 cycles.39 Ni-Co-OH//rGO asymmetry supercapacitor,
prepared by CBD and chemical reduction, has been reported with a cell voltage of 1.5
V and a specific power range from 0.32 kW/kg to 5 kW/kg.36 Co3O4/Ni(OH)2//rGO
asymmetric supercapacitor, prepared by CBD, hydrothermal and chemical reduction,
has been reported with a specific capacitance of 95.7 F/g at 5 mA/cm2.37 Table 1.2
shows a summary of published reports on Ni-Co-OH//graphene asymmetric
supercapacitors that their Ni(OH)2 electrodes were prepared by CBD.
29
1.4. OBJECTIVES
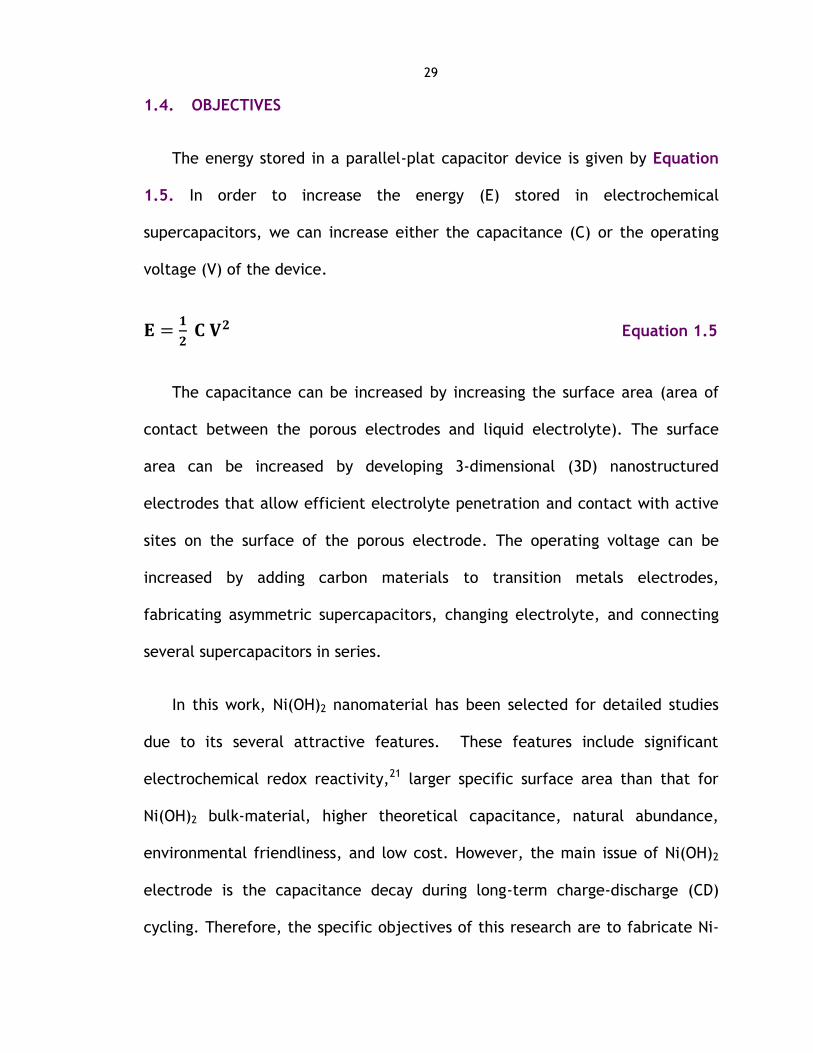
The energy stored in a parallel-plat capacitor device is given by Equation
1.5. In order to increase the energy (E) stored in electrochemical
supercapacitors, we can increase either the capacitance (C) or the operating
voltage (V) of the device.
Equation 1.5
The capacitance can be increased by increasing the surface area (area of
contact between the porous electrodes and liquid electrolyte). The surface
area can be increased by developing 3-dimensional (3D) nanostructured
electrodes that allow efficient electrolyte penetration and contact with active
sites on the surface of the porous electrode. The operating voltage can be
increased by adding carbon materials to transition metals electrodes,
fabricating asymmetric supercapacitors, changing electrolyte, and connecting
several supercapacitors in series.
In this work, Ni(OH)2 nanomaterial has been selected for detailed studies
due to its several attractive features. These features include significant
electrochemical redox reactivity,21 larger specific surface area than that for
Ni(OH)2 bulk-material, higher theoretical capacitance, natural abundance,
environmental friendliness, and low cost. However, the main issue of Ni(OH)2
electrode is the capacitance decay during long-term charge-discharge (CD)
cycling. Therefore, the specific objectives of this research are to fabricate Ni-

30
based electrochemical supercapacitors with high capacitance, wide operating
voltage window, good stability, and low cost. In addition, we will evaluate this
material in conventional and microfabricated device structures and study their
synthesis-structure-property relationships in Ni(OH)2 electrodes and
electrochemical devices.
1.4.1. Conventional Supercapacitors
Conventional conducting planar substrates such as stainless steel and
carbon paper are usually used as current collectors in reported and commercial
supercapacitors. In this work, we focus on preparing Ni-based electrodes by
optimizing CBD conditions to achieve the desired nanostructure and surface
area on 3-dimensional current collectors. In particular, we optimized the
process to develop conformal coatings on of flexible carbon microfibers by
controlling process conditions such as solution composition and deposition
time.
The microfibers conformally-coated with Ni(OH)2 make direct physical
contacts with essentially every single nanosheet since the nanosheets nucleate
directly out of the microfiber surface. In this way, nanosheets make direct
electrical contact with conducting carbon microfibers, leading to more
efficient electron transport. Using this strategy, we are able to develop
uniform 3-dimensional nanostructured electrodes with larger surface area and
higher capacitance than 2- dimensional planar Ni(OH)2 electrodes.
31
In order to improve cycling stability, we studied doping the Ni(OH)2
electrodes with various types of dopants including Cu, Co, graphene and carbon
nanofibers. In order to increase the operation voltage and energy density, we
focus on fabricating Ni-based asymmetric supercapacitors in which the positive
electrode contains Ni-based nanomaterials and the negative electrodes
contains graphene.
1.4.2. On-chip Supercapacitors
Supercapacitors can be designed and fabricated at micro-scale level and
used as on-chip devices. In this work, we focus on employing a combination of
top-down photolithographic process and bottom-up chemical bath deposition
(CBD) to fabricate Ni-based on-chip supercapacitors, also known as -
supercapacitors. In particular, we optimized the process to develop a uniform
Ni(OH)2 nanosheets over Pt/Ti/glass current collectors by inserting different
additional thin layers, such as Ni and Au, between Ni(OH)2 and Pt/Ti/glass.
In fact, the small separation distance (in micro-scale) between micro-
interdigitated finger electrodes is the key parameter in the fast movement of
the electrolyte ions, leading to high-rate redox activity. Using this strategy,
we are able to develop Ni-based on-chip supercapacitors with higher redox rate
activity than the conventional supercapacitors (that have a separation distance
in milli-scale between the electrodes).

32
In addition, we fabricate flexible on-chip supercapacitors by depositing
Ni(OH)2/Ni/Pt/Ti on polyethylene naphthalate (PEN) plastic substrate instead
of glass. In order to further increase the operation voltage and potential
applications, we use series-connected capacitors for powering a light emitting
diodes.

33
Chapter 2 . EXPERIMENTAL TECHNIAUES
2.1. MATERIALS SYNTHESIS TECHNIQUES
2.1.1. Chemical Bath Deposition
One of the simplest and cost-effective techniques for depositing
nanomaterials on substrates is chemical bath deposition (CBD). It can be
performed at very low temperatures in contrast with hydrothermal method.40
Substrates used in CBD can be conductive or nonconductive materials in
contrast with that used in electrodeposition.40 In addition, CBD is considered as
an inexpensive technique that is suitable for large-scale production.40 The first
study of using CBD for NiO preparation was done by Pramanik et al.32 The
chemical bath used in that study, an aqueous mixture of nickel sulfate,
potassium persulfate and ammonia solution, were later used by others to
prepare Ni(OH)2 and NiO.41
Figure 2.1 Sketch and photograph of chemical bath deposition (a) on carbon microfibers substrate. (b) on metallic substrate.
(a) CBD on carbon substrate (b) CBD on metallic substrate
34
In the research of this dissertation, carbon microfibers substrates,
metallic substrates and flexible substrates were immersed in chemical bath
containing a clear-green mixture of 1 M of nickel(II) sulfate hexahydrate
(NiSO4.6H2O), 0.15 M of potassium persulfate (K2S2O8) in deionized (DI) water
(H2O) at room temperature. Ammonium hydroxide solution (30-33% NH3 in H2O)
was then added to the mixture drop by drop with stirring for few seconds. As
the reactions progressed, the mixture became dense, and the color turned into
dark blue. The solution was then kept at room temperature. To optimize the
synthetic conditions for the deposition of conformal Ni(OH)2, the same
procedure was repeated for different deposition times of 1h, 2h and 5h and at
different ammonium hydroxide concentrations of 1.5 mL, 3 mL and 5 mL. The
chemically coated substrates were afterwards taken out, washed by DI H2O
several times and dried at room temperature for 1h in air.
The fundamental chemistry of Ni(OH)2 formation can be explained by a
simple reaction involving the release of nickel cations and hydroxyl group
anions from the precursors undergoing nucleation and precipitation of Ni(OH)2
nanoparticles. This mechanism has been well-established in the literature 41, 42
and is can be represented by the simple reaction:
Ni2+ + 2OH- → Ni(OH)2 Equation 2.1
2.1.2. Chemical Exfoliation
One of the simplest and cost-effective techniques for preparing
graphene is the chemical exfoliation of graphite.43 Chemical exfoliation is an
35
environmentally friendly method as it does not require strong acids in contrast
with Hummer’s method, or high temperature and high pressure in contrast with
hydrothermal method. In addition, it can produce large quantity of high
electrical conductive graphene since it is exfoliated directly from graphite
without forming graphene oxide.43 The fundamental principle of chemical
exfoliation process depends on the intercalation of a chemical material such as
1-pyrenecarboxylic acid (PCA) into graphite sheets by sonication.43 Using
longer sonication time, the graphene nanosheets can be scrolled onto
themselves forming carbon nanofibers or nanoscrolls.44
Graphene and carbon nanofibers (G-CNF) were prepared by chemical
exfoliation in this research. A mixture of 100 mg of graphite and 16.5 mg of PCA
in 50 mL of methanol were sonicated for 45 minutes (BRANSON Ultrasonic
Cleaner 2510). Then, additional 200 mL of DI H2O was added to the mixture
with continuous sonication for several hours. G-CNF were collected by vacuum
filtering using nanoporous membrane (Celgard 3501). The collected G-CNF were
dissolved in ethanol and casted drop by drop on carbon microfibers substrate at
60oC followed by washing with DI H2O several times and drying in air overnight.
2.1.3. Photolithography
In order to fabricate micro-supercapacitors that can be integrated as on-
chip energy storage in portable electronic devices, micro-electrodes should be
designed. Photolithography is an optical printing technique that transfers a
design pattern on a substrate.45 The fundamental principle of photolithography
36
depends on the light exposure such as ultra-violet (UV) through a micro-
fabricated mask, which is an transparent substrate with selective opaque
areas, on a substrate coated by a photoresist layer, which is a photosensitive
materials such as methoxy-propyl acetate (PGMEA).45
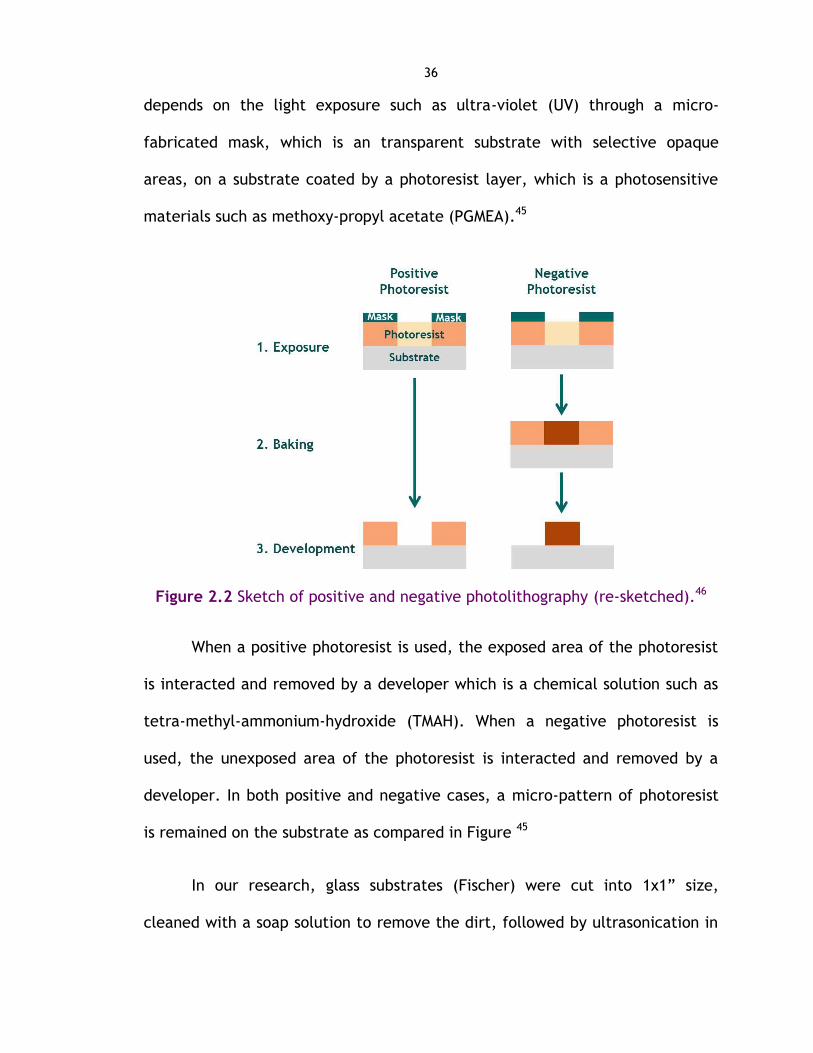
Figure 2.2 Sketch of positive and negative photolithography (re-sketched).46
When a positive photoresist is used, the exposed area of the photoresist
is interacted and removed by a developer which is a chemical solution such as
tetra-methyl-ammonium-hydroxide (TMAH). When a negative photoresist is
used, the unexposed area of the photoresist is interacted and removed by a
developer. In both positive and negative cases, a micro-pattern of photoresist
is remained on the substrate as compared in Figure 45
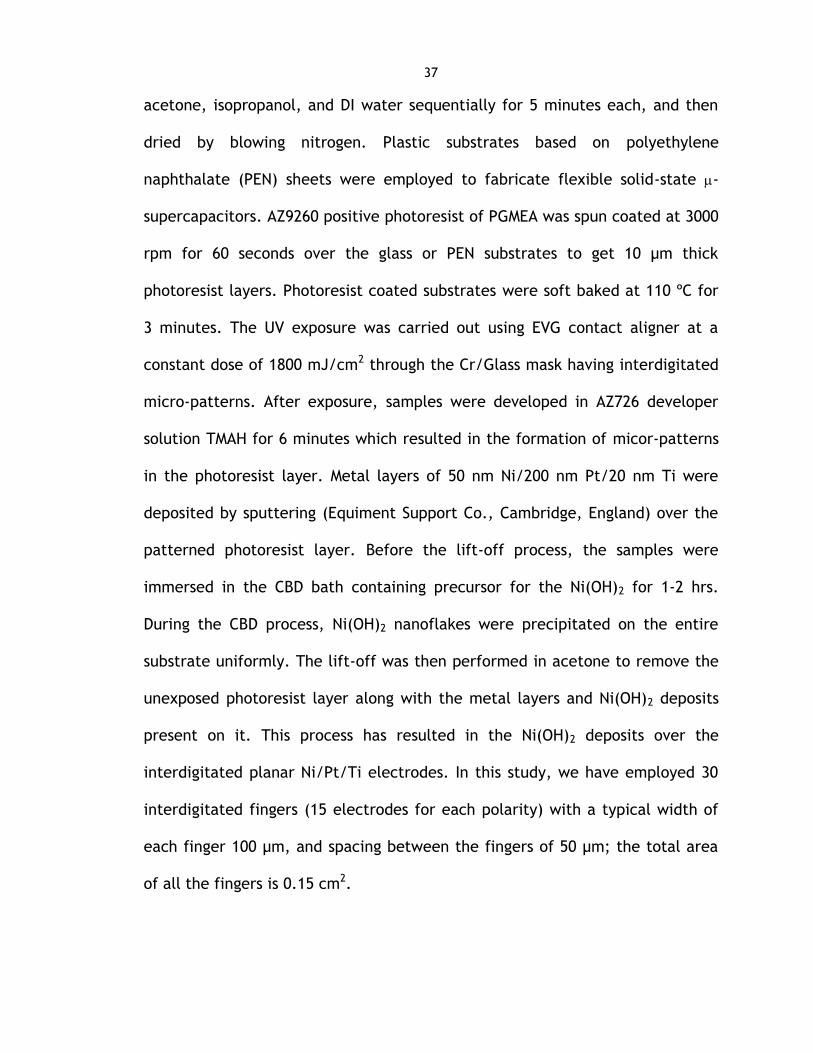
In our research, glass substrates (Fischer) were cut into 1x1” size,
cleaned with a soap solution to remove the dirt, followed by ultrasonication in
37
acetone, isopropanol, and DI water sequentially for 5 minutes each, and then
dried by blowing nitrogen. Plastic substrates based on polyethylene
naphthalate (PEN) sheets were employed to fabricate flexible solid-state -
supercapacitors. AZ9260 positive photoresist of PGMEA was spun coated at 3000
rpm for 60 seconds over the glass or PEN substrates to get 10 µm thick
photoresist layers. Photoresist coated substrates were soft baked at 110 ºC for
3 minutes. The UV exposure was carried out using EVG contact aligner at a
constant dose of 1800 mJ/cm2 through the Cr/Glass mask having interdigitated
micro-patterns. After exposure, samples were developed in AZ726 developer
solution TMAH for 6 minutes which resulted in the formation of micor-patterns
in the photoresist layer. Metal layers of 50 nm Ni/200 nm Pt/20 nm Ti were
deposited by sputtering (Equiment Support Co., Cambridge, England) over the
patterned photoresist layer. Before the lift-off process, the samples were
immersed in the CBD bath containing precursor for the Ni(OH)2 for 1-2 hrs.
During the CBD process, Ni(OH)2 nanoflakes were precipitated on the entire
substrate uniformly. The lift-off was then performed in acetone to remove the
unexposed photoresist layer along with the metal layers and Ni(OH)2 deposits
present on it. This process has resulted in the Ni(OH)2 deposits over the
interdigitated planar Ni/Pt/Ti electrodes. In this study, we have employed 30
interdigitated fingers (15 electrodes for each polarity) with a typical width of
each finger 100 µm, and spacing between the fingers of 50 µm; the total area
of all the fingers is 0.15 cm2.
38
2.2. MATERIALS CHARECRIZATION TECHNIQUES
2.2.1. Scanning Electron Microscope
Scanning electron microscope (SEM) is considers as one of the most
powerful techniques for characterizing the surface morphology of bulk and
nanomaterials. The working principle of SEM is based on scanning a small-
diameter electron probe with a focused primary electrons over the sample.
Then, secondary electrons from each atom on the specimen are emitted,
detected, amplified and forming an image of the scanned area.47 In addition to
the secondary electrons, X-ray is emitted from the sample when a higher-
energy electron beam interacts with sample atoms. Such energy dispersive X-
ray spectroscopy (EDXS) is characteristic for each element so that it is used to
determine the elements present in the sample.
We have used Nova Nano SEM 630 (FEI Company) with Everhart-Thornley
detector (ETD) as secondary electrode detector. A lower accelerating voltage
of 5 kV was used in order to confined the beam interaction with the sample to
regions very close the surface. Therefore, the images are much rich in surface
details compared to those images that could be obtained at higher accelerating
voltage (15-30 kV) where the beam penetrates in depth of the sample. In
addition, a short working distance (WD) of around 5 mm was obtained in order
to reduce the probe size and hence increase the resolution. In addition, the
elemental spectra and mapping distribution in Ni-Cu-OH and Ni-Co-OH samples
was confirmed by EDXS equipped with SEM using higher acceleration voltage of

39
10 kV as X-ray requires higher energy to be emitted from the sample atoms
than the secondary electrons.
2.2.2. X-ray Diffraction
X-ray diffraction (XRD) is considered as one of the fundamental
techniques to characterize the crystal structure. The physical fundamental of
XRD is based on the path deference between the X-ray waves scattered by
atoms from adjacent lattice planes (hkl) of spacing dhkl.48 The resultant
intensity peaks on XRD pattern at each measured angle shows the condition of
the constructive interference according to Bragg’s law:
𝑛 2𝑑ℎ𝑘𝑙 𝑠𝑖𝑛𝜃 Equation 2.2
where n is an integer represents the order of diffraction, is the wavelength of
the X-ray source, and is the angle between the incidence and diffraction to
the lattice planes.48
For the crystal structure characterization of our samples, D8 Advance
XRD System (Bruker Corporation) equipped with Cu Kα X-ray source (λ =
0.15406 nm) was used. The XRD measurement that was used is theta/2theta
scan measurement where the X-ray source and detector are coupled to move
simultaneously while the sample location is fixed. As each crystal structure and
phase have characteristic XRD patterns, our resultant patterns were compared
to database sheets in order to determine the crystal structure and the phases
present in our samples.
40
2.2.3. Transmission Electron Microscope
In order to further characterize the crystal structure, high resolution
transmission electron microscope (HRTEM) and selected area electron
diffraction (SAED) were used. The main working principle depends on
transmitting a high accelerated electrons beam through a thin sample. If the
sample is crystalline, the electrons are diffracted by atomic planes inside the
sample.47 Arrangements of atoms and interplanar distance can be seen and
measured by HRTEM images. SAED resultant patterns can be considered as
analogue to the patterns of X-ray diffraction.47
We have used Titan Super Twin G2 60-300 TEM (FEI Company) with a
high accelerating voltage of 300 kV. Such higher-energy electrons can
penetrate distances of several microns into the sample in contrast with SEM.
2.2.4. Raman Spectroscopy
Raman spectroscopy technique is widely used in order to characterize
the molecular structure of the materials. The physical principal of Raman
spectroscopy is based on the inelastic scattering of the electromagnetic
radiation of a source by the molecules of a sample.49 Raman spectrum records
the frequency changes between radiation and scattering frequency which is
called Raman Shifts. Such frequency changes corresponds to the energy
difference between the initial and final energy level of molecular vibration
excited by the photon energy of the incident radiation.49

41
Raman spectroscopy (LabRAM ARAMIS, Horiba-Jobin Yvon) was used in
this research and acquired with notch filters cutting at 100 cm-1 using a He-Ne
laser (633 nm, 5 mW at source) and a laser spot size of 1.5 μm.
2.3. ELECTROCHEMICAL PERFORMANCE TECHNIQUES
2.3.1. Cyclic Voltammetry
Cyclic voltammetry (CV) is widely used to study the redox reaction
reversibility and determine the voltage window of electrodes or devices. The
principle of CV is to measure the resulting current simultaneously when
applying a linear voltage to an electrode or a device between two preset
voltage limits.50
In the research of this dissertation, CHI 660D and VMP3 multichannel
electrochemical workstations (CH Instruments Incorporation and Bio-Logic)
were used for CV experiments. CV experiments were carried out at different
scan rates selected from 1 mV/s to 100 mV/s for conventional supercapacitors
and from 10 mV/s to 500 V/s for on-ship micro-supercapacitors.
2.3.2. Galvanostatic Cycling (Chronopotentiometry)
Galvanostatic cycling (CD) is widely used to calculate the capacitance
and cycling stability of electrodes or devices. The principle of CD is to measure
the resulting voltage simultaneously when applying a constant current to an
electrode or a device between two preset voltage limits.50

42
CHI 660D and VMP3 multichannel electrochemical workstations (CH
Instruments Incorporation and Bio-Logic) were used for our CD experiments. CD
experiments were carried out at different current densities selected from 1 A/g
to 20 A/g for conventional supercapacitors and from 50 µA/cm2 to 250 µA/cm2
for on-ship micro-supercapacitors.
2.3.3. Electrochemical Impedance Spectroscopy
The equivalent series resistance, charge transfer resistance and diffusion
impedance of electrochemical devices can be studied by electrochemical
impedance spectroscopy (EIS). The main difference between EIS and CV that in
EIS a sinusoidal voltage signal is imposed at a range of frequencies and the
resulting current is measured, while a linear voltage is applied in CV.50
CHI 660D and VMP3 multichannel electrochemical workstations (CH
Instruments Incorporation and Bio-Logic) were used for our EIS experiments. EIS
experiments were performed in the frequency range from 100 kHz to 0.1 Hz at
open circuit potential by applying a small sinusoidal voltage with an amplitude
of few millivolts (5-10 mV). All electrochemical measurements were carried out
at room temperature in 1 M of KOH aqueous electrolyte.

43
Chapter 3 . CONFORMALLY-COATED NICKEL HYDROXIDE
NANOSTRUCTED ELECTRODES
Nuha A. Alhebshi, R. B. Rakhi and H. N. Alshareef, Conformal coating of
Ni(OH)2 nanoflakes on carbon fibers by chemical bath deposition for efficient
supercapacitor electrodes. Journal of Materials Chemistry A, 1, 14897-14903,
doi: 10.1039/C3TA12936E (2013)
ABSTRACT
A novel supercapacitor electrode structure has been developed in which
a uniform and conformal coating of nanostructured Ni(OH)2 flakes on carbon
microfibers is deposited in-situ by a simple chemical bath deposition process at
room temperature. The microfibers conformally-coated with Ni(OH)2 nanoflakes
exhibit five times higher specific capacitance compared to planar (non-
conformal) Ni(OH)2 nanoflakes electrodes prepared by drop casting of Ni(OH)2
powder on the carbon microfibers (1416 F/g vs 275 F/g). This improvement in
supercapacitor performance can be ascribed to the preservation of the three-
dimensional structure of the current collector, which is a fibrous carbon fabric,
even after the conformal coating of Ni(OH)2 nanoflakes. The 3D network
morphology of the fibrous carbon fabric leads to more efficient electrolyte
penetration into the conformal electrode, allowing the ions to have greater
access to active reaction sites. Cyclic stability testing of the conformal and
planar Ni(OH)2 nanoflakes electrodes, respectively, reveals 34% and 62% drop in
44
specific capacitance after 10000 cycles. The present study demonstrates the
crucial effect that electrolyte penetration plays in determining the
pseudocapacitive properties of the supercapacitor electrodes.
3.1. INTRODUCTION
In the face of increasing energy demand and the development of
alternative sources to meet such demand, energy storage technologies are
increasingly becoming a crucial component of many renewable energy systems.
Supercapacitors, which fill the gap between batteries and conventional
electrostatic capacitors in terms of power and energy densities, are considered
as a very important element of energy storage applications.51 They can be
useful in many applications either as stand-alone (e.g., in regenerative braking
systems) or in combination with batteries in hybrid electric vehicles.3 To
increase the energy density of supercapacitor we must increase either the
capacitance or operating voltage of the devices. By increasing the specific
surface area at the interface between electrodes and electrolyte, the
capacitance can be increased. This goal can be realized by developing
nanostructured electrodes that allow efficient electrolyte penetration and
maintain low resistance. Several classes of materials have been reported in
this respect, including carbon-based materials,52 transition metal
oxides/hydroxides,53 and conductive polymers.54
It is desirable that simple and cost-effective materials and processes are
used to fabricate the electrodes. For example, RuO2 is one of the best

45
pseudocapacitive materials, but is expensive.55 Nanostructured Ni(OH)2 has
been considered as a promising candidate as supercapacitor electrode due to
its well-defined electrochemical redox reactions, large specific surface area,
tunable morphology by modifying synthetic conditions, environmental
friendliness, and comparatively low cost of its precursors. There are several
studies indicating that high specific capacitance can be achieved using Ni(OH)2
electrodes. Gong et al.25 synthesized β-Ni(OH)2 nanosheets using solvothermal
method and showed a specific capacitance of 1528 F/g at 1 A/g. Coin-like β-
Ni(OH)2 nanoplates with a specific capacitance around 1300 F/g at 1 A/g were
synthesized using coordination homogeneous precipitation method by Li et al.26
β-Ni(OH)2 cross-linked nanowalls prepared by Lu et al.27 using hydrothermal
treatment at 100 oC exhibited a specific capacitance of 2675 F/g at 0.005
A/cm2. Hydrothermal processing was also used to prepare different
morphologies by changing the treatment temperature. For instance, a specific
capacitance of 1398.5 F/g at 0.005 A/cm2 for β-Ni(OH)2 hierarchical hollow
microspheres prepared at 180 oC was reported by Yang et al.28 The previous
reports indicate that the cross-linked nanowalls morphology provides promising
supercapacitor performance. However, one of the disadvantages of the
hydrothermal method is that it is time consuming and has heightened
sensitivity of oxide/hydroxide morphology to hydrothermal process conditions,
which make it difficult to scale up to industrial scale. Chemical bath
deposition, on the other hand, is a much simpler process and can be performed
at very low temperatures. Therefore, it has the potential to be more cost
46
effective. Substrates used in CBD can be conductive or nonconductive materials
in contrast with that used in electrodeposition. In addition, CBD is considered
as an inexpensive technique that is suitable for large-scale production. The
first study of using CBD for NiO preparation was done by Pramanik et al.32 The
chemical bath used in that study, an aqueous mixture of nickel sulfate,
potassium persulfate and ammonia solution, were later used by others to
prepare Ni(OH)2 and NiO.41
Few papers have studied the utilization of CBD in preparing
nanostructured Ni(OH)2 for supercapacitor applications. Patil et al.56 prepared
honeycomb-like Ni(OH)2 thin film via a CBD at 60 oC on stainless steel
substrates. The resultant specific capacitance was 398 F/g at a scan rate of 5
mV/s. A specific capacitance of 296 F/g at 0.005 A/cm2 was obtained for
interconnected honeycomb-like Ni(OH)2, and a specific capacitance of 468 F/g
at 0.005 A/cm2 was exhibited by interconnected Ni(OH)2 nanoflakes prepared
using CBD at 70 oC on stainless steel substrates by Dubal et al.57 Further, α-
Ni(OH)2 interconnected nanoflakes was synthesized using CBD at room
temperature on Ni foam and resulted in a high specific capacitance of 2200 F/g
at 1 A/g by Hu et al.24. However, the electrode in that particular study suffers
from a 40% relative specific capacitance drop after only 2000 cycles.24 A recent
paper showed that β-Ni(OH)2/γ-NiOOH composite film with interconnected
nanoflakes prepared by CBD at room temperature on Ni foam exhibited a
specific capacitance of 1420 F/g at 1A/g. However, its cyclic stability test was
measured only for 1000 cycles.58 In addition, it is not clear what the
47
contribution of the Ni foam may have been to the overall capacitance of these
devices in those studies.
In the present study, we demonstrate a novel and simple method for
obtaining a conformal coating of Ni(OH)2 nanoflakes on fibrous carbon fabric
using CBD at room temperature. We show that the three dimensional structure
of conformal Ni(OH)2 electrode exhibits a higher specific capacitance by
increasing electrolyte penetration, giving easy access to the active Ni(OH)2 sites
on the electrode. It also gives a significantly improved cycling performance
compared with previous reports on CBD of Ni(OH)2 electrodes.
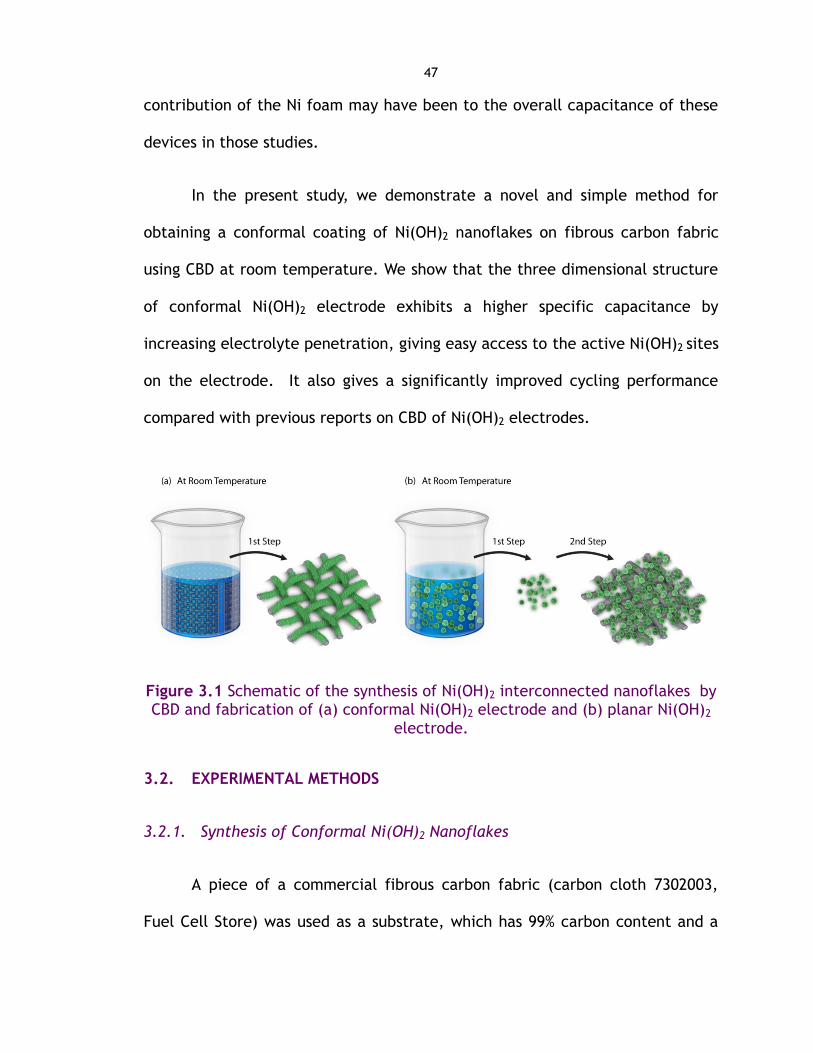
Figure 3.1 Schematic of the synthesis of Ni(OH)2 interconnected nanoflakes by CBD and fabrication of (a) conformal Ni(OH)2 electrode and (b) planar Ni(OH)2
electrode.
3.2. EXPERIMENTAL METHODS
3.2.1. Synthesis of Conformal Ni(OH)2 Nanoflakes
A piece of a commercial fibrous carbon fabric (carbon cloth 7302003,
Fuel Cell Store) was used as a substrate, which has 99% carbon content and a
48
mass density of 11.5 mg/cm2. This substrate was immersed in a chemical bath
containing a clear-green mixture of 5.26 g of nickel(II) sulfate hexahydrate
(NiSO4.6H2O), 1 g of potassium persulfate (K2S2O8) and 45 mL of deionized (DI)
water (H2O) in a 150 mL Pyrex beaker at room temperature. 3 mL of ammonium
hydroxide solution (30-33% NH3 in H2O) was then added to the mixture drop by
drop with stirring for few seconds. As the reactions progressed, the mixture
became dense, and the color turned into dark blue. The solution was then kept
without stirring at room temperature for 1h. To optimize the synthetic
conditions for the deposition of conformal Ni(OH)2, the same procedure was
repeated for longer deposition times of 2h and 5h and at different ammonium
hydroxide concentrations of 3 mL and 5 mL. The chemically coated substrates
were afterwards taken out, washed by DI H2O several times and dried at 60 oC
for 1h in air. Four samples of conformal Ni(OH)2 were prepared on fibrous
carbon fabric pieces of different areas of 1.94, 1.32, 2.00 and 1.75 cm2 with
magnitudes of mass loading of 2.07, 2.02, 1.11 and 0.44 mg/cm2, respectively.
The mass loading, for each sample, was calculated by means of weighing the
carbon substrates before and after the deposition using a microbalance (XP26,
METTLER TOLEDO).
3.2.2. Synthesis of Planar Ni(OH)2 Nanoflakes
The same mixture of chemicals as in the above experiment, using 5mL of
ammonium hydroxide and deposited for 2h, without the fibrous carbon fabric
insertion into the reaction beaker was used for the synthesis of stand-alone
49
Ni(OH)2 nanoflakes. The resultant dense-dark blue solution was filtrated to
collect a pasty precipitated product, washed by DI H2O several times and dried
at 60 oC for 1h in air. The collected Ni(OH)2 nanoflakes powder was then mixed
with ethanol and casted drop by drop on the fibrous carbon fabric. The
substrate coated by drop casting was afterwards taken out and dried at 60 oC
for 1h in air. Two samples of planar Ni(OH)2 were prepared on fibrous carbon
fabric pieces of different areas of 1.58 and 1.50 cm2 with magnitudes of mass
loading of 1.76 and 1.06 g/cm2. All the chemicals used in these experiments
were analytical grade (SIGMA-ALDRICH) and without further purification.
3.2.3. Materials Characterization
The structure of the conformal and planar Ni(OH)2 nanoflakes was
analyzed using X-ray diffraction (XRD). A D8 Advance System from Bruker
Corporation, equipped with Cu Kα X-ray source (λ = 0.15406 nm) was used. In
addition, a selected area electron diffraction (SAED) pattern and high
resolution transmission electron microscope (TEM) images (Titan Super Twin G2
60-300 TEM, FEI Company) with 300 kV were used to investigate both the
structure and microstructure of the Ni(OH)2 powder. Physical adsorption-
desorption of Kr at the liquid-nitrogen temperature of -195.85°C using
Accelerated Surface Area and Porosimetry (ASAP 2420 System, Micromeritics
Company) with the Brunauer-Emmett-Teller (BET) method were used to
measure the porosity and the specific surface area of the conformal Ni(OH)2
nanoflakes. The surface structure and morphology of conformal and planar
50
Ni(OH)2 nanoflakes were observed using scanning electron microscope (SEM)
images (Nova Nano SEM 630, FEI Company) at different magnifications.
3.2.4. Electrochemical Measurements
The electrochemical properties of conformal and planar Ni(OH)2
electrodes were investigated in standard three-electrode configuration using an
electrochemical workstation (CHI 660D, CH Instruments Incorporation) by
carrying out cyclic voltammetry (CV), galvanostatic (CD) and electrochemical
impedance spectroscopy (EIS) measurements. Fibrous carbon fabric coated with
Ni(OH)2 nanoflakes were used as working electrodes in electrochemical cell
containing 1 M KOH aqueous electrolyte solution. A saturated calomel electrode
(SCE) and a Pt wire were used as a reference electrode and a counter-
electrode, respectively. In addition, symmetric supercapacitor devices based
on conformal Ni(OH)2 on fibrous carbon fabric were fabricated. A coin cell of
stainless steel (CR2032, MTI Corporation) containing 1 M KOH in standard two-
electrode configuration was investigated using the electrochemical
workstation.
CV experiments were carried out at different scan rates selected from 1
mV/s to 50mV/s. CD experiments were performed using current densities
selected from 1 A/g to 10 A/g. EIS experiments were carried out at a direct
current (DC) with 0V bias and a sinusoidal signal of 5 mV in a frequency range
from 0.01 Hz to 100 kHz. EIS data was analyzed using a complex plane
impedance plot (Nyquist plot).

51
3.3. RESULTS AND DISCUSSIONS
3.3.1. Materials Properties
Conformal Ni(OH)2 nanoflakes were directly deposited on fibrous carbon
fabrics by a simple CBD method sketched in Figure 3.1 (a). The same chemical
bath mixture, without the fibrous carbon fabric insertion into the reaction
beaker, was used for the synthesis of stand-alone Ni(OH)2 nanoflakes sketched
in Figure 3.1 (b). The chemistry of Ni(OH)2 formation can be explained by a
simple reaction involving the release of nickel cations and hydroxyl group
anions from the precursors undergoing homogeneous nucleation and
precipitation of Ni(OH)2 nanoparticles. This mechanism has been well-
established in the literature 41, 42 and it can be represented by the simple
reaction:
Ni2+ + 2OH- → Ni(OH)2 Equation 3.1
10 20 30 40 50 60 70
(01
8)
(00
3)
(11
6)
(11
3)
(00
6)
Ni(OH)2
Ni(OH)2
4Ni(OH)2.NiOOH
Carbon
(ii)
Inte
nsity [a.u
.]
2 [Degree]
(i)
(00
3)
(00
1)
(00
1)
(00
2)
(11
0)
(11
0)
(10
1)
(10
1)
(02
1)
(20
1)
(00
1)
(00
6)
(10
1)
(01
2)
(a)
Figure 3.2 Structural characterization of Ni(OH)2 nanoflakes by (a) XRD patterns of (i) conformal Ni(OH)2 on fibrous carbon fabric and (ii) Ni(OH)2
powder, (b) SAED pattern of Ni(OH)2 powder, and (c) lattice resolved HRTEM image of Ni(OH)2 powder.
(b)
2 nm
(c)
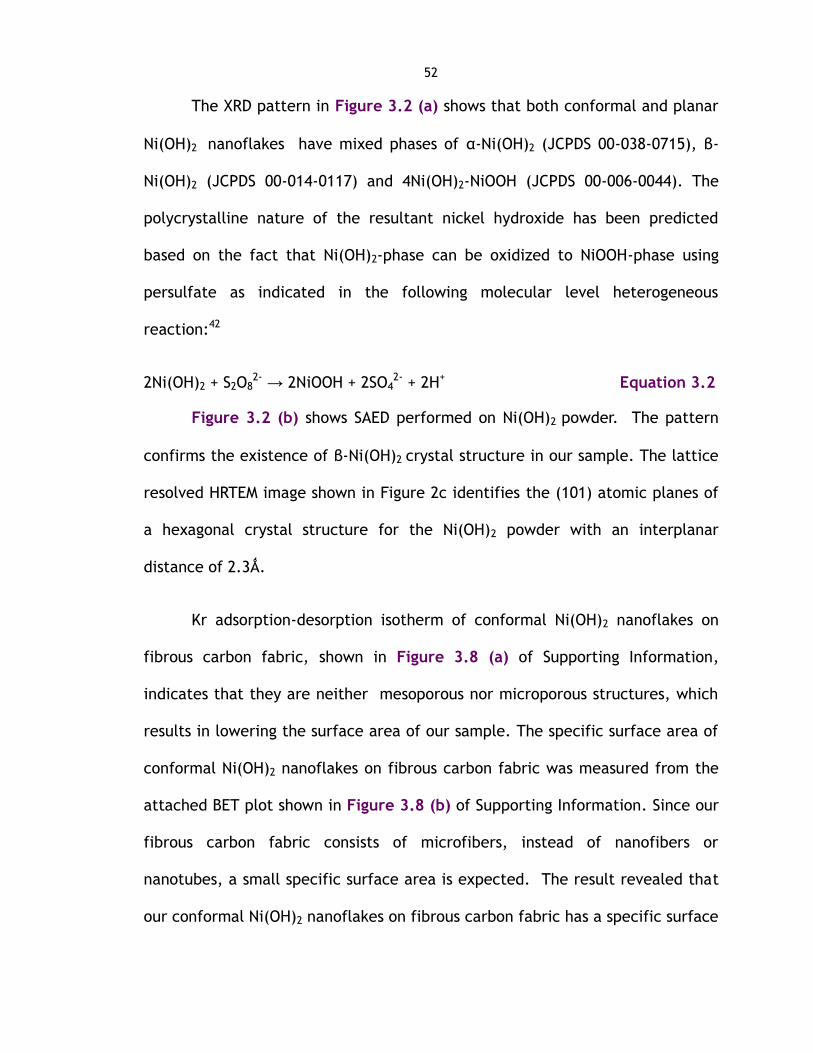
52
The XRD pattern in Figure 3.2 (a) shows that both conformal and planar
Ni(OH)2 nanoflakes have mixed phases of α-Ni(OH)2 (JCPDS 00-038-0715), β-
Ni(OH)2 (JCPDS 00-014-0117) and 4Ni(OH)2-NiOOH (JCPDS 00-006-0044). The
polycrystalline nature of the resultant nickel hydroxide has been predicted
based on the fact that Ni(OH)2-phase can be oxidized to NiOOH-phase using
persulfate as indicated in the following molecular level heterogeneous
reaction:42
2Ni(OH)2 + S2O82- → 2NiOOH + 2SO4
2- + 2H+ Equation 3.2
Figure 3.2 (b) shows SAED performed on Ni(OH)2 powder. The pattern
confirms the existence of β-Ni(OH)2 crystal structure in our sample. The lattice
resolved HRTEM image shown in Figure 2c identifies the (101) atomic planes of
a hexagonal crystal structure for the Ni(OH)2 powder with an interplanar
distance of 2.3Ǻ.
Kr adsorption-desorption isotherm of conformal Ni(OH)2 nanoflakes on
fibrous carbon fabric, shown in Figure 3.8 (a) of Supporting Information,
indicates that they are neither mesoporous nor microporous structures, which
results in lowering the surface area of our sample. The specific surface area of
conformal Ni(OH)2 nanoflakes on fibrous carbon fabric was measured from the
attached BET plot shown in Figure 3.8 (b) of Supporting Information. Since our
fibrous carbon fabric consists of microfibers, instead of nanofibers or
nanotubes, a small specific surface area is expected. The result revealed that
our conformal Ni(OH)2 nanoflakes on fibrous carbon fabric has a specific surface

53
area of 0.7 m2/g which is smaller than the 0.8 m2/g in which reported for
Ni(OH)2/carbon nanotubes core/shell nanostructures on Ni foam substrate.35 It
is well-known that carbon nanotubes/fibers have larger specific surface areas
than that of carbon microfibers. Therefore, it can be concluded that the
specific surface area of our Ni(OH)2 and the reported one are comparable.
Figure 3.3 SEM images of (a) fibrous carbon fabric, (b), (c)and (d) conformal Ni(OH)2 nanoflakes on fibrous carbon fabric at different magnifications, (e) and
(f) planar Ni(OH)2 nanoflakes on fibrous carbon fabric at different magnifications.
Figure 3.3 (a) shows an SEM image of the fibrous carbon fabric. It can be
seen that this substrate has a 3D structure consisting of a network of
microfibers. Such spun-yarn fabric structure provides additional flexibility to
the substrate. Figure 3.9 of Supporting Information shows SEM images of
conformal Ni(OH)2 nanoflakes prepared at different synthetic conditions . It can
be noticed that carbon microfibers have no uniform coating of Ni(OH)2
(a)
50 m
(b)
5 m
(d)
1 m
(c)
1 m
5 m
(e) (f)
1 m
54
prepared using 3 mL of ammonium hydroxide and deposited for 1 h shown in
Figure 3.9 (a) of Supporting Information. Similar observations can be seen in
Figure 3.9 (b)-(d). Our goal was to carefully optimize the CBD process to
achieve a direct and conformal precipitation of Ni(OH)2 nanoflakes on the
microfibers in the carbon fabric substrate. Figure 3.3 (b) and (c) show that we
have been successful in conformally coating Ni(OH)2 nanoflakes on fibrous
carbon fabric using 5 mL of ammonium hydroxide deposited for 2 h. Figure 3d
shows a high magnification SEM image of the conformal Ni(OH)2 coating on
fibrous carbon fabric. It can be seen that the coating of Ni(OH)2 are composed
of interconnected nanoflakes. In addition, the conformal coating of Ni(OH)2
nanoflakes on fibrous carbon fabric have also been achieved using a 3 mL of
ammonium hydroxide deposited for 5 h shown in Figure 3.9 (c) of the
Supporting Information. Based on the SEM comparisons of our samples, it is
thought that the nucleation and growth of conformal Ni(OH)2 on fibrous carbon
fabric requires either high ammonium hydroxide concentration with short
deposition time or low ammonium hydroxide concentration with long deposition
time.
Figure 3.3 (e) shows the morphology of the planar Ni(OH)2 electrode. As
discussed earlier, this electrode was formed by first precipitating Ni(OH)2
powder in the beaker using the CBD process. The powder was then coated by
drop casting on the carbon fabric substrate. This method covers not only some
of the microfibers, but also the spaces between them, and hence resulted in
planar coating (as opposed to 3D coating as shown in Figure 3.3 (b) and (c).

55
Figure 3.3 (f) shows that the planar coating of Ni(OH)2 are composed also of
interconnected nanoflakes.
Figure 3.4 TEM images of (a) Ni(OH)2 interconnected nanoflakes (b) a high resolution TEM image of (a).
Detailed structural analysis of these interconnected Ni(OH)2 nanoflakes
can be obtained from the analysis of TEM images. The structure in Figure 3.4
(a) has neither mesopores nor micropores, which is comparable with the result
of the previous isotherm in Figure 3.8 (a). Individual nanoflakes have an
average thickness of nearly 39.3 nm as measured from the high resolution TEM
image as shown in Figure 3.4 (b).
39.3
nm
100 nm
500 nm
(a)
(b)
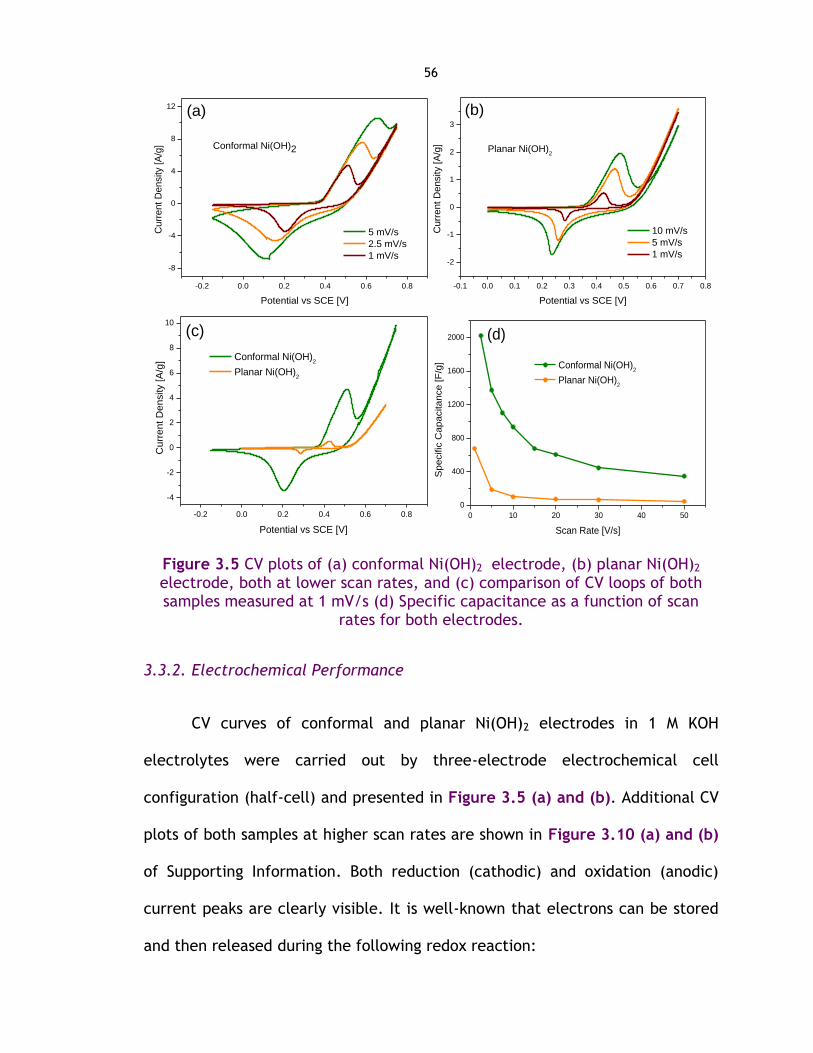
56
-0.2 0.0 0.2 0.4 0.6 0.8
-8
-4
0
4
8
12
Curr
ent D
ensity [A
/g]
Potential vs SCE [V]
5 mV/s
2.5 mV/s
1 mV/s
Conformal Ni(OH)2
(a)
-0.1 0.0 0.1 0.2 0.3 0.4 0.5 0.6 0.7 0.8
-2
-1
0
1
2
3
(b)
Cu
rre
nt
De
nsity [
A/g
]
Potential vs SCE [V]
10 mV/s
5 mV/s
1 mV/s
Planar Ni(OH)2
-0.2 0.0 0.2 0.4 0.6 0.8
-4
-2
0
2
4
6
8
10
(c)
Cu
rre
nt
De
nsity [
A/g
]
Potential vs SCE [V]
Conformal Ni(OH)2
Planar Ni(OH)2
0 10 20 30 40 50
0
400
800
1200
1600
2000 (d)
Specific
Capacitance [F
/g]
Scan Rate [V/s]
Conformal Ni(OH)2
Planar Ni(OH)2
Figure 3.5 CV plots of (a) conformal Ni(OH)2 electrode, (b) planar Ni(OH)2 electrode, both at lower scan rates, and (c) comparison of CV loops of both samples measured at 1 mV/s (d) Specific capacitance as a function of scan
rates for both electrodes.
3.3.2. Electrochemical Performance
CV curves of conformal and planar Ni(OH)2 electrodes in 1 M KOH
electrolytes were carried out by three-electrode electrochemical cell
configuration (half-cell) and presented in Figure 3.5 (a) and (b). Additional CV
plots of both samples at higher scan rates are shown in Figure 3.10 (a) and (b)
of Supporting Information. Both reduction (cathodic) and oxidation (anodic)
current peaks are clearly visible. It is well-known that electrons can be stored
and then released during the following redox reaction:
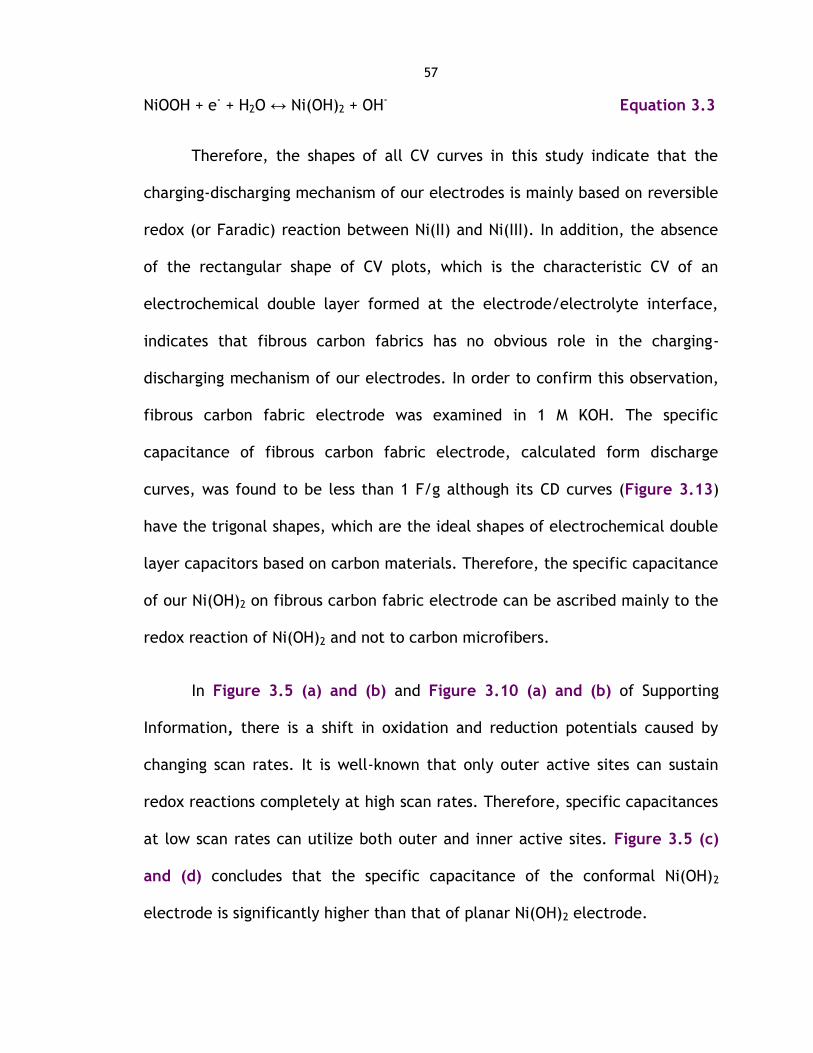
57
NiOOH + e- + H2O ↔ Ni(OH)2 + OH- Equation 3.3
Therefore, the shapes of all CV curves in this study indicate that the
charging-discharging mechanism of our electrodes is mainly based on reversible
redox (or Faradic) reaction between Ni(II) and Ni(III). In addition, the absence
of the rectangular shape of CV plots, which is the characteristic CV of an
electrochemical double layer formed at the electrode/electrolyte interface,
indicates that fibrous carbon fabrics has no obvious role in the charging-
discharging mechanism of our electrodes. In order to confirm this observation,
fibrous carbon fabric electrode was examined in 1 M KOH. The specific
capacitance of fibrous carbon fabric electrode, calculated form discharge
curves, was found to be less than 1 F/g although its CD curves (Figure 3.13)
have the trigonal shapes, which are the ideal shapes of electrochemical double
layer capacitors based on carbon materials. Therefore, the specific capacitance
of our Ni(OH)2 on fibrous carbon fabric electrode can be ascribed mainly to the
redox reaction of Ni(OH)2 and not to carbon microfibers.
In Figure 3.5 (a) and (b) and Figure 3.10 (a) and (b) of Supporting
Information, there is a shift in oxidation and reduction potentials caused by
changing scan rates. It is well-known that only outer active sites can sustain
redox reactions completely at high scan rates. Therefore, specific capacitances
at low scan rates can utilize both outer and inner active sites. Figure 3.5 (c)
and (d) concludes that the specific capacitance of the conformal Ni(OH)2
electrode is significantly higher than that of planar Ni(OH)2 electrode.
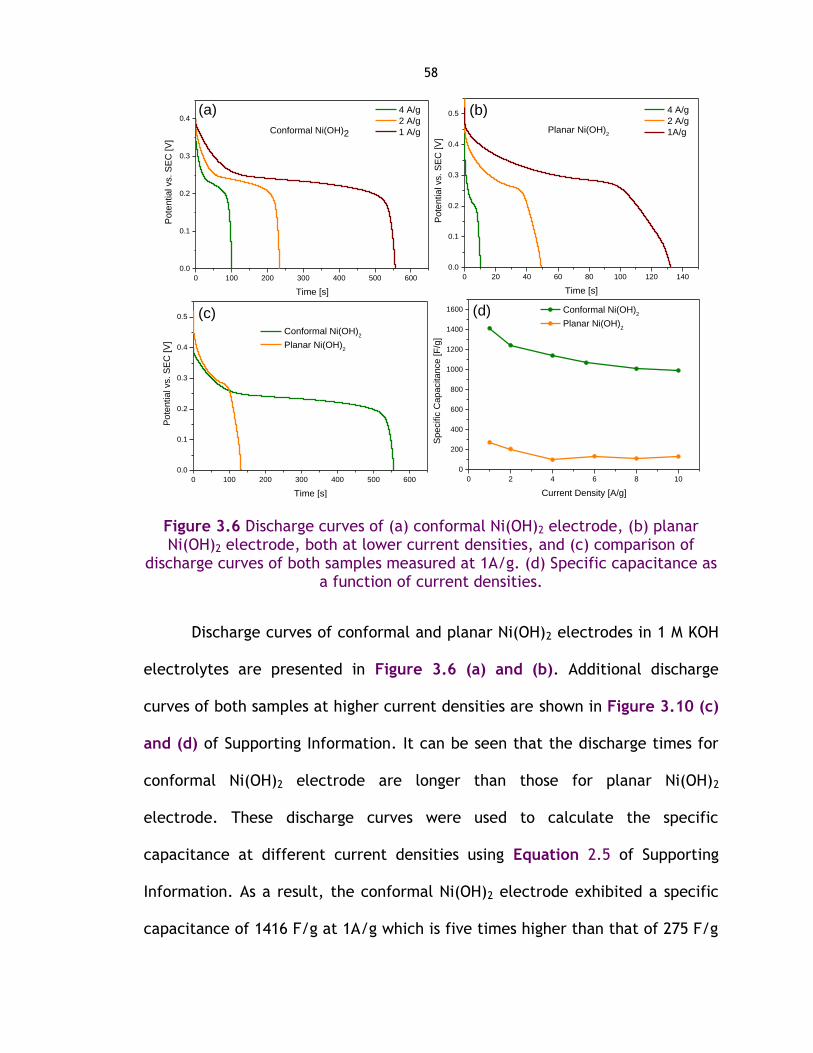
58
0 100 200 300 400 500 600
0.0
0.1
0.2
0.3
0.4(a)
Conformal Ni(OH)2
Pote
ntial vs. S
EC
[V
]
Time [s]
4 A/g
2 A/g
1 A/g
0 20 40 60 80 100 120 140
0.0
0.1
0.2
0.3
0.4
0.5 (b)
Planar Ni(OH)2
Pote
ntial vs. S
EC
[V
]
Time [s]
4 A/g
2 A/g
1A/g
0 100 200 300 400 500 600
0.0
0.1
0.2
0.3
0.4
0.5 (c)
Pote
ntial vs. S
EC
[V
]
Time [s]
Conformal Ni(OH)2
Planar Ni(OH)2
0 2 4 6 8 10
0
200
400
600
800
1000
1200
1400
1600 (d)
Sp
ecific
Cap
acita
nce
[F
/g]
Current Density [A/g]
Conformal Ni(OH)2
Planar Ni(OH)2
Figure 3.6 Discharge curves of (a) conformal Ni(OH)2 electrode, (b) planar Ni(OH)2 electrode, both at lower current densities, and (c) comparison of
discharge curves of both samples measured at 1A/g. (d) Specific capacitance as a function of current densities.
Discharge curves of conformal and planar Ni(OH)2 electrodes in 1 M KOH
electrolytes are presented in Figure 3.6 (a) and (b). Additional discharge
curves of both samples at higher current densities are shown in Figure 3.10 (c)
and (d) of Supporting Information. It can be seen that the discharge times for
conformal Ni(OH)2 electrode are longer than those for planar Ni(OH)2
electrode. These discharge curves were used to calculate the specific
capacitance at different current densities using Equation 2.5 of Supporting
Information. As a result, the conformal Ni(OH)2 electrode exhibited a specific
capacitance of 1416 F/g at 1A/g which is five times higher than that of 275 F/g
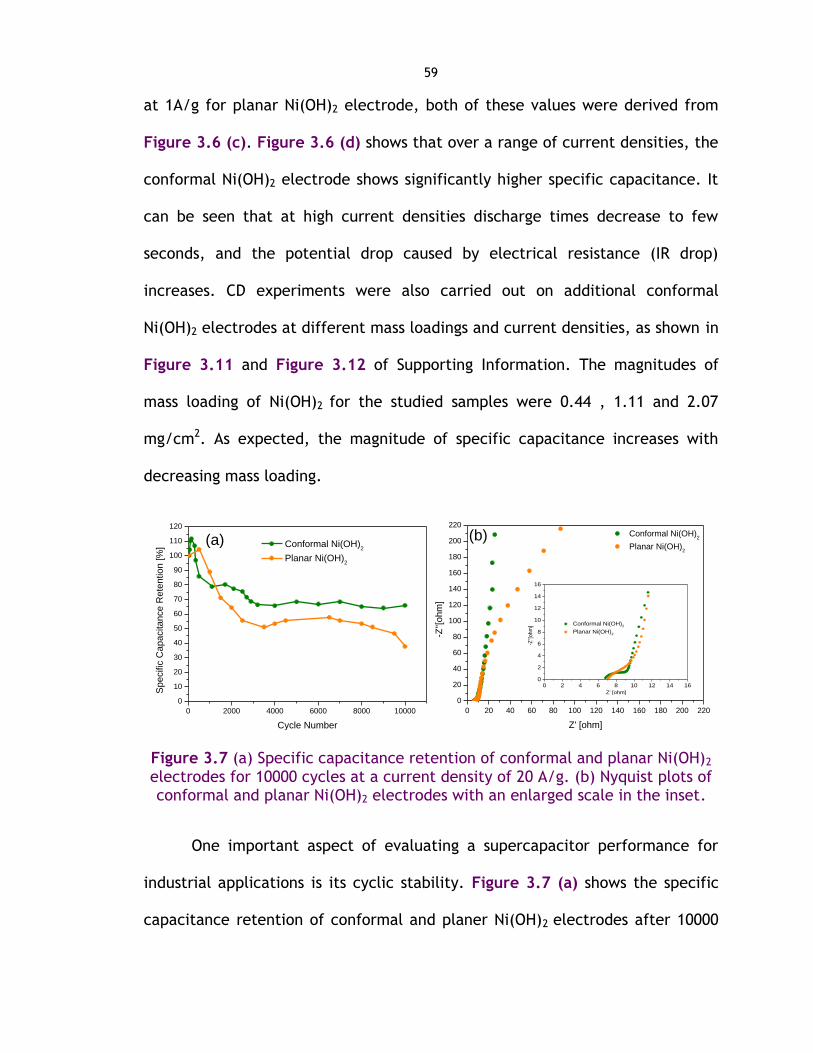
59
at 1A/g for planar Ni(OH)2 electrode, both of these values were derived from
Figure 3.6 (c). Figure 3.6 (d) shows that over a range of current densities, the
conformal Ni(OH)2 electrode shows significantly higher specific capacitance. It
can be seen that at high current densities discharge times decrease to few
seconds, and the potential drop caused by electrical resistance (IR drop)
increases. CD experiments were also carried out on additional conformal
Ni(OH)2 electrodes at different mass loadings and current densities, as shown in
Figure 3.11 and Figure 3.12 of Supporting Information. The magnitudes of
mass loading of Ni(OH)2 for the studied samples were 0.44 , 1.11 and 2.07
mg/cm2. As expected, the magnitude of specific capacitance increases with
decreasing mass loading.
0 2000 4000 6000 8000 10000
0
10
20
30
40
50
60
70
80
90
100
110
120
(a)
Sp
ecific
Cap
acita
nce
Rete
ntio
n [
%]
Cycle Number
Conformal Ni(OH)2
Planar Ni(OH)2
0 20 40 60 80 100 120 140 160 180 200 220
0
20
40
60
80
100
120
140
160
180
200
220
(b)
Conformal Ni(OH)2
Planar Ni(OH)2
-Z''[
oh
m]
Z' [ohm]
Figure 3.7 (a) Specific capacitance retention of conformal and planar Ni(OH)2 electrodes for 10000 cycles at a current density of 20 A/g. (b) Nyquist plots of conformal and planar Ni(OH)2 electrodes with an enlarged scale in the inset.
One important aspect of evaluating a supercapacitor performance for
industrial applications is its cyclic stability. Figure 3.7 (a) shows the specific
capacitance retention of conformal and planer Ni(OH)2 electrodes after 10000
0 2 4 6 8 10 12 14 160
2
4
6
8
10
12
14
16
Conformal Ni(OH)2
Planar Ni(OH)2
-Z''[
oh
m]
Z' [ohm]
60
cycles at a current density of 20 A/g. The magnitudes of mass loading of
conformal and planer Ni(OH)2 were 2.02 and 1.06 mg/cm2, respectively. The
rise in specific capacitances during the first 150 cycles, as shown in Figure 3.7
(a), can be explained by considering that pseudocapacitive materials are
usually required to undergo several CD cycles to be fully activated and provide
maximum Faradic capacitance. Comparing the values of the specific
capacitance decrease after cycling observed in this work with those reported in
the literature, an enhancement in cyclic stability performance has been
achieved in our samples. Specifically, 22% specific capacitance drop is observed
after 2000 for conformal Ni(OH)2 electrode, as shown in Figure 3.7 (a),
compared to 37.6% specific capacitance drop after only 2000 cycles was
reported for α-Ni(OH)2 prepared using similar synthetic conditions.24 Cyclic
stability testing of the conformal and planar Ni(OH)2 nanoflakes electrode
respectively reveals 34% and 62% drops in specific capacitance after 10000
cycles, respectively.
Figure 3.7 (b) shows Nyquist plots obtained from EIS experiments for
conformal and planar Ni(OH)2 electrodes with an enlarged scale in the inset.
The ideal shape of Nyquist plot consists of a semicircle in the high frequency
region and a vertical straight line in the low frequency region. It is evident that
the ideal shape is achieved in the case of conformal Ni(OH)2 electrode while a
small deviation is observed in the case of the planar electrode. It is well-
accepted that the ionic diffusion of the electrolyte ions in electrodes can be
indicated by the slope of the straight line in the low frequency region. It can be
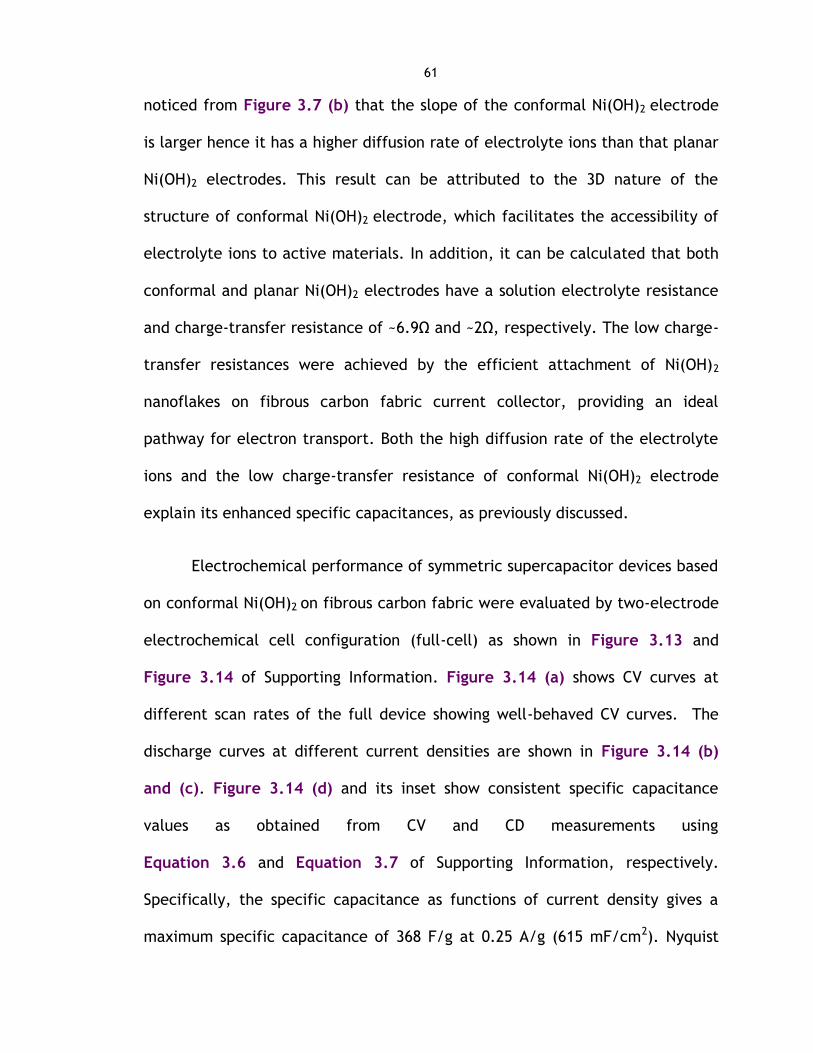
61
noticed from Figure 3.7 (b) that the slope of the conformal Ni(OH)2 electrode
is larger hence it has a higher diffusion rate of electrolyte ions than that planar
Ni(OH)2 electrodes. This result can be attributed to the 3D nature of the
structure of conformal Ni(OH)2 electrode, which facilitates the accessibility of
electrolyte ions to active materials. In addition, it can be calculated that both
conformal and planar Ni(OH)2 electrodes have a solution electrolyte resistance
and charge-transfer resistance of ~6.9Ω and ~2Ω, respectively. The low charge-
transfer resistances were achieved by the efficient attachment of Ni(OH)2
nanoflakes on fibrous carbon fabric current collector, providing an ideal
pathway for electron transport. Both the high diffusion rate of the electrolyte
ions and the low charge-transfer resistance of conformal Ni(OH)2 electrode
explain its enhanced specific capacitances, as previously discussed.
Electrochemical performance of symmetric supercapacitor devices based
on conformal Ni(OH)2 on fibrous carbon fabric were evaluated by two-electrode
electrochemical cell configuration (full-cell) as shown in Figure 3.13 and
Figure 3.14 of Supporting Information. Figure 3.14 (a) shows CV curves at
different scan rates of the full device showing well-behaved CV curves. The
discharge curves at different current densities are shown in Figure 3.14 (b)
and (c). Figure 3.14 (d) and its inset show consistent specific capacitance
values as obtained from CV and CD measurements using
Equation 3.6 and Equation 3.7 of Supporting Information, respectively.
Specifically, the specific capacitance as functions of current density gives a
maximum specific capacitance of 368 F/g at 0.25 A/g (615 mF/cm2). Nyquist
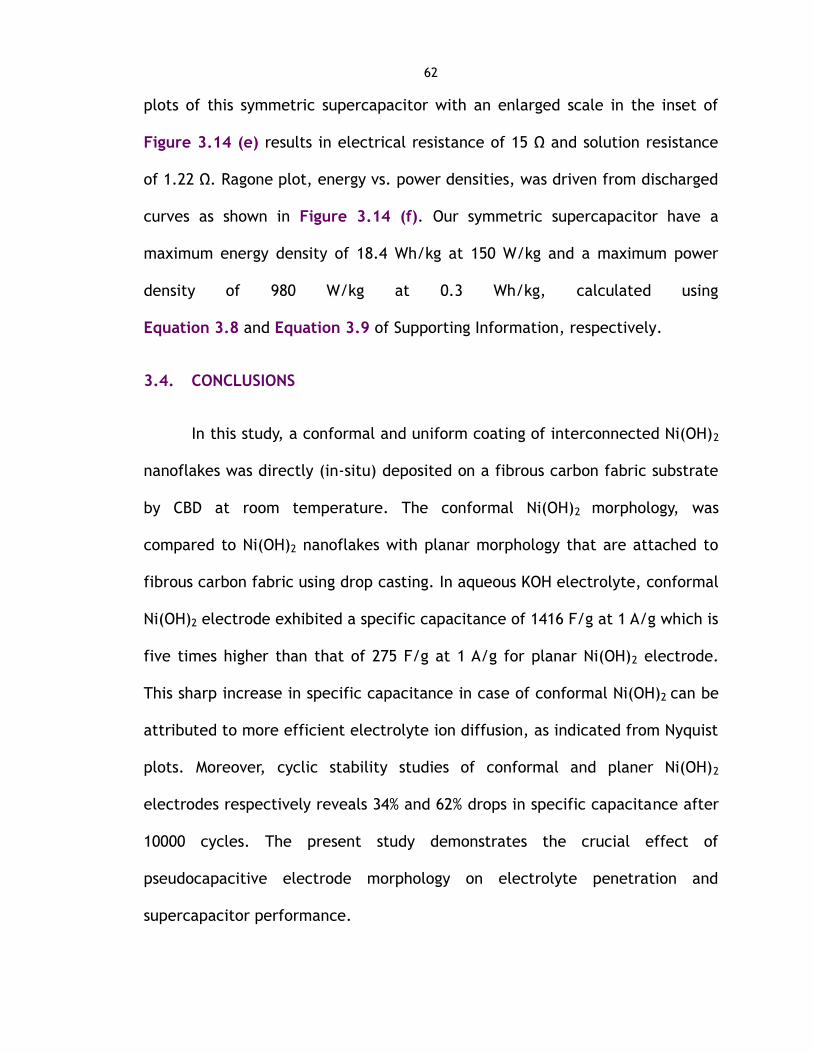
62
plots of this symmetric supercapacitor with an enlarged scale in the inset of
Figure 3.14 (e) results in electrical resistance of 15 Ω and solution resistance
of 1.22 Ω. Ragone plot, energy vs. power densities, was driven from discharged
curves as shown in Figure 3.14 (f). Our symmetric supercapacitor have a
maximum energy density of 18.4 Wh/kg at 150 W/kg and a maximum power
density of 980 W/kg at 0.3 Wh/kg, calculated using
Equation 3.8 and Equation 3.9 of Supporting Information, respectively.
3.4. CONCLUSIONS
In this study, a conformal and uniform coating of interconnected Ni(OH)2
nanoflakes was directly (in-situ) deposited on a fibrous carbon fabric substrate
by CBD at room temperature. The conformal Ni(OH)2 morphology, was
compared to Ni(OH)2 nanoflakes with planar morphology that are attached to
fibrous carbon fabric using drop casting. In aqueous KOH electrolyte, conformal
Ni(OH)2 electrode exhibited a specific capacitance of 1416 F/g at 1 A/g which is
five times higher than that of 275 F/g at 1 A/g for planar Ni(OH)2 electrode.
This sharp increase in specific capacitance in case of conformal Ni(OH)2 can be
attributed to more efficient electrolyte ion diffusion, as indicated from Nyquist
plots. Moreover, cyclic stability studies of conformal and planer Ni(OH)2
electrodes respectively reveals 34% and 62% drops in specific capacitance after
10000 cycles. The present study demonstrates the crucial effect of
pseudocapacitive electrode morphology on electrolyte penetration and
supercapacitor performance.

63
ACKNOWLEDGEMENTS
The authors acknowledge Dr. Dongkyu Cha, Research Scientist at KAUST
Advanced Nano Imaging and Characterization Laboratory (ANIC), for his help in
TEM characterization, and Dr. Omar El Tall, Research Specialist at KAUST
Analytical Core Lab (ACL), for his help in physisorption experiments. Nuha A.
Alhebshi acknowledges the support from the KAUST Graduate Fellowship. R. B.
Rakhi acknowledges the support from SABIC Postdoctoral Fellowship.
SUPPORTING INFORMATION
0.0 0.1 0.2 0.3 0.4 0.5
0.00
0.02
0.04
0.06
0.08
0.10
0.12
0.14
0.16
0.18 (a)
Quantity
Adsorb
ed [cm
³/g S
TP
]
Relative Pressure (P/Po)
Adsorption
Desorption
0.04 0.06 0.08 0.10 0.12 0.14 0.16 0.18 0.20 0.22
1.0
1.2
1.4
1.6
1.8
2.0
2.2
2.4 (b)
1/[V
(Po/P
- 1
)]
Relative Pressure (P/Po)
Figure 3.8 Krypton adsorption/desorption isotherm, (b) BET surface area plot of conformal Ni(OH)2 nanoflakes on fibrous carbon fabric.
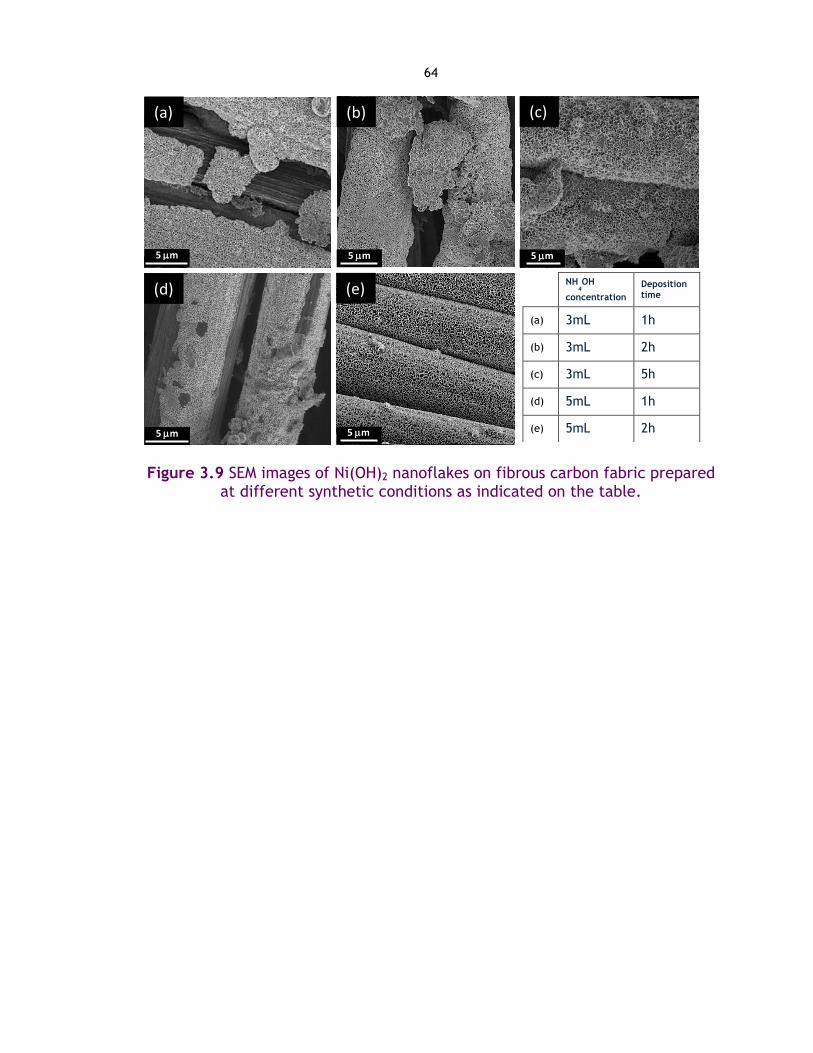
64
Figure 3.9 SEM images of Ni(OH)2 nanoflakes on fibrous carbon fabric prepared at different synthetic conditions as indicated on the table.
NH4OH
concentration
Deposition time
(a) 3mL 1h
(b) 3mL 2h
(c) 3mL 5h
(d) 5mL 1h
(e) 5mL 2h
(c)
5 m
(d)
5 m 5 m
(e)
5 m
(b) (a)
5 m

65
-0.2 0.0 0.2 0.4 0.6 0.8
-12
-8
-4
0
4
8
12
16
Conformal Ni(OH)2
(a)
Cu
rre
nt
De
nsity [
A/g
]
Potential vs SCE [V]
17.5 mV/s
15 mV/s
12.5 mV/s
-0.1 0.0 0.1 0.2 0.3 0.4 0.5 0.6 0.7 0.8
-4
-2
0
2
4(b)
Planar Ni(OH)2
Curr
ent D
ensity [A
/g]
Potential vs SCE [V]
50 mV/s
30 mV/s
20 mV/s
0 10 20 30 40 50 60 70
0.0
0.1
0.2
0.3
0.4
0.5
Conforml Ni(OH)2
(c)
Pote
ntial vs. S
EC
[V
]
Time [s]
10 A/g
8 A/g
5.6 A/g
0 2 4 6 8 10
0.0
0.1
0.2
0.3
0.4
0.5
0.6
0.7
0.8
Planar Ni(OH)2
(d)
Pote
ntial vs. S
EC
[V
]
Time [s]
10 A/g
8 A/g
6 A/g
Figure 3.10 CV plots of (a) conformal Ni(OH)2 electrode and (b) planar Ni(OH)2 electrode, both at higher scan rates. Discharge curves of (c) conformal Ni(OH)2 electrode and (d) planar Ni(OH)2 electrode, both at larger current densities.
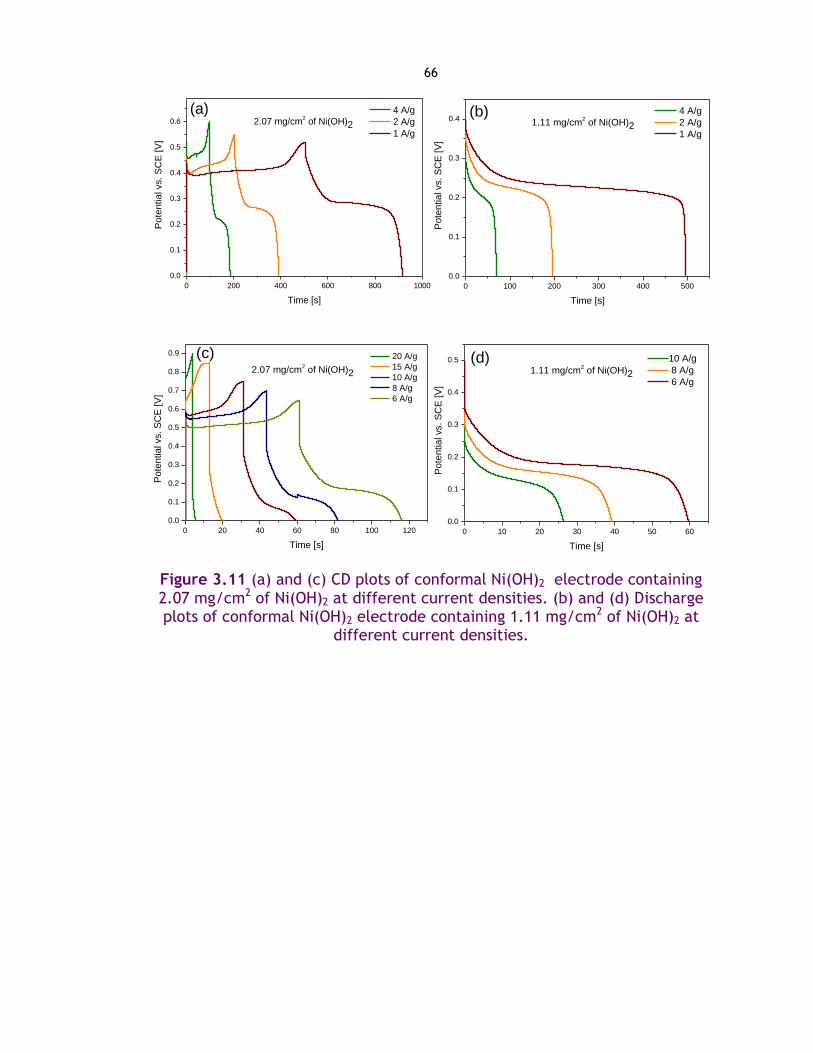
66
0 200 400 600 800 1000
0.0
0.1
0.2
0.3
0.4
0.5
0.6 2.07 mg/cm2 of Ni(OH)2
(a)
Po
tentia
l vs. S
CE
[V
]
Time [s]
4 A/g
2 A/g
1 A/g
0 100 200 300 400 500
0.0
0.1
0.2
0.3
0.4 1.11 mg/cm2 of Ni(OH)2
(b)
Pote
ntial vs. S
CE
[V
]
Time [s]
4 A/g
2 A/g
1 A/g
0 20 40 60 80 100 120
0.0
0.1
0.2
0.3
0.4
0.5
0.6
0.7
0.8
0.9 (c)2.07 mg/cm
2 of Ni(OH)2
Pote
ntial vs. S
CE
[V
]
Time [s]
20 A/g
15 A/g
10 A/g
8 A/g
6 A/g
0 10 20 30 40 50 60
0.0
0.1
0.2
0.3
0.4
0.5 (d)1.11 mg/cm
2 of Ni(OH)2
Po
tentia
l vs. S
CE
[V
]
Time [s]
10 A/g
8 A/g
6 A/g
Figure 3.11 (a) and (c) CD plots of conformal Ni(OH)2 electrode containing 2.07 mg/cm2 of Ni(OH)2 at different current densities. (b) and (d) Discharge plots of conformal Ni(OH)2 electrode containing 1.11 mg/cm2 of Ni(OH)2 at
different current densities.
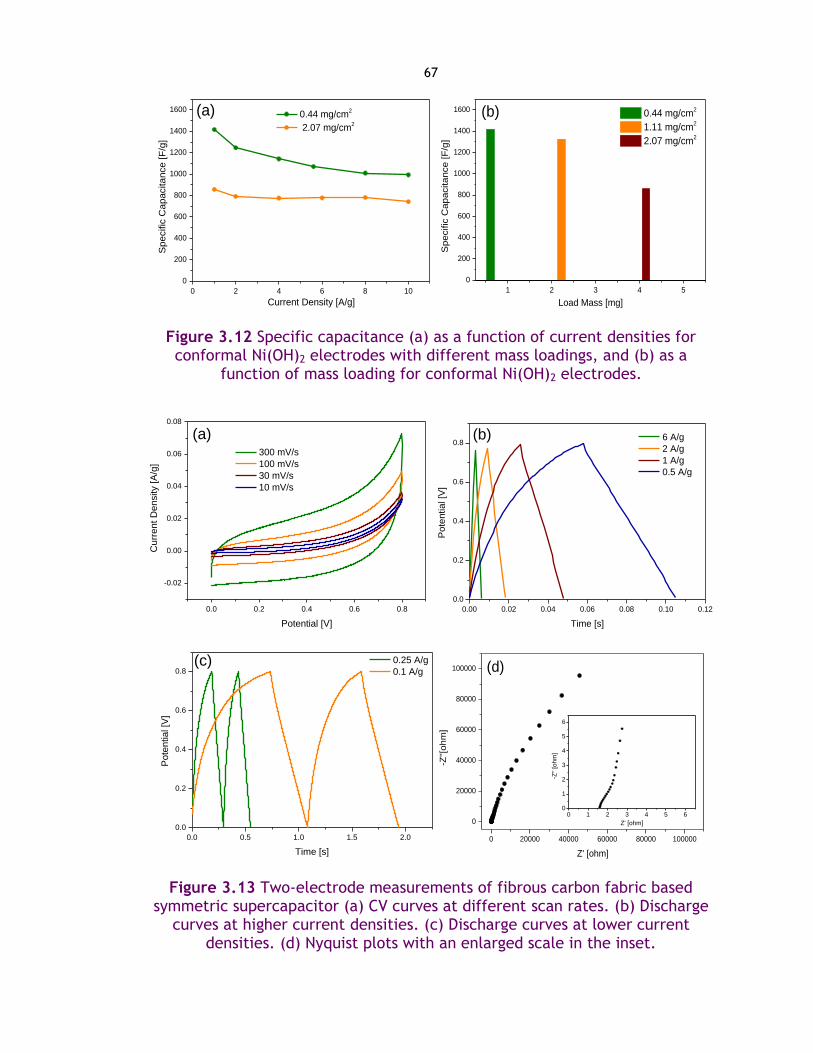
67
0 2 4 6 8 10
0
200
400
600
800
1000
1200
1400
1600 (a) 0.44 mg/cm2
2.07 mg/cm2
Specific
Capacitance [F
/g]
Current Density [A/g] 1 2 3 4 5
0
200
400
600
800
1000
1200
1400
1600
Sp
ecific
Cap
acita
nce
[F
/g]
Load Mass [mg]
0.44 mg/cm2
1.11 mg/cm2
2.07 mg/cm2
(b)
Figure 3.12 Specific capacitance (a) as a function of current densities for conformal Ni(OH)2 electrodes with different mass loadings, and (b) as a
function of mass loading for conformal Ni(OH)2 electrodes.
0.0 0.2 0.4 0.6 0.8
-0.02
0.00
0.02
0.04
0.06
0.08
(a)
Curr
ent D
ensity [A
/g]
Potential [V]
300 mV/s
100 mV/s
30 mV/s
10 mV/s
0.00 0.02 0.04 0.06 0.08 0.10 0.12
0.0
0.2
0.4
0.6
0.8(b)
Po
tentia
l [V
]
Time [s]
6 A/g
2 A/g
1 A/g
0.5 A/g
0.0 0.5 1.0 1.5 2.0
0.0
0.2
0.4
0.6
0.8(c)
Po
tentia
l [V
]
Time [s]
0.25 A/g
0.1 A/g
0 20000 40000 60000 80000 100000
0
20000
40000
60000
80000
100000 (d)
-Z''[
oh
m]
Z' [ohm]
Figure 3.13 Two-electrode measurements of fibrous carbon fabric based symmetric supercapacitor (a) CV curves at different scan rates. (b) Discharge
curves at higher current densities. (c) Discharge curves at lower current densities. (d) Nyquist plots with an enlarged scale in the inset.
0 1 2 3 4 5 60
1
2
3
4
5
6
-Z''
[ohm
]
Z' [ohm]
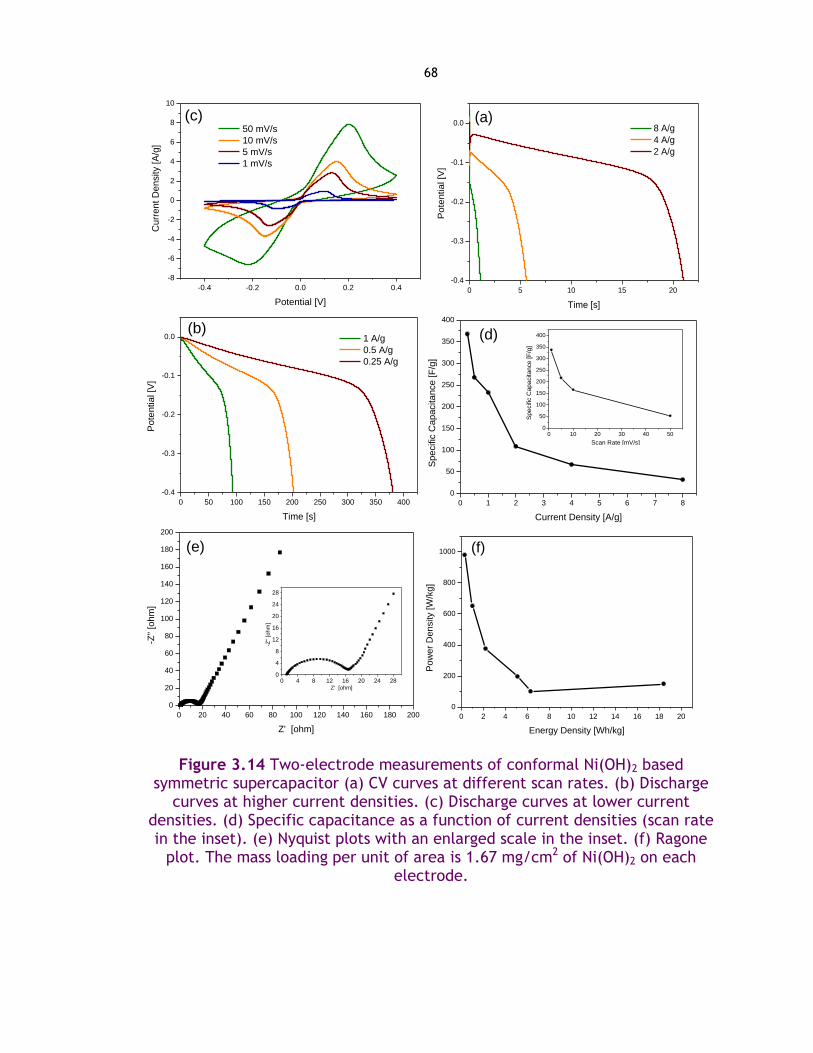
68
-0.4 -0.2 0.0 0.2 0.4
-8
-6
-4
-2
0
2
4
6
8
10
(c)
Cu
rrent
Density [A
/g]
Potential [V]
50 mV/s
10 mV/s
5 mV/s
1 mV/s
Figure 3.14 Two-electrode measurements of conformal Ni(OH)2 based symmetric supercapacitor (a) CV curves at different scan rates. (b) Discharge
curves at higher current densities. (c) Discharge curves at lower current densities. (d) Specific capacitance as a function of current densities (scan rate in the inset). (e) Nyquist plots with an enlarged scale in the inset. (f) Ragone
plot. The mass loading per unit of area is 1.67 mg/cm2 of Ni(OH)2 on each electrode.
0 5 10 15 20
-0.4
-0.3
-0.2
-0.1
0.0 (a)
Pote
ntial [V
]
Time [s]
8 A/g
4 A/g
2 A/g
0 50 100 150 200 250 300 350 400
-0.4
-0.3
-0.2
-0.1
0.0(b)
Po
tentia
l [V
]
Time [s]
1 A/g
0.5 A/g
0.25 A/g
0 1 2 3 4 5 6 7 8
0
50
100
150
200
250
300
350
400
(d)
Sp
ecific
Cap
acita
nce
[F
/g]
Current Density [A/g]
0 20 40 60 80 100 120 140 160 180 200
0
20
40
60
80
100
120
140
160
180
200
(e)
-Z''
[ohm
]
Z' [ohm]
0 2 4 6 8 10 12 14 16 18 20
0
200
400
600
800
1000 (f)
Po
we
r D
ensity [W
/kg]
Energy Density [Wh/kg]
0 10 20 30 40 500
50
100
150
200
250
300
350
400
Specific
Capa
citance [F
/g]
Scan Rate [mV/s]
0 4 8 12 16 20 24 280
4
8
12
16
20
24
28
-Z''
[ohm
]
Z' [ohm]

69
The specific capacitance (Cs) of an electrode in half-cell configuration
(3-electrode measurements), as a function of scan rates, was calculated from
CV curves by applying the equation:
∫
Equation 3.4
where i is variable current [A], m is the mass of one electrode's active
materials [g], V is discharge voltage [V] and dv/dt is scan rate [V/s].
The specific capacitance of an electrode in half-cell configuration (3-
electrode measurements), as a function of current densities, was calculated
from discharge curves by applying the equation:
Equation 3.5
where I is constant current [A], t is discharge time [s], m is the mass of one
electrode's active materials [g], and V is discharge voltage [V].
It is noticed in the literature that specific capacitance values calculated
from CV curves are usually higher than those values calculated from discharge
curves. In this study, the results of both calculation methods indicated that
conformal Ni(OH)2 electrode exhibited specific capacitances significantly higher
than that of planar Ni(OH)2 electrode.

70
The specific capacitance of an electrode in full-cell configuration (2-
electrode measurements), as a function of scan rates, was calculated from CV
curves by applying the equation:
Equation 3.6
where Q is the charge of the discharge curve [C], m is the mass of one
electrode's active materials [g], and V is discharge voltage [V].
The specific capacitance of an electrode in full-cell configuration (2-
electrode measurements), as a function of current densities, was calculated
from discharge curves by applying the equation:
Equation 3.7
where all parameters as same as those of Equation 2.4
The energy (E) and power (P) densities of an electrode in full-cell
configuration (2-electrode measurements), were calculated by applying the
equations:
Equation 3.8
Equation 3.9
where Cs is specific capacitance calculated from discharge curves, V is
discharge voltage [V] and t is discharge time [s].
71
Chapter 4 . NICKEL-COPPER AND NICKEL-COBALT
HYDORXIDES BASED ELECTRODES
Nuha A. Alhebshi and H. N. Alshareef, Ternary Ni-Cu-OH and Ni-Co-OH
Electrodes for Electrochemical Energy Storage, Materials for Renewable and
Sustainable Energy, 4(4), 1-9, doi: 10.1007/s4024301500647 (2015)
ABSTRACT
In this project, Ni–Cu–OH and Ni–Co–OH ternary electrodes have been
prepared. Different Ni:Cu and Ni:Co ratios were deposited by chemical bath
deposition (CBD) at room temperature on carbon microfibers. Since Ni(OH)2 is
notorious for poor cycling stability, the goal of the work was to determine if
doping with Cu or Co could improve Ni(OH)2 cycling stability performance and
conductivity against reaction with electrolyte. It is observed that the
electrodes with Ni:Cu and Ni:Co composition ratio of 100:10 result in the
optimum capacitance and cycling stability in both Ni–Cu–OH and Ni–Co–OH
electrodes. This improvement in cycling stability can be attributed to the
higher redox reversibility as indicated by the smaller CV redox peak separation.
In addition, it is found that decreasing Cu and Co ratios, with fixed CBD time,
enhances nanoflakes formation, and hence increases electrode capacitance.
For the optimum composition (Ni:Co = 100:10), composites of the ternary
electrodes with graphene and carbon nanofibers were also tested, with
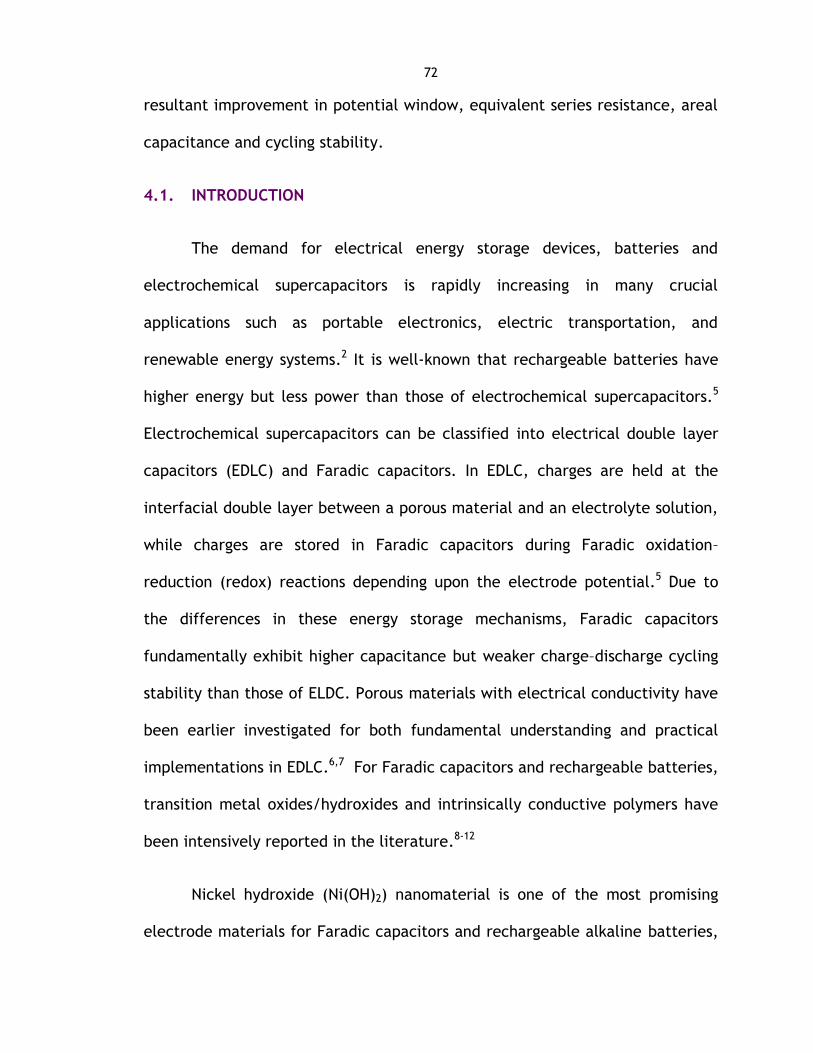
72
resultant improvement in potential window, equivalent series resistance, areal
capacitance and cycling stability.
4.1. INTRODUCTION
The demand for electrical energy storage devices, batteries and
electrochemical supercapacitors is rapidly increasing in many crucial
applications such as portable electronics, electric transportation, and
renewable energy systems.2 It is well-known that rechargeable batteries have
higher energy but less power than those of electrochemical supercapacitors.5
Electrochemical supercapacitors can be classified into electrical double layer
capacitors (EDLC) and Faradic capacitors. In EDLC, charges are held at the
interfacial double layer between a porous material and an electrolyte solution,
while charges are stored in Faradic capacitors during Faradic oxidation–
reduction (redox) reactions depending upon the electrode potential.5 Due to
the differences in these energy storage mechanisms, Faradic capacitors
fundamentally exhibit higher capacitance but weaker charge–discharge cycling
stability than those of ELDC. Porous materials with electrical conductivity have
been earlier investigated for both fundamental understanding and practical
implementations in EDLC.6,7 For Faradic capacitors and rechargeable batteries,
transition metal oxides/hydroxides and intrinsically conductive polymers have
been intensively reported in the literature.8-12
Nickel hydroxide (Ni(OH)2) nanomaterial is one of the most promising
electrode materials for Faradic capacitors and rechargeable alkaline batteries,
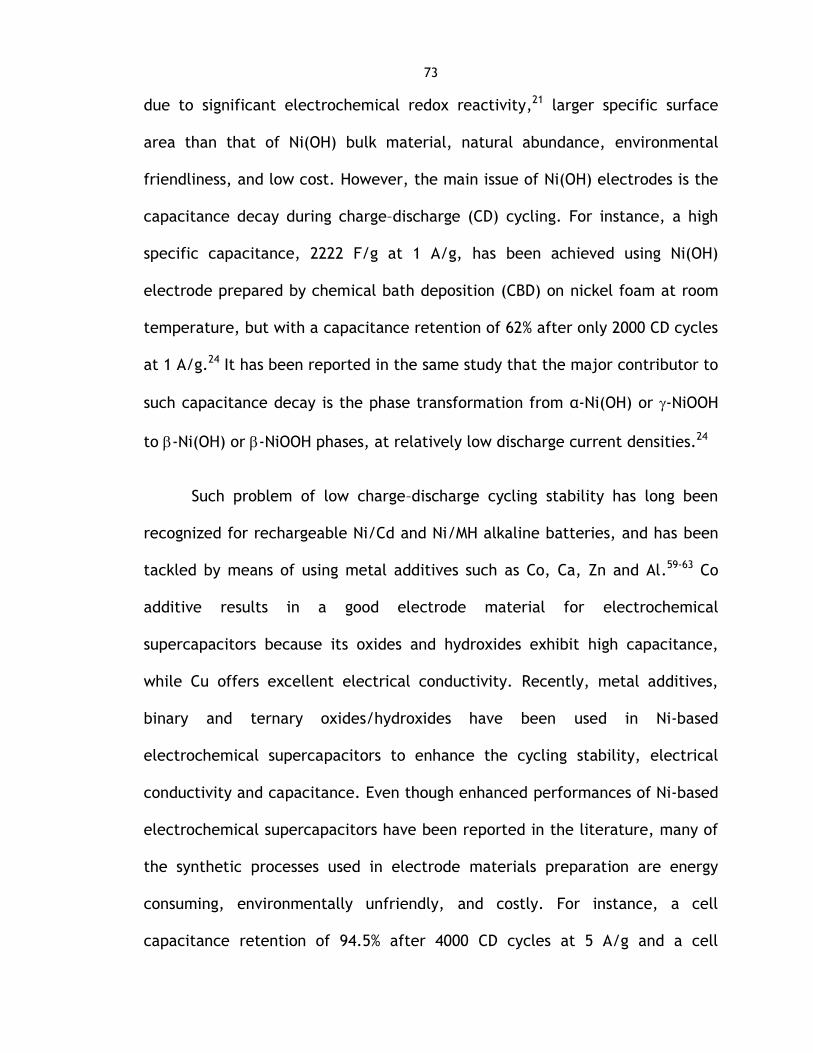
73
due to significant electrochemical redox reactivity,21 larger specific surface
area than that of Ni(OH) bulk material, natural abundance, environmental
friendliness, and low cost. However, the main issue of Ni(OH) electrodes is the
capacitance decay during charge–discharge (CD) cycling. For instance, a high
specific capacitance, 2222 F/g at 1 A/g, has been achieved using Ni(OH)
electrode prepared by chemical bath deposition (CBD) on nickel foam at room
temperature, but with a capacitance retention of 62% after only 2000 CD cycles
at 1 A/g.24 It has been reported in the same study that the major contributor to
such capacitance decay is the phase transformation from α-Ni(OH) or -NiOOH
to -Ni(OH) or -NiOOH phases, at relatively low discharge current densities.24
Such problem of low charge–discharge cycling stability has long been
recognized for rechargeable Ni/Cd and Ni/MH alkaline batteries, and has been
tackled by means of using metal additives such as Co, Ca, Zn and Al.59-63 Co
additive results in a good electrode material for electrochemical
supercapacitors because its oxides and hydroxides exhibit high capacitance,
while Cu offers excellent electrical conductivity. Recently, metal additives,
binary and ternary oxides/hydroxides have been used in Ni-based
electrochemical supercapacitors to enhance the cycling stability, electrical
conductivity and capacitance. Even though enhanced performances of Ni-based
electrochemical supercapacitors have been reported in the literature, many of
the synthetic processes used in electrode materials preparation are energy
consuming, environmentally unfriendly, and costly. For instance, a cell
capacitance retention of 94.5% after 4000 CD cycles at 5 A/g and a cell
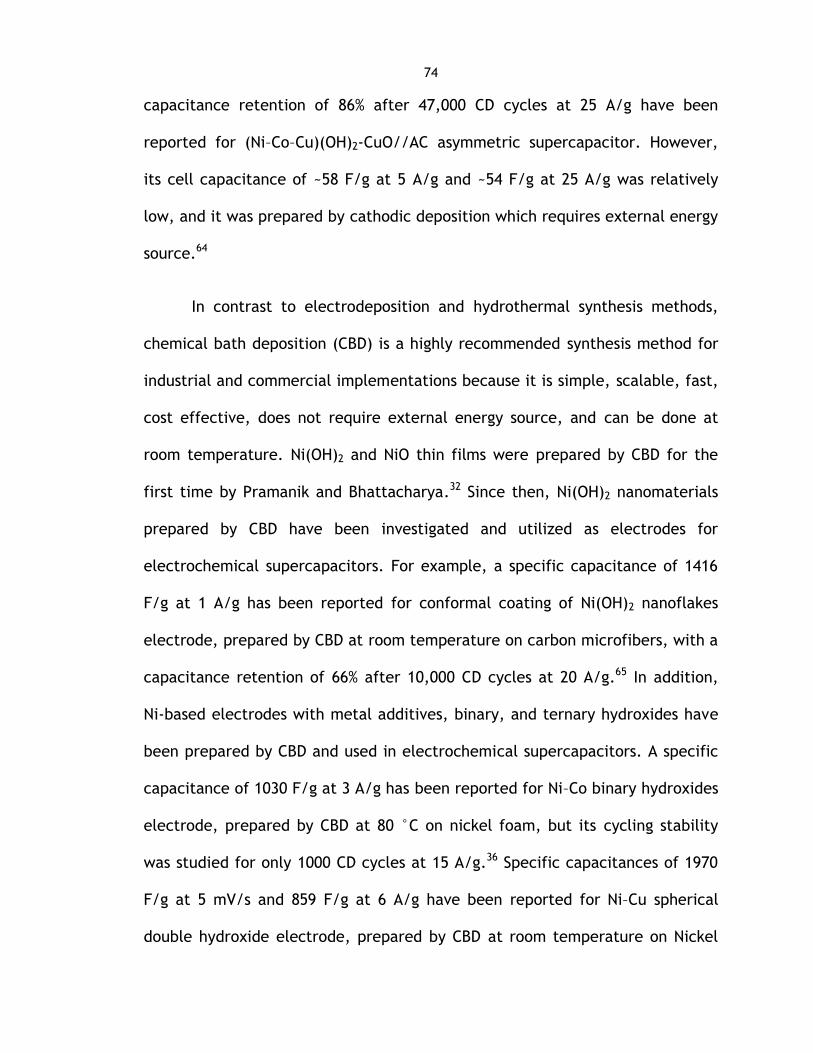
74
capacitance retention of 86% after 47,000 CD cycles at 25 A/g have been
reported for (Ni–Co–Cu)(OH)2-CuO//AC asymmetric supercapacitor. However,
its cell capacitance of ~58 F/g at 5 A/g and ~54 F/g at 25 A/g was relatively
low, and it was prepared by cathodic deposition which requires external energy
source.64
In contrast to electrodeposition and hydrothermal synthesis methods,
chemical bath deposition (CBD) is a highly recommended synthesis method for
industrial and commercial implementations because it is simple, scalable, fast,
cost effective, does not require external energy source, and can be done at
room temperature. Ni(OH)2 and NiO thin films were prepared by CBD for the
first time by Pramanik and Bhattacharya.32 Since then, Ni(OH)2 nanomaterials
prepared by CBD have been investigated and utilized as electrodes for
electrochemical supercapacitors. For example, a specific capacitance of 1416
F/g at 1 A/g has been reported for conformal coating of Ni(OH)2 nanoflakes
electrode, prepared by CBD at room temperature on carbon microfibers, with a
capacitance retention of 66% after 10,000 CD cycles at 20 A/g.65 In addition,
Ni-based electrodes with metal additives, binary, and ternary hydroxides have
been prepared by CBD and used in electrochemical supercapacitors. A specific
capacitance of 1030 F/g at 3 A/g has been reported for Ni–Co binary hydroxides
electrode, prepared by CBD at 80 °C on nickel foam, but its cycling stability
was studied for only 1000 CD cycles at 15 A/g.36 Specific capacitances of 1970
F/g at 5 mV/s and 859 F/g at 6 A/g have been reported for Ni–Cu spherical
double hydroxide electrode, prepared by CBD at room temperature on Nickel

75
foam, but with a capacitance retention of 69% after only 1600 CD cycles at 6
A/g.66
Reduced graphene oxide (rGO) nanosheets have been also utilized for
electrochemical supercapacitors with much better cycling stability than that of
metal oxide and hydroxide electrodes.3 One of the best results for reduced
graphene oxide supercapacitors was reported by Bai et al.67 using a modified
Hummer’s method and hydrothermal reduction, and obtaining a full-cell
specific capacitance of 230 F/g at 1 A/g and a capacitance retention of ~89%
after 10,000 cycles. However, there are other simpler methods which can be
used to prepare reduced graphene oxide, and it is useful to study their
performance. One such simple method is the chemical exfoliation of graphite.43
Chemical exfoliation is an environmentally friendly and cost-effective method
as it does not require strong acids (as in Hummer’s method), or high
temperature and high pressure (as in the hydrothermal method). In addition, it
can produce large quantity of electrically conductive graphene since it is
exfoliated directly from graphite without forming graphene oxide. An et al.43
have reported a full-cell specific capacitance of 120 F/g at 2 mA for chemically
exfoliated graphene-based supercapacitors.
In this project, Ni–Cu–OH and Ni–Co–OH electrodes have been prepared
using different Ni:Cu and Ni:Co ratios by CBD at room temperature on carbon
microfibers. Effects of changing Ni:Cu and Ni:Co ratios on electrode
morphology and electrochemical performance are investigated. For the

76
optimum composition (Ni:Co = 100:10), composites of the ternary electrodes
with graphene and carbon nanofibers were also tested, with resultant
improvement in potential window, equivalent series resistance, areal
capacitance and cycling stability.
4.2. EXPERIMENTS
4.2.1. Synthesis of Ni-Cu-OH, Ni-Co-OH and G-CNF
Ni–Cu–OH electrodes were prepared by CBD with Ni:Cu ratios of 100:3,
100:10 and 100:25. The chemical bath consisted of 1 M of nickel(II) sulfate
hexahydrate (NiSO4.6H2O), different molarities (0.03, 0.10 and 0.25 M) of
copper(II) sulfate pentahydrate (CuSO4.5H2O) and deionized (DI) water (H2O) in
Pyrex beakers at room temperature. Then, 1.56 mL of ammonium hydroxide
solution (30–33% NH3 in H2O) and 0.15 M of potassium persulfate (K2S2O8) were
added subsequently to the mixture. Several pieces of commercial carbon
microfibers substrates from Fuel Cell Store (carbon cloth 7302003, 99% carbon
content and 11.5 mg/cm2) were immersed in the chemical bath by clamps at
room temperature. The immersed parts of all carbon substrates have the same
area of 1.00 cm2. After 1 h, the coated substrates were taken out, washed
several times with DI H2O and dried in air at room temperature overnight. Ni–
Co–OH electrodes with Ni:Co ratios of 100:3, 100:10 and 100:25 were prepared
by the same previous procedures but with cobalt(II) chloride hexahydrate
(CoCl2.6H2O) of different molarities (0.03, 0.10 and 0.25 M). All the chemicals
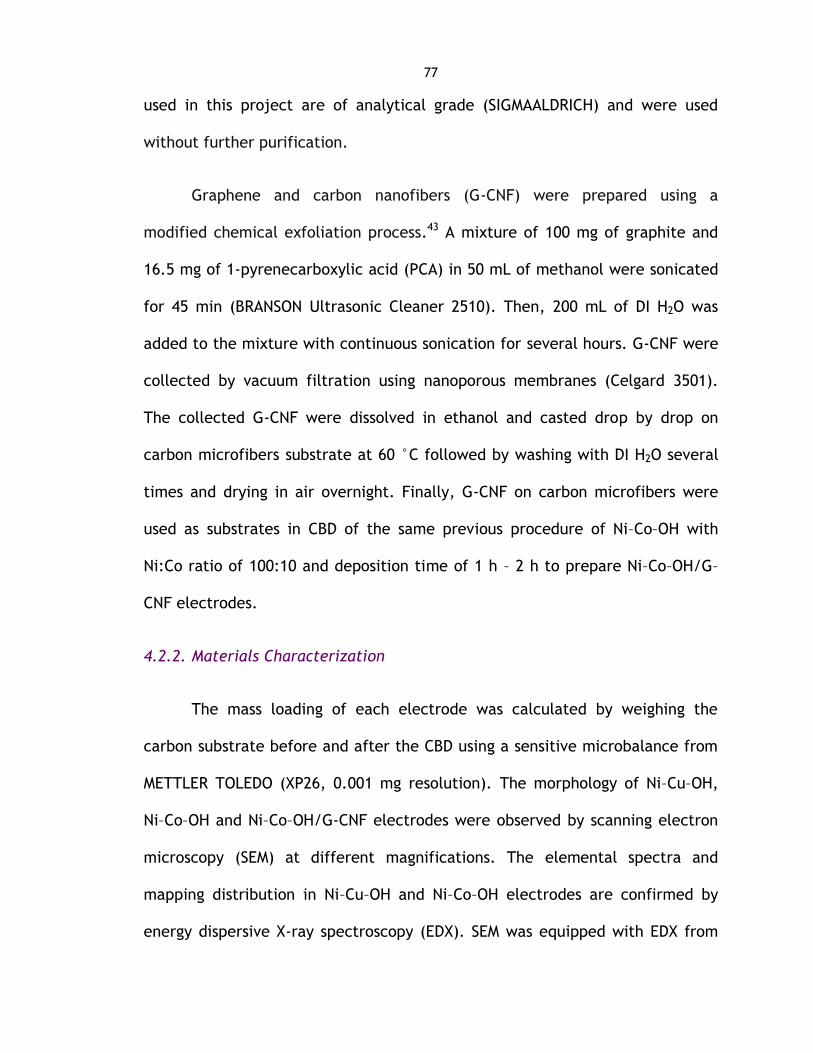
77
used in this project are of analytical grade (SIGMAALDRICH) and were used
without further purification.
Graphene and carbon nanofibers (G-CNF) were prepared using a
modified chemical exfoliation process.43 A mixture of 100 mg of graphite and
16.5 mg of 1-pyrenecarboxylic acid (PCA) in 50 mL of methanol were sonicated
for 45 min (BRANSON Ultrasonic Cleaner 2510). Then, 200 mL of DI H2O was
added to the mixture with continuous sonication for several hours. G-CNF were
collected by vacuum filtration using nanoporous membranes (Celgard 3501).
The collected G-CNF were dissolved in ethanol and casted drop by drop on
carbon microfibers substrate at 60 °C followed by washing with DI H2O several
times and drying in air overnight. Finally, G-CNF on carbon microfibers were
used as substrates in CBD of the same previous procedure of Ni–Co–OH with
Ni:Co ratio of 100:10 and deposition time of 1 h – 2 h to prepare Ni–Co–OH/G–
CNF electrodes.
4.2.2. Materials Characterization
The mass loading of each electrode was calculated by weighing the
carbon substrate before and after the CBD using a sensitive microbalance from
METTLER TOLEDO (XP26, 0.001 mg resolution). The morphology of Ni–Cu–OH,
Ni–Co–OH and Ni–Co–OH/G-CNF electrodes were observed by scanning electron
microscopy (SEM) at different magnifications. The elemental spectra and
mapping distribution in Ni–Cu–OH and Ni–Co–OH electrodes are confirmed by
energy dispersive X-ray spectroscopy (EDX). SEM was equipped with EDX from

78
FEI Company (Nova Nano SEM 630). G-CNF was characterized using X-ray
diffraction (XRD) from Bruker Corporation (A D8 Advance System) and Raman
spectroscopy from HORIBA Scientific.
4.2.3. Electrochemical Measurements
Ni–Cu–OH, Ni–Co–OH and Ni–Co–OH/G-CNF were used as working
electrodes. Saturated calomel electrode (SCE) and a platinum (Pt) wire were
used as reference electrode and counter electrode, respectively. The aqueous
electrolyte solution was 1 M of potassium hydroxide (KOH). Electrochemical
redox reactions were studied by cyclic voltammetry (CV). Electrode
capacitances and cycling stability were calculated by chronopotentiometric
(galvanostatic) charge–discharge (CD). Equivalent series resistances, charge
transfer resistances and diffusion control were studied by electrochemical
impedance spectroscopy (EIS). All experiments were carried out in standard
three electrode configuration using a multichannel Potentiostat/Galvanostat/
EIS from BioLogic Science Instruments (VMP3).
4.3. RESULTS AND DISCUSSION
4.3.1. Materials Properties
EDX elemental mapping images for Ni–Cu–OH electrode and Ni–Co–OH
electrode with Ni:Cu and Ni:Co ratios of 100:10 are shown in Figure 4.1 (a) and
(b), respectively. Figure 4.1 (a) confirms the presence of carbon, nickel,
copper and oxygen in Ni–Cu–OH electrode. In addition, it can be seen that
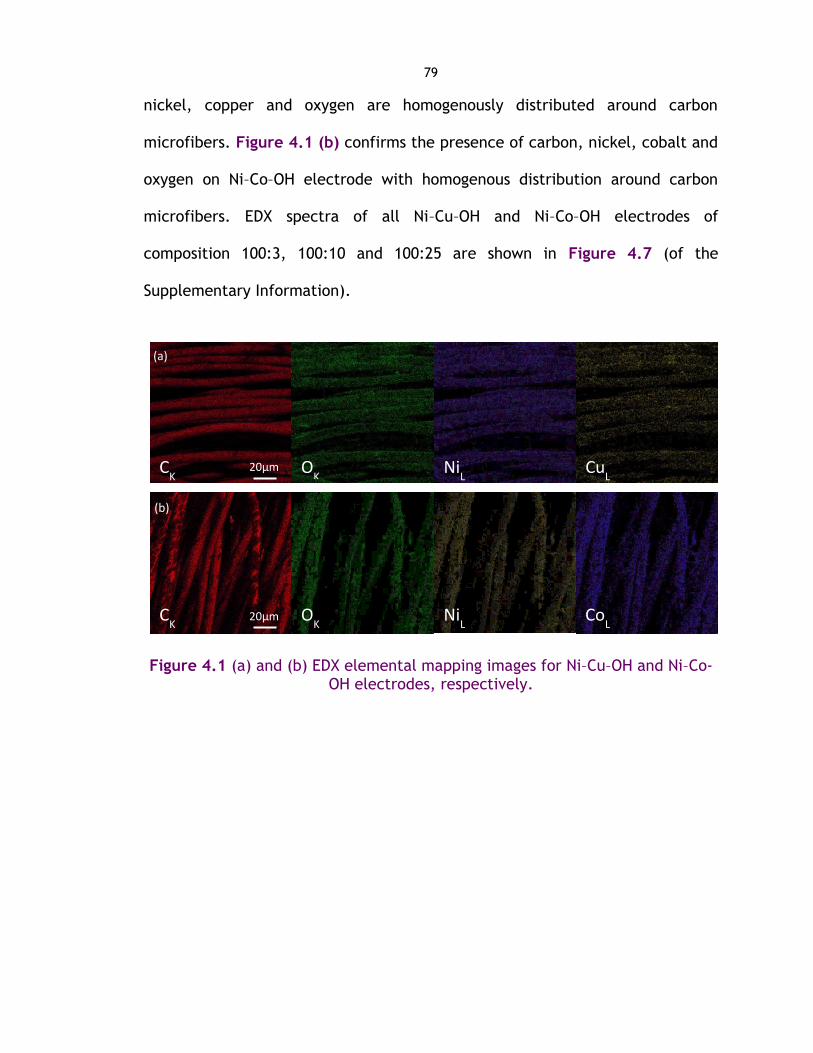
79
nickel, copper and oxygen are homogenously distributed around carbon
microfibers. Figure 4.1 (b) confirms the presence of carbon, nickel, cobalt and
oxygen on Ni–Co–OH electrode with homogenous distribution around carbon
microfibers. EDX spectra of all Ni–Cu–OH and Ni–Co–OH electrodes of
composition 100:3, 100:10 and 100:25 are shown in Figure 4.7 (of the
Supplementary Information).
Figure 4.1 (a) and (b) EDX elemental mapping images for Ni–Cu–OH and Ni–Co-OH electrodes, respectively.
CK Cu
L O
K Ni
L
(a)
CK Co
L O
K Ni
L
(b)
20µm
20µm
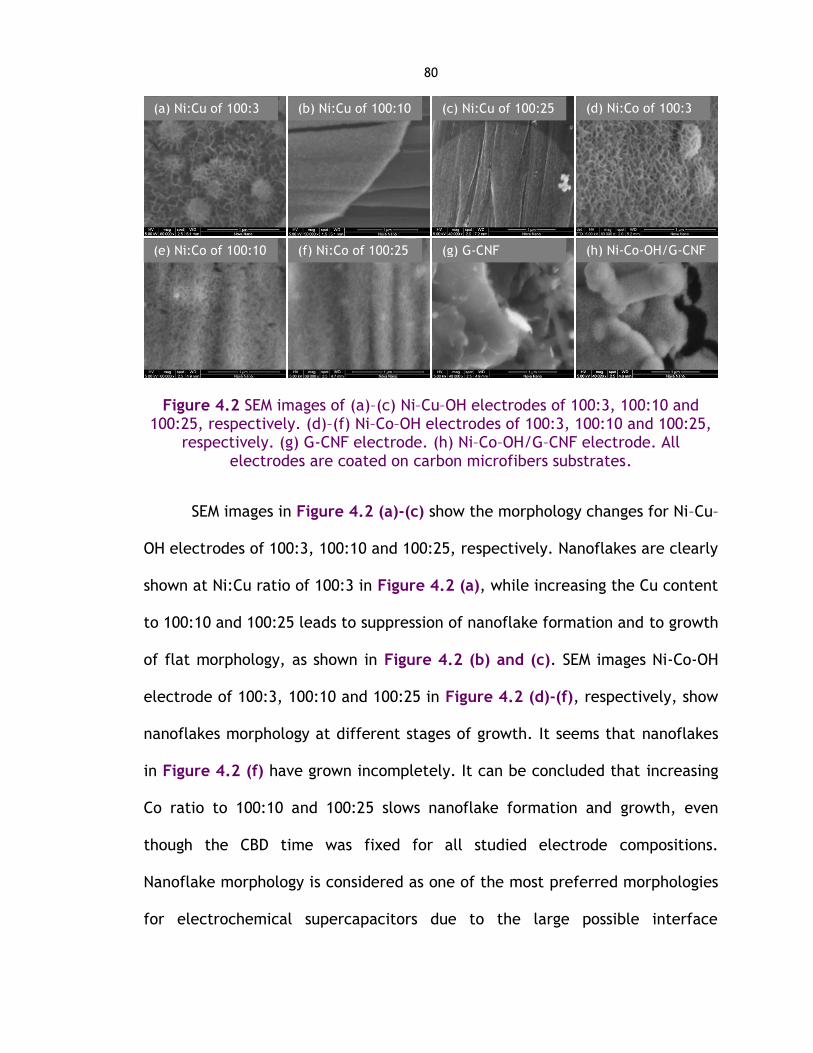
80
Figure 4.2 SEM images of (a)–(c) Ni–Cu–OH electrodes of 100:3, 100:10 and 100:25, respectively. (d)–(f) Ni–Co–OH electrodes of 100:3, 100:10 and 100:25,
respectively. (g) G-CNF electrode. (h) Ni–Co–OH/G–CNF electrode. All electrodes are coated on carbon microfibers substrates.
SEM images in Figure 4.2 (a)-(c) show the morphology changes for Ni–Cu–
OH electrodes of 100:3, 100:10 and 100:25, respectively. Nanoflakes are clearly
shown at Ni:Cu ratio of 100:3 in Figure 4.2 (a), while increasing the Cu content
to 100:10 and 100:25 leads to suppression of nanoflake formation and to growth
of flat morphology, as shown in Figure 4.2 (b) and (c). SEM images Ni-Co-OH
electrode of 100:3, 100:10 and 100:25 in Figure 4.2 (d)-(f), respectively, show
nanoflakes morphology at different stages of growth. It seems that nanoflakes
in Figure 4.2 (f) have grown incompletely. It can be concluded that increasing
Co ratio to 100:10 and 100:25 slows nanoflake formation and growth, even
though the CBD time was fixed for all studied electrode compositions.
Nanoflake morphology is considered as one of the most preferred morphologies
for electrochemical supercapacitors due to the large possible interface
(a) Ni:Cu of 100:3 (b) Ni:Cu of 100:10 (c) Ni:Cu of 100:25 (d) Ni:Co of 100:3
(e) Ni:Co of 100:10 (f) Ni:Co of 100:25 (h) Ni-Co-OH/G-CNF (g) G-CNF
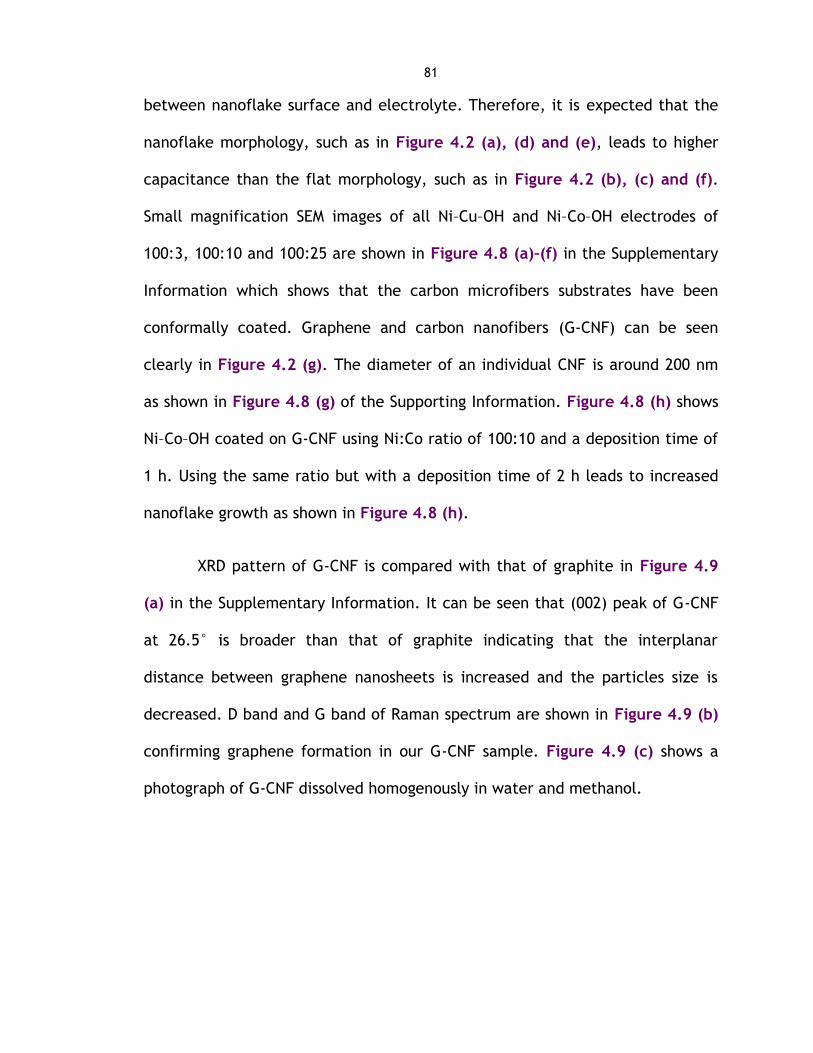
81
between nanoflake surface and electrolyte. Therefore, it is expected that the
nanoflake morphology, such as in Figure 4.2 (a), (d) and (e), leads to higher
capacitance than the flat morphology, such as in Figure 4.2 (b), (c) and (f).
Small magnification SEM images of all Ni–Cu–OH and Ni–Co–OH electrodes of
100:3, 100:10 and 100:25 are shown in Figure 4.8 (a)–(f) in the Supplementary
Information which shows that the carbon microfibers substrates have been
conformally coated. Graphene and carbon nanofibers (G-CNF) can be seen
clearly in Figure 4.2 (g). The diameter of an individual CNF is around 200 nm
as shown in Figure 4.8 (g) of the Supporting Information. Figure 4.8 (h) shows
Ni–Co–OH coated on G-CNF using Ni:Co ratio of 100:10 and a deposition time of
1 h. Using the same ratio but with a deposition time of 2 h leads to increased
nanoflake growth as shown in Figure 4.8 (h).
XRD pattern of G-CNF is compared with that of graphite in Figure 4.9
(a) in the Supplementary Information. It can be seen that (002) peak of G-CNF
at 26.5° is broader than that of graphite indicating that the interplanar
distance between graphene nanosheets is increased and the particles size is
decreased. D band and G band of Raman spectrum are shown in Figure 4.9 (b)
confirming graphene formation in our G-CNF sample. Figure 4.9 (c) shows a
photograph of G-CNF dissolved homogenously in water and methanol.
82
Figure 4.3 (a) and (b) CD curves of Ni–Cu–OH and Ni-Co–OH electrodes of
100:10, respectively. (c) and (d) CV curves of Ni–Cu–OH and Ni–Co–OH electrodes of 100:10, respectively. Enlarged CVs curves after 10000 cycles are
shown in the insets. (e) and (f) CV curves of Ni–Cu–OH and Ni–Co–OH electrodes, respectively, of 100:25, 100:10 and 100:3.
4.3.2. Electrochemical Performance
Figure 4.3 (a) and (b) shows the CD behavior of Ni–Cu–OH and Ni–Co–OH
electrodes of 100:10, respectively. Before 10,000 cycles, there are two
separate charging plateaus. The first plateau spans a potential of 0.348 to
0.450 V, while the second plateau spans from 0.450 to 0.532 V. After 10,000
cycles, the first charging plateau is shifted toward higher potential from 0.419
to 0.480 V, while the second plateau covers from 0.480 V to the preset
maximum charging potential (0.532 V) which is fixed during all 10,000 cycles.
This shift in the range of charging plateaus toward higher potentials indicates
can be one of the reasons behind the capacitance decay during long CD cycles
-0.4 -0.2 0.0 0.2 0.4 0.6 0.8
-15
-10
-5
0
5
10
15
10 mV/s
Cu
rre
nt
[mA
]
Potential vs. SCE [V]
Ni:Co of 100:25
Ni:Co of 100:10
Ni:Co of 100:3
-0.1 0.0 0.1 0.2 0.3 0.4 0.5 0.6 0.7
-15
-10
-5
0
5
10
15
10 mV/s
Cu
rre
nt
[mA
]
Potenial vs. SCE [V]
Ni:Cu of 100:25
Ni:Cu of 100:10
Ni:Cu of 100:3
0 20 40 60 80 100 120 140 160
0.0
0.1
0.2
0.3
0.4
0.5
0.6
0.7
10 A/g
Ni:Cu of 100:10
Pote
ntial vs. S
CE
[V
]
Time [s]
Before 10000 cycles
After 10000 cycles
0 20 40 60 80 100 120 140 160
0.0
0.1
0.2
0.3
0.4
0.5
0.6
0.7
10 A/g
Ni:Co of 100:10
Pote
ntial vs. S
CE
[V
]
Time [s]
Before 10000 cycles
After 10000 cycles
-0.1 0.0 0.1 0.2 0.3 0.4 0.5 0.6
-15
-10
-5
0
5
10
15
10 mV/s
Ni:Cu of 100:10
Curr
ent [m
A]
Potenial vs. SCE [V]
Before 10000 cycles
After 10000 cycles
-0.1 0.0 0.1 0.2 0.3 0.4 0.5 0.6
-15
-10
-5
0
5
10
15
10 mV/s
Ni:Cu of 100:10
Curr
ent [m
A]
Potential vs. SCE [V]
Before 10000 cycles
After 10000 cycles
0.0 0.2 0.4 0.6-1
0
1
2
Cu
rre
nt
[mA
]
Potential vs. SCE [V]
(c) (e)
(b)
(a)
(d) (f)
0.0 0.2 0.4 0.6
-2
0
2
4
6
Cu
rre
nt
[mA
]
Potenial vs. SCE [V]
83
as confirmed and explained in the following CV results section. In addition,
there are two separated discharging plateaus after 10,000 cycles instead of one
discharging plateau. Similar CD behavior is also observed for Ni–Co–OH
electrode as seen in Figure 4.3 (c), but with one broad plateau in the
discharge curve consisting of two or more overlapping plateaus. As expected,
both Ni–Cu–OH and Ni–Cu–OH electrodes have shorter charging–discharging time
after 10,000 cycles, indicating a decrease in capacitance as shown in
Figure 4.4. All previous changes in the potential plateau, number of plateaus
and shape of charging–discharging curves can be due to structural
rearrangement in the electrode materials as confirmed by CV curves in
Figure 4.3 (c) and (d). CD curves at different current densities of all Ni–Cu–OH
and Ni–Co–OH electrodes of 100:3, 100:10 and 100:25 are shown in Figure 4.10
of the Supplementary Information.
Figure 4.3 (c) and (d) illustrates CV behavior of Ni–Cu–OH and Ni–Co–OH
electrodes of 100:10, respectively. Before 10,000 cycles, it can be seen in
Figure 4.3 (c) that there are two partially overlapping oxidation peaks that can
be attributed to Ni(OH)2/NiOOH and Cu(OH)2/CuOOH based on the following
well-known reactions in which electrons can be stored and then released,
reversely:
Ni(OH)2 + OH- ↔ NiOOH + H2O + e- Equation 4.1
Cu(OH)2 + OH- ↔ CuOOH + H2O + e- Equation 4.2
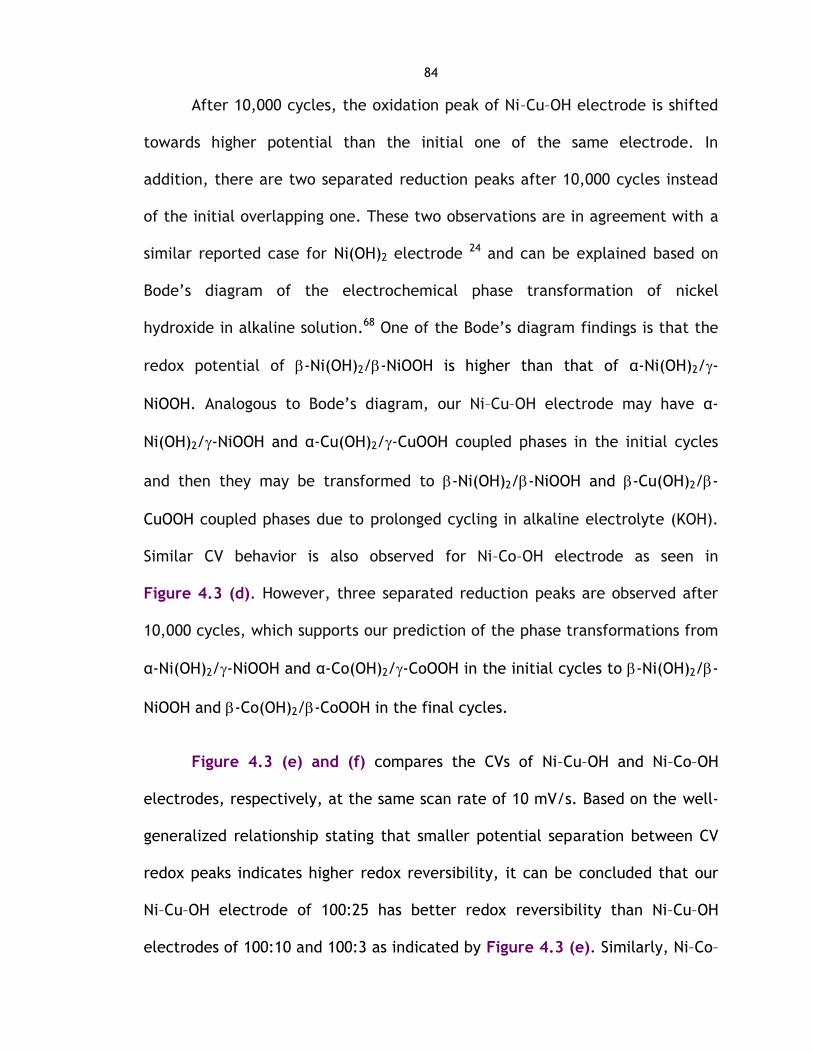
84
After 10,000 cycles, the oxidation peak of Ni–Cu–OH electrode is shifted
towards higher potential than the initial one of the same electrode. In
addition, there are two separated reduction peaks after 10,000 cycles instead
of the initial overlapping one. These two observations are in agreement with a
similar reported case for Ni(OH)2 electrode 24 and can be explained based on
Bode’s diagram of the electrochemical phase transformation of nickel
hydroxide in alkaline solution.68 One of the Bode’s diagram findings is that the
redox potential of -Ni(OH)2/-NiOOH is higher than that of α-Ni(OH)2/-
NiOOH. Analogous to Bode’s diagram, our Ni–Cu–OH electrode may have α-
Ni(OH)2/-NiOOH and α-Cu(OH)2/-CuOOH coupled phases in the initial cycles
and then they may be transformed to -Ni(OH)2/-NiOOH and -Cu(OH)2/-
CuOOH coupled phases due to prolonged cycling in alkaline electrolyte (KOH).
Similar CV behavior is also observed for Ni–Co–OH electrode as seen in
Figure 4.3 (d). However, three separated reduction peaks are observed after
10,000 cycles, which supports our prediction of the phase transformations from
α-Ni(OH)2/-NiOOH and α-Co(OH)2/-CoOOH in the initial cycles to -Ni(OH)2/-
NiOOH and -Co(OH)2/-CoOOH in the final cycles.
Figure 4.3 (e) and (f) compares the CVs of Ni–Cu–OH and Ni–Co–OH
electrodes, respectively, at the same scan rate of 10 mV/s. Based on the well-
generalized relationship stating that smaller potential separation between CV
redox peaks indicates higher redox reversibility, it can be concluded that our
Ni–Cu–OH electrode of 100:25 has better redox reversibility than Ni–Cu–OH
electrodes of 100:10 and 100:3 as indicated by Figure 4.3 (e). Similarly, Ni–Co–

85
OH electrode of 100:25 has better redox reversibility than Ni–Co–OH electrodes
of 100:10 and 100:3 as indicated in Figure 4.3 (f). This redox reversibility
seems to lead to better cycling stability of the devices. CVs at different scan
rates of all Ni–Cu–OH and Ni–Co–OH electrodes of 100:3, 100:10 and 100:25 are
shown in Figure 4.11 of the Supplementary Information.
Figure 4.4 (a) and (b) The cycling stability curves of Ni–Cu–OH and Ni–Co–OH electrodes, respectively. (c) and (d) Areal capacitances of Ni–Cu–OH and Ni–Co–OH electrodes, respectively. (e) and (f) Specific capacitances of Ni–Cu–OH and
Ni–Co–OH electrodes, respectively.
Figure 4.4 (a) and (b) represents the cycling stability curves of Ni–Cu–OH
and Ni–Co–OH electrodes, respectively, of 100:3, 100:10 and 100:25. It can be
concluded that using Ni–Cu–OH and Ni–Co–OH electrodes of 100:25 leads to
higher capacitance retention during 10,000 CD cycles at 10 A/g, than that of
other electrodes of 100:10 and 100:3. This improvement in cycling stability can
226
409
1235
1952
124 156
252
433
100:25 100:10 100:3
0
200
400
600
800
1000
1200
1400
Are
al C
ap
acita
nce
[m
F/c
m2]
Ni:Co Ratio
10 A/g
Before 10000 cycles
After 10000 cycles
45%CA
Drop
62%CA
Drop
80%CA
Drop
1213
13501281
1050
667
516
262 233
100:25 100:10 100:3
0
400
800
1200
1600
2000
Sp
ecific
Cap
acita
nce
[F
/g]
Ni:Co Ratio
10 A/g
Before 10000 cycles
After 10000 cycles
62%Cs
Drop
45%Cs
Drop
80%Cs
Drop
265
1041
1265
1050
125
324372
233
100:25 100:10 100:3
0
400
800
1200
1600
53%Cs
Drop
69%Cs
Drop
71%Cs
Drop
Sp
ecific
Cap
acita
nce
[F
/g]
Ni:Cu Ratio
10 A/g
Before 10000 cycles
After 10000 cycles
155
219
769
1952
73 68
226
433
100:25 100:10 100:3
0
200
400
600
800
1000
Are
al C
ap
acita
nce
[m
F/c
m2]
Ni:Cu Ratio
10 A/g
Before 10000 cycles
After 10000 cycles
71%Cs
Drop
69%Cs
Drop
53%Cs
Drop
0 2000 4000 6000 8000 10000
0
20
40
60
80
100
Capacitance R
ete
ntion [%
]
Cycle Number
10 A/g
Ni:Cu of 100:25
Ni:Cu of 100:10
Ni:Cu of 100:3
0 2000 4000 6000 8000 10000
0
20
40
60
80
100
Capacitance R
ete
ntion [%
]
Cycles Number
10 A/g
Ni:Co of 100:25
Ni:Co of 100:10
Ni:Co of 100:3
(c) (e)
(b)
(a)
(d) (f)

86
be ascribed to the characteristic difference in the redox reversibility as
indicated by previous CV curves. In addition, Ni–Co–OH electrode of 100:25
exhibits higher capacitance retention of 55% than 47% exhibited by Ni–Cu–OH of
100:25, after 10,000 CD cycles at 10 A/g. Areal capacitances of Ni–Cu–OH and
Ni–Co–OH electrodes are compared in Figure 4.4 (c) and (d), respectively,
while specific capacitances are compared in Figure 4.4 (e) and (f) for Ni–Cu–
OH and Ni–Co–OH electrodes, respectively. As Ni–Cu–OH and Ni–Co–OH
electrodes can be used in rechargeable alkaline batteries, areal and specific
capacities are calculated and compared in Figure 4.12 of the Supplementary
Information. Both areal and specific capacitances have been calculated from
CD curves of Figure 4.4 (a) and (b). It is concluded that using Ni–Cu–OH and Ni–
Co–OH electrodes 100:3 leads to better areal capacitance than that of other
electrodes of 100:10 and 100:25. Such differences in capacitances are expected
due to the different morphologies as shown in previous SEM images. Ni–Co–OH
electrode of 100:10 seems to be the optimum composition of our electrode as
it has higher capacitance retention than Ni–Cu–OH and Ni–Co–OH electrodes of
100:3 in addition to higher areal and specific capacitances than Ni–Cu–OH and
Ni–Co–OH electrodes of 100:25.

87
Figure 4.5 (a) and (b) Complex impedance (Nyquist) plots of Ni–Cu–OH and Ni–Co–OH electrodes of 100:10 before and after 10,000 cycles, respectively.
Enlarged. Nyquist plots are shown in the insets.
Electrochemical impedance spectroscopy results of Ni–Cu–OH and Ni–Co-
OH electrodes of 100:10 are represented by the complex impedance (Nyquist)
plots in Figure 4.5 (a) and (b), respectively. At low frequencies, the 45° phase
angle of Ni–Co–OH electrode’s Nyquist plot represents the presence of Warburg
impedance (W) that is due to diffusion of electrolyte ions to the electrode. At
high frequencies, Ni–Cu–OH electrode has smaller equivalent series resistance
(ESR) than Ni–Co–OH electrode, as can be seen from the x-axis intercept. After
10,000 cycles, the semicircles became more obvious and larger than the initial
semicircles. Such increase in charge transfer resistance (RCT) during prolonged
cycling is one of the factors behind the decrease in capacitance.
0 2000 4000 6000 8000 10000 12000
0
2000
4000
6000
8000
10000
12000
Before 10000 cycles
Ni:Cu of 100:10
Ni:Co of 100:10-Z
'' [
]
Z []
0 10 20 30 40 500
10
20
30
40
50
-Z''
[]
Z []
0 100 200 300 400 500 600 700 800
0
100
200
300
400
500
600
700
800
After 10000 cycles
Ni:Cu of 100:10
Ni:Co of 100:10
-Z''
[]
Z []
0 10 20 30 40 500
10
20
30
40
50
-Z''
[]
Z []
(b) (a)
11.8 12.0 12.2 12.40.0
0.2
0.4
0.6
-Z'' [
]
Z []
11.6 11.8 12.0 12.20.0
0.2
0.4
0.6
-Z'' [
]
Z []

88
Figure 4.6 (a) CD of Ni–Co–OH and Ni–CoOH/ G-CNF electrodes. (b) CV of Ni–Co–OH and Ni–Co-OH/G-CNF electrodes. (c) Nyquist plot of Ni–Co–OH and Ni–Co–
OH/G-CNF electrodes. Enlarged Nyquist plots are shown in the insets. (d) Cycling stability curves of Ni–Co–OH and Ni–Co–OH/G-CNF electrodes. (e) and (f)
Area and specific capacitances of Ni–Co–OH and Ni–Co–OH/G-CNF electrodes, respectively.
Figure 4.6 shows the electrochemical performance of Ni–Co–OH/G-CNF
electrode compared with the previous Ni–Co–OH electrode of Ni:Co ratio of
100:10. Adding G-CNF to Ni–Co–OH electrode leads to increase potential
window as seen in CD and CV curves in Figure 4.6 (a) and (b), respectively, as
expected. Figure 4.6 (c) of Nyquist plot shows that the ESR of Ni–Co–OH/G-CNF
is smaller than that of Ni–Co–OH due to the electrical conductivity of graphene.
Moreover, adding G-CNF to Ni–Co–OH electrode leads to enhanced capacitance
retention over 10,000 cycles as shown in Figure 4.6 (d). This improvement in
the cycling stability can be explained by the fact that there is no phase
transformation involved during the charge–discharge process of G-CNF
0 200 400 600 800 1000 1200 1400 1600 1800
0
200
400
600
800
1000
1200
1400
1600
1800
Ni-Co-OH
Ni-Co-OH/G-CNF
-Z''
[]
Z []
7 8 9 10 11 12 13 140
1
2
3
4
5
6
7
-Z'' [
]
Z []
0 2000 4000 6000 8000 10000
0
10
20
30
40
50
60
70
80
90
100
Ca
pacita
nce
Rete
ntio
n [
%]
Cycles Number
10 A/g
Ni-Co-OH
Ni-Co-OH/G-CNF
0.0 0.2 0.4 0.6 0.8
-20
-10
0
10
20
Cu
rre
nt
[mA
]
Potential vs. SCE [V]
10 mV/s
Ni-Co-OH
Ni-Co-OH/G-CNF
0 20 40 60 80 100 120 140 160
0.0
0.1
0.2
0.3
0.4
0.5
0.6
0.7
0.8
Po
tentia
l vs. S
CE
[V
]
Time [s]
10 A/g
Ni-Co-OH
Ni-Co-OH/G-CNF
409
507
156
297
0
100
200
300
400
500
600
700
Ni-Co-OH/G-CNF
Are
al C
ap
acita
nce
[m
F/c
m2]
Sample
10 A/g
Before 10000 cycles
After 10000 cycles
41%CA
Drop
62%CA
Drop
Ni-Co-OH
1350
425516
249
0
200
400
600
800
1000
1200
1400
Ni-Co-OH Ni-Co-OH/G-CNF
Sp
ecific
Cap
acita
nce
[F
/g]
Sample
10 A/g
Before 10000 cycles
After 10000 cycles
41%Cs
Drop
62%Cs
Drop
(b) (c)
(d)
(a)
(e) (f)

89
electrode. Figure 4.6 (e) and (f) represents areal capacitance and specific
capacitance, respectively. Ni–Co–OH/G-CNF electrode has higher areal
capacitance (507 mF/cm2) than Ni–Co–OH electrode (409 mF/cm2). By taking
into account that both electrodes have the same substrate area (1 cm2), the
areal capacitances of these electrodes are actually equivalent to their absolute
capacitances. The specific capacitances cannot be measured accurately as
shown in Figure 4.6 (f) due to the big difference in mass loadings of Ni–Co–
OH/G-CNF and Ni–Co–OH. The mass loading of Ni–Co–OH/G-CNF (1.19 mg/cm2)
is 4 times higher than that of Ni–Co–OH (0.30 mg/cm2) because Ni–Co–OH can be
deposited on larger surface area when using G-CNF carbon microfibers than
using only carbon microfibers. As Ni–Co–OH/G-CNF electrode can be used in
rechargeable alkaline batteries, areal and specific capacities are calculated
and compared in Figure 4.12 (c) and (d) of the Supplementary Information.
4.4. CONCLUSIONS
In this project, Ni–Cu–OH and Ni–Co–OH electrodes were prepared using
different Ni:Cu and Ni:Co ratios by CBD at room temperature on carbon
microfibers. It is observed that incorporation of Co at lower concentration
(100:10) enhances nanoflake formation and hence increases capacitance and
cycling stability. The improvement in cycling stability can be ascribed to the
characteristic difference in the redox reversibility as indicated by CV curves.
Phase transformations of Ni–Cu–OH and Ni–Co–OH electrodes are indicated by
the shifting and the splitting of CD plateaus and the shifting and the splitting of
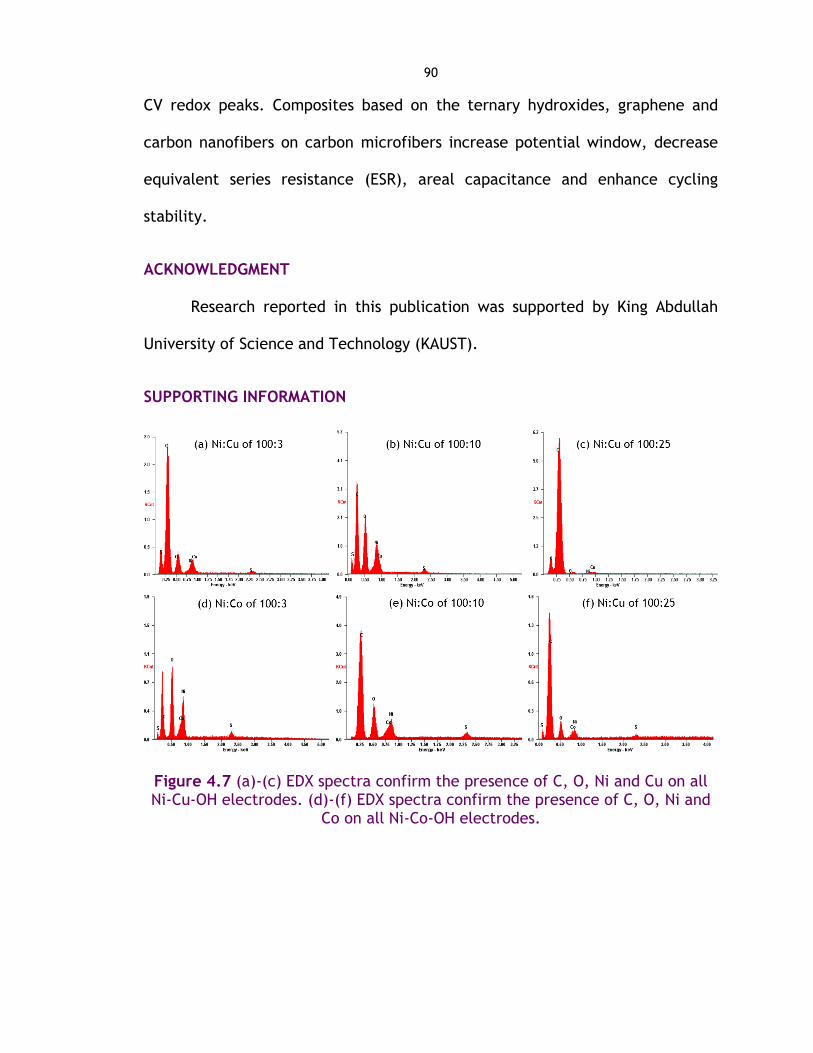
90
CV redox peaks. Composites based on the ternary hydroxides, graphene and
carbon nanofibers on carbon microfibers increase potential window, decrease
equivalent series resistance (ESR), areal capacitance and enhance cycling
stability.
ACKNOWLEDGMENT
Research reported in this publication was supported by King Abdullah
University of Science and Technology (KAUST).
SUPPORTING INFORMATION
Figure 4.7 (a)-(c) EDX spectra confirm the presence of C, O, Ni and Cu on all Ni-Cu-OH electrodes. (d)-(f) EDX spectra confirm the presence of C, O, Ni and
Co on all Ni-Co-OH electrodes.
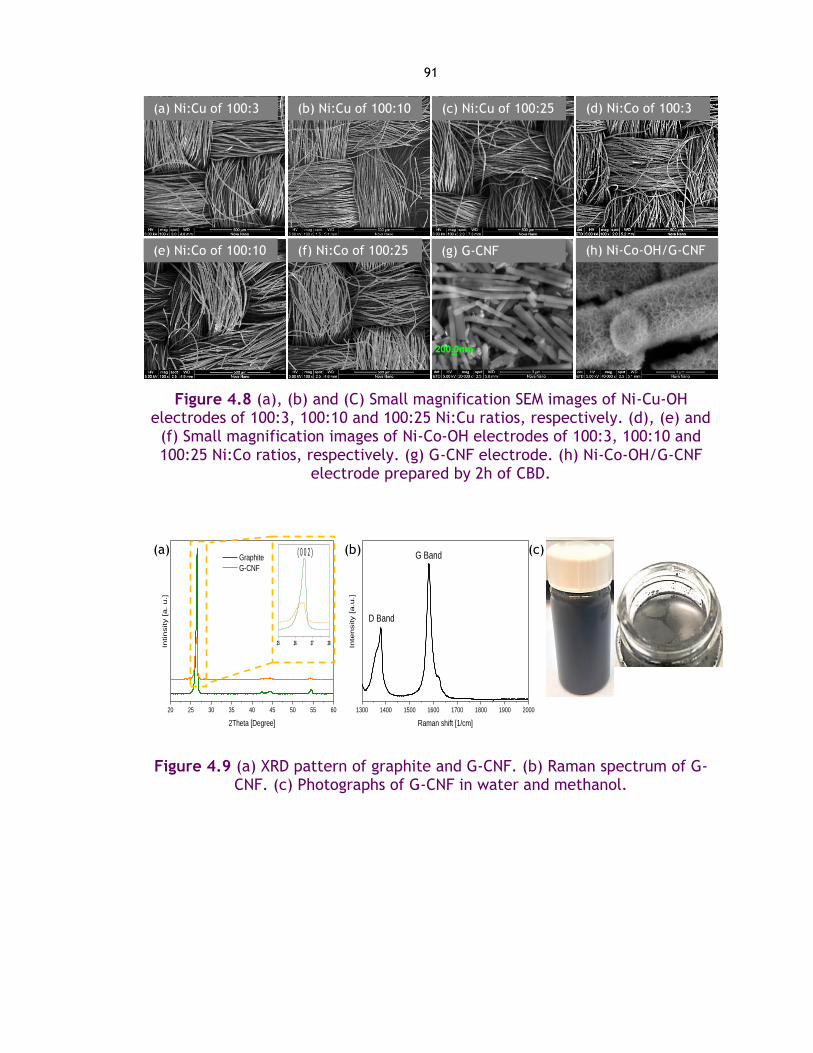
91
Figure 4.8 (a), (b) and (C) Small magnification SEM images of Ni-Cu-OH electrodes of 100:3, 100:10 and 100:25 Ni:Cu ratios, respectively. (d), (e) and
(f) Small magnification images of Ni-Co-OH electrodes of 100:3, 100:10 and 100:25 Ni:Co ratios, respectively. (g) G-CNF electrode. (h) Ni-Co-OH/G-CNF
electrode prepared by 2h of CBD.
Figure 4.9 (a) XRD pattern of graphite and G-CNF. (b) Raman spectrum of G-CNF. (c) Photographs of G-CNF in water and methanol.
(a) Ni:Cu of 100:3 (b) Ni:Cu of 100:10 (c) Ni:Cu of 100:25 (d) Ni:Co of 100:3
(e) Ni:Co of 100:10 (f) Ni:Co of 100:25 (h) Ni-Co-OH/G-CNF (g) G-CNF
20 25 30 35 40 45 50 55 60
Intin
sity [a. u.]
2Theta [Degree]
Graphite
G-CNF
25 26 27 28
( 0 0 2 )
1300 1400 1500 1600 1700 1800 1900 2000
G Band
D Band
Inte
nsity [a.u
.]
Raman shift [1/cm]
(b) (c) (a)
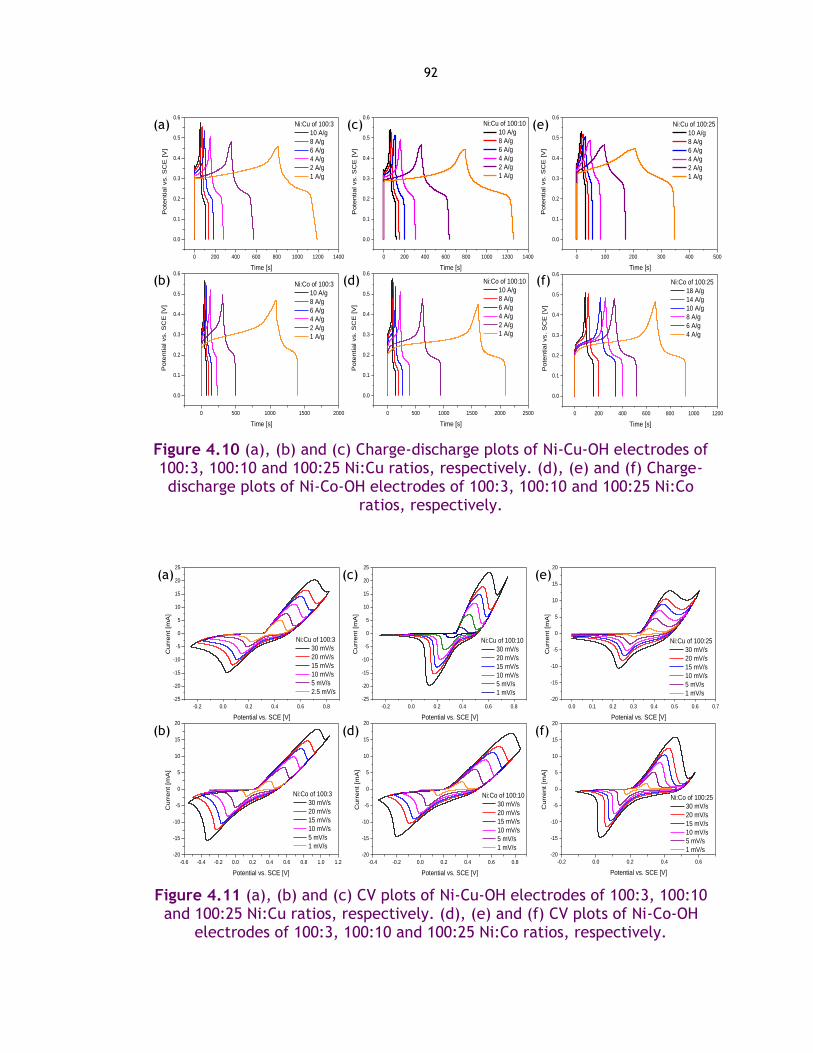
92
Figure 4.10 (a), (b) and (c) Charge-discharge plots of Ni-Cu-OH electrodes of 100:3, 100:10 and 100:25 Ni:Cu ratios, respectively. (d), (e) and (f) Charge-discharge plots of Ni-Co-OH electrodes of 100:3, 100:10 and 100:25 Ni:Co
ratios, respectively.
Figure 4.11 (a), (b) and (c) CV plots of Ni-Cu-OH electrodes of 100:3, 100:10 and 100:25 Ni:Cu ratios, respectively. (d), (e) and (f) CV plots of Ni-Co-OH
electrodes of 100:3, 100:10 and 100:25 Ni:Co ratios, respectively.
0 200 400 600 800 1000 1200
0.0
0.1
0.2
0.3
0.4
0.5
0.6
Po
tentia
l vs. S
CE
[V
]
Time [s]
Ni:Co of 100:25
18 A/g
14 A/g
10 A/g
8 A/g
6 A/g
4 A/g
0 100 200 300 400 500
0.0
0.1
0.2
0.3
0.4
0.5
0.6
Pote
ntial vs. S
CE
[V
]
Time [s]
Ni:Cu of 100:25
10 A/g
8 A/g
6 A/g
4 A/g
2 A/g
1 A/g
0 200 400 600 800 1000 1200 1400
0.0
0.1
0.2
0.3
0.4
0.5
0.6
Pote
ntial vs. S
CE
[V
]
Time [s]
Ni:Cu of 100:10
10 A/g
8 A/g
6 A/g
4 A/g
2 A/g
1 A/g
0 200 400 600 800 1000 1200 1400
0.0
0.1
0.2
0.3
0.4
0.5
0.6
Pote
ntial vs. S
CE
[V
]
Time [s]
Ni:Cu of 100:3
10 A/g
8 A/g
6 A/g
4 A/g
2 A/g
1 A/g
0 500 1000 1500 2000 2500
0.0
0.1
0.2
0.3
0.4
0.5
0.6
Pote
ntial vs. S
CE
[V
]
Time [s]
Ni:Co of 100:10
10 A/g
8 A/g
6 A/g
4 A/g
2 A/g
1 A/g
0 500 1000 1500 2000
0.0
0.1
0.2
0.3
0.4
0.5
0.6
Pote
ntial vs. S
CE
[V
]
Time [s]
Ni:Co of 100:3
10 A/g
8 A/g
6 A/g
4 A/g
2 A/g
1 A/g
(c) (e)
(b)
(a)
(d) (f)
-0.2 0.0 0.2 0.4 0.6 0.8
-25
-20
-15
-10
-5
0
5
10
15
20
25
Curr
ent [m
A]
Potential vs. SCE [V]
Ni:Cu of 100:10
30 mV/s
20 mV/s
15 mV/s
10 mV/s
5 mV/s
1 mV/s
-0.2 0.0 0.2 0.4 0.6
-20
-15
-10
-5
0
5
10
15
20
Cu
rre
nt
[mA
]
Potential vs. SCE [V]
Ni:Co of 100:25
30 mV/s
20 mV/s
15 mV/s
10 mV/s
5 mV/s
1 mV/s
-0.4 -0.2 0.0 0.2 0.4 0.6 0.8
-20
-15
-10
-5
0
5
10
15
20
Curr
ent [m
A]
Potential vs. SCE [V]
Ni:Co of 100:10
30 mV/s
20 mV/s
15 mV/s
10 mV/s
5 mV/s
1 mV/s
-0.6 -0.4 -0.2 0.0 0.2 0.4 0.6 0.8 1.0 1.2
-20
-15
-10
-5
0
5
10
15
20
Curr
ent [m
A]
Potential vs. SCE [V]
Ni:Co of 100:3
30 mV/s
20 mV/s
15 mV/s
10 mV/s
5 mV/s
1 mV/s
0.0 0.1 0.2 0.3 0.4 0.5 0.6 0.7
-20
-15
-10
-5
0
5
10
15
20
Curr
ent [m
A]
Potenial vs. SCE [V]
Ni:Cu of 100:25
30 mV/s
20 mV/s
15 mV/s
10 mV/s
5 mV/s
1 mV/s
-0.2 0.0 0.2 0.4 0.6 0.8
-25
-20
-15
-10
-5
0
5
10
15
20
25
Curr
ent [m
A]
Potential vs. SCE [V]
Ni:Cu of 100:3
30 mV/s
20 mV/s
15 mV/s
10 mV/s
5 mV/s
2.5 mV/s
(c) (e)
(b)
(a)
(d) (f)

93
Figure 4.12 (a) and (b) Areal capacity of Ni-Cu-OH and Ni-Co-OH electrodes, respectively. (c) Areal capacity of Ni-Co-OH (100:10) and Ni-Co-OH/G-CNF
electrodes. (d) and (e) Specific capacity of Ni-Cu-OH and Ni-Co-OH electrodes, respectively. (f) Specific capacity of Ni-Co-OH (100:10) and Ni-Co-OH/G-CNF
electrodes.
39
154
187
18
4855
100:25 100:10 100:3
0
40
80
120
160
200
Specific
Capacity [m
A.h
/g]
Ni:Cu Ratio
10 A/g
Before 10000 cycles
After 10000 cycles
53%Cs
Drop
69%Cs
Drop
71%Cs
Drop
23
32
102
11 10
30
100:25 100:10 100:3
0
20
40
60
80
100
120
Are
al C
apacity [
A.h
/cm
2]
Ni:Cu Ratio
10 A/g
Before 10000 Cycles
After 10000 Cycles
53%CA
Drop
69%CA
Drop
71%CA
Drop
183
204194
101
78
40
100:25 100:10 100:3
0
40
80
120
160
200
240
280
Specific
Capacity [m
A.h
/g]
Ni:Co Ratio
10 A/g
Before 10000 cycles
After 10000 cycles
45%Cs
Drop62%C
s
Drop 80%Cs
Drop
34
62
187
19 24
38
100:25 100:10 100:3
0
40
80
120
160
200
Are
al C
apacity [
A.h
/cm
2]
Ni:Co Ratio
10 A/g
Before 10000 cycles
After 10000 cycles
45%CA
Drop
62%CA
Drop
80%CA
Drop
(b)
(d)
(a)
(e)
(c)
(f)
62
99
24
58
Ni-Co-OH Ni-Co-OH/G-CNF
0
20
40
60
80
100
120
140
Are
al C
apacity [
A.h
/cm
2]
Sample
10 A/g
Before 10000 cycles
After 10000 cycles
62%CA
Drop
41%CA
Drop
204
8378
49
Ni-Co-OH Ni-Co-OH/G-CNF
0
50
100
150
200
250
41%CA
Drop
62%CA
Drop
Specific
Capacity [m
A.h
/g]
Sample
10 A/g
Before 10000 cycles
After 10000 cycles
94
Chapter 5 . NICKEL-BASED ASYMMETRIC
SUPERCAPACITORS
Nuha A. Alhebshi and H. N. Alshareef, Flexible and low-cost asymmetric
supercapacitors based on Ni-Co-OH and Graphene-carbon nanofibers
Electrodes, to be submitted.
ABSTRACT
In this project, we have fabricated Ni(OH)2 based asymmetric
supercapacitors with enhanced electrochemical performance, flexible-
electrodes, low-cost fabrication process, and environmentally friendly
materials. Ni-based electrodes have been prepared by chemical bath deposition
(CBD). Graphene and carbon nanofibers (G-CNF) electrodes have been prepared
by chemical exfoliation method. Both electrodes have been deposited at room
temperature on flexible carbon microfibers as current collectors.
Ni(OH)2//Graphene asymmetric supercapacitor results in an areal capacitance
of 253 mF/cm2 at 5 mA/cm2 which is higher than reported 185 mF/cm2 at 5
mA/cm2 for NiO//rGO asymmetric supercapacitor prepared by hydrothermal
method. Ni-Co-OH/G-CNF//Graphene asymmetric supercapacitor results in a
maximum power of 23 mW within 2.2 V which is higher than the maximum
power and the maximum operating voltage of our Ni(OH)2//Graphene (15.94
mW within 1.8 V).
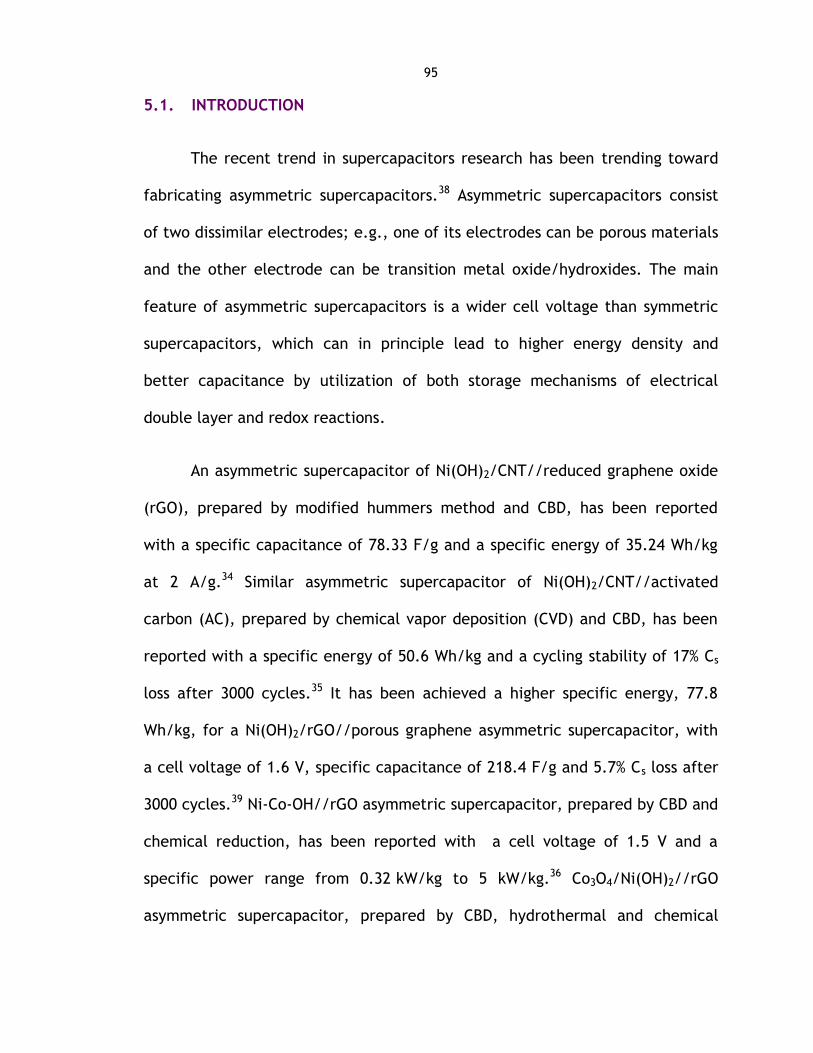
95
5.1. INTRODUCTION
The recent trend in supercapacitors research has been trending toward
fabricating asymmetric supercapacitors.38 Asymmetric supercapacitors consist
of two dissimilar electrodes; e.g., one of its electrodes can be porous materials
and the other electrode can be transition metal oxide/hydroxides. The main
feature of asymmetric supercapacitors is a wider cell voltage than symmetric
supercapacitors, which can in principle lead to higher energy density and
better capacitance by utilization of both storage mechanisms of electrical
double layer and redox reactions.
An asymmetric supercapacitor of Ni(OH)2/CNT//reduced graphene oxide
(rGO), prepared by modified hummers method and CBD, has been reported
with a specific capacitance of 78.33 F/g and a specific energy of 35.24 Wh/kg
at 2 A/g.34 Similar asymmetric supercapacitor of Ni(OH)2/CNT//activated
carbon (AC), prepared by chemical vapor deposition (CVD) and CBD, has been
reported with a specific energy of 50.6 Wh/kg and a cycling stability of 17% Cs
loss after 3000 cycles.35 It has been achieved a higher specific energy, 77.8
Wh/kg, for a Ni(OH)2/rGO//porous graphene asymmetric supercapacitor, with
a cell voltage of 1.6 V, specific capacitance of 218.4 F/g and 5.7% Cs loss after
3000 cycles.39 Ni-Co-OH//rGO asymmetric supercapacitor, prepared by CBD and
chemical reduction, has been reported with a cell voltage of 1.5 V and a
specific power range from 0.32 kW/kg to 5 kW/kg.36 Co3O4/Ni(OH)2//rGO
asymmetric supercapacitor, prepared by CBD, hydrothermal and chemical

96
reduction, has been reported with a specific capacitance of 95.7 F/g at 5
mA/cm2.37
5.2. EXPERIMENTAL METHODS
5.2.1. Synthesis of Graphene and Carbon Nanofibers Electrodes
Graphene and carbon nanofibers (G-CNF) were prepared by chemical
exfoliation. A mixture of 100 mg of graphite and 16.5 mg of 1-pyrenecarboxylic
acid (PCA) in 50 mL of methanol were sonicated for 45 minutes (BRANSON
Ultrasonic Cleaner 2510). Then, additional 200 mL of DI H2O was added to the
mixture with continuous sonication for several hours. G-CNF were collected by
vacuum filtering using nanoporous membrane (Celgard 3501). The collected G-
CNF were dissolved in ethanol and casted drop by drop on carbon microfibers
substrate at 60oC followed by washing with DI H2O several times and drying in
air overnight. For comparison purposes, a commercial graphene was dissolved
with polytetrafluoroethylene (PTFE) in ethanol and casted drop by drop on
carbon microfibers substrate at 60 oC followed by washing with DI H2O several
times and drying in air overnight.
5.2.2. Synthesis of Ni(OH)2 and Ni-Co-OH/G-CN Electrodes
Ni(OH)2 and Ni-Co-OH electrodes were prepared by CBD with Ni:Co ratios
of 100:0 and 100:10, respectively. The chemical bath consisted of fixed 1M of
Nickel(II) Sulfate Hexahydrate (NiSO4.6H2O), changed molarities (0M and 0.10M)
of Cobalt(II) Chloride Hexahydrate (CoCl2.6H2O) and deionized (DI) water (H2O)

97
in Pyrex beakers at room temperature. Then, 1.56 mL of ammonium hydroxide
solution (30-33% NH3 in H2O) and 0.15M of potassium persulfate (K2S2O8) were
added subsequently to the mixture. Several pieces of commercial carbon
microfibers substrates from Fuel Cell Store (carbon cloth 7302003, 99% carbon
content and 11.5 mg/cm2) were immersed in the chemical bath by clamps at
room temperature. The immersed parts of all carbon substrates have the same
area of 1.00 cm2. After 2 h, the coated substrates were taken out, washed
several times by DI H2O and dried in air at room temperature overnight. All the
chemicals used in this project are analytical grade (SIGMA-ALDRICH) and
without further purification. Finally, G-CNF on carbon microfibers were used as
substrates in CBD of the same previous procedure of Ni-Co-OH to prepare Ni-
Co-OH/G-CNF electrodes.
5.2.3. Materials Characterization
The mass loading of each electrode was calculated by weighing the
carbon substrate before and after the CBD using a sensitive microbalance from
METTLER TOLEDO (XP26, 0.001 mg resolution). The morphology of G-CNF,
Ni(OH)2, Ni-Co-OH/G-CNF electrodes were observed by scanning electron
microscope (SEM) at different magnifications.
5.2.4. Electrochemical Measurements
For full-cell measurements, two asymmetric supercapacitors have been
fabricated. First, Ni(OH)2 was used as a positive electrode and graphene was
used as a negative electrode for comparison proposes. Second, Ni-Co-OH on G-

98
CNF were used as a positive electrode and graphene was used as a negative
electrode. The aqueous electrolyte solution was 1M of potassium hydroxide
(KOH). Electrochemical redox reactions were studied by cyclic voltammetry
(CV). Electrode capacitances and cycling stability were calculated by
chronopotentiometry charge-discharge (CD). Equivalent series resistances,
charge transfer resistances and the diffusion control were studied by
electrochemical impedance spectroscopy (EIS). All experiments were carried
out using a multi-channel Potentiostat/ Galvanostat/ EIS from BioLogic Science
Instruments (VMP3).
Figure 5.1 SEM images of (a) Carbon nanofibers (graphene in inset). (b) Nickel hydroxide. (c) Nickel-cobalt hydroxides on graphene and carbon nanofibers.
5.3. RESULTS AND DISCUSSIONS
5.3.1. Materials Properties
Figure 5.1 (a) shows the morphology of G-CNF. It can be seen that the
carbon nanofiber diameter is around 200 nm and the graphene thickness is
around 13 nm. Figure 5.1 (b) shows that Ni(OH)2 has nanoflakes morphology in
(a) G-CNF (c) Ni-Co-OH/G-CNF (b) Ni(OH)2
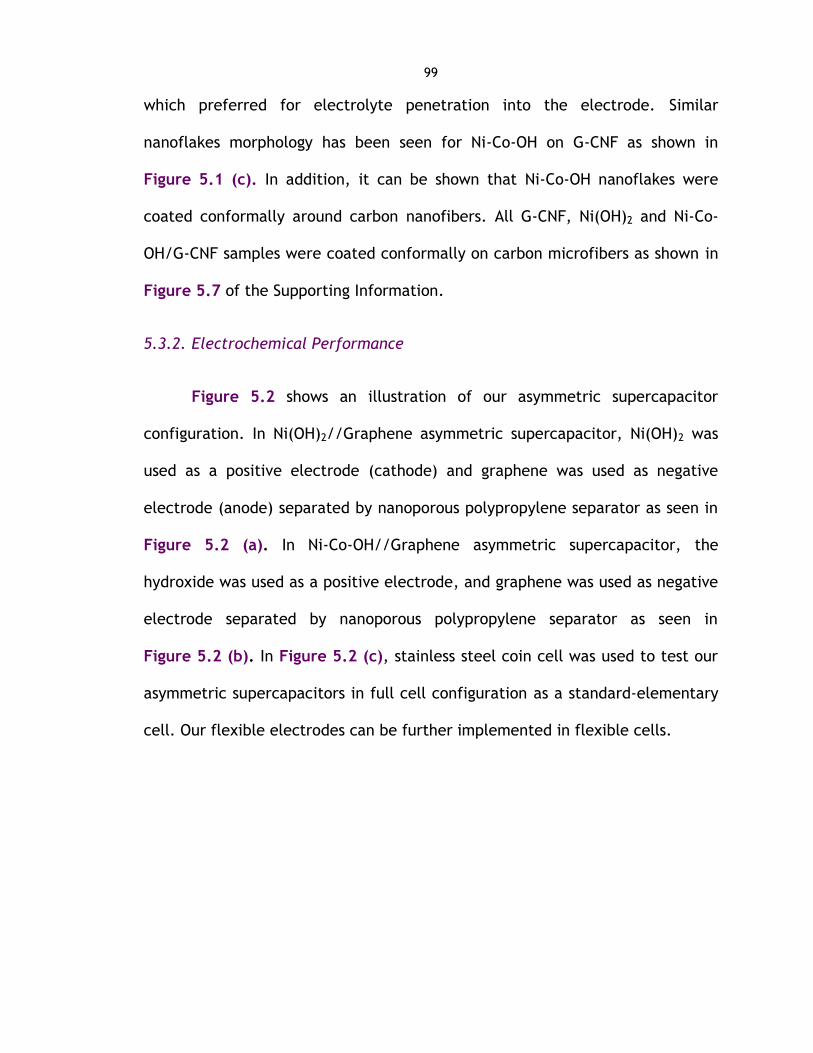
99
which preferred for electrolyte penetration into the electrode. Similar
nanoflakes morphology has been seen for Ni-Co-OH on G-CNF as shown in
Figure 5.1 (c). In addition, it can be shown that Ni-Co-OH nanoflakes were
coated conformally around carbon nanofibers. All G-CNF, Ni(OH)2 and Ni-Co-
OH/G-CNF samples were coated conformally on carbon microfibers as shown in
Figure 5.7 of the Supporting Information.
5.3.2. Electrochemical Performance
Figure 5.2 shows an illustration of our asymmetric supercapacitor
configuration. In Ni(OH)2//Graphene asymmetric supercapacitor, Ni(OH)2 was
used as a positive electrode (cathode) and graphene was used as negative
electrode (anode) separated by nanoporous polypropylene separator as seen in
Figure 5.2 (a). In Ni-Co-OH//Graphene asymmetric supercapacitor, the
hydroxide was used as a positive electrode, and graphene was used as negative
electrode separated by nanoporous polypropylene separator as seen in
Figure 5.2 (b). In Figure 5.2 (c), stainless steel coin cell was used to test our
asymmetric supercapacitors in full cell configuration as a standard-elementary
cell. Our flexible electrodes can be further implemented in flexible cells.
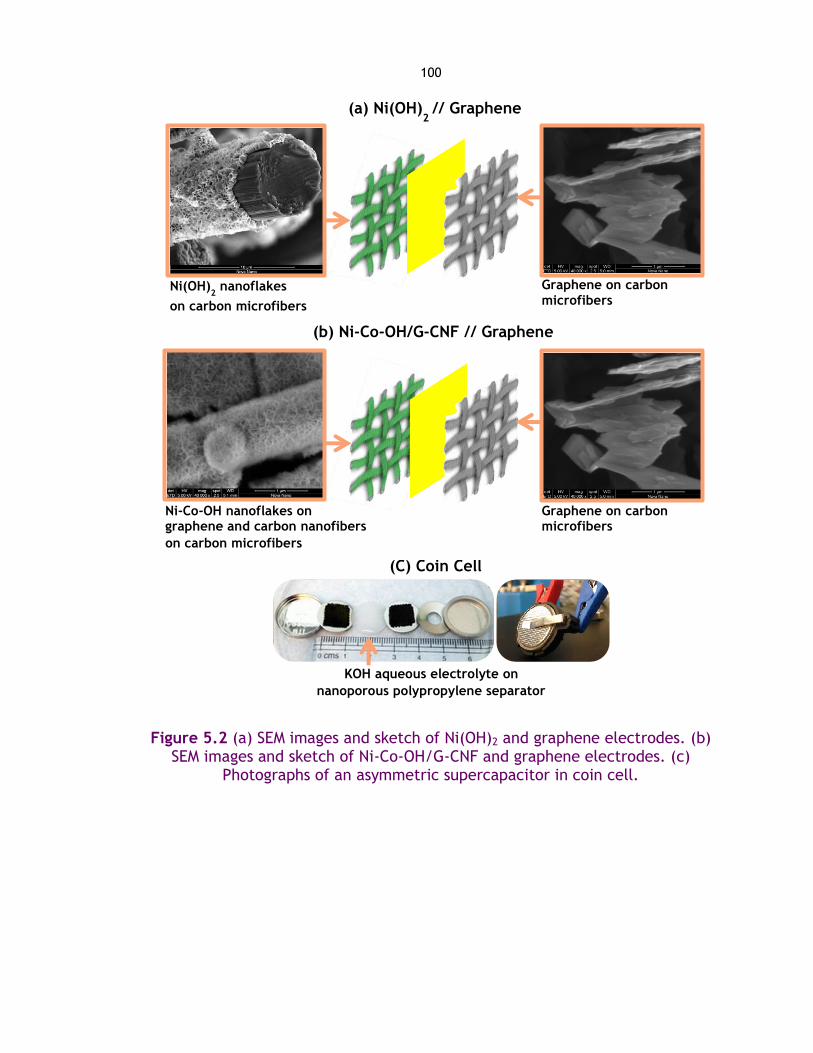
100
Figure 5.2 (a) SEM images and sketch of Ni(OH)2 and graphene electrodes. (b) SEM images and sketch of Ni-Co-OH/G-CNF and graphene electrodes. (c)
Photographs of an asymmetric supercapacitor in coin cell.
Ni(OH)2 nanoflakes
on carbon microfibers
Graphene on carbon microfibers
Ni-Co-OH nanoflakes on graphene and carbon nanofibers
on carbon microfibers
Graphene on carbon microfibers
KOH aqueous electrolyte on nanoporous polypropylene separator
(a) Ni(OH)2 // Graphene
(b) Ni-Co-OH/G-CNF // Graphene
(C) Coin Cell
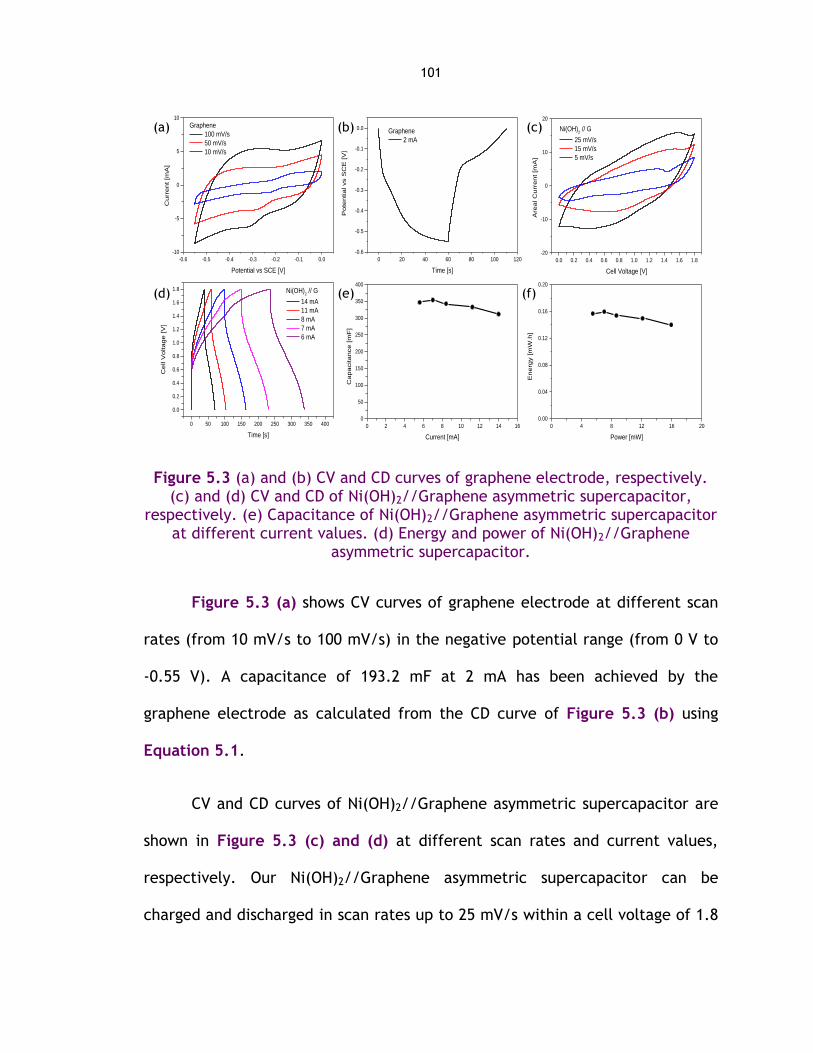
101
Figure 5.3 (a) and (b) CV and CD curves of graphene electrode, respectively. (c) and (d) CV and CD of Ni(OH)2//Graphene asymmetric supercapacitor,
respectively. (e) Capacitance of Ni(OH)2//Graphene asymmetric supercapacitor at different current values. (d) Energy and power of Ni(OH)2//Graphene
asymmetric supercapacitor.
Figure 5.3 (a) shows CV curves of graphene electrode at different scan
rates (from 10 mV/s to 100 mV/s) in the negative potential range (from 0 V to
-0.55 V). A capacitance of 193.2 mF at 2 mA has been achieved by the
graphene electrode as calculated from the CD curve of Figure 5.3 (b) using
Equation 5.1.
CV and CD curves of Ni(OH)2//Graphene asymmetric supercapacitor are
shown in Figure 5.3 (c) and (d) at different scan rates and current values,
respectively. Our Ni(OH)2//Graphene asymmetric supercapacitor can be
charged and discharged in scan rates up to 25 mV/s within a cell voltage of 1.8
0 50 100 150 200 250 300 350 400
0.0
0.2
0.4
0.6
0.8
1.0
1.2
1.4
1.6
1.8
Ce
ll V
olta
ge
[V
]
Time [s]
Ni(OH)2 // G
14 mA
11 mA
8 mA
7 mA
6 mA
0.0 0.2 0.4 0.6 0.8 1.0 1.2 1.4 1.6 1.8
-20
-10
0
10
20
Are
al C
urr
ent
[mA
]
Cell Voltage [V]
Ni(OH)2 // G
25 mV/s
15 mV/s
5 mV/s
-0.6 -0.5 -0.4 -0.3 -0.2 -0.1 0.0
-10
-5
0
5
10
Cu
rre
nt
[mA
]
Potential vs SCE [V]
Graphene
100 mV/s
50 mV/s
10 mV/s
(b) (c)
(d)
(a)
(e) (f)
0 2 4 6 8 10 12 14 16
0
50
100
150
200
250
300
350
400
Capacitance [m
F]
Current [mA]
0 4 8 12 16 20
0.00
0.04
0.08
0.12
0.16
0.20
Energ
y [m
W.h
]
Power [mW]
0 20 40 60 80 100 120
-0.6
-0.5
-0.4
-0.3
-0.2
-0.1
0.0
Po
tentia
l vs S
CE
[V
]
Time [s]
Graphene
2 mA

102
V which is wider than 1.7 V reported for NiO//reduced graphene oxide (rGO)
asymmetric supercapacitor prepared by hydrothermal method.69
Figure 5.3 (e) shows the capacitance of Ni(OH)2//Graphene asymmetric
supercapacitor at different current values as calculated using Equation 5.1.
The areal capacitance at different current values is shown in Figure 5.8 (a) of
the Supporting Information. The areal capacitance of our Ni(OH)2//Graphene
asymmetric supercapacitor (253 mF/cm2 at 5 mA/cm2) is higher than that of
NiO//rGO asymmetric supercapacitor (185 mF/cm2 at 5 mA/cm2) prepared by
hydrothermal method.69
Figure 5.3 (f) shows the energy and power of Ni(OH)2//Graphene
asymmetric supercapacitor. The areal energy and areal power are shown in
Figure 5.8 (b) of the Supporting Information. Our Ni(OH)2//Graphene
asymmetric supercapacitor have a maximum energy of 0.16 mW.h at a power
of 7.03 mW and a maximum power of 15.94 mW at an energy of 0.14 mW.h.
Figure 5.4 CV curves of Ni-Co-OH/G-CNF//Graphene asymmetric
supercapacitor at different scan rates.
0.0 0.4 0.8 1.2 1.6 2.0 2.4
-90
-60
-30
0
30
60
90
Curr
ent [m
A]
Voltage [V]
Ni-Co-OH/G-CNF // G
10 V/s
8 V/s
6 V/s
4 V/s
0.0 0.4 0.8 1.2 1.6 2.0 2.4
-60
-40
-20
0
20
40
60
Curr
ent [m
A]
Voltage [V]
Ni-Co-OH/G-CNF // G
3 V/s
2 V/s
1 V/s
0.8 V/s
0.6 V/s
0.0 0.2 0.4 0.6 0.8 1.0 1.2 1.4 1.6 1.8
-9
-6
-3
0
3
6
9
Curr
ent [m
A]
Voltage [V]
Ni-Co-OH/G-CNF // G
400 mV/s
200 mV/s
100 mV/s
50 mV/s
10 mV/s
(b) (c) (a)
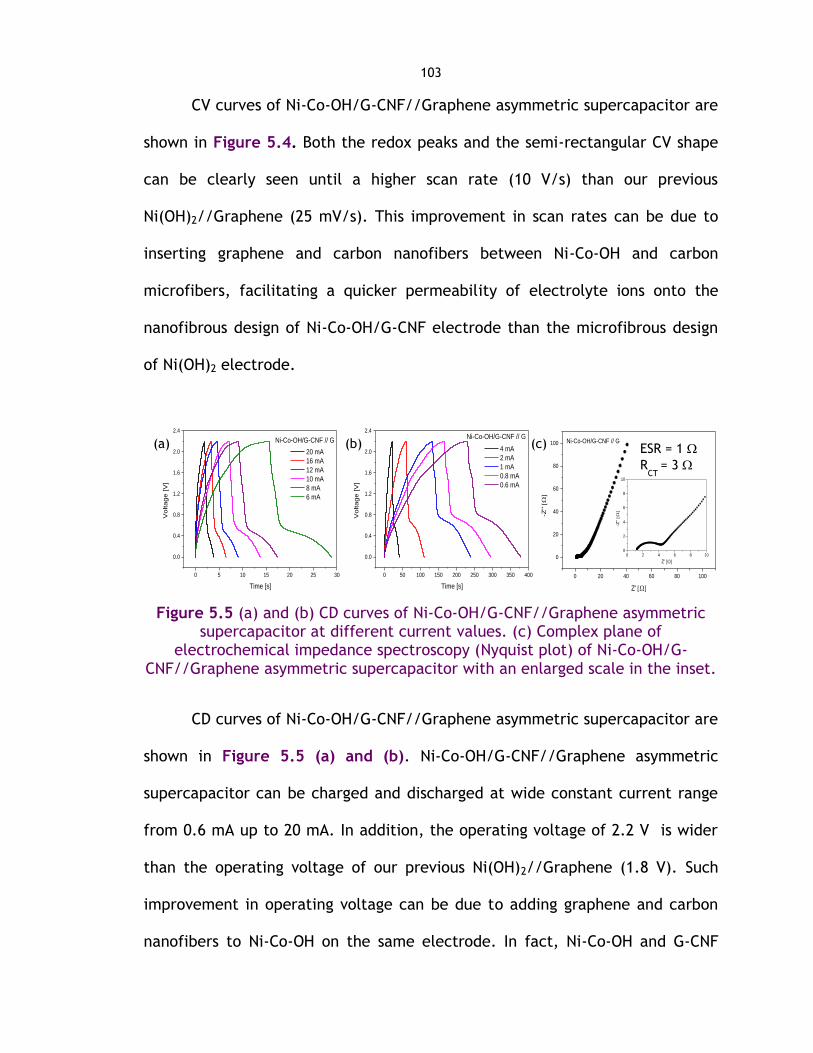
103
CV curves of Ni-Co-OH/G-CNF//Graphene asymmetric supercapacitor are
shown in Figure 5.4. Both the redox peaks and the semi-rectangular CV shape
can be clearly seen until a higher scan rate (10 V/s) than our previous
Ni(OH)2//Graphene (25 mV/s). This improvement in scan rates can be due to
inserting graphene and carbon nanofibers between Ni-Co-OH and carbon
microfibers, facilitating a quicker permeability of electrolyte ions onto the
nanofibrous design of Ni-Co-OH/G-CNF electrode than the microfibrous design
of Ni(OH)2 electrode.
Figure 5.5 (a) and (b) CD curves of Ni-Co-OH/G-CNF//Graphene asymmetric
supercapacitor at different current values. (c) Complex plane of electrochemical impedance spectroscopy (Nyquist plot) of Ni-Co-OH/G-
CNF//Graphene asymmetric supercapacitor with an enlarged scale in the inset.
CD curves of Ni-Co-OH/G-CNF//Graphene asymmetric supercapacitor are
shown in Figure 5.5 (a) and (b). Ni-Co-OH/G-CNF//Graphene asymmetric
supercapacitor can be charged and discharged at wide constant current range
from 0.6 mA up to 20 mA. In addition, the operating voltage of 2.2 V is wider
than the operating voltage of our previous Ni(OH)2//Graphene (1.8 V). Such
improvement in operating voltage can be due to adding graphene and carbon
nanofibers to Ni-Co-OH on the same electrode. In fact, Ni-Co-OH and G-CNF
0 50 100 150 200 250 300 350 400
0.0
0.4
0.8
1.2
1.6
2.0
2.4Ni-Co-OH/G-CNF // G
Vo
lta
ge
[V
]
Time [s]
4 mA
2 mA
1 mA
0.8 mA
0.6 mA
0 5 10 15 20 25 30
0.0
0.4
0.8
1.2
1.6
2.0
2.4
Ni-Co-OH/G-CNF // G
Vo
lta
ge
[V
]
Time [s]
20 mA
16 mA
12 mA
10 mA
8 mA
6 mA
0 20 40 60 80 100
0
20
40
60
80
100
Ni-Co-OH/G-CNF // G
-Z''
Z'
0 2 4 6 8 100
2
4
6
8
10
-Z''
Z'
(b) (c) (a) ESR = 1
RCT
= 3
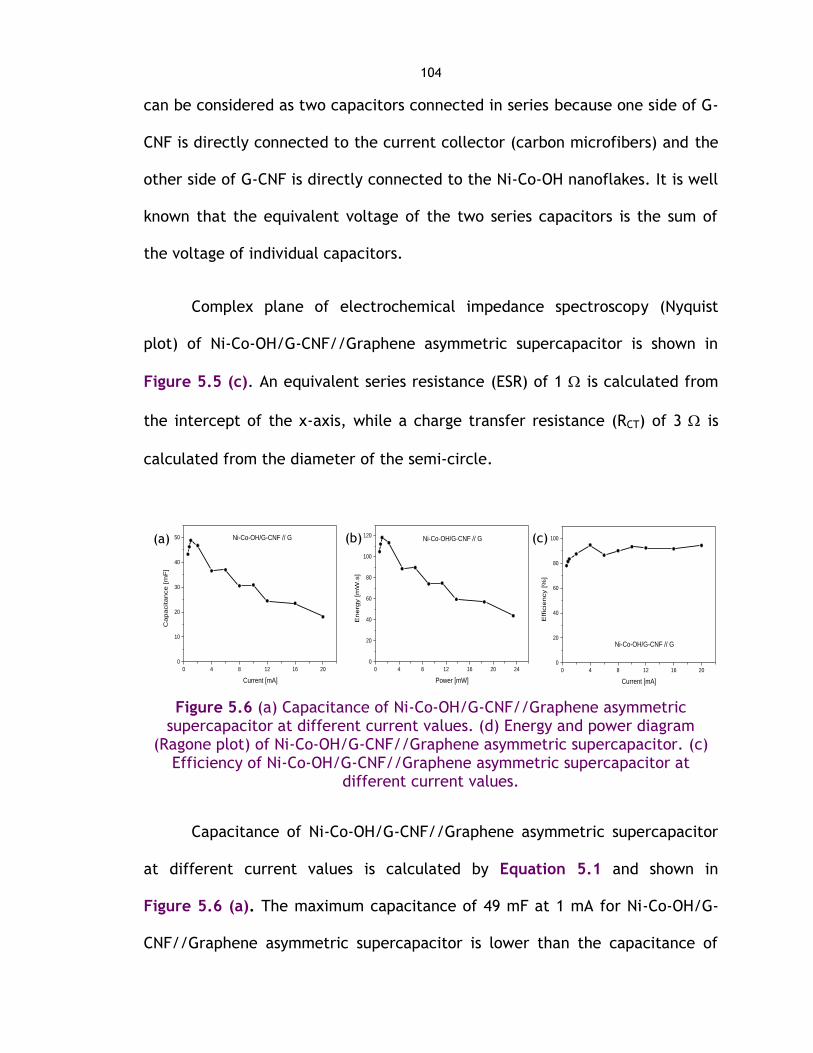
104
can be considered as two capacitors connected in series because one side of G-
CNF is directly connected to the current collector (carbon microfibers) and the
other side of G-CNF is directly connected to the Ni-Co-OH nanoflakes. It is well
known that the equivalent voltage of the two series capacitors is the sum of
the voltage of individual capacitors.
Complex plane of electrochemical impedance spectroscopy (Nyquist
plot) of Ni-Co-OH/G-CNF//Graphene asymmetric supercapacitor is shown in
Figure 5.5 (c). An equivalent series resistance (ESR) of 1 is calculated from
the intercept of the x-axis, while a charge transfer resistance (RCT) of 3 is
calculated from the diameter of the semi-circle.
Figure 5.6 (a) Capacitance of Ni-Co-OH/G-CNF//Graphene asymmetric
supercapacitor at different current values. (d) Energy and power diagram (Ragone plot) of Ni-Co-OH/G-CNF//Graphene asymmetric supercapacitor. (c)
Efficiency of Ni-Co-OH/G-CNF//Graphene asymmetric supercapacitor at different current values.
Capacitance of Ni-Co-OH/G-CNF//Graphene asymmetric supercapacitor
at different current values is calculated by Equation 5.1 and shown in
Figure 5.6 (a). The maximum capacitance of 49 mF at 1 mA for Ni-Co-OH/G-
CNF//Graphene asymmetric supercapacitor is lower than the capacitance of
0 4 8 12 16 20
0
20
40
60
80
100
Effic
iency [%
]
Current [mA]
Ni-Co-OH/G-CNF // G
0 4 8 12 16 20
0
10
20
30
40
50
Capacitance [m
F]
Current [mA]
Ni-Co-OH/G-CNF // G
0 4 8 12 16 20 24
0
20
40
60
80
100
120
Energ
y [m
W.s
]
Power [mW]
Ni-Co-OH/G-CNF // G(b) (c) (a)
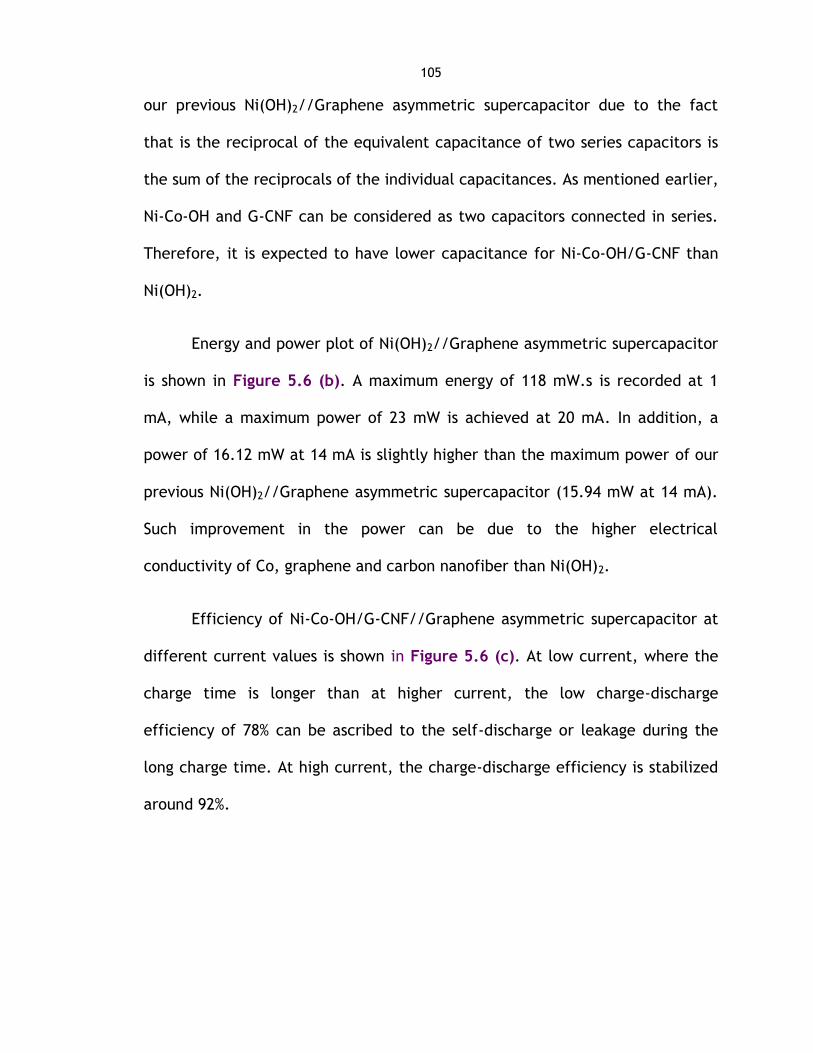
105
our previous Ni(OH)2//Graphene asymmetric supercapacitor due to the fact
that is the reciprocal of the equivalent capacitance of two series capacitors is
the sum of the reciprocals of the individual capacitances. As mentioned earlier,
Ni-Co-OH and G-CNF can be considered as two capacitors connected in series.
Therefore, it is expected to have lower capacitance for Ni-Co-OH/G-CNF than
Ni(OH)2.
Energy and power plot of Ni(OH)2//Graphene asymmetric supercapacitor
is shown in Figure 5.6 (b). A maximum energy of 118 mW.s is recorded at 1
mA, while a maximum power of 23 mW is achieved at 20 mA. In addition, a
power of 16.12 mW at 14 mA is slightly higher than the maximum power of our
previous Ni(OH)2//Graphene asymmetric supercapacitor (15.94 mW at 14 mA).
Such improvement in the power can be due to the higher electrical
conductivity of Co, graphene and carbon nanofiber than Ni(OH)2.
Efficiency of Ni-Co-OH/G-CNF//Graphene asymmetric supercapacitor at
different current values is shown in Figure 5.6 (c). At low current, where the
charge time is longer than at higher current, the low charge-discharge
efficiency of 78% can be ascribed to the self-discharge or leakage during the
long charge time. At high current, the charge-discharge efficiency is stabilized
around 92%.
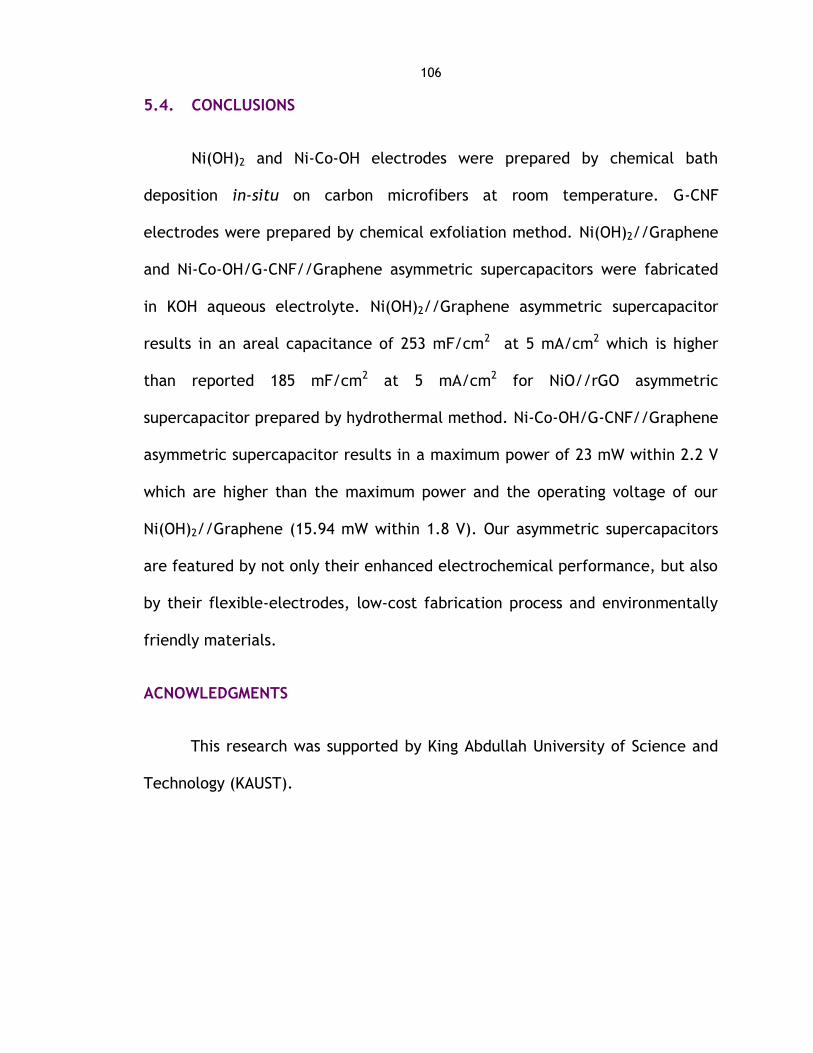
106
5.4. CONCLUSIONS
Ni(OH)2 and Ni-Co-OH electrodes were prepared by chemical bath
deposition in-situ on carbon microfibers at room temperature. G-CNF
electrodes were prepared by chemical exfoliation method. Ni(OH)2//Graphene
and Ni-Co-OH/G-CNF//Graphene asymmetric supercapacitors were fabricated
in KOH aqueous electrolyte. Ni(OH)2//Graphene asymmetric supercapacitor
results in an areal capacitance of 253 mF/cm2 at 5 mA/cm2 which is higher
than reported 185 mF/cm2 at 5 mA/cm2 for NiO//rGO asymmetric
supercapacitor prepared by hydrothermal method. Ni-Co-OH/G-CNF//Graphene
asymmetric supercapacitor results in a maximum power of 23 mW within 2.2 V
which are higher than the maximum power and the operating voltage of our
Ni(OH)2//Graphene (15.94 mW within 1.8 V). Our asymmetric supercapacitors
are featured by not only their enhanced electrochemical performance, but also
by their flexible-electrodes, low-cost fabrication process and environmentally
friendly materials.
ACNOWLEDGMENTS
This research was supported by King Abdullah University of Science and
Technology (KAUST).
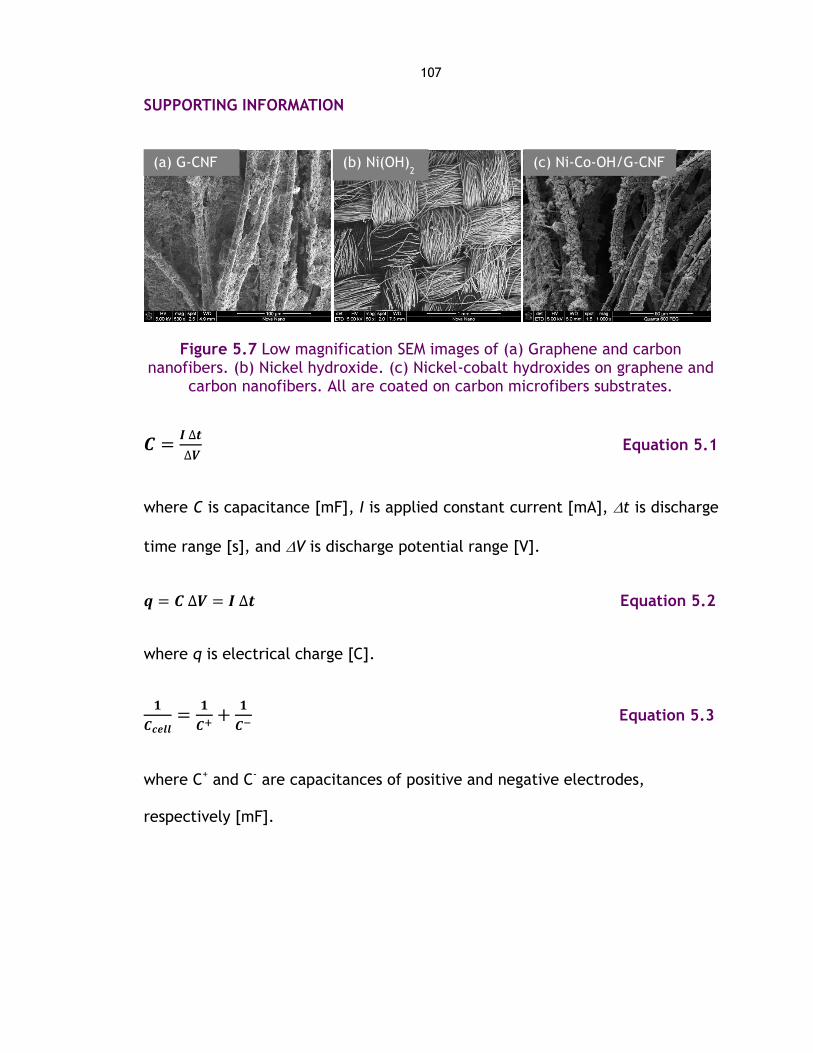
107
SUPPORTING INFORMATION
Figure 5.7 Low magnification SEM images of (a) Graphene and carbon nanofibers. (b) Nickel hydroxide. (c) Nickel-cobalt hydroxides on graphene and
carbon nanofibers. All are coated on carbon microfibers substrates.
Equation 5.1
where C is capacitance [mF], I is applied constant current [mA], t is discharge
time range [s], and V is discharge potential range [V].
Equation 5.2
where q is electrical charge [C].
Equation 5.3
where C+ and C- are capacitances of positive and negative electrodes,
respectively [mF].
(a) G-CNF (c) Ni-Co-OH/G-CNF (b) Ni(OH)2
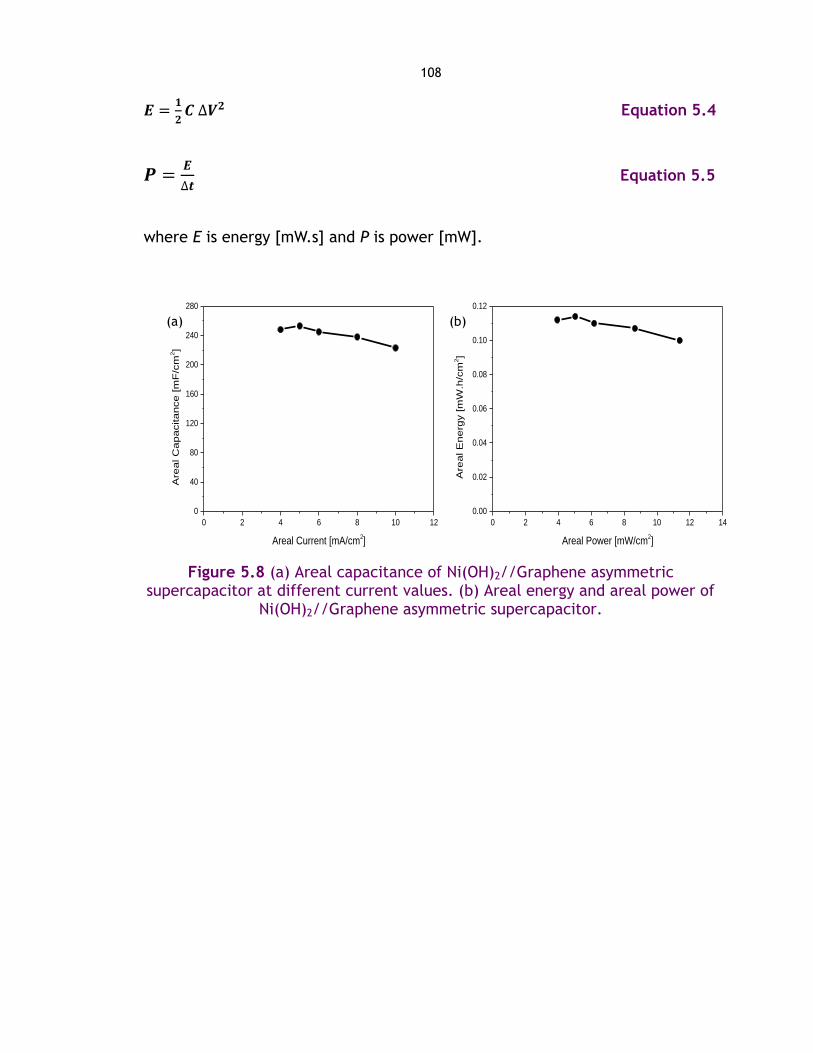
108
Equation 5.4
Equation 5.5
where E is energy [mW.s] and P is power [mW].
Figure 5.8 (a) Areal capacitance of Ni(OH)2//Graphene asymmetric
supercapacitor at different current values. (b) Areal energy and areal power of Ni(OH)2//Graphene asymmetric supercapacitor.
0 2 4 6 8 10 12 14
0.00
0.02
0.04
0.06
0.08
0.10
0.12
Are
al E
nerg
y [m
W.h
/cm
2]
Areal Power [mW/cm2]
0 2 4 6 8 10 12
0
40
80
120
160
200
240
280
Are
al C
apacitance [m
F/c
m2]
Areal Current [mA/cm2]
(a) (b)
109
Chapter 6 . ON-CHIP SUPERCAPACITORS USING NICKEL
HYDROXIDE NANOFLAKES
N. Kurra*, Nuha A. Alhebshi* and H. N. Alshareef, Microfabricated
Pseudocapacitors Using Ni(OH)2 Electrodes Exhibit Remarkable Volumetric
Capacitance and Energy Density. Advanced Energy Materials, 5, 1401303, doi:
10.1002/aenm.201401303 (2015) *Contributed equally
ABSTRACT
Metal hydroxide based microfabricated pseudocapacitors with impressive
volumetric stack capacitance and energy density are demonstrated. A
combination of top-down photolithographic process and bottom-up chemical
synthesis is employed to fabricate the micro-pseudocapacitors (μ-
pseudocapacitors). The resulting Ni(OH)2-based devices show several excellent
characteristics including high-rate redox activity up to 500 V s–1 and an areal
cell capacitance of 16 mF cm–2 corresponding to a volumetric stack capacitance
of 325 F cm–3. This volumetric capacitance is two-fold higher than carbon and
metal oxide based μ-supercapacitors with interdigitated electrode
architecture. Furthermore, these μ-pseudocapacitors show a maximum energy
density of 21 mWh cm–3, which is superior to the Li-based thin film batteries.
The heterogeneous growth of Ni(OH)2 over the Ni surface during the chemical
bath deposition is found to be the key parameter in the formation of uniform
monolithic Ni(OH)2 nanosheets with vertical orientation, responsible for the
110
remarkable properties of the fabricated devices. Additionally, functional
tandem configurations of the μ-pseudocapacitors are shown to be capable of
powering a light-emitting diode.
6.1. INTRODUCTION
The nanotechnology revolution has promoted technological advances
with increasing levels of miniaturization of electronic, energy harvesting, and
energy storage devices.70,71 As an example, small scale energy storage devices
are currently in high demand to power up microelectronic devices such as
microelectromechanical systems (MEMS), microsensors and nanorobotics.72,73 A
planar configuration of the energy storage devices is essential to allow more
robust integration of on-chip energy storage devices to power up
microelectronic devices.74,75 However, thin film based energy storage devices
suffer from the poor power density due to limited diffusion of the ions in this
architecture.76,77 To circumvent the poor rate capabilities of thin-film based
supercapacitors, the interdigitated electrode geometry is a better option
because there is no separator in this case, allowing the fast movement of ions
in the same plane.74,78 These micro-supercapacitors (-SCs), which exhibit high
power density when compared to microbatteries, and good frequency response,
can be thought of replacement for the bulk Al-based electrolytic
capacitors.79,80
Various fabrication techniques such as photolithography,81 laser
scribing,82 ink jet printing,83 micromolding84 in combination with the other
111
deposition techniques such as electrochemical,85 electrophoretic,86 chemical
vapor deposition,87 sputtering techniques88 have been employed in building the
-SC devices. Carbon based -SCs have been fabricated by employing different
forms of carbon materials such as carbide derived carbon, activated carbon,
onion like carbon, carbon nanotubes, graphene, reduced graphene
oxide.81,83,86,87,89,90 As these carbon materials store the charge through the
formation of electrochemical double layers (EDLs), they have exhibited lower
values of areal capacitance in the range of 0.1-6 mF cm–2.86,87,89-91 In order to
enhance the areal capacitance, several pseudocapacitive materials such as
MnO2,88 RuO2,
92 MoS293 and even conducting polymers were electrodeposited
over the current collectors.94,95 Generally, due to fast reversible redox
reactions or Faradaic charge transfer at the surface of electroactive species,
pseudocapacitors exhibit much higher specific capacitance when compared to
that of carbon-based materials. The geometric parameters such as the width,
length and the spacing between the finger electrodes are important in arriving
at the optimized values of capacitance and rate capability of a -SC.96 Ni(OH)2
has been the high capacity pseudocapacitve material with its well-defined
redox electrochemistry, was employed as an electrode material for high energy
density applications.27,65,97 However, the electrochemical behavior of Ni(OH)2
electrodes in the planar interdigitated configuration has not been studied yet.
Hence, it is always interesting to study the redox behavior of the Ni(OH)2 in the
in-plane geometry in two-electrode configuration.
112
Here, we use a simple strategy for fabricating on-chip planar
interdigitated electrodes with pseudocapacitive metal hydroxide coatings.
Specifically, Ni(OH)2 μ-SCs are fabricated by following the conventional
photolithography protocol to deposit metal layers over the patterned
photoresist with subsequent chemical synthesis of Ni(OH)2. Different chemical
synthesis methods and metallic nucleation layers were tested. The fabricated
μ-pseudocapacitors show an areal cell capacitance of 16 mF cm–2 with a
volumetric stack capacitance of 325 F cm–3 in 1 M KOH electrolyte. The high
rate capability of these μ-pseudocapacitor devices are realized through the
appearance of redox peaks even at higher scan rates of 500 V s–1 in a two-
electrode configuration. Further, solid state and flexible
Ni(OH)2 micropseudocapacitors were fabricated employing polyvinyl alcohol
(PVA)/KOH gel electrolyte. This solid-state device showed cycling stability up
to 80% capacitance retention after 1000 cycles. The tandem configuration of
these Ni(OH)2 μ-pseudocapacitors was employed to demonstrate the glowing of
a light-emitting diode (LED).
6.2. EXPERIMENTAL METHODS
6.2.1. Photolithography of Current Collector Substrates
Glass substrates (Fischer) were cut into 1 in × 1 in size, cleaned with a
soap solution to remove the dirt, followed by ultrasonication in acetone,
isopropyl alcohol, and deionized water sequentially for 5 min each, and then
dried by blowing nitrogen. Plastic substrates based on PEN sheets were
113
employed to fabricate flexible solid-state μ-SCs. Photoresist AZ9260 was spun
coated at 3000 rpm for 60 s over the glass or PEN substrates to get 10 μm thick
photoresist layers. Photoresist coated substrates were soft baked at 110 °C for
3 min. The UV exposure was carried out using an EVG contact aligner at a
constant dose of 1800 mJ cm-2 through the Cr/Glass mask having the
interdigitated patterns. After exposure, samples were developed in AZ726
developer solution for 6 min, which resulted in the formation of patterns in the
photoresist layer. Metal layers of 50 nm Ni/200 nm Pt/20 nm Ti were deposited
by sputtering (Equiment Support Co., Cambridge, England) technique over the
patterned photoresist layer. Before the lift-off process, the samples were
immersed in the CBD bath containing precursor for the Ni(OH)2 for 1–2 h. During
the CBD process, Ni(OH)2 nanoflakes were precipitated on the entire substrate
uniformly. The lift-off was then performed in acetone to remove the unexposed
photoresist layer along with the metal layers and Ni(OH)2deposits present on it.
This process resulted in the Ni(OH)2 deposit over the interdigitated planar
Ni/Pt/Ti electrodes. 30 fingers were used (15 electrodes for each polarity) with
a typical width of each finger 100 μm, and spacing between the fingers of 50
μm; the total area of all the fingers was 0.15 cm2.
6.2.2. Chemical Bath Deposition of Ni(OH)2 Nanoflakes
After deposition of Ni/Pt/Ti metal layers on the patterned photoresist
substrates, before the lift-off process, the substrates were dipped in a
chemical bath containing a clear-green mixture of 5.26 g of nickel(II) sulfate
114
hexahydrate (NiSO4.6H2O) in 20 mL of deionized (DI) water (H2O).65 1.6 mL of
ammonium hydroxide solution (30–33% NH3 in H2O) was added drop by drop.
Then, 1.35 g of potassium persulfate (K2S2O8) in 33 mL of deionized (DI) water
(H2O) was added to the mixture with stirring for few seconds at room
temperature. As the reactions progressed, the mixture became dense, and the
color turned to dark blue. The solution was then kept without stirring at room
temperature for 1–2 h. After the CBD process, the samples were washed with
deionized water several times followed by drying at room temperature in a
fume hood overnight. Electrodeposition of Ni(OH)2 was performed in a standard
three-electrode configuration with Ni/Pt/Ti/Glass as working electrode,
Ag/AgCl as reference and Pt as counter electrodes, 0.1 M NiSO4 + 0.5 M
Na2SO4 as electrolyte at a constant potential of –0.9 V at room temperature for
15 min.
6.2.3. Materials Characterization
The structural aspects of the Ni(OH)2 nanoflakes was analyzed using XRD.
Ni(OH)2 films were deposited over the plane Ni/Pt/Ti/Glass substrate in order
to do thin film XRD. A D8 Advance System from Bruker Corporation, equipped
with Cu Kα X-ray source (λ = 0.15406 nm) was used. Surface morphology and
microstructure were imaged by SEM (Nova Nano 630 instrument, FEI Co., The
Netherlands). Energy-dispersive spectroscopy (EDS) analysis was performed
with an EDAX Genesis instrument (Mahwah, NJ) attached to the SEM column.
The film thicknesses were measured using a Veeco Dektak 150 surface
115
profilometer. The bonding aspects of the Ni(OH)2 nanoflakes were investigated
using Raman spectroscopy (LabRAM ARAMIS, Horiba-Jobin Yvon). Raman spectra
were acquired with notch filters cutting at 100 cm−1 using a He-Ne laser (633
nm, 5 mW at source) and a laser spot size of 1.5 μm.
6.2.4. Electrochemical Measurements
The electrochemical properties of Ni(OH)2 μ-pseudocapacitors were
investigated in a two-electrode configuration using an electrochemical
workstation (CHI 660D, CH Instruments Incorporation). CV, galvanostatic CD,
and electrochemical impedance spectroscopy (EIS) measurements were
performed in 1 M KOH and PVA/KOH gel electrolytes. PVA/KOH gel electrolyte
was prepared by mixing 1.2 g of KOH with 2 g of PVA in 20 mL of water
followed by rigorous stirring at 85 °C until the formation of a clear gel. Solid-
state devices were fabricated by dropping 10 μL of the gel electrolyte across
the finger electrodes followed by drying at room temperature.
CV experiments were carried out at different scan rates selected from
10 mV s–1 to 500 V s–1 in a two-electrode configuration. CD experiments were
performed at different current densities selected from 50 μA cm–2 to 250 μA
cm–2. The EIS was performed in the frequency range from 100 kHz to 0.1 Hz at
open circuit potential by applying a small sinusoidal potential of 10 mV signal.
Electrochemical cycling stability was measured using VMP3 multichannel
electrochemical workstation (Bio-Logic). All measurements were carried out at
room temperature.
116
6.3. RESULTS AND DISCUSSIONS
6.3.1. Materials Properties
The 3D schematic illustration for the fabrication process of our μ-SC is
shown in Figure 6.1. The protocol involves a conventional photolithography
process to fabricate the planar interdigitated finger electrodes over a glass or a
plastic substrate. Initially, photoresist was spun coated on a glass slide as
shown in Figure 6.1 (a), which was then UV exposed through a Cr mask
followed by developing to obtain the interdigitated patterns on the photoresist
as shown in Figure 6.1 (b). Our strategy was to deposit the metal layers
followed by chemical deposition of Ni(OH)2 before the lift-off process. Since Au
was the most commonly used current collector in fabricating
microsupercapacitors,88,92,94,96 initially a Au/Ti bilayer was used to deposit
Ni(OH)2 by CBD process. However, it was found that the growth of Ni(OH)2 over
the Au current collector is non-uniform and grows in the form of domain-like
structures (see Supporting Information, Figure 6.7 (a)). These domain-like
structures of Ni(OH)2 exhibited poor adhesion and peeled off during
electrochemical measurements, presenting a serious challenge in fabricating
Ni(OH)2 μ-SCs over Au current collectors. The uniform growth of Ni(OH)2 over
the current collector is essential in order to achieve reliable and stable
electrochemical performance. It was anticipated that Ni surface due to its
chemical compatibility may aid in the heterogeneous growth of Ni(OH)2 film at
the expense of preventing the aggregation of Ni+2 species at the interface of
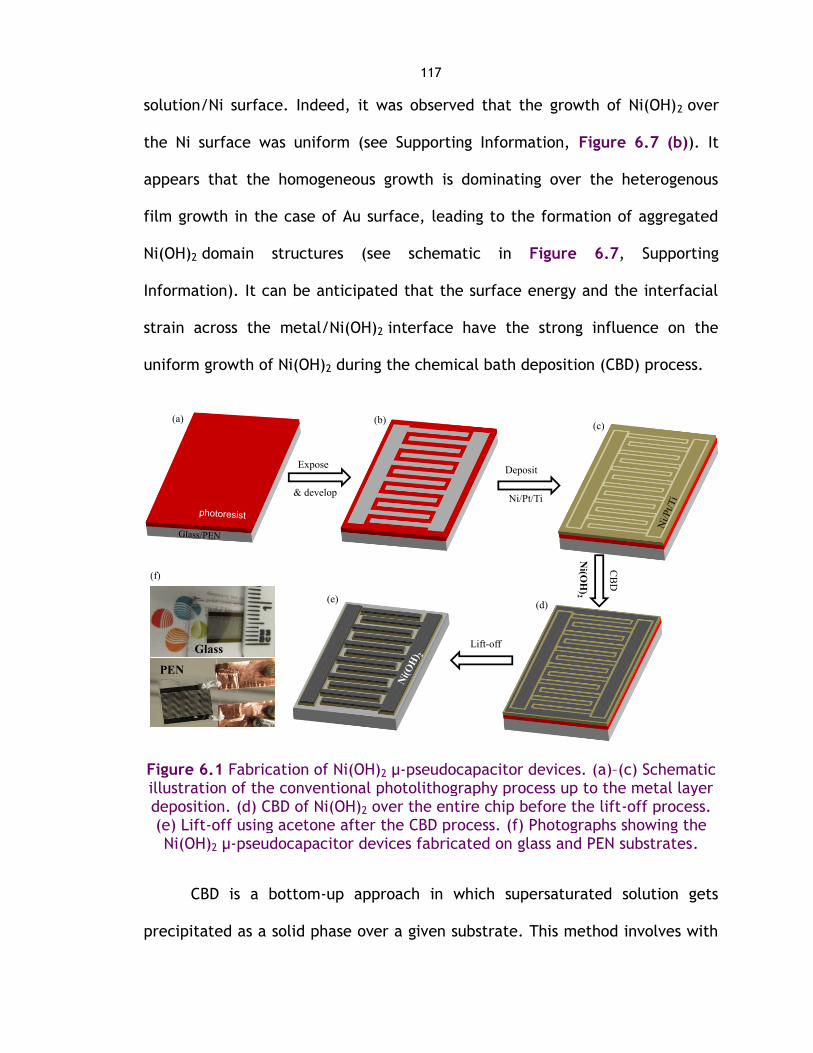
117
solution/Ni surface. Indeed, it was observed that the growth of Ni(OH)2 over
the Ni surface was uniform (see Supporting Information, Figure 6.7 (b)). It
appears that the homogeneous growth is dominating over the heterogenous
film growth in the case of Au surface, leading to the formation of aggregated
Ni(OH)2 domain structures (see schematic in Figure 6.7, Supporting
Information). It can be anticipated that the surface energy and the interfacial
strain across the metal/Ni(OH)2 interface have the strong influence on the
uniform growth of Ni(OH)2 during the chemical bath deposition (CBD) process.
Figure 6.1 Fabrication of Ni(OH)2 μ-pseudocapacitor devices. (a)–(c) Schematic illustration of the conventional photolithography process up to the metal layer deposition. (d) CBD of Ni(OH)2 over the entire chip before the lift-off process. (e) Lift-off using acetone after the CBD process. (f) Photographs showing the Ni(OH)2 μ-pseudocapacitor devices fabricated on glass and PEN substrates.
CBD is a bottom-up approach in which supersaturated solution gets
precipitated as a solid phase over a given substrate. This method involves with
ExposeDeposit
Ni/Pt/Ti
(b)(c)
(a)
& develop
Glass
PEN
(d)
CB
D
Ni(O
H)2
Lift-off
(e)
(f)
118
various distinct steps such as nucleation, coalescence and subsequent growth
by aggregation of the particles.98 Hence, the uniform growth of Ni(OH)2 is
expected when there is a homogeneous formation of nucleation centers, which
happens through the rapid decomposition of clusters of metal precursor
molecules (in this case, Ni(OH)2). These nucleation centers aid in the further
growth of the film through coalesce and aggregation of species. The important
step here is the formation of homogenous nucleation centers which is guided by
the surface energy of the substrate material besides the other parameters
(bath composition, temperature, etc.). During the growth process, the
nanosheets of Ni(OH)2 get corrugated together in order to lower the surface
energy, leading to the uniform and monolithic formation of Ni(OH)2 deposit.66,98
In our case, we found that Au surface is not assisting the homogeneous
formation of nucleation centers, resulting in the growth of Ni(OH)2 domains. It
can be anticipated that other than Ni, stainless steel and graphitic substrates
may be expected to work the same as Ni.65,98 However, chemical bath
composition and temperature conditions may be optimized for controlling the
growth of Ni(OH)2films over the other substrates.99
It was observed that while doing electrochemical measurements,
Ni(OH)2/Ni electrodes were getting delaminated in 1 M KOH electrolyte (see
inset of Figure 6.7 (b), Supporting Information). Hence, we have devised a
metal tri-stack consisting of a thin layer of Ni (50 nm) deposited over the Pt/Ti
metal fingers. The thin layer of Ni increases the rate of heterogeneous film
growth over the homogeneous aggregation of particles resulting in uniform
119
growth of Ni(OH)2 during the CBD process, while the bottom Pt/Ti current
collector was found to be quite stable in 1 M KOH electrolyte. Thus, the metal
layers (Ni/Pt/Ti) deposited over the patterned photoresist layer by sputter
deposition, as shown in Figure 6.1 (c), used for all of the μ-pseudocapacitors
fabiated in this study. We found that the Ti layer was essential to provide
strong adhesion between the Ni/Pt film and the glass or plastic substrates, and
hence delamination of metal films could be avoided. On the other hand, the
thin layer of Ni (thickness, 50 nm) can promote the uniform nucleation and
growth of Ni(OH)2 nanosheets during the CBD process. Finally, Pt, which is
inert, plays the role of current collector. Before the lift-off process, the metal-
coated, patterned photoresist substrate was dipped in a chemical bath
containing the nickel hydroxide precursor for 1–2 h at room temperature in
order to precipitate the Ni(OH)2 nanoflakes over the entire surface as shown in
Figure 6.1 (d). This sample was then washed with deionized water to remove
the unreacted initial precursor moieties followed by drying in a fume hood at
room temperature. Next, the lift-off process was carried out in acetone to
remove the Ni(OH)2 and metal layers present on the unexposed regions of the
photoresist layer (Figure 6.1 (e)). The final outcome of the above
microfabrication process is the formation of planar interdigitated
Ni(OH)2 nanoflakes over the Ni/Pt/Ti current collectors. As the final step in the
process is the lift-off after the CBD process of Ni(OH)2, which results in clean
interdigitated finger electrodes without any pseudocapacitive material in the
interspaces of the electrode patterns. Ni(OH)2 based micropseudocapacitors
120
fabricated over the glass and plastic PEN substrates are shown in Figure 6.1
(f).
Figure 6.2 (a) shows a scanning electron microscopy (SEM) image
illustrating the uniform growth of Ni(OH)2 in a clean interdigitated pattern,
without having any deposits in between the fingers. The morphology of the
Ni(OH)2 consists of vertically grown nanoflakes in the monolithic form with a
typical thickness of 500 nm, as shown in Figure 6.2 (b) and (c). The X-ray
diffraction (XRD) pattern in Figure 6.2 (d) shows that nickel hydroxide grown
by CBD has mixed phases of α-Ni(OH)2 (JCPDS 00–038–0715) and 4Ni(OH)2–NiOOH
(JCPDS 00–006–0044). The XRD pattern also shows Ni (JCPDS 00–004–0850) and
Pt (JCPDS 00–044–1294) peaks from the current collector. Nickel hydroxide was
predicted to have polycrystalline nature based on the fact that the Ni(OH)2-
phase can be oxidized to the NiOOH-phase by persulfate, as indicated in the
following molecular level heterogeneous reaction:42,100
2Ni(OH)2 + S2O82- 2NiOOH + 2SO4
2-+ 2H+ Equation 6.1
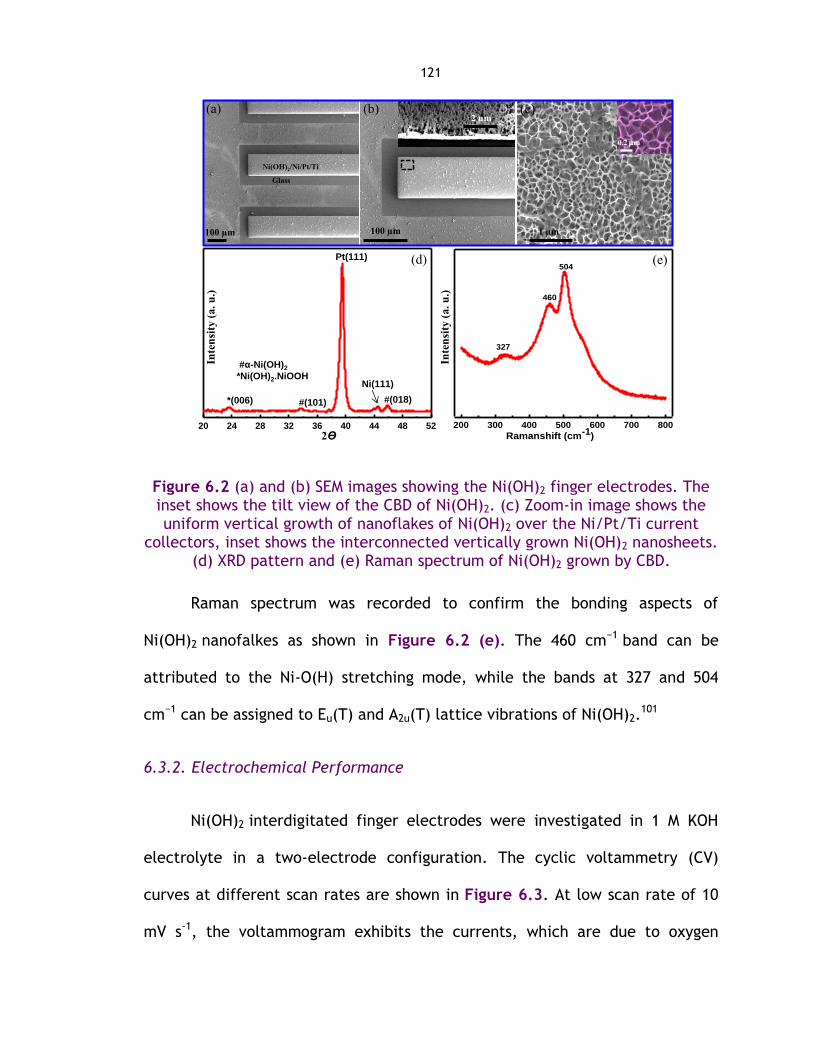
121
Figure 6.2 (a) and (b) SEM images showing the Ni(OH)2 finger electrodes. The inset shows the tilt view of the CBD of Ni(OH)2. (c) Zoom-in image shows the uniform vertical growth of nanoflakes of Ni(OH)2 over the Ni/Pt/Ti current
collectors, inset shows the interconnected vertically grown Ni(OH)2 nanosheets. (d) XRD pattern and (e) Raman spectrum of Ni(OH)2 grown by CBD.
Raman spectrum was recorded to confirm the bonding aspects of
Ni(OH)2 nanofalkes as shown in Figure 6.2 (e). The 460 cm−1 band can be
attributed to the Ni-O(H) stretching mode, while the bands at 327 and 504
cm−1 can be assigned to Eu(T) and A2u(T) lattice vibrations of Ni(OH)2.101
6.3.2. Electrochemical Performance
Ni(OH)2 interdigitated finger electrodes were investigated in 1 M KOH
electrolyte in a two-electrode configuration. The cyclic voltammetry (CV)
curves at different scan rates are shown in Figure 6.3. At low scan rate of 10
mV s-1, the voltammogram exhibits the currents, which are due to oxygen
(d)
100 µm 1 µm100 µm
2 µm
Ni(OH)2/Ni/Pt/Ti
Glass
(a) (b) (c)
200 300 400 500 600 700 800
504
460
Ramanshift (cm-1)
327
20 24 28 32 36 40 44 48 52
2ϴ
*(006) #(018)
Ni(111)
Pt(111)
#(101)
#α-Ni(OH)2
*Ni(OH)2.NiOOH
Inte
nsi
ty (
a. u
.)
Inte
nsi
ty (
a. u
.)
(e)
0.2 m

122
evolution and redox reactions of Ni(OH)2, as indicated in Figure 6.3 (a). The
redox peaks at 89 mV and –6 mV correspond to the oxidation and reduction of
the Ni(OH)2, respectively as shown in Figure 6.3 (a). The sudden hike in the
current above the anodic potential of 0.4 V can be attributed to the evolution
of oxygen gas according to the following reaction:
4OH- O2 + 2H2O + 4e- Equation 6.2
Figure 6.3 (a)-(c) Cyclic voltammograms of CBD Ni(OH)2 finger electrodes at different scan rates in a two-electrode configuration in 1 M KOH electrolyte. The inset shows CV data collected at higher scan rate of 500 V s–1. Schematic
illustrating the d) in-plane and (e) sandwich configuration of the Ni(OH)2 electrodes. (f) Comparison of CV data for planar vs sandwich configurations of
a Ni(OH)2 pseudosupercapacitor device at 40 mV s–1.
The CV curves display the redox peaks of Ni(OH)2 even at higher scan
rates of 10 and 50 V s-1 in a two-electrode configuration as shown in Figure 6.3
(b) and (c), indicating the high rate capability of the Ni(OH)2 μ-
pseudocapacitor. The observation of high rate redox active behavior can be
-0.2 0.0 0.2 0.4 0.6-0.9
-0.6
-0.3
0.0
0.3
0.6
0.9
Cu
rren
t d
en
sit
y (
mA
/cm
2)
Potential (V)
10 mV/s
-0.2 0.0 0.2 0.4 0.6-20
-10
0
10
20
30
40
Cu
rre
nt
de
ns
ity
(m
A/c
m2)
Potential (V)
-0.2 0.0 0.2 0.4 0.6-6
-3
0
3
6
9
C
urr
en
t d
en
sit
y (
mA
/cm
2)
Potential (V)
10 V/s 50 V/s
Oxygen
evolution
Ni(OH)2 oxidation
Reduction
(a) (b) (c)
In-plane sandwich(e)(f)
Ni(
OH
) 2
Ni(
OH
) 2
-0.2 0.0 0.2 0.4 0.6Potential (V)
500 V/s
Ni(OH)2
Ni(OH)2
(d)
-0.2 -0.1 0.0 0.1 0.2 0.3 0.4
-1.5
-1.0
-0.5
0.0
0.5
1.0
1.5
-SC
sandwitch
Cu
rren
t d
en
sit
y (
mA
/cm
2)
Potential (V)

123
attributed to the in-plane configuration of the interdigitated finger electrodes.
As there is no separator involved in this design, the fast movement of the
electrolyte ions in this planar configuration is responsible for the observation of
the redox peaks at higher scan rates up to 500 V s-1, which is otherwise
impossible in a conventional sandwich configuration (see Figure 6.3 (d) and
(e)). The CV curves of planar versus sandwich configuration of
Ni(OH)2 pseudocapacitor devices are shown in Figure 6.3 (f). The current
values are almost three times higher for the interdigitated planar
Ni(OH)2 pseudocapacitor when compared to the sandwich configuration. The
redox behavior of Ni(OH)2 was suppressed at a scan rate of 500 mV s-1 in the
sandwich configuration, which is due to diffusion limitations in this
configuration (see Supporting Information, Figure 6.8). Due to diffusion limited
problems of electrolyte ions at higher scan rates, it was not possible to capture
the redox activity of the Ni(OH)2 in the sandwich configuration. In order to
avoid the problems associated with the oxygen evolution at higher anodic
potentials (above 0.4 V), the potential was limited up to 0.4 V to capture the
redox activity of the Ni(OH)2 only.
The typical CV curves of Ni(OH)2 μ-pseudocapacitor in 1 M KOH
electrolyte at different scan rates in the potential window of –0.2 to 0.4 V are
displayed in Figure 6.4 (a)-(d). Two strong redox peaks are observed at a lower
scan rate of 10 mV s-1; these are due to reversible formation of Ni+2/Ni+3 redox
couple in a basic medium as shown in Equation 6.3. The oxidation of Ni+2 to
Ni+3 due to extraction of proton from the Ni(OH)2in alkaline medium is seen as
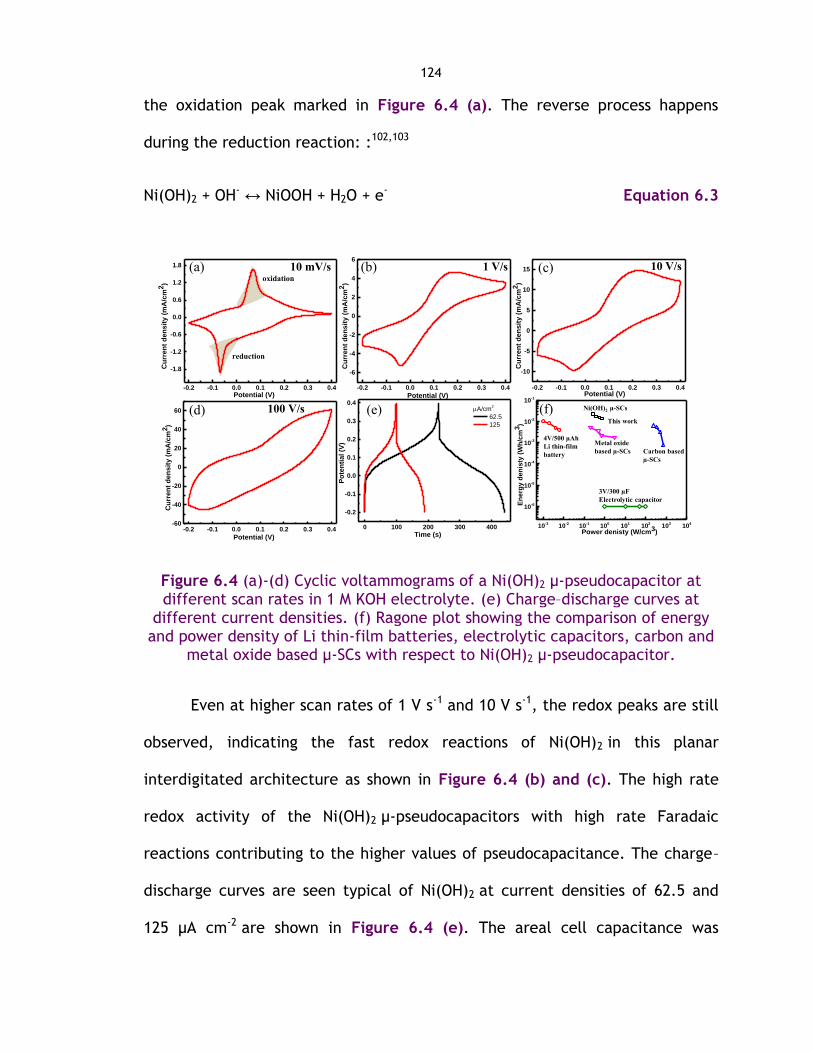
124
the oxidation peak marked in Figure 6.4 (a). The reverse process happens
during the reduction reaction: :102,103
Ni(OH)2 + OH- ↔ NiOOH + H2O + e- Equation 6.3
Figure 6.4 (a)-(d) Cyclic voltammograms of a Ni(OH)2 μ-pseudocapacitor at different scan rates in 1 M KOH electrolyte. (e) Charge–discharge curves at
different current densities. (f) Ragone plot showing the comparison of energy and power density of Li thin-film batteries, electrolytic capacitors, carbon and
metal oxide based μ-SCs with respect to Ni(OH)2 μ-pseudocapacitor.
Even at higher scan rates of 1 V s-1 and 10 V s-1, the redox peaks are still
observed, indicating the fast redox reactions of Ni(OH)2 in this planar
interdigitated architecture as shown in Figure 6.4 (b) and (c). The high rate
redox activity of the Ni(OH)2 μ-pseudocapacitors with high rate Faradaic
reactions contributing to the higher values of pseudocapacitance. The charge–
discharge curves are seen typical of Ni(OH)2 at current densities of 62.5 and
125 μA cm-2 are shown in Figure 6.4 (e). The areal cell capacitance was
-0.2 -0.1 0.0 0.1 0.2 0.3 0.4
-10
-5
0
5
10
15
Cu
rren
t d
en
sit
y (
mA
/cm
2)
Potential (V)
10 V/s
-0.2 -0.1 0.0 0.1 0.2 0.3 0.4-60
-40
-20
0
20
40
60
Cu
rre
nt
de
ns
ity
(m
A/c
m2)
Potential (V)
100 V/s
1 V/s
-0.2 -0.1 0.0 0.1 0.2 0.3 0.4
-6
-4
-2
0
2
4
6
Cu
rre
nt
de
ns
ity
(m
A/c
m2)
Potential (V)-0.2 -0.1 0.0 0.1 0.2 0.3 0.4
-1.8
-1.2
-0.6
0.0
0.6
1.2
1.8
Cu
rren
t d
en
sit
y (
mA
/cm
2)
Potential (V)
10 mV/s(a)
0 100 200 300 400
-0.2
-0.1
0.0
0.1
0.2
0.3
0.4
A/cm2
62.5
125
Po
ten
tia
l (V
)
Time (s)
(e)
oxidation
reduction
(b) (c)
(d) (f)
10-3
10-2
10-1
100
101
102
103
104
10-6
10-5
10-4
10-3
10-2
10-1
En
erg
y d
en
isty
(W
h/c
m3)
Power denisty (W/cm3)
4V/500 µAh
Li thin-film
batteryCarbon based
µ-SCs
3V/300 µF
Electrolytic capacitor
Metal oxide
based µ-SCs
Ni(OH)2 µ-SCs
This work
125
calculated from the discharge curve and found to be 16 mF cm-2, which is at
least two times higher when compared to carbon-based interdigitated
microsupercapacitors (0.1–6 mF cm-2)81-83,89-91,104 The bare Ni/Pt/Ti electrodes,
without having the Ni(OH)2 deposit, have exhibited areal cell capacitance of
15–20 μF cm-2 in 1 M KOH electrolyte (see Figure S3, Supporting Information). It
is clear that Ni has a negligible contribution towards the cell capacitance
shown by Ni(OH)2. CV data and charge–discharge (CD) for a 1 h CBD Ni(OH)2 μ-
pseudocapacitor are shown in the Supporting Information, Figure 6.10.
Pseudocapacitive materials such as MnO2, RuO2 and MoS2 have exhibited an
areal capacitance in the range of 1–10 mF cm-2.88,92,94 Similarly, the
electrodeposited Ni(OH)2 exhibited an areal capacitance of 1.5 mF cm-2,
signifying that the CBD process is the better option in the fabrication of
Ni(OH)2 based μ-pseudocapacitors with remarkable performance under the
fabrication conditions adapted in this study (see Figure 6.11, Supporting
Information). This is because CBD is an easily scalable process and is very cost-
effective, especially if done at room temperature as we have done in our
study. Wang and co-workers have demonstrated the effect of electrodeposition
temperature on the electrochemical performance of Ni(OH)2 over Ni foam
substrate.105 Similarly, the processing conditions such as bath composition,
temperature and nucleation layers can be optimized to arrive at the enhanced
electrochemical performance of the Ni(OH)2 μ-pseudocapacitors by the
electrodeposition method. Volumetric stack capacitance of the device was
calculated by considering the total volume of the device and found to be 325 F
126
cm-3, which is high compared to the various μ-supercapacitor devices reported
in the literature and superior to carbon based μ-supercapacitors (180 F cm-3).81-
83,86,87,89,90 The Ragone plot for the Ni(OH)2 μ-pseudocapacitors at different
current densities is shown in Figure 6.4 (f). The device exhibits a maximum
energy density of 21 mWh cm-3 at a power density of 262.5 mW cm-3. This
energy density of the Ni(OH)2 μ-pseudocapacitor is superior to the Li based
thin-film batteries (10 mWh cm-3), μ-SCs based on carbon materials (E = 0.15–9
mWh cm-3) and metal oxide materials (1–5 mWh cm-3).88,106 Due to high rate
capability of the Ni(OH)2 μ-pseudocapacitor, it can deliver a maximum power
density of 750 mW cm-3 at an energy density of 14 mWh cm-3. This clearly
signifies that the importance of the interdigitated architecture of the
electrodes with suitable pseudocapacitive coatings, such as Ni(OH)2, can have
energy densities that are superior to those of Li-based thin-film batteries.
The flexible nature of the Ni(OH)2 μ-SC devices was investigated by
employing the polyvinyl alcohol (PVA)/KOH gel electrolyte. These devices were
fabricated on a flexible polyethylene naphthalate (PEN) sheet following the
photolithography and CBD process. A small amount of the PVA/KOH gel
electrolyte was applied across the finger electrodes followed by drying under
ambient conditions. CV curves exhibit redox peaks up to scan rate of 2 V s-1,
indicating the fast redox behavior of Ni(OH)2 even with the gel electrolyte as
shown in Figure 6.5 (a). At higher scan rates, CVs exhibit rectangular behavior
as the rate of the redox reaction may not be compatible with the diffusion rate
of electrolyte ions present in the polymer matrix as shown in Figure 6.5 (b).
127
Furthermore, it can be seen from Figure 6.5 (c) that the CV curves under the
bent configuration remain the same as that of the normal device. The inset
shows a photograph of the bent Ni(OH)2 μ-pseudocapacitor device. The charge–
discharge curves show the typical pseudocapacitive nature of Ni(OH)2, as
illustrated by a strong deviation from the triangular nature of EDLs (see
Figure 6.5 (d)). This solid state device showed an areal cell capacitance of 2
mF cm-2 at a current density of 12 μA cm-2, comparable to the
Ni(OH)2/graphene based thin film solid state devices.103 Figure 6.5 (e) shows a
Nyquist plot of the Ni(OH)2 μ-SC, which exhibits a semicircle in the high
frequency region with charge-transfer resistance of 2.6 kΩ . The insulating
nature of the Ni(OH)2 deposit can be the major factor for this large value of
charge transfer resistance. The electrochemical cycling stability of the solid-
state device was tested for 1000 cycles, demonstrating capacitance retention
up to 80%, as shown in Figure 6.5 (f).

128
Figure 6.5 Solid state flexible Ni(OH)2 pseudocapacitor. (a) and (b) CVs of the solid state device with PVA/KOH gel electrolyte at different scan rates. (c) CV scan of the device under normal and bent conditions at scan rate of 200 mV s-1, The inset shows a photograph of the bent Ni(OH)2 pseudocapacitor device. (d) Charge–discharge curves at current densities of 12 and 30 μA cm-2. (e) Nyquist
plot of the solid state device. (f) Electrochemical cycling stability of the device over 1000 cycles.
As these μ-SC devices can deliver less power; they may not be suitable
for practical applications. However, tandem configuration of these devices may
fetch extended voltage window or current based on the series and parallel
combinations, respectively. Here, we demonstrate the tandem configuration of
the Ni(OH)2 μ-SCs in both series and parallel combinations. The potential
window has been extended up to 0.8 V when two cells are connected in a series
manner at the expense of reduction in the current values as shown
in Figure 6.6 (a) and (b). There is a shift and the broadness of the redox peaks
was observed for the two cells connected in series compared to the single cell
with relatively sharp redox peaks. Similarly, charge–discharge curves of the
0 150 300 450
-0.2
-0.1
0.0
0.1
0.2
0.3
0.4
A/cm2
12
30
Po
ten
tia
l (V
)
Time (s)
-0.2 -0.1 0.0 0.1 0.2 0.3 0.4-1.5
-1.0
-0.5
0.0
0.5
1.0
1.5
V/s
0.2
0.5
1
2Cu
rren
t d
en
sit
y (
mA
/cm
2)
Potential (V)-0.2 -0.1 0.0 0.1 0.2 0.3 0.4
-10
-5
0
5
10
15
V/s
5
10
20
50
100
Cu
rre
nt
de
ns
ity
(m
A/c
m2)
Potential (V)
(a) (b) (c)
(d)
0 200 400 600 800 10000.0
0.2
0.4
0.6
0.8
1.0
Cap
ac
itan
ce
rete
nti
on
(%
)
Cycle number
-0.2 -0.1 0.0 0.1 0.2 0.3 0.4
normal
bent
Potential (V)
0 1000 2000 3000 4000 5000
0
1000
2000
3000
4000
5000
-Z''(o
hm
)
Z'(ohm)
(e) (f)
129
series-connected devices showed less time for the discharge as compared to
the single cell device as shown in Figure 6.6 (c). In contrast, for the parallel
combination of the μ-SC cells, the discharge time was found to be higher when
compared to the single cell as expected (shown in Figure 6.6 (d)). Hence, the
series and parallel combination of these Ni(OH)2 μ-pseudocapacitors was used
to extend the potential and current values, which can be harnessed in an
external circuit to light an LED. The inset in Figure 6.6 (d) shows the glowing
red LED powered from the tandem configuration of these Ni(OH)2 based μ-
pseudocapacitors for almost 45 s after charging for 20 s.
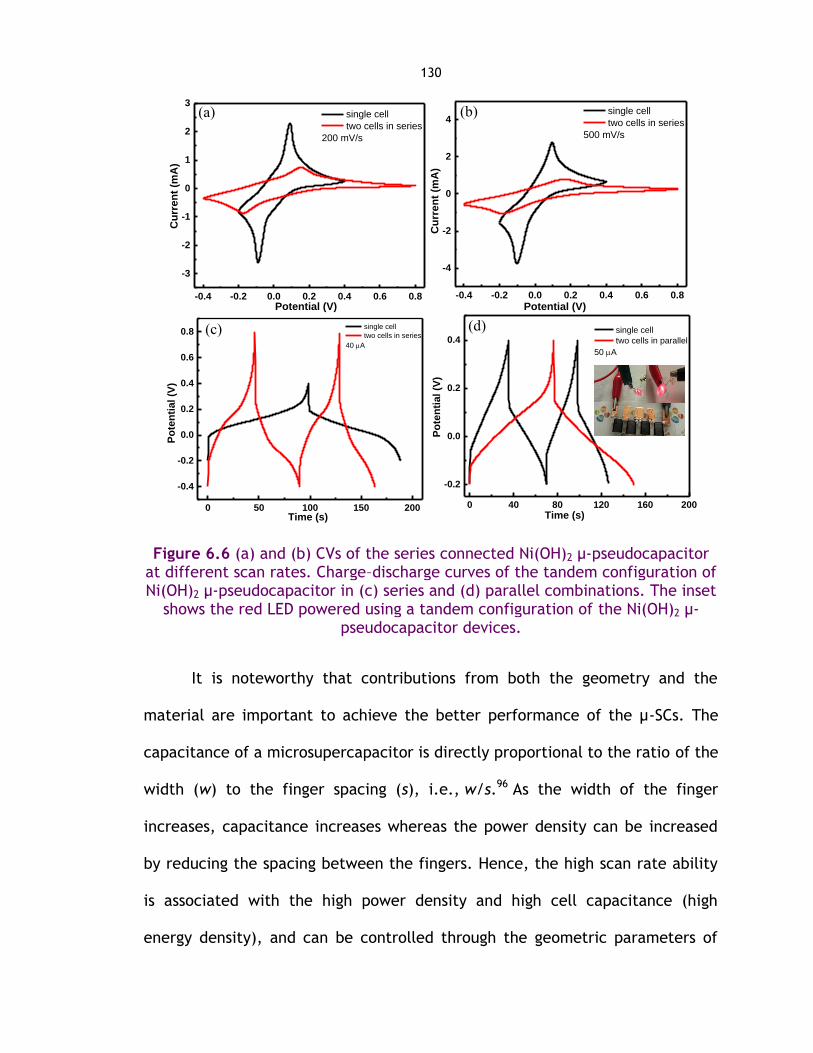
130
Figure 6.6 (a) and (b) CVs of the series connected Ni(OH)2 μ-pseudocapacitor at different scan rates. Charge–discharge curves of the tandem configuration of Ni(OH)2 μ-pseudocapacitor in (c) series and (d) parallel combinations. The inset
shows the red LED powered using a tandem configuration of the Ni(OH)2 μ-pseudocapacitor devices.
It is noteworthy that contributions from both the geometry and the
material are important to achieve the better performance of the μ-SCs. The
capacitance of a microsupercapacitor is directly proportional to the ratio of the
width (w) to the finger spacing (s), i.e., w/s.96 As the width of the finger
increases, capacitance increases whereas the power density can be increased
by reducing the spacing between the fingers. Hence, the high scan rate ability
is associated with the high power density and high cell capacitance (high
energy density), and can be controlled through the geometric parameters of
-0.4 -0.2 0.0 0.2 0.4 0.6 0.8
-3
-2
-1
0
1
2
3
single cell
two cells in series
200 mV/s
Cu
rre
nt
(mA
)
Potential (V)-0.4 -0.2 0.0 0.2 0.4 0.6 0.8
-4
-2
0
2
4
single cell
two cells in series
500 mV/s
Cu
rre
nt
(mA
)
Potential (V)
0 50 100 150 200
-0.4
-0.2
0.0
0.2
0.4
0.6
0.8
single cell
two cells in series
40 A
Po
ten
tial (V
)
Time (s)
0 40 80 120 160 200
-0.2
0.0
0.2
0.4
single cell
two cells in parallel
50 A
Po
ten
tial (V
)
Time (s)
(a) (b)
(c) (d)

131
the device. In our case, the width of the each finger is 100 μm while the
spacing between the fingers is 50 μm. That means the w/s ratio is 2, and we
were able to achieve high scan rates up to 500 V s-1. The RC time constant of
the device depends on the geometric parameters such as w/s, responsible for
achieving the high scan rate ability of the μ-SC devices. Lower the value of RC
time constant higher the scan rate ability. For our Ni(OH)2 micro-
pseudocapacitors, we have found that RC time constant is in the range of 430
μs; τ =RC = 0.027 Ω cm2 × 16 mF cm-2 = 432 μs, where R is the equivalent series
resistance (ESR), obtained from the high frequency region of the Nyquist plot
and C is the cell capacitance of the device. Recently, Dinh et al., have made
similar observations with the demonstration of high scan rate ability of the
microsuercapacitors based on CNTs and RuO2.92 The experimental data was
supported by the simulations involving computation of RC time constants with
respect to the interspacing between the fingers. 92 Reduced spacing between
the fingers will give rise to lower values of ESR, which in turn result in the
higher power density with high cell capacitance and then high scan rate
capability. However, depositing pseudocapactive materials over the finger
electrodes while reducing the spacing between the fingers without shorting the
positive and negative electrodes is a challenging aspect.
Ni(OH)2 has been the active transition metal hydroxide material with its
well-defined redox electrochemistry and high specific capacitance, and
became an attractive candidate material in commercial alkaline batteries and
also as a pseudocapacitor electrode material for high energy denisty
132
applications.27,65,97 From our study, it is clear that Ni(OH)2 has been proven to
exhibit high performance when patterned in the form of interdigitated finger
electrodes to realize the successful fabrication of μ-pseudocapacitor devices.
Thus, the materials such as carbonaceous materials with high porosity
and high conductivity needed to be grown thicker to have higher total surface
area for achieving large capacitance values. As the metal oxides/hydroxides
are poorly conducting, optimal thickness is required to maintain higher values
of energy density and power density. Width/spacing (w/s) ratio of the
electrodes should be high for the higher values of cell capacitance and also
short migration distance of ions for the fast charge/discharge rates.96
6.4. CONCLUSIONS
High rate redox, solid state, and flexible micropseudocapacitors were
fabricated using conventional lithography and CBD. The Ni(OH)2-based μ-
pseudocapacitors showed high rate redox activity up to 500 V s-1, with an area
cell capacitance of 16 mF cm–2 and a volumetric stack capacitance of 325 F cm–
3, which is superior to carbon and metal oxide based μSCs. These μSCs showed a
maximum energy density of 21 mWh cm–3, which is superior to the Li-based thin
film batteries. These remarkable characteristics of the Ni(OH)2 μ-
pseudocapacitors can be attributed to the uniform monolithic heterogenous
growth of Ni(OH)2 over the Ni surface during the chemical bath deposition.
Tandem configuration of these Ni(OH)2 based micropseudocapacitors was
employed to demonstrate the lighting of an LED.
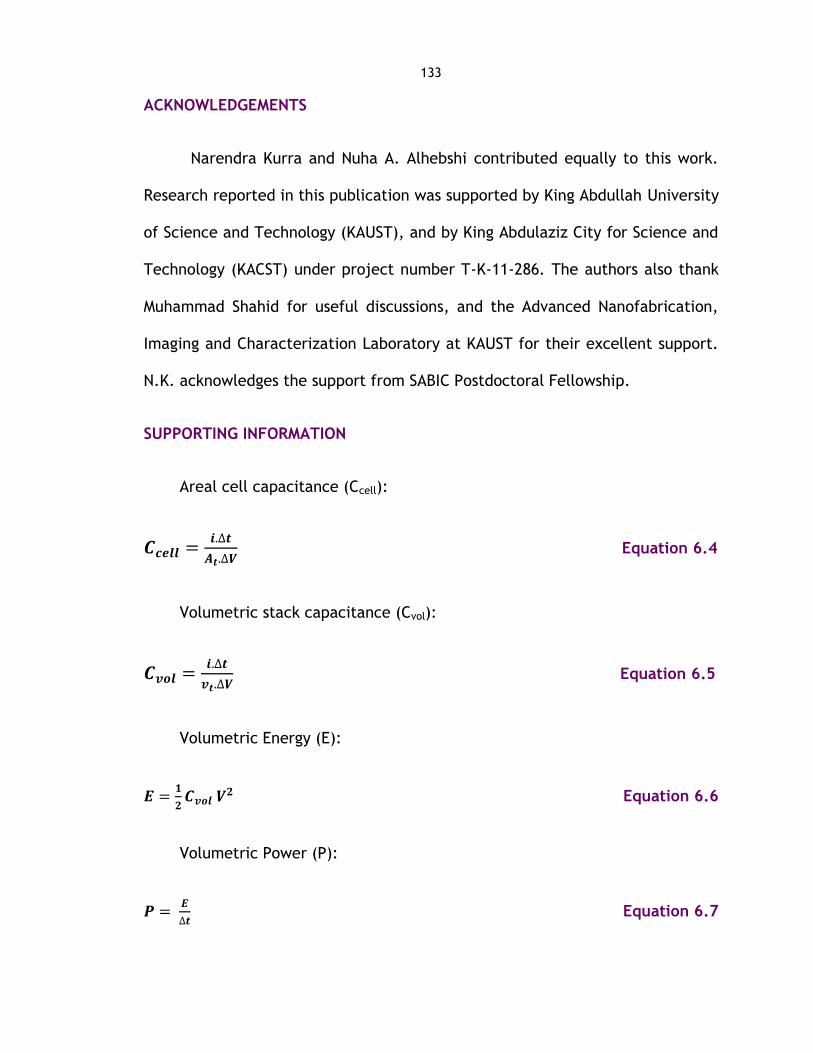
133
ACKNOWLEDGEMENTS
Narendra Kurra and Nuha A. Alhebshi contributed equally to this work.
Research reported in this publication was supported by King Abdullah University
of Science and Technology (KAUST), and by King Abdulaziz City for Science and
Technology (KACST) under project number T-K-11-286. The authors also thank
Muhammad Shahid for useful discussions, and the Advanced Nanofabrication,
Imaging and Characterization Laboratory at KAUST for their excellent support.
N.K. acknowledges the support from SABIC Postdoctoral Fellowship.
SUPPORTING INFORMATION
Areal cell capacitance (Ccell):
Equation 6.4
Volumetric stack capacitance (Cvol):
Equation 6.5
Volumetric Energy (E):
Equation 6.6
Volumetric Power (P):
Equation 6.7
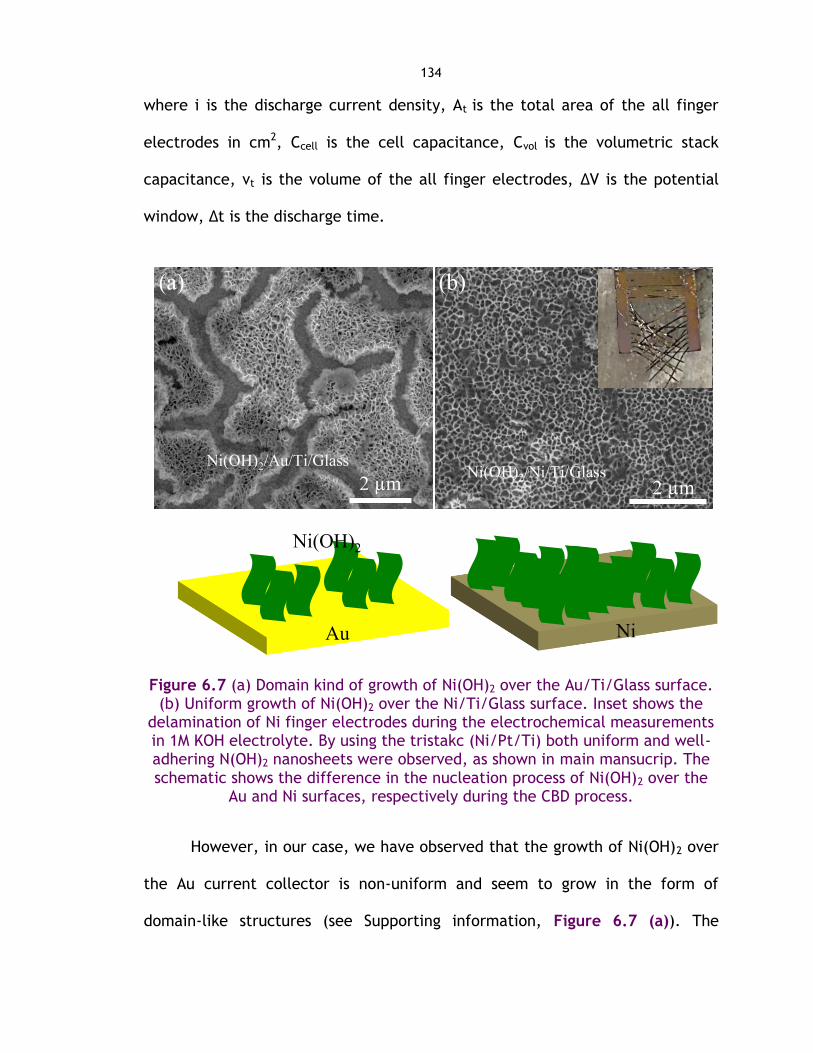
134
where i is the discharge current density, At is the total area of the all finger
electrodes in cm2, Ccell is the cell capacitance, Cvol is the volumetric stack
capacitance, vt is the volume of the all finger electrodes, ∆V is the potential
window, ∆t is the discharge time.
Figure 6.7 (a) Domain kind of growth of Ni(OH)2 over the Au/Ti/Glass surface. (b) Uniform growth of Ni(OH)2 over the Ni/Ti/Glass surface. Inset shows the
delamination of Ni finger electrodes during the electrochemical measurements in 1M KOH electrolyte. By using the tristakc (Ni/Pt/Ti) both uniform and well-adhering N(OH)2 nanosheets were observed, as shown in main mansucrip. The schematic shows the difference in the nucleation process of Ni(OH)2 over the
Au and Ni surfaces, respectively during the CBD process.
However, in our case, we have observed that the growth of Ni(OH)2 over
the Au current collector is non-uniform and seem to grow in the form of
domain-like structures (see Supporting information, Figure 6.7 (a)). The
Ni(OH)2/Au/Ti/GlassNi(OH)2/Ni/Ti/Glass
(a) (b)
2 µm2 µm
Au Ni
Ni(OH)2
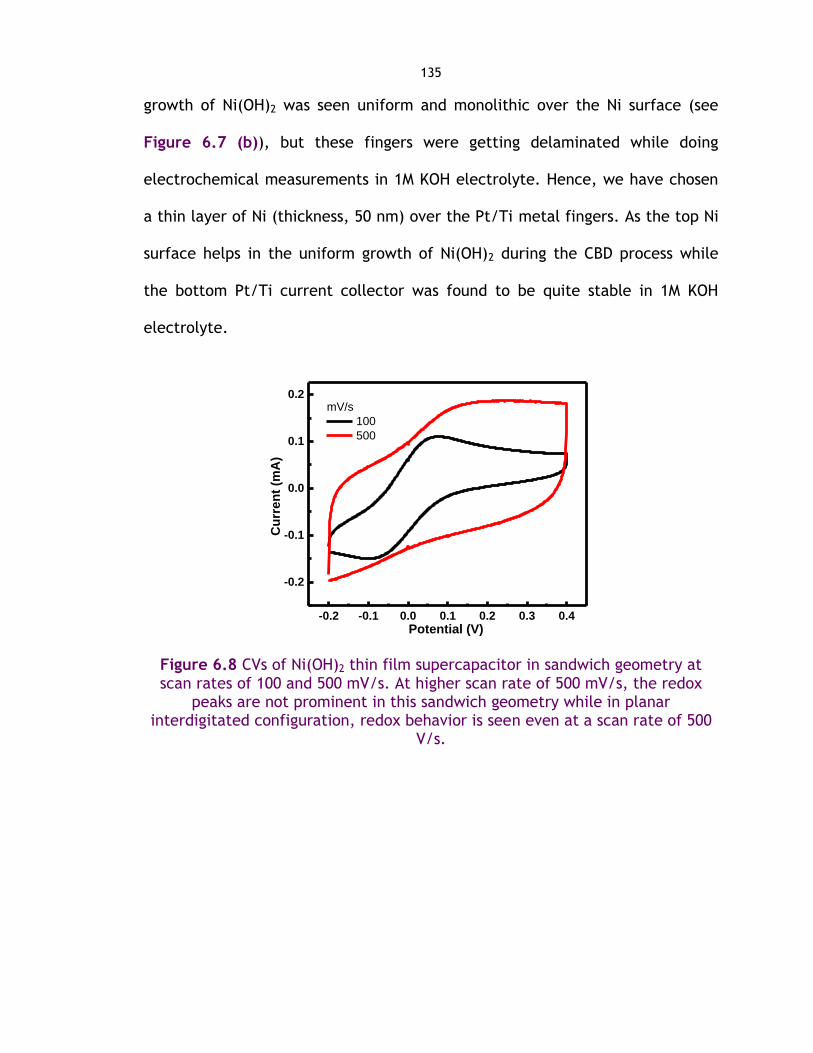
135
growth of Ni(OH)2 was seen uniform and monolithic over the Ni surface (see
Figure 6.7 (b)), but these fingers were getting delaminated while doing
electrochemical measurements in 1M KOH electrolyte. Hence, we have chosen
a thin layer of Ni (thickness, 50 nm) over the Pt/Ti metal fingers. As the top Ni
surface helps in the uniform growth of Ni(OH)2 during the CBD process while
the bottom Pt/Ti current collector was found to be quite stable in 1M KOH
electrolyte.
Figure 6.8 CVs of Ni(OH)2 thin film supercapacitor in sandwich geometry at scan rates of 100 and 500 mV/s. At higher scan rate of 500 mV/s, the redox
peaks are not prominent in this sandwich geometry while in planar interdigitated configuration, redox behavior is seen even at a scan rate of 500
V/s.
-0.2 -0.1 0.0 0.1 0.2 0.3 0.4
-0.2
-0.1
0.0
0.1
0.2
mV/s
100
500
Cu
rre
nt
(mA
)
Potential (V)
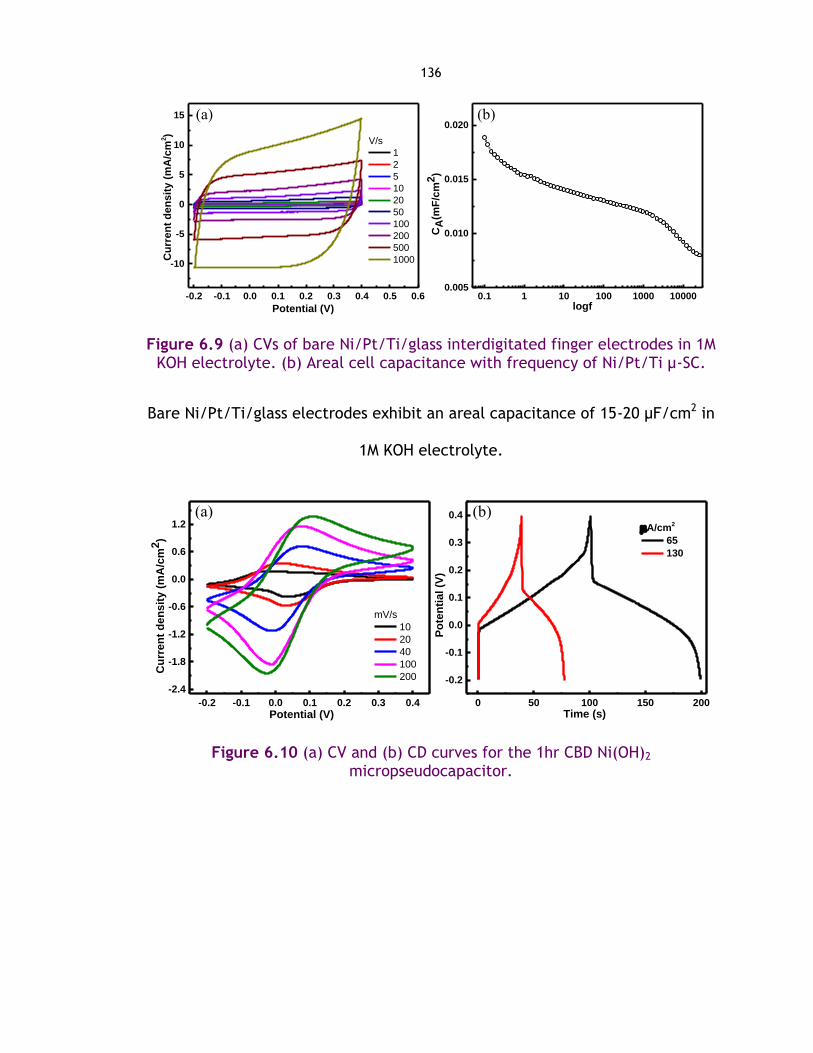
136
Figure 6.9 (a) CVs of bare Ni/Pt/Ti/glass interdigitated finger electrodes in 1M KOH electrolyte. (b) Areal cell capacitance with frequency of Ni/Pt/Ti µ-SC.
Bare Ni/Pt/Ti/glass electrodes exhibit an areal capacitance of 15-20 µF/cm2 in
1M KOH electrolyte.
Figure 6.10 (a) CV and (b) CD curves for the 1hr CBD Ni(OH)2 micropseudocapacitor.
0.1 1 10 100 1000 100000.005
0.010
0.015
0.020
CA
(mF
/cm
2)
logf-0.2 -0.1 0.0 0.1 0.2 0.3 0.4 0.5 0.6
-10
-5
0
5
10
15
V/s
1
2
5
10
20
50
100
200
500
1000Cu
rre
nt
de
ns
ity
(m
A/c
m2)
Potential (V)
(a) (b)
-0.2 -0.1 0.0 0.1 0.2 0.3 0.4
-2.4
-1.8
-1.2
-0.6
0.0
0.6
1.2
mV/s
10
20
40
100
200
Cu
rre
nt
de
ns
ity
(m
A/c
m2)
Potential (V)0 50 100 150 200
-0.2
-0.1
0.0
0.1
0.2
0.3
0.4
A/cm2
65
130
Po
ten
tia
l (V
)
Time (s)
(a) (b)
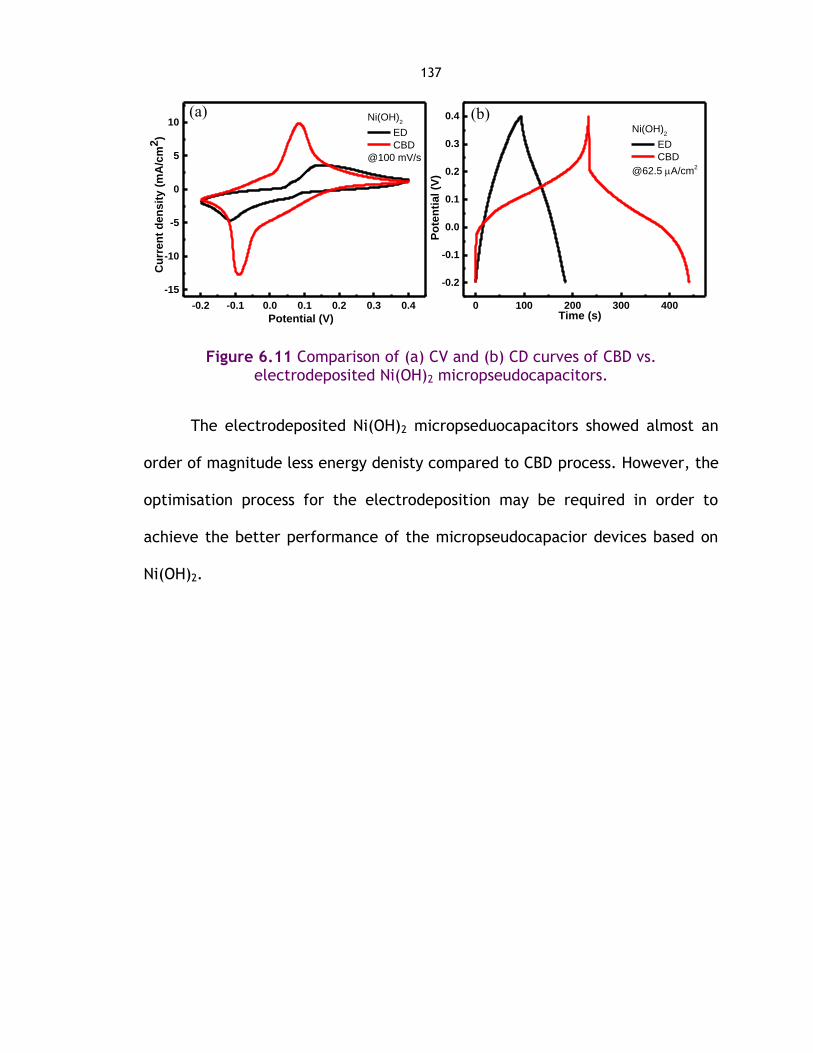
137
Figure 6.11 Comparison of (a) CV and (b) CD curves of CBD vs. electrodeposited Ni(OH)2 micropseudocapacitors.
The electrodeposited Ni(OH)2 micropseduocapacitors showed almost an
order of magnitude less energy denisty compared to CBD process. However, the
optimisation process for the electrodeposition may be required in order to
achieve the better performance of the micropseudocapacior devices based on
Ni(OH)2.
-0.2 -0.1 0.0 0.1 0.2 0.3 0.4
-15
-10
-5
0
5
10Ni(OH)
2
ED
CBD
@100 mV/s
Cu
rre
nt
de
ns
ity
(m
A/c
m2)
Potential (V)
0 100 200 300 400
-0.2
-0.1
0.0
0.1
0.2
0.3
0.4
Ni(OH)2
ED
CBD
@62.5 A/cm2
Po
ten
tia
l (V
)
Time (s)
(a) (b)
138
SUMMARY
In this dissertation, we have studied and developed Ni-based electrode
materials and devices for capacitive energy storage for both conventional and
on-chip energy storage applications. The specific objectives of this research
were to fabricate Ni-based electrochemical supercapacitors with high
capacitance, wide operating voltage, good stability, and low cost. In addition,
we wanted to study the basic aspects of the electrochemical behavior of Ni-
based electrodes and devices. The main results of this work can be summarized
in the following points:
A uniform and conformal coating of nanostructured Ni(OH)2 flakes on
carbon microfibers has been deposited in-situ by a simple chemical bath
deposition (CBD) at room temperature.
The microfibers conformally-coated with Ni(OH)2 nanoflakes exhibit five
times higher specific capacitance compared to planar (non-conformal)
Ni(OH)2 nanoflakes electrodes prepared by drop casting of Ni(OH)2 on
the carbon microfibers (1416 F/g vs. 275 F/g).
Ni-Cu-OH and Ni-Co-OH ternary electrodes have been prepared with
different Ni:Cu and Ni:Co ratios by CBD at room temperature on carbon
microfibers.
It is observed that the electrodes with Ni:Cu and Ni:Co composition ratio
of 100:10 results in an optimum capacitance and cycling stability. In

139
addition, it is found that decreasing Cu and Co ratios enhances
nanoflakes formation, and hence increases electrode capacitance.
For the optimum composition (Ni:Co = 100:10), Ni-Co-OH with graphene
and carbon nanofibers (G-CNF) electrode was tested, with resultant
improvement in electrode potential window, equivalent series
resistance, and cyclic stability.
Ni(OH)2//Graphene and Ni-Co-OH/G-CNF//Graphene asymmetric
supercapacitors have been fabricated at room temperature on carbon
microfibers with KOH electrolyte.
Ni(OH)2//Graphene asymmetric supercapacitor results in an areal
capacitance of 253 mF/cm2 at 5 mA/cm2 which is higher than reported
185 mF/cm2 at 5 mA/cm2 for NiO//rGO asymmetric supercapacitor
prepared by hydrothermal method.
Ni-Co-OH/G-CNF//Graphene asymmetric supercapacitor results in a
maximum power of 23 mW within 2.2 V which are higher than the
maximum power and the operating voltage of our Ni(OH)2//Graphene
(15.94 mW within 1.8 V).
Our asymmetric supercapacitors are featured by not only their enhanced
electrochemical performance, but also by their flexible-electrodes, low-
cost fabrication process and environmentally friendly materials.
140
A novel combination of top-down photolithographic process and bottom-
up CBD synthesis has been developed to fabricate Ni(OH)2-based micro
supercapacitors (-supercapacitors).
The resulting Ni(OH)2-based devices show high-rate redox activity up to
500 V/s and an areal cell capacitance of 16 mF/cm2 corresponding to a
volumetric stack capacitance of 325 F/cm3. This volumetric capacitance
is 2-fold higher than carbon and metal oxide based -supercapacitors
with interdigitated electrode architecture. Furthermore, these -
supercapacitors show a maximum energy density of 21 mWh/cm3, which
is superior to the Li-based thin film batteries.
Future Directions
Our recommendation regarding the future research prospects can be
summarized in the following points:
It is recommended to utilize in-situ characterizing techniques to detect
any morphological or structural changes on electrodes during charge-
discharge processes. For example, electrochemical potentiostat and
analytical electrochemistry TEM tip have been already combined for in-
situ electrochemical studies.107 Such detailed studies can provide further
insight on the factors behind decreasing capacitance during prolong
cycling.
141
The effect of using different dopants with Ni(OH)2 electrodes and
different electrolytes can be investigated to further improve the device
resistance, power and cycling stability.
For our Ni-Co-OH/G-CNF conventional supercapacitors on carbon flexible
substrate, we recommend to utilize the advantageous of substrate
flexibility by designing and fabricating a cylindrical cell that can contain
larger area of folded-in (scrolled) electrodes than in the stainless steel
coin cell used in the research of this dissertation as an elementary
prototype.
For our Ni(OH)2 on-chip supercapacitors on metallic/glass and flexible
substrates, we recommend to add Co, graphene and carbon nanofibers
to Ni(OH)2. Such hybridizing may reduce the resistance, increase the
power and cycling stability as have been achieved for our Ni-Co-OH/G-
CNF conventional supercapacitors.
142
APPENDIX. TERMINOLGY
Capacitor “An Arrangement of conductors separated by an insulator
(dielectric) used to store charge or introduce reactant into an alternating-
current circuit.”108
Capacitance “The property of a conductor or system of conductors that
describes its ability to store electric charge. The capacitance (C) is given by
Q/V, where Q is stored charge on one conductor and V the potential difference
between the two conductors (or between a single conductor and earth); it is
measured in farads.”108
Cell “ (in physical chemistry) A system in which two electrodes are in contact
with an electrolyte. The electrodes are metals or carbon plates or rods or, in
some cases, liquid metals (e.g. mercury). In an electrolytic cell a current from
an outside source is passed through the electrolyte to produce chemical
change. In a voltaic cell, spontaneous reactions between the electrodes and
electrolyte(s) produce a potential difference between the two electrodes.”108
Electrode “A conductor that emits or collects electrons in a cell.”108
Electrode potential “The potential difference produced between the
electrode and the solution in a half cell. It is not possible to measure this
directly since any measurement involves completing the circuit with the
electrolyte, thereby introducing another half cell. Standard electrode
potentials E ; are defined by measuring the potential relative to a standard
143
hydrogen half cell using 1.0 molar solution in 25oC. The convention is to
designate the cell so that the oxidized form is written first. For example,
Pt(s)H2(g)H+(aq)Zn2+(aq)Zn(s) The e.m.f of this cell is -0.76 volt (i.e. the
zinc electrode is negative). Thus the standard electrode potential of the
Zn2+Zn half cell is -0.76V. Electrode potentials are also called reduction
potentials. ”108
Electrolyte “A liquid that conducts electricity as a result of the presence of
positive or negative ions. Electrolytes are molten ionic compunds or solutions
containing ions, i.e. solution of ionic salts or of compounds that ionize in
solution. Liquid metals, in which the conduction is by free electrons, are not
usually regarding as electrolytes. Solid conductors of ions, as in the sodium-
sulphur cell, are also known as electrolytes.”108
Electromotive force (e.m.f) “The greatest potential difference that can be
generated by a particular source of electric current. In practice this may be
observable only when the source is not supplying current, because of its
internal resistance.”108
Energy “A measure of a system’s ability to do work. Like work itself, it is
measured in joules. Energy is conveniently classified into two forms: potential
energy is the energy stored in a body or system as a consequence of its
position, shape, or state (this includes gravitational energy, electrical energy,
nuclear energy, and chemical energy); kinetic energy is energy of motion and
144
is usually defined as the work that will be done by the body possessing the
energy when it is brought to rest.”108
Half cell “An electrode in contact with a solution of ions, forming part of a
cell. Various types of half cells exist, the simplest consisting of a metal
electrode immersed in a solution of metal ions. Gas half cells have a gold or
platinum plate in a solution with gas bubbled over the metal plate. The
commonest is the hydrogen half cell. Half cells can also be formed by a metal
in contact with an insoluble salt or oxide and a solution. The calomel half cell
is an example of this. Half cells are commonly referred to as electrodes.”108
Power (in physics) “Symbol P. The rate at which work is done or energy is
transferred. In SI unit it is measured in watts (joules per seconds).”108
145
REFERENCES
1 BCC_Research. Supercapacitors: Technology Developments and Global Markets. Report No. EGY068A, BCC Research, Wellesley, MA, USA (2011).
2 BCC_Research. Supercapacitors: Technology Developments and Global Markets. Report No. EGY068B, BCC Research, Wellesley, MA, USA (2015).
3 Burke, A. Ultracapacitor technologies and application in hybrid and electric vehicles. International Journal of Energy Research 34, 133-151, doi:10.1002/er.1654 (2010).
4 Kötz, R. & Carlen, M. Principles and applications of electrochemical capacitors. Electrochimica Acta 45, 2483-2498, doi:10.1016/S0013-4686(00)00354-6 (2000).
5 Conway, B. E. Electrochemical Supercapacitors: Scientific Fundamentals and Technological Applications. Springer (1999).
6 Salunkhe, R. R. et al. Nanoarchitectured Graphene-Based Supercapacitors for Next-Generation Energy-Storage Applications. Chemistry – A European Journal 20, 13838-13852, doi:10.1002/chem.201403649 (2014).
7 Faraji, S. & Ani, F. N. The development supercapacitor from activated carbon by electroless plating—A review. Renewable and Sustainable Energy Reviews 42, 823-834, doi:10.1016/j.rser.2014.10.068 (2015).
8 Augustyn, V., Simon, P. & Dunn, B. Pseudocapacitive oxide materials for high-rate electrochemical energy storage. Energy & Environmental Science 7, 1597-1614, doi:10.1039/c3ee44164d (2014).
9 Faraji, S. & Ani, F. N. Microwave-assisted synthesis of metal oxide/hydroxide composite electrodes for high power supercapacitors - A review. Journal of Power Sources 263, 338-360, doi:10.1016/j.jpowsour.2014.03.144 (2014).
10 Feng, L., Zhu, Y., Ding, H. & Ni, C. Recent progress in nickel based materials for high performance pseudocapacitor electrodes. Journal of Power Sources 267, 430-444, doi:10.1016/j.jpowsour.2014.05.092Review (2014).
11 Zhang, K. et al. Nanostructured Mn-based oxides for electrochemical energy storage and conversion. Chemical Society Reviews 44, 699-728, doi:10.1039/c4cs00218k (2015).
12 Abdelhamid, M. E., O'Mullane, A. P. & Snook, G. A. Storing energy in plastics: a review on conducting polymers & their role in electrochemical energy storage. RSC Advances 5, 11611-11626, doi:10.1039/c4ra15947k (2015).
13 V. D. Patake, C. D. L. a. O. S. J. Electrodeposited ruthenium oxide thin films for supercapacitor: Effect of surface treatments. Appl. Surf. Sci. 255, 4192, doi:10.1016/j.apsusc.2008.11.005 (2009).
14 C. C. Hu, Y. H. H. a. K. H. C. Annealing effects on the physicochemical characteristics of hydrous ruthenium and ruthenium-iridium oxides for electrochemical supercapacitors. J. Power Sources 108, 117, doi:10.1016/S0378-7753(02)00011-3 (2002).
146
15 J. Yan, T. W., J. Cheng, Z. Fan and M. Zhang. Preparation and electrochemical properties of lamellar MnO2 for supercapacitors. Mater. Res. Bull. 45, 210, doi:10.1016/j.materresbull.2009.09.016 (2010).
16 C. C. Hu, C. M. H. a. K. H. C. Anodic deposition of porous vanadium oxide network with highpower characteristics for pseudocapacitors. J. Power Sources 185, 1594., doi:10.1016/j.jpowsour.2008.08.017 (2008).
17 Ivey., B. B. a. D. G. Anodic deposition of manganese oxide electrodes with rod-like structures for application as electrochemical capacitors. J. Power Sources 195, 2110, doi:10.1016/j.jpowsour.2009.10.045 (2010).
18 Xia, X. et al. Graphene Sheet/Porous NiO Hybrid Film for Supercapacitor Applications. Chemistry – A European Journal 17, 10898-10905, doi:10.1002/chem.201100727 (2011).
19 Patil, U. M., Salunkhe, R. R., Gurav, K. V. & Lokhande, C. D. Chemically deposited nanocrystalline NiO thin films for supercapacitor application. Applied Surface Science 255, 2603-2607, doi:10.1016/j.apsusc.2008.07.192 (2008).
20 S. G. Kandalkar, J. L. G. a. C. D. L. Preparation of cobalt oxide thin films and its use in supercapacitor application. Appl. Surf. Sci. 254, 5540, doi:10.1016/j.apsusc.2008.02.163 (2008).
21 Carbonio, R. E., Macango, V. A., Giordano, M. C., Vilche, J. R. & Arvia, A. J. A Transition in the Kinetics of the Ni(OH )2 / NiOOH Electrode Reaction. Journal of the Electrochemical Society 129, 983-991, doi:10.1149/1.2124077 (1982).
22 Brodd, R. in Batteries for Sustainability (ed Ralph J. Brodd) Ch. 13, 423-443, Springer New York (2013).
23 Brousse, T., Bélanger, D. & Long, J. W. To Be or Not To Be Pseudocapacitive? Journal of the Electrochemical Society 162, A5185-A5189, doi:10.1149/2.0201505jes (2015).
24 Hu, G., Li, C. & Gong, H. Capacitance decay of nanoporous nickel hydroxide. Journal of Power Sources 195, 6977-6981, doi:10.1016/j.jpowsour.2010.03.093 (2010).
25 Gong, L., Liu, X. & Su, L. Facile Solvothermal Synthesis Ni(OH)2 Nanostructure for Electrochemical Capacitors. Journal of Inorganic and Organometallic Polymers and Materials 21, 866-870, doi:10.1007/s10904-011-9519-1 (2011).
26 Li, H. et al. Characterization and supercapacitor application of coin-like β-nickel hydroxide nanoplates. Electrochimica Acta 58, 89-94, doi:10.1016/j.electacta.2011.08.120 (2011).
27 Lu, Z., Chang, Z., Zhu, W. & Sun, X. Beta-phased Ni(OH)2 nanowall film with reversible capacitance higher than theoretical Faradic capacitance. Chemical Communications 47, 9651-9653, doi:10.1039/C1CC13796D (2011).
28 Yan, H. et al. l-Lysine assisted synthesis of β-Ni(OH)2 hierarchical hollow microspheres and their enhanced electrochemical capacitance performance. Electrochimica Acta 87, 880-888, doi:10.1016/j.electacta.2012.08.090 (2013).
29 Patil, U. M., Gurav, K. V., Fulari, V. J., Lokhande, C. D. & Joo, O. S. Characterization of honeycomb-like “β-Ni(OH)2” thin films synthesized by chemical bath deposition method and their supercapacitor application. Journal of Power Sources 188, 338-342, doi:10.1016/j.jpowsour.2008.11.136 (2009).
147
30 Dubal, D. P., Fulari, V. J. & Lokhande, C. D. Effect of morphology on supercapacitive properties of chemically grown β-Ni(OH)2 thin films. Microporous and Mesoporous Materials 151, 511-516, doi:10.1016/j.micromeso.2011.08.034 (2012).
31 Yuan, Y. F. et al. Nickel foam-supported porous Ni(OH)2/NiOOH composite film as advanced pseudocapacitor material. Electrochimica Acta 56, 2627-2632, doi:10.1016/j.electacta.2010.12.001 (2011).
32 Pramanik, P. & Bhattacharya, S. A Chemical Method for the Deposition of Nickel Oxide Thin Films. Journal of the Electrochemical Society 137, 3869-3870, doi:10.1149/1.2086316 (1990).
33 Bukovec, P., Bukovec, N., Orel, B. & Wissiak, K. Thermal analysis of nickel oxide films. Journal of Thermal Analysis and Calorimetry 40, 1193-1196, doi:10.1007/BF02546882 (1993).
34 Salunkhe, R. R. et al. Large-scale synthesis of coaxial carbon nanotube/Ni(OH)2 composites for asymmetric supercapacitor application. Nano Energy 11, 211-218, doi:10.1016/j.nanoen.2014.09.030 (2015).
35 Tang, Z., Tang, C.-h. & Gong, H. A High Energy Density Asymmetric Supercapacitor from Nano-architectured Ni(OH)2/Carbon Nanotube Electrodes. Advanced Functional Materials 22, 1272-1278, doi:10.1002/adfm.201102796 (2012).
36 Sun, X. et al. Morphology controlled high performance supercapacitor behaviour of the Ni–Co binary hydroxide system. Journal of Power Sources 238, 150-156, doi:10.1016/j.jpowsour.2013.03.069 (2013).
37 Tang, C.-h., Yin, X. & Gong, H. Superior Performance Asymmetric Supercapacitors Based on a Directly Grown Commercial Mass 3D Co3O4@Ni(OH)2 Core–Shell Electrode. ACS Applied Materials & Interfaces 5, 10574-10582, doi:10.1021/am402436q (2013).
38 Chae, J. H., Ng, K. C. & Chen, G. Z. Nanostructured materials for the construction of asymmetrical supercapacitors. Proceedings of the Institution of Mechanical Engineers, Part A: Journal of Power and Energy 224, 479-503, doi:10.1243/09576509jpe861 (2010).
39 Yan, J. et al. Advanced Asymmetric Supercapacitors Based on Ni(OH)2/Graphene and Porous Graphene Electrodes with High Energy Density. Advanced Functional Materials 22, 2632-2641, doi:10.1002/adfm.201102839 (2012).
40 Schneller, T., Waser, R., Kosec, M. & Payne, D. CHEMICAL SOLUTION DEPOSITION OF FUNCTIONAL OXIDE THIN FILMS. 319 (Springer-Verlag Wien, 2013).
41 Bukovec, P., Bukovec, N., Orel, B. & Wissiak, K. S. Thermal analysis of nickel oxide films. Journal of Thermal Analysis 40, 1193-1196, doi:10.1007/bf02546882 (1993).
42 Han, S.-Y. et al. The Growth Mechanism of Nickel Oxide Thin Films by Room-Temperature Chemical Bath Deposition. Journal of the Electrochemical Society 153, C382-C386, doi:10.1149/1.2186767 (2006).
43 An, X. et al. Stable Aqueous Dispersions of Noncovalently Functionalized Graphene from Graphite and their Multifunctional High-Performance Applications. Nano Letters 10, 4295-4301, doi:10.1021/nl903557p (2010).
148
44 Viculis, L. M., Mack, J. J. & Kaner, R. B. A Chemical Route to Carbon Nanoscrolls. Science 299, 1361, doi:10.1126/science.1078842 (2003).
45 Adams, T. M. & Layton, R. A. INTRODUCTORY MEMS-Fabrication and Applications. 65, Springer Science+Business Media (2010).
46 Will, K. Photoresists, MicroChemicals GmbH Company, <http://www.microchemicals.com/products/photoresists.html> (2015).
47 Egerton, R. F. Physical Principles of Electron Microscopy. 11, Springer Science+Business Media, Inc. (2005).
48 Hammond, C. Basics of Crystallography and Diffraction. OUP Oxford (2009).
49 Leng, Y. Materials Characterization Introduction to Microscopic and Spectroscopic Methods. 2 edn, 5-7, Wiley-VCH Verlag GmbH & Co. (2013).
50 Béguin, F. & Frąckowiak, E. 115-120, Wiley-VCH Verlag GmbH & Co. KGaA, Weinheim, Germani (2013).
51 Conway, B. E. Electrochemical Supercapacitors: Scientific Fundamentals and Technological Applications. 6-7, Springer (1999).
52 Jiang, H., Lee, P. S. & Li, C. 3D carbon based nanostructures for advanced supercapacitors. Energy and Environmental Science 6, 41-53, doi:10.1039/c2ee23284g (2013).
53 Deng, W., Ji, X., Chen, Q. & Banks, C. E. Electrochemical capacitors utilising transition metal oxides: An update of recent developments. RSC Advances 1, 1171-1178, doi:10.1039/c1ra00664a (2011).
54 Yin, Z. & Zheng, Q. Controlled synthesis and energy applications of one-dimensional conducting polymer nanostructures: An overview. Advanced Energy Materials 2, 179-218, doi:10.1002/aenm.201100560 (2012).
55 Deshmukh, P. R., Pusawale, S. N., Jagadale, A. D. & Lokhande, C. D. Supercapacitive performance of hydrous ruthenium oxide (RuO2•nH2O) thin films deposited by SILAR method. Journal of Materials Science 47, 1546-1553, doi:10.1007/s10853-011-5946-1 (2012).
56 Patil, U. M., Gurav, K. V., Fulari, V. J., Lokhande, C. D. & Joo, O. S. Characterization of honeycomb-like "β-Ni(OH)2" thin films synthesized by chemical bath deposition method and their supercapacitor application. Journal of Power Sources 188, 338-342, doi:10.1016/j.jpowsour.2008.11.136 (2009).
57 Dubal, D. P., Fulari, V. J. & Lokhande, C. D. Effect of morphology on supercapacitive properties of chemically grown β-Ni(OH)2 thin films. Microporous and Mesoporous Materials 151, 511-516, doi:10.1016/j.micromeso.2011.08.034 (2012).
58 Yuan, Y. F. et al. Nickel foam-supported porous Ni(OH)2/NiOOH composite film as advanced pseudocapacitor material. Electrochimica Acta 56, 2627-2632, doi:10.1016/j.electacta.2010.12.001 (2011).
59 Kamath, P. V. et al. Stabilized α‐Ni(OH)2 as Electrode Material for Alkaline Secondary Cells. Journal of the Electrochemical Society 141, 2956-2959, doi:10.1149/1.2059264 (1994).

149
60 Watanabe, K.-i., Koseki, M. & Kumagai, N. Effect of cobalt addition to nickel hydroxide as a positive material for rechargeable alkaline batteries. Journal of Power Sources 58, 23-28, doi:10.1016/0378-7753(95)02272-4 (1996).
61 Chen, J., Bradhurst, D. H., Dou, S. X. & Liu, H. K. Nickel Hydroxide as an Active Material for the Positive Electrode in Rechargeable Alkaline Batteries. Journal of the Electrochemical Society 146, 3606-3612, doi:10.1149/1.1392522 (1999).
62 Liu, B., Zhang, Y., Yuan, H., Yang, H. & Yang, E. Electrochemical studies of aluminum substituted α-Ni(OH)2 electrodes. International Journal of Hydrogen Energy 25, 333-337, doi:10.1016/S0360-3199(99)00026-9 (2000).
63 Jayashree, R. S. & Vishnu Kamath, P. Suppression of the α → β-nickel hydroxide transformation in concentrated alkali: Role of dissolved cations. Journal of Applied Electrochemistry 31, 1315-1320, doi:10.1023/a:1013876006707 (2001).
64 Lien, C. H., Hu, C. C., Hsu, C. T. & Wong, D. S. H. High-performance asymmetric supercapacitor consisting of Ni-Co-Cu oxy-hydroxide nanosheets and activated carbon. Electrochemistry Communications 34, 323-326, doi:10.1016/j.elecom.2013.07.032 (2013).
65 Alhebshi, N. A., Rakhi, R. B. & Alshareef, H. N. Conformal coating of Ni(OH)2 nanoflakes on carbon fibers by chemical bath deposition for efficient supercapacitor electrodes. Journal of Materials Chemistry A 1, 14897-14903, doi:10.1039/C3TA12936E (2013).
66 Zhang, L., Tang, C., Yin, X. & Gong, H. Substrate-assisted self-organization of Ni-Cu spherical double hydroxide (SDH) and its excellent pseudo-capacitive performance. Journal of Materials Chemistry A 2, 4660-4666, doi:10.1039/c3ta14374k (2014).
67 Bai, Y., Rakhi, R. B., Chen, W. & Alshareef, H. N. Effect of pH-induced chemical modification of hydrothermally reduced graphene oxide on supercapacitor performance. Journal of Power Sources 233, 313-319, doi:10.1016/j.jpowsour.2013.01.122 (2013).
68 Bode, H., Dehmelt, K. & Witte, J. Zur kenntnis der nickelhydroxidelektrode—I.Über das nickel (II)-hydroxidhydrat. Electrochimica Acta 11, 1079-IN1071, doi:10.1016/0013-4686(66)80045-2 (1966).
69 Luan, F. et al. High energy density asymmetric supercapacitors with a nickel oxide nanoflake cathode and a 3D reduced graphene oxide anode. Nanoscale 5, 7984-7990, doi:10.1039/C3NR02710D (2013).
70 Drexler, K. E. Engines of Creation -The Coming Era of Nanotechnology. Anchor, Reprint edition edn, (1987).
71 Wang, Z. L. Toward self-powered sensor networks. Nano Today 5, 512-514, doi:10.1016/j.nantod.2010.09.001 (2010).
72 Simjee, F. & Chou, P. H. in Low Power Electronics and Design, ISLPED'06. Proceedings of the 2006 International Symposium on. 197-202 (2006).
73 Wang, Z. L. & Wu, W. Nanotechnology-Enabled Energy Harvesting for Self-Powered Micro-/Nanosystems. Angewandte Chemie International Edition 51, 11700-11721, doi:10.1002/anie.201201656 (2012).
150
74 Beidaghi, M. & Gogotsi, Y. Capacitive energy storage in micro-scale devices: recent advances in design and fabrication of micro-supercapacitors. Energy & Environmental Science 7, 867-884, doi:10.1039/c3ee43526a (2014).
75 Xiong, G., Meng, C., Reifenberger, R. G., Irazoqui, P. P. & Fisher, T. S. A Review of Graphene-Based Electrochemical Microsupercapacitors. Electroanalysis 26, 30-51, doi:10.1002/elan.201300238 (2014).
76 Li, Y., Xie, H., Li, J. & Wang, J. Magnetron sputtering deposited MnO1.9 thin film for supercapacitor. Materials Letters 102–103, 30-32, doi:10.1016/j.matlet.2013.03.098 (2013).
77 Yoo, J. J. et al. Ultrathin Planar Graphene Supercapacitors. Nano Letters 11, 1423-1427, doi:10.1021/nl200225j (2011).
78 Gao, W. et al. Direct laser writing of micro-supercapacitors on hydrated graphite oxide films. Nat Nano 6, 496-500, doi:10.1038/nnano.2011.110 (2011).
79 Long, J. W., Dunn, B., Rolison, D. R. & White, H. S. Three-Dimensional Battery Architectures. Chemical Reviews 104, 4463-4492, doi:10.1021/cr020740l (2004).
80 Miller, J. R., Outlaw, R. A. & Holloway, B. C. Graphene Double-Layer Capacitor with ac Line-Filtering Performance. Science 329, 1637-1639, doi:10.1126/science.1194372 (2010).
81 Pech, D. et al. Ultrahigh-power micrometre-sized supercapacitors based on onion-like carbon. Nat Nano 5, 651-654, doi:10.1038/nnano.2010.162 (2010).
82 El-Kady, M. F. & Kaner, R. B. Scalable fabrication of high-power graphene micro-supercapacitors for flexible and on-chip energy storage. Nat Commun 4, 1475, doi:10.1038/ncomms2446 (2013).
83 Pech, D. et al. Elaboration of a microstructured inkjet-printed carbon electrochemical capacitor. Journal of Power Sources 195, 1266-1269, doi:10.1016/j.jpowsour.2009.08.085 (2010).
84 Xue, M. et al. Structure-Based Enhanced Capacitance: In Situ Growth of Highly Ordered Polyaniline Nanorods on Reduced Graphene Oxide Patterns. Advanced Functional Materials 22, 1284-1290, doi:10.1002/adfm.201101989 (2012).
85 Sung, J.-H., Kim, S.-J. & Lee, K.-H. Fabrication of microcapacitors using conducting polymer microelectrodes. Journal of Power Sources 124, 343-350, doi:10.1016/S0378-7753(03)00669-4 (2003).
86 Chmiola, J., Largeot, C., Taberna, P.-L., Simon, P. & Gogotsi, Y. Monolithic Carbide-Derived Carbon Films for Micro-Supercapacitors. Science 328, 480-483, doi:10.1126/science.1184126 (2010).
87 Lin, J. et al. 3-Dimensional Graphene Carbon Nanotube Carpet-Based Microsupercapacitors with High Electrochemical Performance. Nano Letters 13, 72-78, doi:10.1021/nl3034976 (2013).
88 Si, W. et al. On chip, all solid-state and flexible micro-supercapacitors with high performance based on MnOx/Au multilayers. Energy & Environmental Science 6, 3218-3223, doi:10.1039/c3ee41286e (2013).
151
89 Beidaghi, M. & Wang, C. Micro-Supercapacitors Based on Interdigital Electrodes of Reduced Graphene Oxide and Carbon Nanotube Composites with Ultrahigh Power Handling Performance. Advanced Functional Materials 22, 4501-4510, doi:10.1002/adfm.201201292 (2012).
90 Huang, P. et al. Micro-supercapacitors from carbide derived carbon (CDC) films on silicon chips. Journal of Power Sources 225, 240-244, doi:10.1016/j.jpowsour.2012.10.020 (2013).
91 Wu, Z. S., Parvez, K., Feng, X. & Müllen, K. Graphene-based in-plane micro-supercapacitors with high power and energy densities. Nat Commun 4, doi:10.1038/ncomms3487 (2013).
92 Dinh, T. M., Armstrong, K., Guay, D. & Pech, D. High-resolution on-chip supercapacitors with ultra-high scan rate ability. Journal of Materials Chemistry A 2, 7170-7174, doi:10.1039/c4ta00640b (2014).
93 Sung, J.-H., Kim, S.-J. & Lee, K.-H. Fabrication of all-solid-state electrochemical microcapacitors. Journal of Power Sources 133, 312-319, doi:10.1016/j.jpowsour.2004.02.003 (2004).
94 Cao, L. et al. Direct Laser-Patterned Micro-Supercapacitors from Paintable MoS2 Films. Small 9, 2905-2910, doi:10.1002/smll.201203164 (2013).
95 Wang, K. et al. An All-Solid-State Flexible Micro-supercapacitor on a Chip. Advanced Energy Materials 1, 1068-1072, doi:10.1002/aenm.201100488 (2011).
96 Shen, C., Wang, X., Zhang, W. & Kang, F. A high-performance three-dimensional micro supercapacitor based on self-supporting composite materials. Journal of Power Sources 196, 10465-10471, doi:10.1016/j.jpowsour.2011.08.007 (2011).
97 Salunkhe, R. R., Jang, K., Lee, S.-w. & Ahn, H. Aligned nickel-cobalt hydroxide nanorod arrays for electrochemical pseudocapacitor applications. RSC Advances 2, 3190-3193, doi:10.1039/c2ra01220k (2012).
98 Patil, U. M., Gurav, K. V., Kim, J. H., Lokhande, C. D. & Jun, S. C. Bath temperature impact on morphological evolution of Ni(OH)2 thin films and their supercapacitive behaviour. Bull Mater Sci 37, 27-33, doi:10.1007/s12034-014-0617-x (2014).
99 Vidales-Hurtado, M. A. & Mendoza-Galván, A. Electrochromism in nickel oxide-based thin films obtained by chemical bath deposition. Solid State Ionics 179, 2065-2068, doi:10.1016/j.ssi.2008.07.003 (2008).
100 Shieh, S. R. & Duffy, T. S. Raman spectroscopy of Co(OH)2 at high pressures: Implications for amorphization and hydrogen repulsion. Physical Review B 66, 134301, doi:10.1103/PhysRevB.66.134301 (2002).
101 Nam, K.-W., Lee, E.-S., Kim, J.-H., Lee, Y.-H. & Kim, K.-B. Synthesis and Electrochemical Investigations of Ni1−xO Thin Films and Ni1−xO on Three-Dimensional Carbon Substrates for Electrochemical Capacitors. Journal of the Electrochemical Society 152, A2123-A2129, doi:10.1149/1.2039647 (2005).
102 Dong, X. et al. Flexible and Wire-Shaped Micro-Supercapacitor Based on Ni(OH)2-Nanowire and Ordered Mesoporous Carbon Electrodes. Advanced Functional Materials 24, 3405-3412, doi:10.1002/adfm.201304001 (2014).
152
103 Xie, J. et al. Layer-by-layer β-Ni(OH)2/graphene nanohybrids for ultraflexible all-solid-state thin-film supercapacitors with high electrochemical performance. Nano Energy 2, 65-74, doi:10.1016/j.nanoen.2012.07.016 (2013).
104 Kurra, N., Kiruthika, S. & Kulkarni, G. U. Solution processed sun baked electrode material for flexible supercapacitors. RSC Advances 4, 20281-20289, doi:10.1039/c4ra02934h (2014).
105 Wang, Y.-M., Zhao, D.-D., Zhao, Y.-Q., Xu, C.-L. & Li, H.-L. Effect of electrodeposition temperature on the electrochemical performance of a Ni(OH)2 electrode. RSC Advances 2, 1074-1082, doi:10.1039/C1RA00613D (2012).
106 Wang, X. et al. Manganese oxide micro-supercapacitors with ultra-high areal capacitance. Nanoscale 5, 4119-4122, doi:10.1039/c3nr00210a (2013).
107 Team, H. S. C. Analytical electrochemistry TEM tip, Hummingbird Scientific Company, <http://hummingbirdscientific.com/products/liquid/liquid-system-electrochemistry/> (2015).
108 Isaacs, A. Dictionary of Physics. 6th edn, Constable and Robinson Ltd (2005).