a distinct and unique transcriptional program expressed by - blood
TRANSCRIPT

PHAGOCYTES
A distinct and unique transcriptional program expressed by tumor-associatedmacrophages (defective NF-�B and enhanced IRF-3/STAT1 activation)Subhra K. Biswas, Lisa Gangi, Saki Paul, Tiziana Schioppa, Alessandra Saccani, Marina Sironi, Barbara Bottazzi, Andrea Doni,Bronte Vincenzo, Fabio Pasqualini, Luca Vago, Manuela Nebuloni, Alberto Mantovani, and Antonio Sica
To identify the molecular basis underly-ing the functions of tumor-associatedmacrophages (TAMs), we characterizedthe gene expression profile of TAMs iso-lated from a murine fibrosarcoma in com-parison with peritoneal macrophages(PECs) and myeloid suppressor cells(MSCs), using a cDNA microarray technol-ogy. Among the differentially expressedgenes, 15 genes relevant to inflammationand immunity were validated by real-timepolymerase chain reaction (PCR) and pro-tein production. Resting TAMs showed acharacteristic gene expression patternwith higher expression of genes coding
for the immunosuppressive cytokine IL-10, phagocytosis-related receptors/mol-ecules (Msr2 and C1q), and inflammatorychemokines (CCL2 and CCL5) as ex-pected, as well as, unexpectedly, IFN-inducible chemokines (CXCL9, CXCL10,CXCL16). Immunohistology confirmedand extended the in vitro analysis byshowing that TAMs express M2-associ-ated molecules (eg, IL-10 and MGL1), aswell as CCL2, CCL5, CXCL9, CXCL10, andCXCL16, but no appreciable NOS2. Lipo-polysaccharide (LPS)–mediated activa-tion of TAMs resulted in defective expres-sion of several proinflammatory cytokines
(eg, IL-1�, IL-6, TNF-�) and chemokines(eg, CCL3), as opposed to a strongup-regulation of immunosuppressive cy-tokines (IL-10, TGF�) and IFN-induciblechemokines (CCL5, CXCL9, CXCL10,CXCL16). Thus, profiling of TAMs from amurine sarcoma revealed unexpected ex-pression of IFN-inducible chemokines, as-sociated with an M2 phenotype (IL-10high,IL-12low), and divergent regulation of theNF-�B versus the IRF-3/STAT1 pathway.(Blood. 2006;107:2112-2122)
© 2006 by The American Society of Hematology
Introduction
Macrophages are versatile, plastic cells that respond to environmen-tal signals with diverse functional programs. In addition to classicalor M1 macrophage activation in response to microbial products andinterferon-�, it was recently observed that anti-inflammatorymolecules, such as glucocorticoid hormones, IL-4, IL-13, andIL-10, are more than simple inhibitors of macrophage activation inthat they induce distinct M2 activation programs.1-5 M1 macro-phages are involved in type 1 reactions and are classically activatedby microbial products, killing microorganisms and producingreactive oxygen and nitrogen intermediates. In contrast, M2 cells,involved in type 2 reactions,4,6 tune inflammation and adaptiveimmunity; promote cell proliferation by producing growth factorsand products of the arginase pathway (ornithine and polyamines);scavenge debris by expressing scavenger receptors; and promoteangiogenesis, tissue remodeling, and repair. M1 and M2 cells areextremes in a continuum of functional states. For instance, differentforms of M2 cells have been described sharing an IL-12low/IL-10high phenotype with variable capacity to produce TNF, IL-1, andIL-6.6 Tumors are diverse and so are their associated inflammatoryreactions. When associated with established neoplasia, inflamma-tion is usually polarized in a type 2 direction.
Tumors represent a unique example of the plasticity of macro-phages, reflected by the ambivalent relationship between tumor-associated macrophages (TAMs) and cancer cells, originally ex-pressed in the “macrophage balance” hypothesis.4,5 TAMs originatefrom circulating monocytes and their recruitment into tumors isdriven by tumor-derived chemotactic factors.4,7,8 Among these,CCL2 has been identified as a major chemokine inducing therecruitment of macrophages in a variety of murine and humantumors.3,7,8 In addition, evidence suggests that the tumor microenvi-ronment may also divert macrophage functions toward a protu-moral phenotype.4 These tumor-diverted macrophages play a keyrole in subversion of adaptive immunity and in inflammatorycircuits that promote tumor growth and progression.4,6,9,10
Despite the fact that TAMs originate from prototypical inflam-matory cells, a number of reports providing a partial characteriza-tion of their phenotype have suggested that these cells are stronglyimpaired in various functions related to inflammation, such asproduction of various inflammatory mediators.4,11,12 Availableinformation is consistent with a protumoral role for these cells,mainly based on their functional similarities with the immunosup-pressive, M2-polarized macrophages.6,10 It has been hypothesized
From the Istituto di Ricerche Farmacologiche Mario Negri, Milan, Italy;Microarray Research Group, Laboratory of Molecular Technology, NationalCancer Institute–Science Applications International Corp (SAIC), Frederick,MD; Centro di Eccellenza per l’Innovazione Diagnostica e Terapeutica, Instituteof Pathology, State University of Milan, Milan, Italy; Department of Oncologyand Surgical Sciences, Oncology Section, Padua University, Padua, Italy;Institute of Pathology, Department of Clinical Sciences “L. Sacco,” University ofMilan, Milan, Italy; and Istituto Clinico Humanitas, Rozzano, Milan, Italy.
Submitted January 31, 2005; accepted October 17, 2005. Prepublished onlineas Blood First Edition Paper, November 3, 2005; DOI 10.1182/blood-2005-01-0428.
Supported by Associazione Italiana Ricerca sul Cancro (AIRC), Italy; EuropeanCommunity; Ministero Istruzione Universita Ricerca (MIUR), Italy; and IstitutoSuperiore Sanita (ISS). Support from Alfredo Leonardi fellowship and G.L.Pfeiffer foundation to S.K.B. is acknowledged.
Reprints: Alberto Mantovani, Istituto Clinico Humanitas, Via Manzoni 56,20089, Milan, Italy; e-mail: [email protected].
The publication costs of this article were defrayed in part by page chargepayment. Therefore, and solely to indicate this fact, this article is herebymarked ‘‘advertisement’’ in accordance with 18 U.S.C. section 1734.
© 2006 by The American Society of Hematology
2112 BLOOD, 1 MARCH 2006 � VOLUME 107, NUMBER 5
For personal use only.on November 23, 2018. by guest www.bloodjournal.orgFrom

that TAMs, besides contributing actively to tumor-induced immu-nosuppression through subversion of innate and adaptive immu-nity, are also capable of affecting diverse aspects of neoplasticdevelopment, including vascularization, growth rate and metasta-sis, stroma formation, and dissolution.4 A protumoral role of TAMsis consistent with studies from humans, wherein a high density/number of TAMs is associated with poor prognosis in differentcancers (cervix, prostate, breast, bladder).13,14
The present study was designed to characterize the transcrip-tional profile of TAMs obtained from a murine sarcoma11 wherethese cells exert a protumor function.15
The transcriptional program of TAMs was compared with thoseexpressed by peritoneal macrophages (PECs) and myeloid suppres-sor cells (MSCs). PECs and TAMs are mature macrophagepopulations originating from common precursors, the circulatingmonocytes, whereas MSCs represent a prototypical M2 myeloidpopulation.16 Lipopolysaccharide (LPS) was used in the presentstudy as a classic model of activation stimulus of macrophagesinteracting with TLR4,17 a receptor that may also be triggered bycomponents present in the tumor microenvironment (eg, hsp andderivatives of fibrinogen).18-21
Profiling of TAMs from a murine sarcoma revealed unexpectedexpression of IFN-inducible chemokines associated with an M2phenotype (IL-10high, IL-12low) and divergent regulation of theNF-�B versus the IRF-3/STAT1 pathway.
Materials and methods
Cell culture
PECs, TAMs, and MSC-2 cells were cultured in RPMI 1640 mediumcontaining 10% FCS, 2 mM glutamine, and 100 U/mL penicillin-streptomycin. The concentrations for the different agents used toactivate the macrophage cultures were as follows: IFN-� (500 U/mL;Hoffmann-LaRoche, Basilea, Switzerland); LPS (100 ng/mL; lipopoly-saccharide from Escherichia coli strain B05.55; Sigma, St Louis, MO).The MSC-2 line originated from Gr-1� splenocytes from mice immu-nized 6 days earlier with a recombinant vaccinia virus encoding mouseIL-2, as previously described.22
Preparation of PECs and TAMs
The study was reviewed and approved by the Istituto di RicercheFarmacologiche Mario Negri (IRFMN) Animal Care and Use Committee(IACUC), which includes members ad hoc for ethical issues, in compliancewith the National Institutes of Health (NIH) Guide for the Care and Use ofLaboratory Animals and European Union (EU) directives and guidelines.
Male 8-week-old C57Bl/6 mice were obtained from Charles RiverBreeding Laboratories (Calco, Italy). PECs and TAMs were isolated on thesame day under the same culture conditions. Mice were inoculatedintramuscularly in the left hind limb with a total of 105 MN/MCA1fibrosarcoma11 cells per mouse. Tumor take was monitored and diameter ofgrowing tumors was measured in centimeters twice a week by caliper.TAMs were isolated 3 weeks after tumor implantation, as describedpreviously.11 Briefly, solid tumors were disaggregated by stirring with0.125% (wt/vol) Trypsin (Sigma) for 40 minutes at 37°C, followed bywashing twice in incomplete RPMI 1640 medium. Cells (70 � 106) wereseeded in 140-mm Petri dishes (Cel Cult; Sterilin, Feltham, UnitedKingdom) in a final volume of 20 mL incomplete medium and, after 1 hourof incubation, nonadherent cells were vigorously washed off. The adherentcells were greater than 95% macrophages as assessed by morphologic andfunctional criteria. Contaminating cells were tumor cells, unidentified smallmononuclear cells, and polymorphonuclear leukocytes. Immunofluores-cence staining for macrophage markers (F4/80 and CD68) also confirmedthe identity of the adherent populations. All culture reagents contained less
than 0.125 endotoxin unit/mL as checked by Limulus amebocyte lysateassay (BioWhittaker, Walkersville, MD).
Peritoneal exudate cells were harvested from mice that had receivedinjections of 500 �L 3% (wt/vol) thioglycollate medium (Difco, Detroit,MI) 4 days prior to isolation, as described previously.11 A total of20 � 106 macrophages were seeded in 140-mm Petri dishes (Cel Cult;Sterilin) in a final volume of 20 mL incomplete medium and, after 1 hourof incubation, nonadherent cells were thoroughly washed off with jets ofmedium. Monolayers were greater than 95% macrophages, assessed bymorphologic criteria and by a monoclonal antibody to mouse CD68(macrophage marker, clone FA-11, dilution 1:50; Hycult Biotechnology,Uden, The Netherlands) or an anti–mouse F4/80 antigen monoclonalantibody (clone C1:A3-1, dilution 1:50; Serotec, Oxford, UnitedKingdom). All cultures were maintained in complete RPMI 1640medium. After adherence, cells were rested for 1 hour in standardculture conditions and subsequently used in our experiments.
Possible effects of trypsin (used to disaggregate the tumors) on the geneexpression profile were ruled out based on the results of gene expressionexperiments performed on normal macrophages in the presence or absenceof trypsin, under exactly the same conditions as used for tumor disaggrega-tion. Microarray as well as real-time polymerase chain reaction (PCR) forsome representative TAM genes showed no significant change in responseto trypsin treatment (data not shown).
RNA isolation and cDNA microarray
Microarray analysis of PECs and TAMs was done using the 10K murinecDNA array slides provided by the Molecular Technology Center (NationalCancer Institute, Frederick, MD). Briefly, RNA from PECs or TAMs wasextracted by the TRIzol method, quantified by optical density (OD)measurement, and checked for degradation. Before using for microarray,reverse transcriptase–PCR (RT-PCR) was run on IFN-�/LPS-treated PECand TAM RNA to check the IL-12p40�/IL-10� phenotype for TAMs. TotalRNA from each sample (20 �g) was labeled and purified using theLabelStar Array kit (Qiagen gmbH, Hilden, Germany) as per manufactur-er’s protocol. Hybridization of the denatured labeled cDNA probes onto the10K array slides was carried out by incubation at 65°C overnight in ahybridization chamber, followed by serial stringency washing (1 minute in1 � SSC, 1 minute in 0.2 � SSC, 10 seconds in 0.05 � SSC) to removeexcess dye. Thereafter, the dried slides were scanned with an Axon 4000scanner (Axon Instruments, Foster City, CA) at a resolution of 10 �m. Thereference RNA was labeled by using cyanine 3–dUTP (Cy3), whereas theexperimental RNA was labeled with cyanine 5–dUTP (Cy5), except for thereverse-labeled experiments, which were performed to remove dye biasfrom the analysis. In most cases, PEC samples were labeled for Cy3 dye,TAM samples were labeled for Cy5 dye (for PEC versus TAM experi-ments), untreated samples were labeled for Cy3 dye, and LPS-treatedsamples were labeled for Cy5 dye (for untreated versus LPS-treatedexperiments in PECs and TAMs).
Data mining and statistical analysis
Image analysis and the calculation of average foreground signal adjustedfor local channel–specific background was performed with GenePix Pro 4.0(Axon Instruments) software. Global normalization of each array wasseparately done to make the median value of log 2 ratios equal to zero.Finally, the image and signal intensity data were uploaded onto the onlineMADB facility23 for data analysis. Cy5/Cy3 intensity ratios from each genewere calculated and subsequently normalized to ratios of overall signalintensity from the corresponding channel in each hybridization. TheCy5/Cy3 ratio represents the relative abundance of the genes in eachexperimental sample compared with the reference sample and henceprovides quantitative measurements of the relative gene expression levelsacross all experimental samples. For all data filtering processes, genesqualifying for Cy5/Cy3 ratios greater than or equal to 2.5, or less than orequal to 0.4 were used as indicators of significantly different geneexpression levels between 2 samples hybridized to the same array spot.All statistical analysis for the arrays was carried out using the MADBonline facility.23 Each experiment was performed twice with reciprocal
MOLECULAR CHARACTERIZATION OF TAMs 2113BLOOD, 1 MARCH 2006 � VOLUME 107, NUMBER 5
For personal use only.on November 23, 2018. by guest www.bloodjournal.orgFrom

labeling and 3 such independent experiments were performed to meetthe statistical requirements. Minimum information about a MicroarrayExperiment (MIAME) and the entire data set for all microarrayexperiments are available on the MADB website23 and NCBI-GEO24
(accession no. GSE2098).
Real-time PCR
RT reaction from 1 �g RNA template was performed using TaqManreverse transcription reagents (Applied Biosystems, Piscataway, NJ) asper manufacturer’s instructions. Real-time PCR was done using SyBrGreen PCR Master Mix (Applied Biosystem, Piscataway, NJ) anddetected by ABI-Prism 5700 Sequence Detector (Applied Biosystems,Foster City, CA). Data were processed using the GeneAmp software(Applied Biosystems, Foster City, CA) and normalized by actin geneexpression levels. All real-time results were expressed as fold changes inmRNA expression with respect to the control cells. All results werenormalized to the expression of the housekeeping gene �-actin in thePCR reactions. Data represented are from 3 independent experimentsdone in triplicate.
Immunoblotting
After the indicated treatments, PECs or TAMs were washed with ice-coldphosphate-buffered saline (PBS) containing 1 mM Na3VO4, then lysed in50 �L of lysis buffer (20 mM Tris-HCl, pH 8; 137 mM NaCl; 10% glycerol[vol/vol]; 1% Triton X-100 [vol/vol]; 1 mM Na3VO4; 2 mM EDTA; 1 mMPMSF; 20 �M leupeptin; and 0.15 U/mL aprotinin) for 20 minutes at 4°C.The lysates were centrifuged at 13 000g at 4°C for 15 minutes, and thesupernatants (containing Triton X-100–soluble proteins) were run on a 10%(wt/vol) sodium dodecyl sulfate–polyacrylamide gel electrophoresis (SDS-PAGE; 50 �g protein/lane). Separated proteins were transferred onto anitrocellulose membrane (1 h at 125 mA) and immunoblotted for specificantibodies as per manufacturer’s instructions. Blocking was done with 5%(wt/vol) bovine serum albumin (BSA) in TBS-0.1% Tween (TBST) for1 hour at room temperature. All antibody dilutions were prepared in 5%(wt/vol) BSA-TBST. Primary antibodies were used at 1:1000 dilution forovernight at 4°C. HRP-conjugated antirabbit secondary antibody (Amer-sham, Arlington Heights, IL) was used at 1:10 000 dilution for 1 hour atroom temperature. Blots were visualized using an enhanced chemilumines-cence (ECL) kit (Amersham, Arlington Heights, IL). The antibodies usedwere anti–phospho-STAT1 (Cell Signaling Technologies, Beverly, MA),anti-STAT1, anti-p65 NF-�B, and antiactin (Santa Cruz Biotechnologies,Santa Cruz, CA). For the nuclear translocation of p65 NF-�B proteins,extraction of nuclear proteins was done as described earlier.25
ELISA
Cell-free supernatants from untreated or LPS-treated (100 ng/mL) PECsand TAMs were harvested after 24-hour incubation and tested in sandwichenzyme-linked immunosorbent assay (ELISA) for the indicated cytokines/chemokines. IL-6, TNF-�, IL-10, CCL2, CCL5, CXCL9, CXCL10, andCXCL16 were quantified by ELISA kits from R&D Systems (Minneapolis,MN), as per manufacturer’s instructions. Results were normalized betweenPECs and TAMs and expressed as ng/mL/2 � 106 cells. Data are represen-tative of 3 independent experiments done in triplicate.
Laser confocal microscopy
After indicated treatments, macrophage monolayers were cultured onrounded pyrogen-free glass coverslips, washed with permeabilized PBS,fixed with 4% (wt/vol) paraformaldehyde (SIGMA-Aldrich, St Louis, MO)for 20 minutes at room temperature, permeabilized, and blocked with0.03% Triton-X100, normal goat serum (SIGMA-Aldrich), and 2% BSA(Amersham, Little Chalfont, United Kingdom) for 1 hour at roomtemperature. Thereafter, sections were washed with 0.2% BSA, 0.05%Tween 20 (Merck, West Point, PA) PBS and incubated with a rabbitpolyclonal antibody (Ab) anti–IRF-3 (gift from Dr Takashi Fujita, Tokyo) ata dilution of 1:50 for 60 minutes or with the indicated antibody. Sectionswere extensively washed and subsequently incubated with an anti–rabbit
IgG cross-adsorbed Alexa Fluor 647 conjugated antibody (MolecularProbes, Eugene, OR) diluted 1:1000 for 45 minutes at room temperature.For DNA detection, green SYTO 13 (Molecular Probes) plus RNAsi(SIGMA-Aldrich) was used. Sections were extensively washed with 0.2%BSA, 0.05% Tween 20 PBS; mounted with the FluorSave reagent (Calbio-chem, San Diego, CA); and analyzed using an Olympus Fluoview 500 laserscanning confocal microscope (Olympus, Hamburg, Germany) and aUPLANSApo 60 �/1.35 numeric aperture oil objective (Olympus). Imageswere captured and processed using Fluoview TV10-ASW applicationsoftware for spectral analysis.
Immunohistochemistry and tissue laser confocal microscopy
For immunohistochemistry and tissue laser confocal microscopy, samplesfrom tumor tissues were collected and frozen in liquid nitrogen. Nine-micrometer sections were cut and mounted on poly-L-lysine–coated slides.After fixation with acetone/chloroform for 3 minutes, sections wereincubated for 2 hours with the following antibodies: monoclonal antibodyto mouse CD68 (macrophage marker, clone FA-11, dilution 1:50; HycultBiotechnology), goat biotinylated anti–mouse CRG-2/IP10 antibody (dilu-tion 1:25; R&D Systems), monoclonal antibody to mouse Dectin-1 (clone2A11, dilution 1:50; Hycult Biotechnology), rat monoclonal antibody tomouse IL-10 (clone JES5-2A5, dilution 1:200; Serotec), rabbit polyclonalto mouse NOS 2 (N-20; dilution 1:10; Santa Cruz Biotechnology),monoclonal antibody to mouse MGL1 (dilution 1:10; a kind gift of DrPieter Leenen, Erasmus MC, Rotterdam; and Dr Geert Raes, VrijeUniversiteit Brussel),26 goat polyclonal biotinylated anti–mouse CXCL9/MIG antibody (dilution 1:10; R&D Systems), goat polyclonal biotinylatedanti–mouse CXCL16 antibody (dilution 1:5; R&D Systems), goat poly-clonal biotinylated anti–mouse CCL2/JE/MCP-1 antibody (dilution 1:5;R&D Systems), goat polyclonal anti–mouse CCL5/RANTES antibody(dilution 1:20; R&D Systems). For immunohistochemistry, the stainingwas revealed by using specific secondary antibodies with 3-3 diamino-benzidine as chromogen. For laser confocal analysis, the specificsecondary antibodies were used: Alexa Fluor 488 goat antimouse,antirabbit, and anti–rabbit streptavidin conjugated, and Alexa 647antimouse, antirabbit, and anti–rabbit streptavidin conjugated. Negativecontrols were obtained by using isotype-matched primary antibodies.
Results
TAM transcriptome shows a characteristic geneexpression profile
RNA from TAMs and thioglycollate-elicited PECs (used ascontrol population) was subjected to microarray analysis using amurine 10 000-gene National Cancer Institute (NCI) slideas described in “RNA isolation and cDNA microarray.” Thecomparison between PECs and TAMs revealed qualitative andquantitative differences in their transcriptomes and only thesignificantly modulated genes of immunologic relevance werefurther investigated. As summarized in Table 1, the resting TAMtranscriptome was characterized by the high expression of genescoding for chemokines (Ccl2, Ccl5, and Cxcl10); scavengingreceptors and phagocytosis-associated molecules (macro-phage scavenger receptor 2 or scavenger receptor type II [Msr2]and complement 1q, polypeptide alpha and gamma [C1qa, g]);surface molecules/markers (lymphocyte antigen 6 complexlocus A, E [Ly6a, e], CD81 [Cd81], major histocompatibilitycomplex [MHC] II [H2DMa, H2Eb1]); miscellaneous genes forgrowth regulators (migration inhibitory factor [Mif], allograftinflammatory factor 1 [Aif1], transforming growth factor beta-induced [Tgfbi]); and transcription factors (interferon respon-sive element 7 [Irf7], T-box 6 [Tbx6], and inhibitor of DNAbinding 3 [Idb3]). In contrast, though PECs expressed very low
2114 BISWAS et al BLOOD, 1 MARCH 2006 � VOLUME 107, NUMBER 5
For personal use only.on November 23, 2018. by guest www.bloodjournal.orgFrom

Table 1. Selected gene list defining the TAM transcriptome
Feature ID Gene DescriptionAveragelog ratio
Up-regulated genes
Receptors/surface molecules
IMAGE:534886 Ly6a* Lymphocyte antigen 6 complex, locus A 8.70
IMAGE:582679 Ly6e Lymphocyte antigen 6 complex, locus E 7.05
IMAGE:775893 Cd81* CD81 antigen 5.05
IMAGE:1477073 Msr2* Macrophage scavenger receptor 2 5.50
IMAGE:1367026 Sema4d Sema domain, (semaphorin) 4D 3.85
IMAGE:597157 C1qa* Complement component 1, q subcomponent, alpha polypeptide 4.69
IMAGE:426010 C1qg Complement component 1, q subcomponent, gamma polypeptide 2.95
IMAGE:524391 Axl AXL receptor tyrosine kinase 3.60
IMAGE:1382670 H2-DMa Histocompatibility 2, class II, locus DMa 2.95
IMAGE:1092081 H2-Eb1* Histocompatibility 2, class II, antigen E beta 1 2.70
IMAGE:406272 Crabp1 Cellular retinoic acid binding protein I 3.10
IMAGE:576062 Fegr1 Fe receptor, IgG, high affinity I 4.30
Chemokines
IMAGE:1446589 Cxcl10* Chemokine (C-X-C motif) ligand 10 4.10
IMAGE:832342 Ccl5* Chemokine (C-C motif) ligand 5 2.75
IMAGE:573898 Ccl2* Chemokine (C-C motif) ligand 2 2.51
Transcriptional factors
IMAGE:1430219 Irf7 Interferon regulatory factor 7 5.40
IMAGE:521100 Idb3 Inhibitor of DNA binding 3 3.10
IMAGE:1446422 Tbx6 T-box 6 2.90
IMAGE:1222882 Hdac6 Histone deacetylase 6 3.20
IMAGE:934509 Hist2h2aa1 Histone 2, H2aa1 3.10
Growth factors/miscellaneous
IMAGE:734101 Tgfbi* Transforming growth factor, beta induced 4.70
IMAGE:315447 Mif * Macrophage migration inhibitory factor 6.00
IMAGE:1382096 Aif1 Allograft inflammatory factor 1 3.50
IMAGE:819851 Gstp2 Glutathione S-transferase, pi 2 3.10
IMAGE:570994 Igfbp4 Insulin-like growth factor binding protein 4 2.70
IMAGE:1228288 Ucp2 Uncoupling protein 2, mitochondrial 2.60
IMAGE:537489 Ccnd1 Cyclin D1 2.93
IMAGE:440572 Col13a1 Procollagen, type XIII, alpha 1 4.00
IMAGE:864318 Lst1 Leukocyte-specific transcript 1 2.80
IMAGE:581981 Unknown 3.20
IMAGE:1247540 Dapk3 Death associated protein kinase 3 5.80
IMAGE:1210036 Ifit3 Interferon-induced protein with tetratricopeptide repeats 3 2.50
Proteases and their inhibitors
IMAGE:1227398 Spint1 Serine protease inhibitor, Kunitz type 1 2.80
IMAGE:1077734 Serpinh1 Serine (or cysteine) proteinase inhibitor, clade H, member 1 2.50
Down-regulated genes
Receptors/surface molecules
IMAGE:764624 Cd5l CD5 antigen-like 0.18
IMAGE:440614 Gp49b Glycoprotein 49 B 0.29
IMAGE:404131 Plaur Urokinase plasminogen activator receptor 0.25
IMAGE:518979 Hbb-y Hemoglobin Y, beta-like embryonic chain 0.28
IMAGE:1617481 Cd83 CD83 antigen 0.30
IMAGE:437512 Tnfrsf1b Tumor necrosis factor receptor superfamily, member 1b 0.50
IMAGE:1068952 Folr2 Folate receptor 2 (fetal) 0.21
IMAGE:366999 Il11ra1 Interleukin 11 receptor, alpha chain 1 0.49
IMAGE:1349690 Il11ra2 Interleukin 11 receptor, alpha chain 2 0.43
IMAGE:405832 P2ry2 Purinergic receptor P2Y, G-protein coupled 2 0.39
IMAGE:1227418 C4 Complement component 4 (within H-2S) 0.35
IMAGE:1224549 Igf2r Insulin-like growth factor 2 receptor 0.43
IMAGE:533799 Lbp Lipopolysaccharide binding protein 0.36
Chemokines
IMAGE:751833 Ccl3* Chemokine (C-C motif) ligand 3 0.44
IMAGE:1078018 Ccl4 Chemokine (C-C motif) ligand 4 0.47
IMAGE:1077529 Ccl6 Chemokine (C-C motif) ligand 6 0.14
IMAGE:1148463 Ccl9 Chemokine (C-C motif) ligand 9 0.38
Transcriptional factors
IMAGE:403789 Idb2 Inhibitor of DNA binding 2 0.26
MOLECULAR CHARACTERIZATION OF TAMs 2115BLOOD, 1 MARCH 2006 � VOLUME 107, NUMBER 5
For personal use only.on November 23, 2018. by guest www.bloodjournal.orgFrom
but detectable levels of proinflammatory chemokines/cytokinegenes such as Ccl3, Ccl4, Ccl6, Ccl9, Il1b, and tumor necrosisfactor alpha (Tnfa), the basal expression of these genes wassignificantly down-regulated in TAMs. Other notably down-regulated genes were those coding for proteases and theirinhibitors (cathepsins B, L [Ctsl, Ctsb], tissue inhibitor ofmetalloprotease 1 [Timp1], secretory leukocyte protease inhibi-tor [Slpi]; Table 1). As shown in Figure 1, hierarchicalclustering confirmed that the TAM profile was consistentlyobserved in 4 different experiments.
Based on the TAM microarray profile, further investigationon expression of the genes coding for chemokines/cytokines/growth factors (Ccl2, Ccl5, Cxcl10, Il-10, Mif) and surfacemolecules (Cd81, Msr2, C1qa, Ly6e and H2Eb1 [MHC-II]) wasperformed by real-time PCR. Figure 2A shows the relativemRNA expression levels of these genes in TAMs and PECs. Theresults demonstrated consistently higher mRNA expression forall the above genes in resting TAMs compared with PECs.Similar results were obtained when resident peritoneal macro-phages were used (not shown). In addition, the up-regulation of2 other interferon-inducible chemokine genes, Cxcl9 and Cxcl16,was also detected in TAMs by RT-PCR. The gene expressionprofile for TAMs was also reflected in terms of protein secretion.ELISA for the chemokine/cytokine-associated genes clearlyconfirmed significantly higher levels of CCL2, CCL5, CXCL9,CXCL10, CXCL16, and IL-10 proteins in the supernatants fromTAMs compared with PECs (Figure 2B).
Characterization of TAMs in vivo
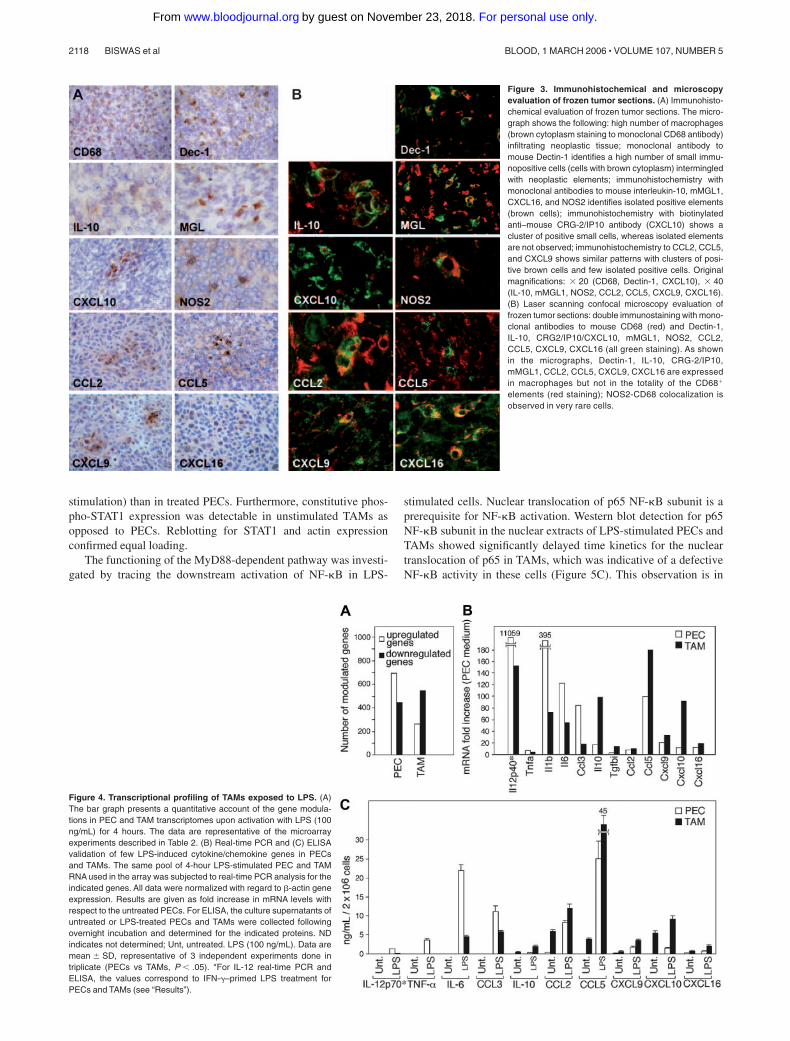
In an effort to assess the in vivo relevance of the present, as wellas previous, in vitro characterization of TAMs, we performedimmunohistochemical evaluation of M1 and M2 markers onfrozen tumor sections. Dectin-1, MGL1, and IL-10 were chosenas M2 markers.4,26,27 We also investigated NOS2, CCL2, CCL5,CXCL9, CXCL10, and CXCL16, which are generally associated
with an M1 phenotype although they are also expressed inTAMs. Dectin-1 is the major macrophage receptor for beta-glucans and was found to be highly up-regulated by GM-CSFand by the cytokines that induce alternative macrophage activa-tion, IL-4 and IL-13.27 MGL1 is a member of the mousemacrophage galactose–type C–type lectin gene family and isinduced in diverse M2 macrophage population during infectionwith the protozoan Trypanosoma brucei or the Helminth Taeniacrassiceps or exposure to IL-4 and IL-13.26 As shown in Figure3A, the MN/MCA1 fibrosarcoma was highly infiltrated byCD68� cells, corresponding to TAMs. In addition, we observeda high number of Dectin-1� cells as well as a significantpositivity for MGL1 and IL-10. As confirmed by confocalmicroscopy (Figure 3B), CD68 expression colocalized withDectin-1, MGL, and IL-10 on a significant number of cells. Asshown, we also observed islets of either CCL2, CCL5, CXCL9,CXCL10, and CXCL16, or NOS2-positive cells (Figure 3A). Tonote, while CCL2, CCL5, CXCL9, CXCL10, and CXCL16colocalized with CD68 on a significant number of cells, onlysporadically could we observe colocalization of small spots ofNOS2 on CD68� cells (Figure 3B). Thus, analysis of TAMs invivo is consistent with in vitro profiling and suggests that TAMsexpress a mixed phenotype, with key properties of M2 cells (eg,MGL-1high, scavenger receptorhigh IL-10high, IL-12low), coex-pressed with IFN-inducible chemokines.
LPS responsiveness of TAMs
We have previously shown that TAMs express defective IL-12production and NF-�B activation.11 Based on this, it wasimportant to characterize the transcriptome profile of TAMsin response to proinflammatory signals, such as LPS. Threetypes of array experiments were performed: untreated PECsversus LPS-treated PECs, untreated TAMs versus LPS-treated TAMs, and LPS-treated PECs versus LPS-treated TAMs.Results from these experiments showed the induction of a
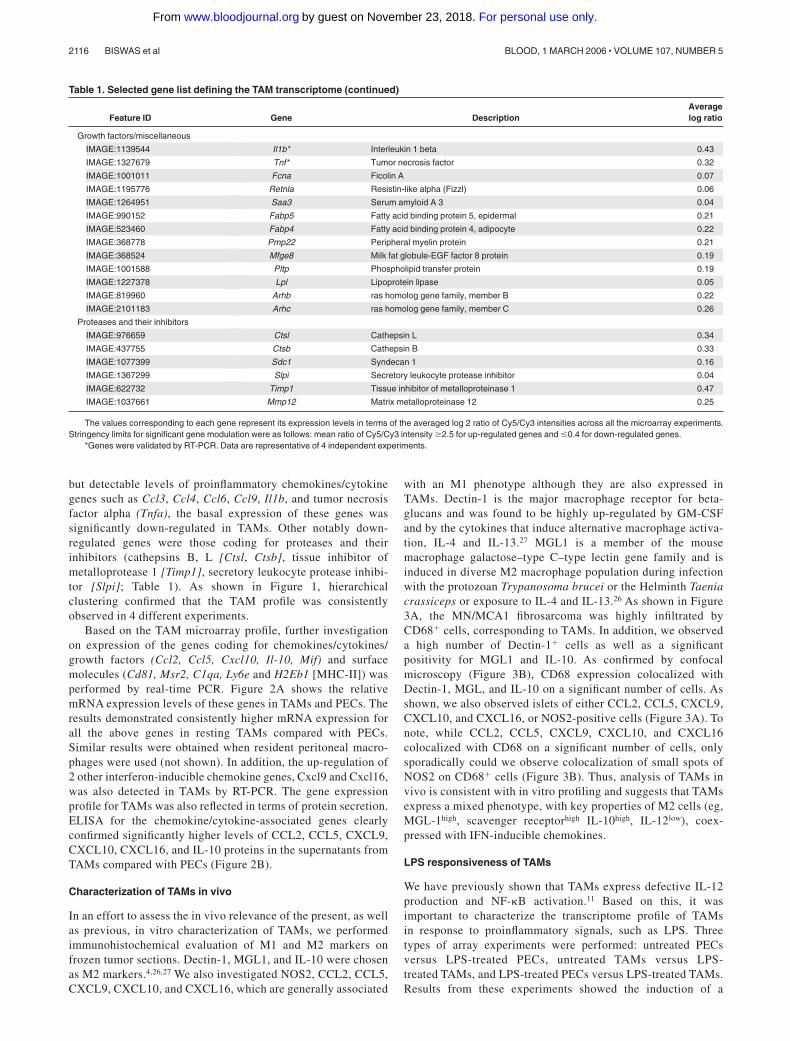
Table 1. Selected gene list defining the TAM transcriptome (continued)
Feature ID Gene DescriptionAveragelog ratio
Growth factors/miscellaneous
IMAGE:1139544 Il1b* Interleukin 1 beta 0.43
IMAGE:1327679 Tnf* Tumor necrosis factor 0.32
IMAGE:1001011 Fcna Ficolin A 0.07
IMAGE:1195776 Retnla Resistin-like alpha (Fizzl) 0.06
IMAGE:1264951 Saa3 Serum amyloid A 3 0.04
IMAGE:990152 Fabp5 Fatty acid binding protein 5, epidermal 0.21
IMAGE:523460 Fabp4 Fatty acid binding protein 4, adipocyte 0.22
IMAGE:368778 Pmp22 Peripheral myelin protein 0.21
IMAGE:368524 Mfge8 Milk fat globule-EGF factor 8 protein 0.19
IMAGE:1001588 Pltp Phospholipid transfer protein 0.19
IMAGE:1227378 Lpl Lipoprotein lipase 0.05
IMAGE:819960 Arhb ras homolog gene family, member B 0.22
IMAGE:2101183 Arhc ras homolog gene family, member C 0.26
Proteases and their inhibitors
IMAGE:976659 Ctsl Cathepsin L 0.34
IMAGE:437755 Ctsb Cathepsin B 0.33
IMAGE:1077399 Sdc1 Syndecan 1 0.16
IMAGE:1367299 Slpi Secretory leukocyte protease inhibitor 0.04
IMAGE:622732 Timp1 Tissue inhibitor of metalloproteinase 1 0.47
IMAGE:1037661 Mmp12 Matrix metalloproteinase 12 0.25
The values corresponding to each gene represent its expression levels in terms of the averaged log 2 ratio of Cy5/Cy3 intensities across all the microarray experiments.Stringency limits for significant gene modulation were as follows: mean ratio of Cy5/Cy3 intensity �2.5 for up-regulated genes and �0.4 for down-regulated genes.
*Genes were validated by RT-PCR. Data are representative of 4 independent experiments.
2116 BISWAS et al BLOOD, 1 MARCH 2006 � VOLUME 107, NUMBER 5
For personal use only.on November 23, 2018. by guest www.bloodjournal.orgFrom

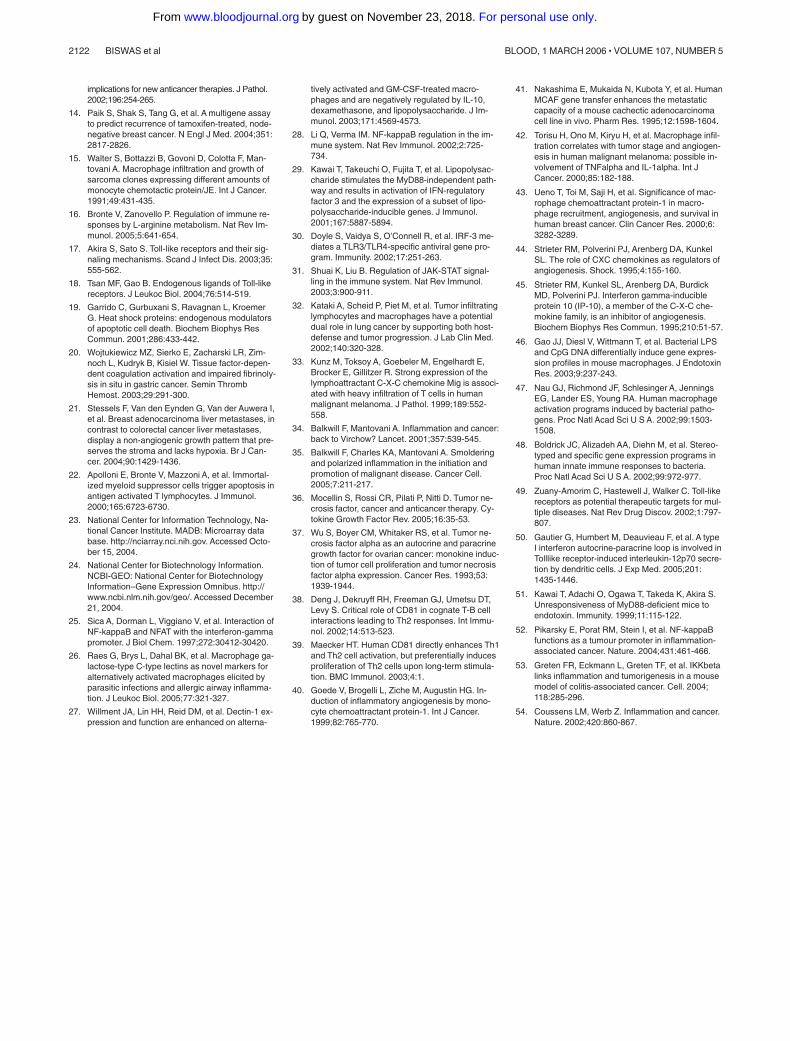
common set of LPS-inducible genes in both PECs and TAMs.However, quantitative estimate of the total LPS-inducible genesin both of the transcriptomes showed a significantly lowernumber of induced genes in TAMs (263) compared with PECs(692; Figure 4A). More importantly, among the common set ofLPS-inducible genes, the TAM profile showed a significantlylower level of expression of several proinflammatory genes suchas Tnfa; Il1b; Ccl3, 6, and 9; Slpi; and ROI-related genes likeSod2 and Mt2 compared with PECs (Table 2). Real-time PCRanalysis for several proinflammatory genes validated the abovegene expression profile. Figure 4B demonstrates that LPS-treated TAMs not only expressed lower mRNA levels for Tnfa,Il1b, Il6, and Ccl3 genes but high mRNA expression ofanti-inflammatory cytokines IL-10 and TGF�1. For the IL-12p40 gene, mRNA expression was studied in response to IFN-�plus LPS treatment, as stimulation with LPS alone yielded poormRNA expression. In accordance to an earlier report,11 TAMsshowed decreased IL-12p40 mRNA expression compared withthe PECs. High mRNA expression of Ccl2, Ccl5, Cxcl9, Cxcl10,and Cxcl16 in the LPS-treated TAMs, as opposed to their PEC
counterpart, was also detectable by RT-PCR. Finally, confirma-tion of the above results by ELISA demonstrated impairedexpression of proinflammatory molecules IL-12p70, TNF-�,IL-6, and CCL3 but high expression of anti-inflammatorycytokine IL-10 as well as CCL2 and the IFN-inducible chemo-kines CCL5, CXCL9, CXCL10, and CXCL16 in the LPS-stimulated TAM supernatants (Figure 4C).
TAMs express defective NF-�B and enhancedIRF-3/STAT1 activation
To investigate the mechanistic basis of the TAM phenotype, wecarried out a biochemical dissection of the signal transductionprocess in both PECs and TAMs upon activation with LPS. LPSsignaling through the TLR4 receptor leads to the MyD88-dependent activation of NF-�B, a key transcription factor for theexpression of most proinflammatory genes.28 In parallel, TLR4engagement also promotes the MyD88-independent transcriptionof interferon-inducible chemokines (eg, CCL2, CCL5, CXCL10)through the activation of IRF-3 and STAT1.17,29,30 The activation ofIRF-3 was studied by visualizing its nuclear translocation in TAMsby laser confocal microscopy. Untreated and LPS-treated PECswere used as controls. Figure 5A (bottom panel) shows massivenuclear translocation of IRF-3 at 2 hours following stimulation ofTAMs with 100 ng/mL LPS, indicating its activation. Expression ofinterferon-inducible chemokines requires activation of STAT1transcription factor.31 We investigated the activation of STAT1 andits expression in untreated or LPS-treated PECs and TAMs. Asshown in Figure 5B, time kinetics for STAT1 activation using ananti–phospho-STAT1 antibody revealed a significantly higherSTAT1 phosphorylation in LPS-treated TAMs (30-60 minutes of
Figure 2. Validation of selected components of the TAM transcriptome byRT-PCR and ELISA. (A) Real-time PCR of few highly expressed genes from the TAMtranscriptome. The same pool of PEC and TAM RNA used in the array analysis wassubjected to real-time PCR for the indicated genes. Representative results are givenas fold increases in mRNA expression with respect to (wrt) the PECs. Data werenormalized to actin gene expression as mentioned in “Materials and methods.” (B)ELISA detection for CCL2, CCL5, CXCL9, CXCL10, CXCL16, and IL-10 proteins inthe culture supernatants of untreated PECs and TAMs cultured overnight understandard conditions. ND indicates not determined. Data are mean standarddeviation (SD), representative of 3 independent experiments done in triplicate (PECsvs TAMs, P � .05).
Figure 1. Hierarchical clustering of the TAM transcriptome in different experi-ments. Significantly modulated genes from the TAM transcriptome were clusteredinto a hierarchical representation, generated by the online NCI-MADB facility.23 Eachcolumn represents a particular experiment, whereas each row corresponds to theexpression of a particular gene across different experiments. Gene names areindicated on the right. The color bar at the bottom left corner of the diagram correlatesthe degree of gene expression with the color scheme: up-regulated genes arerepresented in red, down-regulated genes in green, and unmodulated genes in black.
MOLECULAR CHARACTERIZATION OF TAMs 2117BLOOD, 1 MARCH 2006 � VOLUME 107, NUMBER 5
For personal use only.on November 23, 2018. by guest www.bloodjournal.orgFrom
stimulation) than in treated PECs. Furthermore, constitutive phos-pho-STAT1 expression was detectable in unstimulated TAMs asopposed to PECs. Reblotting for STAT1 and actin expressionconfirmed equal loading.
The functioning of the MyD88-dependent pathway was investi-gated by tracing the downstream activation of NF-�B in LPS-
stimulated cells. Nuclear translocation of p65 NF-�B subunit is aprerequisite for NF-�B activation. Western blot detection for p65NF-�B subunit in the nuclear extracts of LPS-stimulated PECs andTAMs showed significantly delayed time kinetics for the nucleartranslocation of p65 in TAMs, which was indicative of a defectiveNF-�B activity in these cells (Figure 5C). This observation is in
Figure 3. Immunohistochemical and microscopyevaluation of frozen tumor sections. (A) Immunohisto-chemical evaluation of frozen tumor sections. The micro-graph shows the following: high number of macrophages(brown cytoplasm staining to monoclonal CD68 antibody)infiltrating neoplastic tissue; monoclonal antibody tomouse Dectin-1 identifies a high number of small immu-nopositive cells (cells with brown cytoplasm) intermingledwith neoplastic elements; immunohistochemistry withmonoclonal antibodies to mouse interleukin-10, mMGL1,CXCL16, and NOS2 identifies isolated positive elements(brown cells); immunohistochemistry with biotinylatedanti–mouse CRG-2/IP10 antibody (CXCL10) shows acluster of positive small cells, whereas isolated elementsare not observed; immunohistochemistry to CCL2, CCL5,and CXCL9 shows similar patterns with clusters of posi-tive brown cells and few isolated positive cells. Originalmagnifications: � 20 (CD68, Dectin-1, CXCL10), � 40(IL-10, mMGL1, NOS2, CCL2, CCL5, CXCL9, CXCL16).(B) Laser scanning confocal microscopy evaluation offrozen tumor sections: double immunostaining with mono-clonal antibodies to mouse CD68 (red) and Dectin-1,IL-10, CRG2/IP10/CXCL10, mMGL1, NOS2, CCL2,CCL5, CXCL9, CXCL16 (all green staining). As shownin the micrographs, Dectin-1, IL-10, CRG-2/IP10,mMGL1, CCL2, CCL5, CXCL9, CXCL16 are expressedin macrophages but not in the totality of the CD68�
elements (red staining); NOS2-CD68 colocalization isobserved in very rare cells.
Figure 4. Transcriptional profiling of TAMs exposed to LPS. (A)The bar graph presents a quantitative account of the gene modula-tions in PEC and TAM transcriptomes upon activation with LPS (100ng/mL) for 4 hours. The data are representative of the microarrayexperiments described in Table 2. (B) Real-time PCR and (C) ELISAvalidation of few LPS-induced cytokine/chemokine genes in PECsand TAMs. The same pool of 4-hour LPS-stimulated PEC and TAMRNA used in the array was subjected to real-time PCR analysis for theindicated genes. All data were normalized with regard to �-actin geneexpression. Results are given as fold increase in mRNA levels withrespect to the untreated PECs. For ELISA, the culture supernatants ofuntreated or LPS-treated PECs and TAMs were collected followingovernight incubation and determined for the indicated proteins. NDindicates not determined; Unt, untreated. LPS (100 ng/mL). Data aremean SD, representative of 3 independent experiments done intriplicate (PECs vs TAMs, P � .05). *For IL-12 real-time PCR andELISA, the values correspond to IFN-�–primed LPS treatment forPECs and TAMs (see “Results”).
2118 BISWAS et al BLOOD, 1 MARCH 2006 � VOLUME 107, NUMBER 5
For personal use only.on November 23, 2018. by guest www.bloodjournal.orgFrom

agreement with our previous report on defective NF-�B activationin TAMs.11
Taken together, these results suggest a defective MyD88-dependent NF-�B pathway but a functional MyD88-independentpathway in TAMs. Divergent regulation of NF-�B and IRF-3/STAT1 islikely to underlie the differential gene expression profile of TAMs.
Profiling TAMs versus myeloid suppressor cells
Several reports have identified an M2-biased cell population inlymphoid organs of tumor-bearing hosts referred to as themyeloid suppressor cells (MSCs), which are suggested tocontribute to the immunosuppressive phenotype.16 In an effort toput TAM profiling in a more general contest, we compared theTAMs with this cell population, with respect to their ability toexpress typical M2 genes, upon skewing by the M2 stimulusIL-4. As shown in Figure 6, resting TAMs expressed higherlevels of Arg1, Fizz1, Ccl22, Il10, and Tgfb1 compared with
MSCs. IL-4 treatment induced significant expression of M2gene subset, Arg1, Fizz1, Ym1, Ccl22, Il10, and Tgfb1, whichwas comparable to (or even higher than) that of IL-4–treatedmyeloid suppressor cells (MSC2), a prototypic M2 population.16
This suggested that the TAMs were prone to M2 skewingcompared with other M2 subpopulations, thus indicating theirtype II/M2 bias. However, interesting differences between theMSCs and TAMs were also evident. In particular, the expressionof Ccl22 was significantly higher in the IL-4–treated TAMs incomparison with the M2-skewed MSC2 cells. Moreover, TGF�expression was restricted to unstimulated TAMs and was notfurther increased by M2-biasing cytokines.
Due to the capability of TAMs to coexpress both M2-relatedgenes and IFN-inducible M1 chemokines, LPS-activated TAMsand LPS-activated MSCs were compared for the expression ofCCL2, CCL5, CXCL9, CXCL10, and CXCL16 (Figure 6B). Asshown, following LPS activation, both TAMs and MSCsdisplayed appreciable levels of IFN-inducible chemokines.
Table 2. Profiling of the response of TAMs and PECs to LPS
Genes Description Feature ID
Average log 2 ratio
PECs, Untvs LPS
TAMs, Untvs LPS
TAM-LPS vsPEC-LPS
Cytokines/chemokines/growth factors
Tnf Tumor necrosis factor IMAGE:1327679 3.57 1.62 0.20
Il1b Interleukin 1 beta IMAGE:1139544 4.94 2.18 0.14
Saa3 Serum amyloid A 3 IMAGE:1264951 2.85 1.78 0.21
Ccl3 Chemokine (C-C motif) ligand 3 IMAGE:751833 4.94 2.53 0.08
Ccl5 Chemokine (C-C motif) ligand 5 IMAGE:832342 4.35 4.54 2.71
Ccl6 Chemokine (C-C motif) ligand 6 IMAGE:1077529 4.04 0.30 0.14
Ccl9 Chemokine (C-C motif) ligand 9 IMAGE:1148463 2.61 0.30 0.14
Cxcl10 Chemokine (C-X-C motif) ligand 10 IMAGE:1446589 3.99 3.48 2.55
Tgfbi Transforming growth factor, beta induced IMAGE:734101 3.20 1.80 9.45
Il12b Interleukin 12 beta* RT-PCR 11059.75 151.70 0.01
Il10 Interleukin 10* RT-PCR 4.31 12.37 2.87
ROI/RNI metabolism
Sod2 Superoxide dismutase 2, mitochondrial IMAGE:791140 2.26 1.10 0.34
Nos2 Nitric oxide synthase 2, inducible, macrophage IMAGE:922250 3.57 4.11 1.16
Atox1 ATX1 (antioxidant protein 1) homolog 1 (yeast) IMAGE:479066 1.74 0.69 0.83
Mt1 Metallothionein 1 IMAGE:1037652 3.43 0.48 1.05
Mt2 Metallothionein 2 IMAGE:334351 3.58 1.30 0.45
Lyzs Lysozyme IMAGE:1382758 1.52 0.32 0.22
Surface molecules/receptors
Il17r Interleukin 17 receptor IMAGE:1139646 2.31 0.23 0.18
Tnfrsf1b Tumor necrosis factor receptor superfamily, member 1b IMAGE:437512 4.54 3.22 0.30
Tnfrsf5 Tumor necrosis factor receptor superfamily, member 5 IMAGE:477641 2.77 2.13 0.41
Ccrl2 Chemokine (C-C motif) receptor-like 2 IMAGE:442765 2.40 2.22 0.38
Icam1 Intercellular adhesion molecule IMAGE:1045389 2.13 1.13 1.18
Signaling molecules/transcription
factors
Nfkbib
Nuclear factor of kappa light chain gene enhancer in B-cells
inhibitor, beta IMAGE:946105 2.47 1.55 0.75
Socs3 Suppressor of cytokine signaling 3 IMAGE:988726 3.71 2.14 0.30
Stat3 Signal transducer and activator of transcription 3 IMAGE:479013 1.43 2.05 0.68
Tbx6 T-box 6 IMAGE:1446422 3.27 3.32 0.46
Irf1 Interferon regulatory factor 1 IMAGE:1344724 1.50 0.2 0.45
Irf7 Interferon regulatory factor 7 IMAGE:1430219 2.54 1.61 0.62
Proteases and their inhibitors
Slpi Secretory leukocyte protease inhibitor IMAGE:1367299 2.46 0.12 0.12
Timp1 Tissue inhibitor of metalloproteinase 1 IMAGE:622732 3.73 0.31 0.08
Mmp14 Matrix metalloproteinase 14 (membrane-inserted) IMAGE:1209994 2.38 1.15 0.90
The values corresponding to each gene represents gene modulation expressed in terms of the averaged log 2 ratio of Cy5/Cy3 intensities across all the microarrayexperiments. Stringency limits for significant gene modulation were as follows: mean ratio of Cy5/Cy3 intensities � 2.5 for up-regulated genes and � 0.4 for down-regulatedgenes. Data shown are representative of 6 independent experiments.
*Expression values shown for the gene checked by real-time PCR.
MOLECULAR CHARACTERIZATION OF TAMs 2119BLOOD, 1 MARCH 2006 � VOLUME 107, NUMBER 5
For personal use only.on November 23, 2018. by guest www.bloodjournal.orgFrom

Discussion
The results reported here show that TAMs from a murine sarcomaexpress a unique transcriptional profile. Resting TAMs showedhigher expression of genes coding for immunosuppressive cyto-kines (Il10, Tgfbi), phagocytosis-related receptors/molecules (Msr2and C1q), and inflammatory chemokines (Ccl2 and Ccl5), asexpected, as well as, unexpectedly, IFN-inducible chemokines(Cxcl9, Cxcl10, Cxcl16). Compared with PECs, LPS-mediatedactivation of TAMs resulted in defective expression of severalproinflammatory cytokines (eg, IL-1�, IL-6, TNF-�) and chemo-kines (eg, CCL3) and in the strong up-regulation of immunosuppres-sive cytokines (IL-10, TGF�) and IFN-inducible chemokines(CCL5, CXCL9, CXCL10, and CXCL16). This functional profilewas associated with defective activation of NF-�B and fullactivation of the MyD88-independent IRF-3 and STAT1 pathway.
The isolation procedure may have affected the profile andproperties of TAMs; however, PECs that underwent the same
isolation procedure did not show the same phenotype. Moreover,immunohistology has confirmed in this and other tumors keyfeatures of the TAM phenotype (eg, IL-12low, TNF-�low, CCL2high,CCL5high, CXCL9high, CXCL10high, CXCL16high, Dectin-1high, IL-10high, MGL1high, NOS2low; Figure 3; Kataki et al32 and Kunz etal33). Therefore it is likely that the transcriptome of TAMsdescribed in the present study is representative of cells in situ.
Several lines of evidence suggest that TNF-� and IL-1� canplay a role in tumor progression.34 TAMs have a TNFlow phenotypein this and other studies in murine and human tumors.4 It isimportant to emphasize that TNF-� is generally not discriminatorybetween M1 and M2 macrophages, since at least one form of M2polarization is characterized by a TNFhigh phenotype.2,6
Due to its capability to induce hemorrhagic necrosis and to stimulateantitumor immunity,35 locoregional administration of high doses ofTNF-� is being used for the treatment of patients with locally advancedsolid tumors.36 This therapeutic approach is apparently in contrast withpreclinical findings suggesting that TNF-� may act as endogenoustumor promoter (eg, in ovarian and breast cancers).35 However, low-dose TNF-� was reported to promote the proliferation of somemalignant cell lines.36,37 This evidence suggests a biphasic and dose-dependent effect of TNF-� on tumor progression and indicates that lowTNF-� production by TAMs, as observed in the present and previousstudies,4,32,35 may be optimal to promote tumor growth and metastasis.As the level of TNF-� production by TAMs may vary among tumors ofdifferent origin and different stages, it is likely to represent a determinantfor the “balance” of protumoral versus antitumoral activities expressedby TAMs.
The expression profile of TAMs included genes not previouslyreported in this population. For instance, TAMs expressed Ly6a, e andCD81, which play a role in the interaction of antigen-presenting cellswith T cells and in maintenance of T-helper 2 (Th2) phenotype.38,39
Therefore, these molecules may contribute to skewing the adaptiveimmune response at the tumor site in a Th2 direction.
Figure 6. Expression of M2- and M1-associated molecules by TAMs and MSCs.(A) RNA from untreated and IL-4–treated TAMs or untreated and IL-4–treated MSC-2cells was used for real-time PCR analysis corresponding to the indicated genes. (B)RNA from untreated and LPS-treated TAMs or untreated and LPS-treated MSC-2cells was analyzed by real-time PCR for the mRNA expression of the indicated genes.Results are given as fold increase in mRNA expression with respect to that inuntreated MSC-2 cells. Data were normalized to expression of actin gene andrepresentative of 3 independent experiments done in triplicate.
Figure 5. Divergent regulation of the NF-�B and IRF-3/STAT1 pathway in TAMs.(A) Laser confocal microscopic representation of IRF-3 activation in TAMs. Untreatedor 2-hour LPS–treated (100 ng/mL) PECs and TAMs were stained for IRF-3 (red) orwith SYTO for nuclear counter-staining (green) and visualized by laser confocalmicroscopy. Panels represent IRF-3 staining, nuclear staining, and merge plusphase-contrast images (left to right). (B) STAT1 activation in TAMs. Western blot(WB) for phospho-STAT1 expression. The cell lysates from untreated or LPS-treated(100 ng/mL) PECs and TAMs for the indicated time points were probed first in WBwith phospho-STAT1 antibody and reprobed with STAT1 antibody. Equal loading isvisualized by actin expression. (C) Nuclear translocation of p65 NF-�B subunit.Western blot for p65 NF-�B subunit protein in the nuclear extracts of untreated orLPS-treated PECs and TAMs for the indicated time periods. Bottom panel showscytoplasmic levels of the same. Results are representative of 3 independentexperiments.
2120 BISWAS et al BLOOD, 1 MARCH 2006 � VOLUME 107, NUMBER 5
For personal use only.on November 23, 2018. by guest www.bloodjournal.orgFrom

A prominent set of genes expressed in TAMs were chemokines(Ccl2, Ccl5, Cxcl9, Cxcl10, Cxcl16), a finding confirmed at theprotein level (Figure 2) and by immunohistochemistry (Figure 3).By producing chemokines such as CCL2, TAMs are likely tosustain and amplify tumor-elicited monocyte recruitment. CCL2and CXCL10 have contrasting effects on angiogenesis.40-45 TAMproduction of these chemokines may tune new vessel formationand contribute to the irregular distribution and shape of tumormicrovessels.
When LPS was used, an extensively characterized46-48 activa-tion signal, TAMs showed quantitative and qualitative differencescompared with PECs. The set of LPS-regulated genes was consid-erably smaller in TAMs compared with PECs. Moreover, a set ofproinflammatory genes (chemokine/cytokine genes like Tnfa, Il1b,Ccl3, Ccl6, Ccl9; the oxidative burst-related genes Sod2, Lysz, Mt2;and several other LPS-inducible genes like Slpi, Timp1) wereweakly induced in TAMs compared with PECs, whereas genesrelated to immunosuppression (Il10 and Tgfbi) showed a strongerup-regulation in TAMs versus PECs (Table 2). These resultsconfirm and extend previous observation4,11 and are consistent withthe view that TAMs are part of mechanisms of inhibition anddiversion of specific immunity. LPS was used in the present studyas a classic model of activation stimulus for TAMs. LPS isrecognized by TLR4, which reportedly also interacts with compo-nents present in the tumor microenvironment (eg, hsp and deriva-tives of fibrinogen).18-21 In addition, and perhaps more interest-ingly, there is at present renewed interest for TLR agonists asimmunotherapeutic agents in cancer.49,50 Hence, definition of themicroenvironmental and signaling pathways responsible for thealtered responsiveness of TAMs to TLR4 agonists may be relevantto the design of therapeutic strategies aimed at boosting innate andadaptive immunity against tumors.
Macrophage polarization into M1 and M2 cells provides auseful conceptual framework for the plasticity of mononuclearphagocytes.4 However, different versions of M2 cells have beendescribed and the M1-M2 paradigm should be viewed as anoperationally useful scheme.
The in vitro and in vivo results obtained in the present study, withresting and LPS-activated cells, are generally consistent with the view ofTAMs as a unique and distinct polarized M2 population (IL-12low,TNF-�low, NOS2low, IL-10high, Dectin-1high, MGL1high, TGF-�high, scav-enger receptorhigh), characterized at variance with classic M2 cells byhigh levels of IFN-inducible chemokines. Scavenger receptors aregenerally up-regulated in M2-polarized macrophages. However, unex-pectedly, TAMs showed high levels of CXCL10 and related chemo-kines, identified and characterized as IFN inducible.17
Thus, TAMs represent a unique macrophage population withkey properties of M2 cells, which coexpress IFN-inducible chemo-
kines. Interestingly, under M1- and M2-polarizing conditions (IL-4versus LPS), MSCs also display the capability to express M1- andM2-associated molecules.
Signaling was investigated in an effort to define the molecularbasis for the distinct phenotype of TAMs. NF-�B was notconstitutively activated in TAMs and its activation in response toprototypic stimulus LPS was defective, in agreement with previousobservations.4,11 p65 NF-�B translocation to the nucleus wasdelayed in LPS-stimulated TAMs. This finding, as well as delayedI�B� phosphorylation (data not shown), is reminiscent of thephenotype of MyD88-deficient macrophages.51 In contrast, TAMsshowed appreciable levels of baseline STAT1 phosphorylation and,upon exposure to LPS, prominent IRF-3 translocation and STAT1phosphorylation. Thus, TAMs show a unique dissociation of LPSsignaling, with impaired MyD88-dependent NF-�B activation andfull function of the MyD88-independent IRF-3 pathway. Thismolecular phenotype is consistent with the distinct transcriptionalprofile of LPS-activated TAMs, characterized by low inflammatorycytokine (eg, IL-12, TNF-�) induction as well as constitutive andinducible production of molecules such as CCL2, CCL5, CXCL9,CXCL10, and CXCL16.
Lack of constitutive NF-�B activity and defective NF-�Bactivation in response to LPS in TAMs is consistent with previousresults in mouse and human tumors.4,11 These findings may seem atodds with recent results demonstrating a key role of the NF-�Bpathway in liver and colon carcinogenesis.52,53 In particular,lineage-restricted inactivation of IKK� revealed a nonredundantrole of NF-�B activation in myeloid cells in colon carcinogenesis,53
an observation generally consistent with a protumor function ofinflammatory reactions and TAMs in particular.34,35,54 This appar-ent discrepancy may reflect the different tumor systems investi-gated (spontaneous versus transplanted; carcinoma versus sarco-mas), with differential involvement of different polarizedinflammatory reactions. Alternatively, and more likely, vigorousNF-�B–dependent reactions underlie the overt inflammationthat facilitates the early steps of colon carcinogenesis, butestablished neoplasia is propelled by a smoldering M2-polarizedinflammatory milieu.
Acknowledgments
We are grateful to Prof S. Akira (Research Institute for MicrobialDiseases, University of Osaka, Osaka, Japan) and Prof T. Fujita(Tokyo Metropolitan Institute of Medical Sciences, Tokyo, Japan)for the antibodies against IRF-3 and Dr M. Giannı for help with thephospho-specific antibodies. We thank Dr Pieter G. M. Leenen andDr G. Raes for the kind donation of the anti-MGL1 antibody.
References
1. Gordon S. Alternative activation of macrophages.Nat Rev Immunol. 2003;3:23-35.
2. Mosser DM. The many faces of macrophage acti-vation. J Leukoc Biol. 2003;73:209-212.
3. Goerdt S, Orfanos CE. Other functions, othergenes: alternative activation of antigen-present-ing cells. Immunity. 1999;10:137-142.
4. Mantovani A, Sozzani S, Locati M, Allavena P,Sica A. Macrophage polarization: tumor-associ-ated macrophages as a paradigm for polarizedM2 mononuclear phagocytes. Trends Immunol.2002;23:549-555.
5. Mantovani A, Allavena P, Sica A. Tumour-associ-ated macrophages as a prototypic type II po-
larised phagocyte population: role in tumour pro-gression. Eur J Cancer. 2004;40:1660-1667.
6. Mantovani A, Sica A, Sozzani S, Allavena P, Vec-chi A, Locati M. The chemokine system in diverseforms of macrophage activation and polarization.Trends Immunol. 2004;25:677-686.
7. Conti I, Rollins BJ. CCL2 (monocyte chemoat-tractant protein-1) and cancer. Semin CancerBiol. 2004;14:149-154.
8. Lin EY, Nguyen AV, Russell RG, Pollard JW.Colony-stimulating factor 1 promotes progressionof mammary tumors to malignancy. J Exp Med.2001;193:727-740.
9. Mantovani A. Cancer: inflammation by remotecontrol. Nature. 2005;435:752-753.
10. Pollard JW. Tumour-educated macrophages pro-mote tumour progression and metastasis. NatRev Cancer. 2004;4:71-78.
11. Sica A, Saccani A, Bottazzi B, et al. Autocrine pro-duction of IL-10 mediates defective IL-12 productionand NF-kappa B activation in tumor-associated mac-rophages. J Immunol. 2000;164:762-767.
12. Dinapoli MR, Calderon CL, Lopez DM. The al-tered tumoricidal capacity of macrophages iso-lated from tumor-bearing mice is related to re-duce expression of the inducible nitric oxidesynthase gene. J Exp Med. 1996;183:1323-1329.
13. Bingle L, Brown NJ, Lewis CE. The role of tumour-associated macrophages in tumour progression:
MOLECULAR CHARACTERIZATION OF TAMs 2121BLOOD, 1 MARCH 2006 � VOLUME 107, NUMBER 5
For personal use only.on November 23, 2018. by guest www.bloodjournal.orgFrom
implications for new anticancer therapies. J Pathol.2002;196:254-265.
14. Paik S, Shak S, Tang G, et al. A multigene assayto predict recurrence of tamoxifen-treated, node-negative breast cancer. N Engl J Med. 2004;351:2817-2826.
15. Walter S, Bottazzi B, Govoni D, Colotta F, Man-tovani A. Macrophage infiltration and growth ofsarcoma clones expressing different amounts ofmonocyte chemotactic protein/JE. Int J Cancer.1991;49:431-435.
16. Bronte V, Zanovello P. Regulation of immune re-sponses by L-arginine metabolism. Nat Rev Im-munol. 2005;5:641-654.
17. Akira S, Sato S. Toll-like receptors and their sig-naling mechanisms. Scand J Infect Dis. 2003;35:555-562.
18. Tsan MF, Gao B. Endogenous ligands of Toll-likereceptors. J Leukoc Biol. 2004;76:514-519.
19. Garrido C, Gurbuxani S, Ravagnan L, KroemerG. Heat shock proteins: endogenous modulatorsof apoptotic cell death. Biochem Biophys ResCommun. 2001;286:433-442.
20. Wojtukiewicz MZ, Sierko E, Zacharski LR, Zim-noch L, Kudryk B, Kisiel W. Tissue factor-depen-dent coagulation activation and impaired fibrinoly-sis in situ in gastric cancer. Semin ThrombHemost. 2003;29:291-300.
21. Stessels F, Van den Eynden G, Van der Auwera I,et al. Breast adenocarcinoma liver metastases, incontrast to colorectal cancer liver metastases,display a non-angiogenic growth pattern that pre-serves the stroma and lacks hypoxia. Br J Can-cer. 2004;90:1429-1436.
22. Apolloni E, Bronte V, Mazzoni A, et al. Immortal-ized myeloid suppressor cells trigger apoptosis inantigen activated T lymphocytes. J Immunol.2000;165:6723-6730.
23. National Center for Information Technology, Na-tional Cancer Institute. MADB: Microarray database. http://nciarray.nci.nih.gov. Accessed Octo-ber 15, 2004.
24. National Center for Biotechnology Information.NCBI-GEO: National Center for BiotechnologyInformation–Gene Expression Omnibus. http://www.ncbi.nlm.nih.gov/geo/. Accessed December21, 2004.
25. Sica A, Dorman L, Viggiano V, et al. Interaction ofNF-kappaB and NFAT with the interferon-gammapromoter. J Biol Chem. 1997;272:30412-30420.
26. Raes G, Brys L, Dahal BK, et al. Macrophage ga-lactose-type C-type lectins as novel markers foralternatively activated macrophages elicited byparasitic infections and allergic airway inflamma-tion. J Leukoc Biol. 2005;77:321-327.
27. Willment JA, Lin HH, Reid DM, et al. Dectin-1 ex-pression and function are enhanced on alterna-
tively activated and GM-CSF-treated macro-phages and are negatively regulated by IL-10,dexamethasone, and lipopolysaccharide. J Im-munol. 2003;171:4569-4573.
28. Li Q, Verma IM. NF-kappaB regulation in the im-mune system. Nat Rev Immunol. 2002;2:725-734.
29. Kawai T, Takeuchi O, Fujita T, et al. Lipopolysac-charide stimulates the MyD88-independent path-way and results in activation of IFN-regulatoryfactor 3 and the expression of a subset of lipo-polysaccharide-inducible genes. J Immunol.2001;167:5887-5894.
30. Doyle S, Vaidya S, O’Connell R, et al. IRF-3 me-diates a TLR3/TLR4-specific antiviral gene pro-gram. Immunity. 2002;17:251-263.
31. Shuai K, Liu B. Regulation of JAK-STAT signal-ling in the immune system. Nat Rev Immunol.2003;3:900-911.
32. Kataki A, Scheid P, Piet M, et al. Tumor infiltratinglymphocytes and macrophages have a potentialdual role in lung cancer by supporting both host-defense and tumor progression. J Lab Clin Med.2002;140:320-328.
33. Kunz M, Toksoy A, Goebeler M, Engelhardt E,Brocker E, Gillitzer R. Strong expression of thelymphoattractant C-X-C chemokine Mig is associ-ated with heavy infiltration of T cells in humanmalignant melanoma. J Pathol. 1999;189:552-558.
34. Balkwill F, Mantovani A. Inflammation and cancer:back to Virchow? Lancet. 2001;357:539-545.
35. Balkwill F, Charles KA, Mantovani A. Smolderingand polarized inflammation in the initiation andpromotion of malignant disease. Cancer Cell.2005;7:211-217.
36. Mocellin S, Rossi CR, Pilati P, Nitti D. Tumor ne-crosis factor, cancer and anticancer therapy. Cy-tokine Growth Factor Rev. 2005;16:35-53.
37. Wu S, Boyer CM, Whitaker RS, et al. Tumor ne-crosis factor alpha as an autocrine and paracrinegrowth factor for ovarian cancer: monokine induc-tion of tumor cell proliferation and tumor necrosisfactor alpha expression. Cancer Res. 1993;53:1939-1944.
38. Deng J, Dekruyff RH, Freeman GJ, Umetsu DT,Levy S. Critical role of CD81 in cognate T-B cellinteractions leading to Th2 responses. Int Immu-nol. 2002;14:513-523.
39. Maecker HT. Human CD81 directly enhances Th1and Th2 cell activation, but preferentially inducesproliferation of Th2 cells upon long-term stimula-tion. BMC Immunol. 2003;4:1.
40. Goede V, Brogelli L, Ziche M, Augustin HG. In-duction of inflammatory angiogenesis by mono-cyte chemoattractant protein-1. Int J Cancer.1999;82:765-770.
41. Nakashima E, Mukaida N, Kubota Y, et al. HumanMCAF gene transfer enhances the metastaticcapacity of a mouse cachectic adenocarcinomacell line in vivo. Pharm Res. 1995;12:1598-1604.
42. Torisu H, Ono M, Kiryu H, et al. Macrophage infil-tration correlates with tumor stage and angiogen-esis in human malignant melanoma: possible in-volvement of TNFalpha and IL-1alpha. Int JCancer. 2000;85:182-188.
43. Ueno T, Toi M, Saji H, et al. Significance of mac-rophage chemoattractant protein-1 in macro-phage recruitment, angiogenesis, and survival inhuman breast cancer. Clin Cancer Res. 2000;6:3282-3289.
44. Strieter RM, Polverini PJ, Arenberg DA, KunkelSL. The role of CXC chemokines as regulators ofangiogenesis. Shock. 1995;4:155-160.
45. Strieter RM, Kunkel SL, Arenberg DA, BurdickMD, Polverini PJ. Interferon gamma-inducibleprotein 10 (IP-10), a member of the C-X-C che-mokine family, is an inhibitor of angiogenesis.Biochem Biophys Res Commun. 1995;210:51-57.
46. Gao JJ, Diesl V, Wittmann T, et al. Bacterial LPSand CpG DNA differentially induce gene expres-sion profiles in mouse macrophages. J EndotoxinRes. 2003;9:237-243.
47. Nau GJ, Richmond JF, Schlesinger A, JenningsEG, Lander ES, Young RA. Human macrophageactivation programs induced by bacterial patho-gens. Proc Natl Acad Sci U S A. 2002;99:1503-1508.
48. Boldrick JC, Alizadeh AA, Diehn M, et al. Stereo-typed and specific gene expression programs inhuman innate immune responses to bacteria.Proc Natl Acad Sci U S A. 2002;99:972-977.
49. Zuany-Amorim C, Hastewell J, Walker C. Toll-likereceptors as potential therapeutic targets for mul-tiple diseases. Nat Rev Drug Discov. 2002;1:797-807.
50. Gautier G, Humbert M, Deauvieau F, et al. A typeI interferon autocrine-paracrine loop is involved inTolllike receptor-induced interleukin-12p70 secre-tion by dendritic cells. J Exp Med. 2005;201:1435-1446.
51. Kawai T, Adachi O, Ogawa T, Takeda K, Akira S.Unresponsiveness of MyD88-deficient mice toendotoxin. Immunity. 1999;11:115-122.
52. Pikarsky E, Porat RM, Stein I, et al. NF-kappaBfunctions as a tumour promoter in inflammation-associated cancer. Nature. 2004;431:461-466.
53. Greten FR, Eckmann L, Greten TF, et al. IKKbetalinks inflammation and tumorigenesis in a mousemodel of colitis-associated cancer. Cell. 2004;118:285-296.
54. Coussens LM, Werb Z. Inflammation and cancer.Nature. 2002;420:860-867.
2122 BISWAS et al BLOOD, 1 MARCH 2006 � VOLUME 107, NUMBER 5
For personal use only.on November 23, 2018. by guest www.bloodjournal.orgFrom

November 3, 2005 originally published onlinedoi:10.1182/blood-2005-01-0428
2006 107: 2112-2122
Alberto Mantovani and Antonio SicaBarbara Bottazzi, Andrea Doni, Bronte Vincenzo, Fabio Pasqualini, Luca Vago, Manuela Nebuloni, Subhra K. Biswas, Lisa Gangi, Saki Paul, Tiziana Schioppa, Alessandra Saccani, Marina Sironi, IRF-3/STAT1 activation)
B and enhancedκtumor-associated macrophages (defective NF-A distinct and unique transcriptional program expressed by
http://www.bloodjournal.org/content/107/5/2112.full.htmlUpdated information and services can be found at:
(1930 articles)Signal Transduction (969 articles)Phagocytes
(5640 articles)Immunobiology and Immunotherapy (1086 articles)Gene Expression
(564 articles)Chemokines, Cytokines, and Interleukins Articles on similar topics can be found in the following Blood collections
http://www.bloodjournal.org/site/misc/rights.xhtml#repub_requestsInformation about reproducing this article in parts or in its entirety may be found online at:
http://www.bloodjournal.org/site/misc/rights.xhtml#reprintsInformation about ordering reprints may be found online at:
http://www.bloodjournal.org/site/subscriptions/index.xhtmlInformation about subscriptions and ASH membership may be found online at:
Copyright 2011 by The American Society of Hematology; all rights reserved.of Hematology, 2021 L St, NW, Suite 900, Washington DC 20036.Blood (print ISSN 0006-4971, online ISSN 1528-0020), is published weekly by the American Society
For personal use only.on November 23, 2018. by guest www.bloodjournal.orgFrom