a decade of arts engagement decade of arts engagement: findings from the survey of public...
TRANSCRIPT

a decade of arts engagement:findings from the survey of public participation in the arts, 2002–2012
national endowment for the arts

Front cover photo top: A military family looks at art at the San Antonio Museum of Art during the 2014 Blue Star Museum launch. Photo by JB Lyle/Parish Photography
Front cover photo bottom: Pre-professional ballet students at Ballet Hispanico’s School of Dance. Photo by Paula Lobo, courtesy of Ballet Hispanico

a decade of arts engagement:findings from the survey of public participation in the arts, 2002–2012
NEA Research Report #58 January 2015

January 2015
National Endowment for the Arts 400 7th Street, SW Washington, DC 20506 Telephone: 202-682-5400 arts.gov
Prepared by Bohne Silber, Silber & Associates, and Tim Triplett, The Urban Institute
Produced by the Office of Research & Analysis Sunil Iyengar, Director
Other staff contributors: Ellen Grantham, Bonnie Nichols, Melissa Menzer, and Tamika Shingler. The Office of Research & Analysis also wishes to thank Steven Shewfelt.
Editorial assistance by Rebecca Gross
Designed by Roman/Thayer Design Inc.
Library of Congress Cataloging-in-Publication Data
A Decade of Arts Engagement: Findings from the Survey of Public Participation in the Arts, 2002-2012. pages cm 1. Arts audiences--United States--Statistics. 2. Arts surveys--United States. 3. Arts--United States--Citizen participation--Statistics. I. Silber, Bohne G. II. Triplett, Tim, 1960- III. Iyengar, Sunil, 1973- IV. National Endowment for the Arts. NX220.D43 2015 700.973’09051--dc23 2014044435
202-682-5496 Voice/TTY (a device for individuals who are deaf or hearing-impaired)
Individuals who do not use conventional print materials may contact the Arts Endowment’s Office for AccessAbility at 202-682-5532 to obtain this publication in an alternate format.
This publication is available free of charge in print or PDF format at arts.gov, the website of the National Endowment for the Arts.

Table of Contents
viii Preface x Executive Summary 1 Chapter 1. Visual and Performing Arts Attendance 2 Sample Findings 3 Attendance at “Benchmark” Arts Activities 7 Performing Arts in General 9 Demographic Characteristics of Performing Arts Audiences 17 Visual Arts in General 18 Demographic Characteristics of Visual Art-Goers 19 Inside the SPPA: Asking about Visits to Places with Design or Historic Value 22 Predictors of Benchmark Arts Attendance 23 Attendance at Live Music Performances
25 Chapter 2. Arts Consumption through Electronic Media 26 Sample Findings 27 Watching or Listening to Arts Broadcasts or Recordings via TV/Radio or the
Internet 29 Audience Demographics for Arts Broadcasts or Recordings 32 Visual Arts Programs 32 Literary Programs 32 Books, Short Stories, or Poetry Read Aloud 34 Consuming Art via Internet: Viewing, Listening, or Downloading 35 Using Handheld or Mobile Devices to Watch, Listen to, or Download Art
37 Chapter 3. Creating, Performing, and Sharing Art 38 Sample Findings 39 Performing Art, Alone or with Others 47 Performing, Creating, and Sharing Art via Electronic Media and Other Methods
55 Chapter 4. Participation in Arts Learning Activities 56 Sample Findings 57 Learning for a Lifetime: Participation in the Arts through Classes or Lessons 62 Art Classes or Lessons within the Last 12 Months 63 Learning for a Lifetime: Childhood versus Adulthood, and Formal versus
Informal Instruction 66 Arts Learning Experiences of Children, According to Responding Parents
67 Chapter 5. Reading and Film Attendance 68 Sample Findings 69 Reading Books and/or Literature 76 Movie-Going
79 Chapter 6. Regional Differences in Arts Participation 80 Sample Findings 81 Attendance at Benchmark Arts Events 82 Other Kinds of Arts Attendance 83 Venues Where Americans Enjoy Visual Art, Music, Theater, and Dance 84 Music Listening Preferences 84 Movie-Going, Literary Reading, and Participating in Other Leisure Activities 86 Arts Consumption through Electronic Media 87 Creating, Performing, or Sharing Art 88 Participating in Arts Learning Activities 90 Arts Participation by Metro or Non-Metro Area
93 Survey and Research Methodology 95 Appendix: Sports and Exercise

List of Figures
4 Figure 1-1. Average number of attendances and total attendances for benchmark arts activities: 2002, 2008, and 2012
4 Figure 1-2. Demographic distribution and percentage of U.S. adults attending at least one benchmark activity in the past 12 months: 2012
5 Figure 1-3. Distribution and percentage of U.S. adults attending at least one benchmark activity in the past 12 months, by highest level of educational attainment: 2002, 2008, and 2012
5 Figure 1-4. Distribution and percentage of U.S. adults attending at least one benchmark activity in the past 12 months, by age group: 2002, 2008, and 2012
6 Figure 1-5. Distribution and percentage of U.S. adults attending at least one benchmark activity in the past 12 months, by gender: 2002, 2008, and 2012
6 Figure 1-6. Distribution and percentage of U.S. adults attending at least one benchmark activity in the past 12 months, by race and/or ethnicity: 2002, 2008, and 2012
7 Figure 1-7. Performing arts questions in the 2012 SPPA 7 Figure 1-8. Percentage of U.S. adults attending a performing arts activity at least
once in the past 12 months: 2002, 2008, and 2012 8 Figure 1-9. Average and total number of attendances for performing arts activities:
2002, 2008, and 2012 12 Figure 1-10. Demographic distribution of U.S. adults attending different types of
performing arts events at least once in the past 12 months: 2012 13 Figure 1-11 (part 1). Rates of attendance (based on adults participating at least once
in the past 12 months), by demographic subgroup: 2002 and 2012 14 Figure 1-11 (part 2). Rates of attendance (based on adults participating at least once
in the past 12 months), by demographic subgroup: 2002 and 2012 16 Figure 1-12. Average attendances per attendee in the past 12 months, by
demographic subgroup: 2012 and 2002 17 Figure 1-13. Percentage of U.S. adults attending visual arts activities or events:
2002, 2008, and 2012 17 Figure 1-14. Average number of visits per attendee and millions of visits to art
museums or galleries: 2002, 2008, and 2012 20 Figure 1-15. Demographic distribution of U.S. adults attending different types of
visual arts events at least once in the past 12 months: 2012 21 Figure 1-16. Visual arts rates of attendance (based on adults participating at least
once in past 12 months), by demographic group: 2002 and 2012 22 Figure 1-17. Effects of demographic characteristics on the likelihood of benchmark
arts attendance in the past 12 months: 2002, 2008, and 2012 24 Figure 1-18. Genres of music attended by adults who reported attending any live
music performance in the past 12 months: 2012
27 Figure 2-1. Number and percentage of U.S. adults who used TV/radio or the Internet to watch or listen to an arts broadcast or recording at least once in the past 12 months: 2012
28 Figure 2-2. Number and percentage of U.S. adults who watched or listened to an arts broadcast or recording at least once in the past 12 months via TV/radio or the Internet: 2012
30 Figure 2-3. Demographic distribution of U.S. adults watching or listening to performing arts broadcasts or recordings via TV/radio or the Internet at least once in the past 12 months, by art form: 2012
31 Figure 2-4. Percentage of U.S. adults watching or listening to arts broadcasts or recordings via TV/radio or the Internet at least once in the past 12 months: 2012

List of Figures (continued)
33 Figure 2-5. Percentage and demographic distribution of U.S. adults watching or listening to arts broadcasts or recordings via TV/radio or the Internet at least once in the past 12 months: 2012
34 Figure 2-6. Percentage of U.S. adults who used the Internet to explore the arts in the past 12 months: 2012
36 Figure 2-7. Percentage of U.S. adults who used mobile or handheld devices to explore the arts: 2012
39 Figure 3-1. Percentage of Americans and millions of U.S. adults engaging in the performing arts: 2012
41 Figure 3-2. Demographic distribution of U.S. adults engaging in the performing arts, by activity: 2012
42 Figure 3-3. Percentage of U.S. adults engaging in the performing arts, by activity: 2012 43 Figure 3-4. Percentage of U.S. adults who practiced or performed music of various
types: 2012 45 Figure 3-5. Demographic distribution of U.S. adults who practice or perform art, by
specific art form or activity: 2012 46 Figure 3-6. Percentage of U.S. adults who practice or perform arts, by specific art
form or activity: 2012 47 Figure 3-7. Number and percentage of U.S. adults creating or performing arts at least
once in the past 12 months: 2012 48 Figure 3-8. Demographic distribution of U.S. adults creating or performing arts of
various kinds during the last 12 months: 2012 49 Figure 3-9. Percentage of U.S. adults creating or performing arts during the last
12 months: 2012 50 Figure 3-10. Demographic distribution of U.S. adults using electronic media to create
or perform art in the past 12 months, by art form: 2012 51 Figure 3-11. Percentage of U.S. adults using electronic media to create or perform art
in the past 12 months, by art form: 2012 54 Figure 3-12. Percentage of U.S. adults doing craft arts during the last 12 months: 2012
58 Figure 4-1. Percentage of U.S. adults who took arts lessons or classes during their lifetime, by art form studied: 2002, 2008, and 2012
60 Figure 4-2. Demographic distribution of U.S. adults who took arts classes or lessons at any time in their lives: 2012
61 Figure 4-3. Percentage of U.S. adults who took arts classes or lessons at any time in their lives and percentage who took such classes or lessons within the last 12 months (in parentheses): 2012
62 Figure 4-4. Percentage of U.S. adults who took arts lessons or classes during the past 12 months: 2012
63 Figure 4-5. Percentage of 18- to 24-year-olds who took arts classes or lessons at any time in their lives and percentage who took art classes or lessons within the last 12 months: 2002, 2008, and 2012
63 Figure 4-6. Percentage of U.S. adults who participated in arts learning during their lifetime, by art form studied and by mode of learning: 2012
64 Figure 4-7. Percentage of U.S. adults who participated in arts learning at any time in their lives, by whether such learning occurred in or outside of school: 2012
65 Figure 4-8. Demographic distribution of U.S. adults who experienced arts as a child, by activity: 2012
66 Figure 4-9. Demographic distribution of U.S. adults whose school-age children received arts or music instruction, attended a live arts performance, or visited an art museum or gallery during the last 12 months: 2012

List of Figures (continued)
69 Figure 5-1. Reading activity: 2002, 2008, and 2012 70 Figure 5-2. Demographic distribution and percentage of U.S. adults who read books
and/or literature during the past 12 months: 2012 71 Figure 5-3. Percentage of U.S. adults who read books and/or literature during the
past 12 months, by choice of reading materials: 2012 73 Figure 5-4. Percentage of U.S. adults who read books and/or literature during the
past 12 months: 2002, 2008, and 2012 74 Figure 5-5. Percentage of adults who belong to a book club or reading group: 2012 75 Figure 5-6. Percentage of U.S. adults who read during the past 12 months, by
frequency (number of books read): 2002, 2008, and 2012 76 Figure 5-7. Percentage of U.S. adults who went to a movie: 2002, 2008, and 2012. 76 Figure 5-8. Percentage of U.S. adults who went to a movie, by demographic
characteristics: 2012 77 Figure 5-9. Percentage of U.S. adults who attended a movie, by demographic
characteristics: 2002, 2008, and 2012 78 Figure 5-10. Percentage of adults who attended a film festival: 2012
81 Figure 6-1. Percentage of U.S. adults who attended a benchmark arts activity at least once in the past 12 months, by census region: 2002, 2008, and 2012
82 Figure 6-2. Percentage of U.S. adults who attended benchmark arts events at least once in the past 12 months, by census region and type of event: 2012
83 Figure 6-3. Attendance at other arts activities, shown by census region: 2012 83 Figure 6-4. Percentage of U.S. adults who viewed an art exhibit or attended a music,
theater, or dance performance at least once in the past 12 months, by venue type and census region: 2012
84 Figure 6-5. Percentage of U.S. adults who like individual types of music, by Census region and degree of preference: 2012
85 Figure 6-6. Percentage of U.S. adults who did selected leisure activities at least once in the past 12 months, by census region and type of activity: 2012
86 Figure 6-7. Percentage of U.S. adults who consumed arts through broadcast or recorded media at least once during the past 12 months, by census region: 2012
87 Figure 6-8. Percentage of U.S. adults who created or performed arts at least once, by census region and type of activity: 2012
88 Figure 6-9. Percentage of U.S. adults who have taken arts lessons or classes at some point in their lives, by census region and art form: 2012
91 Figure 6-10. Percentage of U.S. adults who did selected arts and non-arts activities at least once in the past 12 months, by metro or non-metro residency: 2012
92 Figure 6-11. Percentage of U.S. adults who did various arts activities at least once in the past 12 months, by metro or non-metro residency: 2012
95 Figure A-1. Percentage of adults attending an amateur or professional sports event during the last 12 months: 2002, 2008, and 2012.
96 Figure A-2. Demographic characteristics of adults who attended an amateur or professional sports event: 2002, 2008, and 2012
97 Figure A-3. Percentage of U.S. adults who exercised or participated in a sports activity: 2012

List of Charts
xi Chart ES-1. Percentage of adults who participated in the arts, by broad category of participation: 2012
xii Chart ES-2. Percentage of U.S. adults aged 18 to 24 who took arts classes or lessons at any time in their lives, by subject area: 2002–2012
xii Chart ES-3. Proportional change in percentage of U.S. adults who reported taking arts classes or lessons over their entire lifetime, by subject area: 2002–2012
xiii Chart ES-4. Percentage of U.S. adults who participated in arts learning at any time in their lives, by subject area and by whether the learning occurred in classes or lessons, or through other means: 2012
3 Chart 1-1. Percentage of U.S. adults attending a benchmark arts activity at least once in the past 12 months: 1982, 1992, 2002, 2008, and 2012
15 Chart 1-2. Percentage of U.S. adults who attended a performing arts event, by art form and family income level: 2012
28 Chart 2-1. Percentage of U.S. adults who consumed music via TV/radio, the Internet, or both: 2012
28 Chart 2-2. Percentage of U.S. adults who used TV/radio, the Internet, or both, to consume selected types of arts broadcasts, by type: 2012
32 Chart 2-3. Percentage of U.S. adults who used TV/radio, the Internet, or both, to consume selected arts broadcasts or recordings, by highest level of educational attainment: 2012
35 Chart 2-4. Percentage of U.S. adults who consumed art via mobile/handheld device, by art form and age group: 2012
40 Chart 3-1. Percentage of U.S. adults who played a musical instrument and/or did social dancing, by age group: 2012
44 Chart 3-2. Gender differences in practicing/performing art, by specific art form 47 Chart 3-3. Gender differences in creating or performing art 54 Chart 3-4. Gender differences in craft arts
58 Chart 4-1. Percentage change in lifetime arts learning 59 Chart 4-2. Gender differences in lifetime arts learning, by type of class or lesson 64 Chart 4-3. Percentage of arts learning occurring in school versus outside school
69 Chart 5-1. Percentage of U.S. adults who read books and/or literature during the past 12 months, by highest level of educational attainment: 2012
72 Chart 5-2. Percentage of U.S. adult readers who read fiction, nonfiction, or both 77 Chart 5-3. Relationship between movie attendance and age, education, and
family income
88 Chart 6-1. Percentage of Americans who created, performed, shared, or edited or remixed art, by census region and degree of participation: 2012
89 Chart 6-2. Percentage of U.S. adults who took any arts classes or lessons in the last 12 months, by census region: 2012
89 Chart 6-3. Percentage of U.S. adults who took arts classes or lessons as a child or adult by census region: 2012
98 Chart A-1. Percentage of U.S. adults who exercise or participated in a sports activity in the last 12 months, by age, education, and income: 2012

viii • preface
Preface The Survey of Public Participation in the Arts (SPPA) is the nation’s largest, most representative survey of adult patterns of arts participation. It tracks various arts activities that Americans (aged 18 and over) report having done in the course of a year. It also asks questions about adults’ preferences for different kinds of music, and it seeks to understand participation in non-arts leisure events such as sports and exercise, outdoor activities, and civic and social affairs.
Since 1982, when the SPPA first was conducted, the original survey instrument has been revised and enlarged to accommodate questions about new and different forms of arts participation. In 2002, the survey asked, for the first time, questions about filmmaking, photography, and the reading of books not required for work or school. Mention of the Internet debuted on the 2002 questionnaire. And in 2008, Latin or salsa music was added to a roster of performing arts activities one might have attended.
Despite each wave of changes to the survey, several core questions about attendance and reading have remained largely intact since 1982. A subset of the items on attendance—representing a cross-section of the visual and performing arts—are called “benchmark” activities. For years they have been used to generate trend data monitored by the NEA and by many arts and cultural funders, practitioners, and researchers.
In preparing for the 2012 SPPA, the NEA’s Office of Research & Analysis (ORA) sought to respond to frequently raised concerns that the benchmark attendance variables are no longer a suitable proxy for the rich and diverse array of participatory arts activities now taking place. Consequently, questions were added to identify venues where Americans experience live arts, to capture the use of electronic media to create and share art, and to ask about participation in arts learning activities outside classes or lessons.
A 2013 NEA report, How a Nation Engages with Art: Highlights from the Survey of Public Participation in the Arts, gave a “first look” at results from the 2012 survey. It offered topline figures for arts participation in various categories, and made comparisons with data from the previous SPPA year (2008). The present report goes deeper.

2012 survey of public participation in the arts • ix
A Decade of Arts Engagement: Findings from the Survey of Public Participation in the Arts, 2002–2012) takes the measure of Americans’ behaviors toward the arts from 2002 to 2012. There are good reasons to focus the analysis on this time span. Apart from covering roughly the first decade of this century—a period that saw immense geopolitical change, two economic downturns, and swift innovations in digital media—there is a methodological factor. In 2002, the SPPA began to be administered as a supplement to the U.S. Census Bureau’s Current Population Survey (CPS), the nation’s premier source of labor statistics. Particularly in the 2002, 2008, and 2012 SPPAs, every attempt was made to preserve a cohort of questions for which year-over-year comparisons could be made, despite updates to the instrument itself.
Compared with any preceding SPPA, the 2012 survey had a broader range of questions designed to identify arts participation where it existed but might have gone previously unmeasured. Do the diversity and plurality of art forms thereby portrayed give us a sharper understanding of who engages in the arts and how, or is the canvas more cluttered than clear? Readers will decide for themselves. Meanwhile, the NEA’s Office of Research & Analysis has done several things to enhance interpretation of the results:
In tandem with the report’s release, ORA has posted Arts Data Profile #4 to the NEA website. Titled States of Engagement: Arts Participation by U.S. Geography, the resource includes tables and summary statistics about arts participation for selected states and metro areas, where the SPPA data allow.
• ORA has awarded prizes to two winning entries to “artfully present” the SPPA results through data visualization apps. Those winners’ work can be viewed here: http://arts.gov/publications/highlights-from-2012-sppa.
• On June 2–3, ORA collaborated with the UK’s Arts & Humanities Research Council’s Cultural Value Project to convene a research symposium at the Gallup headquarters in Washington, DC. Titled “Measuring Cultural Engagement amid Confounding Variables: A Reality Check,” the symposium has yielded a report replete with ideas about how to improve data collection and reporting about arts participation. The report can be viewed here: http://arts.gov/publications/measuring-cultural-engagement-quest-new-terms-tools-and-techniques.
• ORA also has published a report analyzing data from the 2012 General Social Survey, which included a NEA-designed module to identify motivations and barriers in arts attendance. Go here to view the report: http://arts.gov/publications/when-going-gets-tough-barriers-and-motivations-affecting-arts-attendance. An accompanying Arts Data Profile feature on the NEA website (http://arts.gov/artistic-fields/research-analysis/data-profiles/issue-4) offers insights on factors important to people who voice an interest in attending arts events but who refrain from going.
• In 2015, the NEA will report findings from a “short-form” questionnaire on arts participation, conducted with the U.S. Census Bureau in 2013 and 2014. The goal is to collect biennial benchmarking data on this topic—an opportunity not permitted by the relatively infrequent SPPA.
Metrics for arts participation have come a long way since 1982, the first year of the SPPA. The executive summary of this report goes so far as to propose new indices to rival the “benchmark attendance” numbers, a possibility enabled by the larger scope of activities now reported on the survey. If the implication is that our constructs for both the arts and for engagement are mutating before our eyes, then perhaps this condition is worthy of the complex, chimerical pursuit that such a survey represents.
Sunil Iyengar Director, Office of Research & Analysis National Endowment for the Arts January 2015

x • executive summary
Executive Summary Slightly over half of all American adults attended a live visual or performing arts activity in 2012, according to data from the National Endowment for the Arts’ Survey of Public Participation in the Arts (SPPA). Since 2002, adult attendance rates have declined for a core set of arts activities tracked consistently by the NEA. Thirty-three percent of adults attended one of those selected activities in 2012, compared with 39 percent a decade earlier. The declines were steepest for non-Hispanic whites, adults from 35 to 54 years of age, and higher educated adults (those with at least “some” college education).
The overall drop in arts attendance from 2008 to 2012 was less severe than from 2002 to 2008. Both African Americans and Hispanics, for example, showed no declines from 2008 to 2012. Older Americans emerge as the only demographic group to have experienced increases in attending live visual and performing arts activities over the last decade.
The 2012 survey included many new questions on how Americans engage with art. Responses to these questions suggest that attendance at one of the several types of arts events historically captured by the SPPA (the so-called “benchmark” arts: jazz, classical music, opera, musical and non-musical plays, ballet, and visits to an art museum or gallery) is not a comprehensive indicator of arts participation, though it serves as a useful metric for arts attendance generally.
Indeed, many other measures of arts participation in 2012 exceeded the 33 percent of adults who attended a benchmark arts event. For instance, 71 percent of Americans used electronic media to watch or listen to art; 44 percent created, practiced, performed, edited, or remixed art; and 51 percent attended a live visual or performing arts event (both benchmark and non-benchmark activities).
Based on the 2012 SPPA, some new indices of arts participation are given (see Chart ES-1), along with their component definitions. As distinct markers of arts participation, the indices are imperfect. (For example, a person responding that he or she had attended a jazz music performance in the previous year may have been recollecting attendance at an outdoor performing arts festival. In that case, the respective figures for jazz attendance and arts festival attendance will overlap.) Still, these aggregated estimates give a sense of the considerable volume of U.S. adult participants, by broad category of arts activity. All activities reported in the indices occurred over a 12-month period ending in July 2012.

2012 survey of public participation in the arts • xi
• Attend any live visual or performing arts—Includes the NEA benchmark arts activities, which are attendance at jazz, classical music, opera, musical, play, or ballet performances (excluding elementary or high school performances), and visits to art museums or galleries. In addition, covers attendance at any of the other activities referenced in the “core” section of the SPPA. Those activities include attendance at Latin, Spanish, or salsa music performances; at live dance performances other than ballet; and at types of live music or theater performance not listed above. Also includes attendance at outdoor performing arts festivals, visual arts festivals or craft fairs, and visits to parks, monuments, buildings, or neighborhoods for historic or design purposes.
• Create, practice, perform, or edit/remix art—Creating, editing, or remixing music, dance, or films or videos; editing photos taken for artistic purposes; creating visual art (e.g., painting, sculpture, or graphic design); creating scrapbooks; doing creative writing; creating pottery, ceramics, or jewelry; creating leatherwork, metalwork, or woodwork; doing weaving, crocheting, quilting, needlepoint, knitting, or sewing; practicing or performing acting, dancing, or singing, or playing a musical instrument.
• Use electronic media to view or listen to art—Using TV, radio, the Internet or any other electronic media to watch or listen to jazz; Latin, Spanish, or salsa music; classical music; opera; other music (such as rock, pop, country, folk, rap, or hip-hop); theater productions (such as musical or non-musical plays); ballet or modern or contemporary dance; other dance programs or shows; programs or information about the visual arts (such as paintings, sculpture, graphic design, or photography); programs or information about books or writers; books, short stories, or poetry read aloud. Also includes using a DVD or CD or record- or tape-player to watch or listen to theater, dance, visual arts, or literature.
• Use electronic media to e-mail, post, or share art—Using a computer, a handheld device or mobile device, or the Internet to e-mail, post, or share music, dance, films or videos, photography, scrapbooks, writing, or visual artworks such as painting, sculpture, or graphic design.
• Read books or literature—Reading novels or short stories, poetry, or plays, or reading books not required for work or school.
• Go to the movies—Attending a movie or film festival.
Chart ES-1. Percentage of adults who participated in the arts, by broad category of participation: 2012
0% 25% 50% 75%
Create, practice, perform, or
edit/remix art
Use electronic media to e-mail, post, or share art
Attend any live visual or
performing arts
Read books or literature
Go to the movies
Use electronic media to view or listen to art
71.4%
59.4%
58.2%
51.0%
44.2%
43.3%
Movie attendance is as popular today as it was a decade ago, with 60 percent of adults going in 2002 and 2012. African Americans and older adults (aged 55 and over) have even increased their movie-going rates. Book-reading (outside work or school) has dipped from 2002 levels (from 57 percent to 55 percent). Literary reading has held flat (at 47 percent of adults in 2002 and 2012). Within that category, poetry-reading has seen a sharp decline (from 12 percent to 7 percent over the decade).
Revisions made to the 2012 survey instrument allowed for greater insight into arts participation beyond visual and performing arts attendance, reading, and going to the movies. Some of the most revealing findings address how young adults (18- to 24-year-olds) express art. For example, they were more likely than adults in general to report having done social dancing (42 percent versus 32 percent), an activity also more popular with Hispanic adults. Further, young adults were more likely than adults in general to create, practice, perform, edit, or remix art (48 percent versus 43 percent) and to use electronic media to view, listen to, create, share, or edit art (80 percent versus 71 percent).

xii • executive summary
Technology appears as a great enabler of arts creation among certain subgroups, and not just young adults. For example, the African Americans and Hispanics who created music in 2012 were far more likely than whites (48 percent versus 25 percent) to have used electronic media in the process. For that matter, in virtually every demographic subgroup (whether by race/ethnicity, age, gender, and education or income status), a large proportion of adults who created visual art in 2012 did so via electronic media.
The percentage of 18- to 24-year-olds who have taken art classes or lessons at any time in their lives increased significantly from 2002 to 2012 (see Chart ES-2). For certain art subjects, a greater share of all adults now report ever having taken classes or lessons. (Examples include instruction in creative writing, acting or theater, visual arts, and music.) As Chart ES-3 shows, the percentage of Americans ever having taken music appreciation, art appreciation, or art history classes has fallen over the past ten years.
In 2012, more than half of all adults were exposed to the arts as a child, either through visiting an art museum or gallery or attending a live music, theater, or dance performance. (Because these questions were not asked in prior survey years, there is no basis for trend comparison.) Nearly half the nation’s adults (46 percent) received some type of arts education as a child. As shown in Chart ES-4, most arts learning occurred in school, although some art forms, particularly music and dance, were learned through means other than formal classes or lessons.
Chart ES-2. Percentage of U.S. adults aged 18 to 24 who took arts classes or lessons at any time in their lives, by subject area: 2002–2012
0%
10%
20%
30%
40%
50%
Music appreciation
Art appreciation
Creative writing
Acting or theater
Visual arts
Music
36.6%
42.9%
21.9%
26.9%
11.0%10.6%
23.6%22.6%
16.1%17.9%
18.7%16.9%
2002 2012
Chart ES-3. Proportional change in percentage of U.S. adults who reported taking arts classes or lessons over their entire lifetime, by subject area: 2002–2012
-20% -10% 0% 10% 20%
Music
Visual arts
Acting or theater
Creative writing
Art appreciation or art history
Music appreciation
17.6%
-4.0%
1.4%
17.0%
5.0%
-16.7%

2012 survey of public participation in the arts • xiii
Chart ES-4. Percentage of U.S. adults who participated in arts learning at any time in their lives, by subject area and by whether the learning occurred in classes or lessons, or through other means: 2012
0%
5%
10%
15%
20%
25%
30%
Music appreciationArt appreciationCreative writingDancePhotography or filmActing or theaterVisual artsMusic
28.1%
19.8%
18.3%
15.5%
10.3%
6.3%
2.3%
4.2%
7.3%
3.8%
13.2%
7.5%
10.3%
16.0%
14.7%
2.9%
7.3%
17.1%
2.5%
10.7%
12.9%
2.8%
11.4%
8.7%
Classes/lessons in school Classes/lessons outside school Learned through other means
This report also provides (in Chapter 6) an account of U.S. regional patterns for consuming and creating art. Across the board, regional rates of attendance for selected arts activities (the “benchmark” arts events) were much lower in 2012 than 2002. For all regions except New England, a decline was observed from 2002 to 2008 that continued in 2012.
New England, Pacific, and Mountain region residents showed consistently higher attendance rates at benchmark arts events than did residents of other regions. Literary reading rates were highest in the Mountain and New England regions and lowest in the East and West South Central regions.
Regarding non-art activities, New England residents were more likely than other Americans to exercise or play sports, and West South Central residents were the least likely. Mountain, West North Central, and Pacific region residents were more likely to do other outdoor activities such as hiking, camping, or canoeing.
Attending musicals was highest in the West North Central regions, followed by the Mid-Atlantic. Going to outdoor performing arts festivals was most common in the Pacific and East North Central regions. West North Central region residents were more likely to attend art activities in schools, churches, or other religious venues. Art-making with leather, metal, or wood was most common in the West North Central and East South Central regions. Weaving, crocheting, quilting, needlepoint, knitting, or sewing were most common in the New England, West North Central, and Mountain regions.
Chapter 1. Visual and Performing Arts Attendance
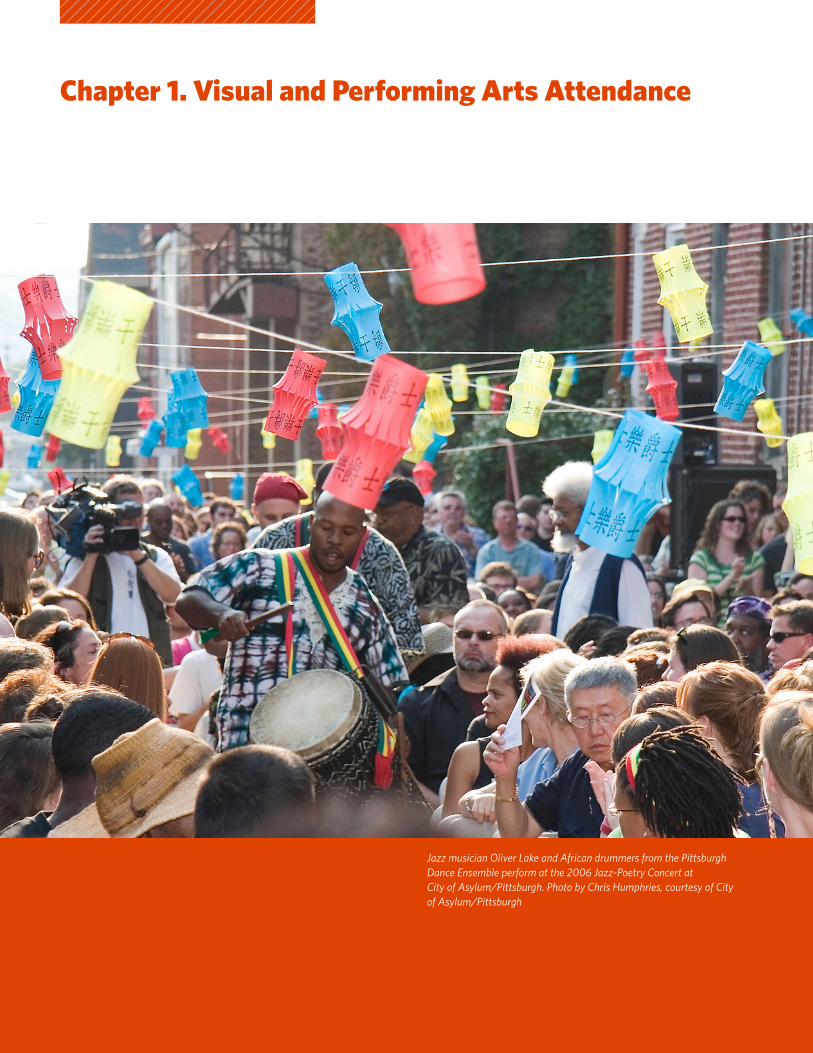
Jazz musician Oliver Lake and African drummers from the Pittsburgh Dance Ensemble perform at the 2006 Jazz-Poetry Concert at City of Asylum/Pittsburgh. Photo by Chris Humphries, courtesy of City of Asylum/Pittsburgh

2012 survey of public participation in the arts • 2
Sample Findings
• Following a sharp decline in overall arts attendance that occurred from 2002 to 2008, participation rates held steady from 2008 to 2012 for the following types of performance arts event:
Jazz; Classical music; Opera; Latin/Spanish or salsa music; Outdoor performing arts festivals1;Ballet; and Other dance.
• Dance other than ballet is the only performing arts activity for which U.S. adult attendance rates did not fall between 2002 and 2012.2
• Attendance at non-musical plays declined from 2002 to 2012, while attendance rates at musical plays slipped from 2008 to 2012 only.
• Changes in U.S. demographic composition appear to have contributed to the overall declines in performing arts attendance. Still, various subgroups of Americans have maintained or increased attendance rates for individual art forms.
• Older adults are the only demographic subgroup to show an increase in performing arts attendance over a decade ago. Their rates of attendance at classical music, opera, musicals, and non-musicals were significantly higher in 2012 than in 2002.
1 Questions about Latin/Spanish/salsa music and outdoor performing arts festivals
were not asked in the 2002 SPPA.
2 See previous footnote.
• With the exception of modestly declining attendance at jazz performances, the rate at which African Americans attend the performing arts has not declined since 2002. Most other racial and/or ethnic groups, by contrast, have seen a drop in attendance from 2002 to 2012.
• Non-white racial/ethnic groups other than Hispanic, such as Asians and African Americans, have increased attendance at non-ballet dance performances.
• Visual arts attendance has declined significantly since 2002 for the following activities:
• Visits to art museums or galleries; and
• Tours of parks, monuments, buildings, or neighborhoods for “historic” or “design” purposes.
• These ten-year declines were experienced by all demographic subgroups, with one exception: the nation’s oldest Americans (age 75 and over) were more likely to attend visual arts activities than a decade ago.

3 • chapter 1. visual and performing arts attendance
The first section of the Survey of Public Participation in the Arts examines attendance at performing arts events (such as music, dance, or theater performances, or outdoor performing arts festivals) and at visual arts events or activities (such as art museums or galleries, craft fairs, and sites with historic or design value). For each type of arts activity, the present report tallies the number and share of U.S. adults who attended in the last 12 months, as well as how many times they attended. Where possible, the average number of “attendances” per arts event is also reported. This chapter does not consider any geographic differences—those comparisons are reported in Chapter 6.
Attendance at “Benchmark” Arts Activities
Since 1982, the SPPA has tracked adult attendance at jazz events, classical music performances, opera, musical plays, non-musical plays, ballet, and art museums or galleries. These activities are called “benchmark” because participation in them has been tracked since 1982, not because of any differential significance or value to the arts.
If a survey respondent reported going to any of these types of events during the 12 months ending in July 2012, the adult was counted as an attendee of a benchmark arts activity. Attendance at elementary or high school performances was not counted.
Percentage of U.S. adults going to a benchmark activity. The proportion of Americans who attended at least one of the seven types of benchmark activity has gradually fallen over the last ten-year period. Chart 1-1 shows that the rate dropped from 39 percent in 2002 to 35 percent in 2008, and even further, to 33 percent, in 2012.
Chart 1-1. Percentage of U.S. adults attending a benchmark arts activity at least once in the past 12 months: 1982, 1992, 2002, 2008, and 2012
0% 20% 40% 60%
2012
2008
2002
1992
1982 39.0%
41.0%
39.4%
34.6%
33.4%

2012 survey of public participation in the arts • 4
Attendances. The 2002 SPPA counted a total of 497 million attendances by adults for benchmark activities, which fell by nearly 20 percent to 408 million attendances, in 2008 and by another 9 percent, to 373 million, in 2012 (Figure 1-1). The average number of attendances per attendee declined from 2002 to 2008 but stabilized from 2008 to 2012.
Figure 1-1. Average number of attendances and total attendances for benchmark arts activities: 2002, 2008, and 2012
Benchmark arts
activities
Average number of attendances per attendee
Total number of attendances in millions
2002 2008 2012 2002 2008 2012
6.1 5.2 4.8 497.0 408.1 373.4
Gray shaded box indicates that the estimate is significantly different than the 2012 estimate at the .05 level
Demographic shifts in attendance. The SPPA includes information on gender, age, education, family income, race/ethnicity, and the geographical region of attendees (reported in Chapter 6). The fourth column in Figure 1-2 shows that 56 percent of the people who attended at least one benchmark activity in 2012 are women, and the final column shows the percentage of people in that demographic group who attended at least one benchmark activity in 2012—for example, 30 percent of men and 36 percent of women. Non-Hispanic whites are the racial/ethnic group most likely to have attended a benchmark activity. The likelihood of attending a benchmark activity increases with education level and family income. People with a graduate degree are three times more likely than high school graduates to attend a benchmark activity. Among people in the highest family-income category, 62 percent went to at least one benchmark activity, compared with 16 percent of adults from the lowest-income families.
Figure 1-2. Demographic distribution and percentage of U.S. adults attending at least one benchmark activity in the past 12 months: 2012
2012 U.S. population Any benchmark arts activity
Millions Percent Distribution of
attendees
Rate of attendance
all adults 235.0 100.0% 33.4%
Gender
Male 113.1 48.1% 43.9% 30.4%
Female 121.9 51.9% 56.1% 36.1%
Total 235.0 100.0% 100.0%
Race/ethnicity
Hispanic 35.0 14.9% 9.4% 21.1%
White 155.7 66.3% 75.4% 37.9%
African American 26.8 11.4% 8.5% 25.0%
Other 17.5 7.4% 6.6% 29.8%
Total 235.0 100.0% 100.0%
Age
18–24 30.4 13.0% 11.7% 30.2%
25–34 41.0 17.4% 17.1% 32.6%
35–44 39.6 16.9% 16.3% 32.4%
45–54 43.7 18.6% 19.2% 34.4%
55–64 38.3 16.3% 18.6% 38.0%
65–74 23.8 10.1% 11.1% 36.6%
75+ 18.1 7.7% 6.0% 25.9%
Total 235.0 100.0% 100.0%
Highest level of education
Grade school 9.9 4.2% 0.8% 6.5%
Some high school 19.0 8.1% 2.2% 9.1%
High school graduate
70.9 30.2% 18.0% 19.9%
Some college 68.7 29.2% 29.6% 33.8%
College graduate 43.0 18.3% 29.7% 54.0%
Graduate school 23.5 10.0% 19.7% 65.6%
Total 235.0 100.0% 100.0%
Family income
Less than $20K 40.9 17.4% 8.5% 16.3%
$20K to $50K 76.0 32.3% 24.1% 24.9%
$50K to $75K 43.9 18.7% 20.4% 36.4%
$75K to $100K 27.6 11.7% 14.8% 41.5%
$100K to $150K 27.1 11.5% 16.9% 48.8%
$150K and over 19.6 8.3% 15.4% 62.3%
Total 235.0 100.0% 100.0%
Gray shaded box indicates that the estimate is significantly different from the overall 2012 estimate at the .05 level

5 • chapter 1. visual and performing arts attendance
Attendance at benchmark activities, by level of educational attainment: 2002–2012. A key finding from the 2012 SPPA, as well as from prior years, is how closely attendance correlates with years of formal education—people with higher levels of education are more likely to attend the types of arts examined in the SPPA than people with less education. In 2012, 66 percent of people with graduate degrees attended at least one benchmark activity, compared with only 34 percent of people with some college education and 20 percent of people with
only a high school diploma. Figure 1-3 shows the educational level of adults who went to at least one benchmark activity in 2012, compared with rates found in the 2002 and 2008 SPPAs. The decline in participation between 2002 and 2008 and between 2008 and 2012 occurs across most educational levels. Between 2008 and 2012, participation rates stayed the same among high school graduates and individuals with a grade school education.
Figure 1-3. Distribution and percentage of U.S. adults attending at least one benchmark activity in the past 12 months, by highest level of educational attainment: 2002, 2008, and 2012
2002 2008 2012
Distribution of attendees
Rate of attendance Distribution of attendees
Rate of attendance Distribution of attendees
Rate of attendance
Grade school 1.1% 7.3% 0.9% 6.5% 0.8% 6.5%
Some high school 3.4% 13.6% 4.1% 14.5% 2.2% 9.1%
High school graduate 19.5% 24.8% 16.7% 19.0% 18.0% 19.9%
Some college 31.4% 44.8% 30.1% 38.1% 29.6% 33.8%
College graduate 28.5% 64.1% 30.4% 57.2% 29.7% 54.0%
Graduate school 16.2% 75.8% 17.8% 67.3% 19.7% 65.6%
Total 100.0% 100.0% 100.0%
Gray shaded box indicates that the estimate is significantly different from the 2012 estimate at the .05 level
Attendance at benchmark activities, by age: 2002–2012. Each SPPA, including the 2012 study, shows that participation in the arts tends to increase with age—up to a point. At 38 percent, the highest participation rate in 2012 was among people ages 55–64. From there the rates decline, modestly at first and then dropping substantially
for the very oldest Americans. An important observation, however, is that the oldest Americans (age 75 and over) make up the only age group whose 2012 participation rates were higher than in 2002 and 2008. In fact, for all age groups except adults 65 and older, 2012 participation rates were markedly lower than 2002 rates (Figure 1-4).
Figure 1-4. Distribution and percentage of U.S. adults attending at least one benchmark activity in the past 12 months, by age group: 2002, 2008, and 2012
2002 2008 2012
Age Distribution of attendees
Rate of attendance Distribution of attendees
Rate of attendance Distribution of attendees
Rate of attendance
18–24 11.8% 35.9% 12.1% 32.7% 11.7% 30.2%
25–34 18.0% 39.6% 18.5% 36.0% 17.1% 32.6%
35–44 23.0% 42.2% 20.0% 37.2% 16.3% 32.4%
45–54 22.1% 46.0% 20.4% 36.1% 19.2% 34.4%
55–64 13.0% 40.6% 15.8% 36.9% 18.6% 38.0%
65–74 7.7% 35.3% 8.5% 33.4% 11.1% 36.6%
75+ 4.4% 23.2% 4.7% 21.3% 6.0% 25.9%
Gray shaded box indicates that the estimate is significantly different from the 2012 estimate at the .05 level

2012 survey of public participation in the arts • 6
Attendance at benchmark activities by gender: 2002–2012. Women attend benchmark activities at higher rates than men, a pattern that has held since 2002 (Figure 1-5). Men saw declining attendance rates in both 2008 and 2012, while women’s attendance dropped only in 2008.
Figure 1-5. Distribution and percentage of U.S. adults attending at least one benchmark activity in the past 12 months, by gender: 2002, 2008, and 2012
2002 2008 2012
Gender Distribution of attendees
Rate of attendance Distribution of attendees
Rate of attendance Distribution of attendees
Rate of attendance
Male 44.2% 36.4% 45.0% 32.3% 43.9% 30.4%
Female 55.8% 42.2% 55.0 % 36.8% 56.1% 36.1%
Total 100.0% 100.0% 100.0%
Gray shaded box indicates that the estimate is significantly different from the 2012 estimate at the .05 level
Non-Hispanic white adults are the racial/ethnic group most likely to attend a benchmark activity, a consistent finding over the past decade (Figure 1-6). This group saw statistically significant declines in attendance in 2008 and 2012. By contrast, African Americans, Hispanics, and groups of other races/ethnicities had the same levels of attendance in 2012 as in 2008, though still below 2002 levels.
Figure 1-6. Distribution and percentage of U.S. adults attending at least one benchmark activity in the past 12 months, by race and/or ethnicity: 2002, 2008, and 2012
2002 2008 2012
Race and ethnicity Distribution of attendees
Rate of attendance Distribution of attendees
Rate of attendance Distribution of attendees
Rate of attendance
Hispanic 6.5% 23.1% 8.2% 21.0% 9.4% 21.1%
White 80.5% 43.6% 78.9% 39.7% 75.4% 37.9%
African American 8.1% 27.8% 7.0% 21.5% 8.5% 25.0%
Other 4.9% 41.8% 5.9% 31.9% 6.6% 29.8%
Total 100.0% 100.0% 100.0%
Gray shaded box indicates that the estimate is significantly different from the 2012 estimate at the .05 level

7 • chapter 1. visual and performing arts attendance
Performing Arts in General
The 2012 SPPA tracked attendance at the types of performing arts events shown in Figure 1-7.
Figure 1-7. Performing arts questions in the 2012 SPPA
Originating year for survey question
Jazz 1982
Classical music 1982
Opera 1982
Musical plays 1982
Non-musical plays 1982
Ballet 1982
Dance other than ballet, such as modern, contemporary, tap, folk, and traditional
1992
Latin, Spanish, or salsa music 2008
Outdoor performing artists festivals 2008
Other music, theater, or dance 2012
Free music, theater, or dance 2012
Note. The shaded art forms, along with visits to art museums and galleries, are the “benchmark” arts attendance activities that the NEA has tracked since 1982.
People attending the performing arts. As shown in Figure 1-8, the percentages of adults attending jazz, classical music, opera, musical plays, non-musical plays, or ballet declined between 2002 and 2008 and then stabilized between 2008 and 2012. Non-ballet dance is the only performing arts activity that did not drop off between 2002 and 2012.
Of all the performing arts activities asked about in the 2012 SPPA, outdoor festivals featuring performing artists were the most commonly reported. Twenty-one percent of American adults reported going to an outdoor festival in 2012, the same share as in 2008, the year the SPPA began asking about this item.
Figure 1-8. Percentage of U.S. adults attending a performing arts activity at least once in the past 12 months: 2002, 2008, and 2012
Percent of U.S. adults attending
Performing arts event3 2002 2008 2012
Music
Jazz 10.8% 7.8% 8.1%
Classical music 11.6% 9.3% 8.8%
Opera 3.2% 2.1% 2.1%
Latin music Not asked 4.9% 5.1%
Outdoor performing arts festival
Not asked 20.8% 20.8%
Plays
Musical plays 17.1% 16.7% 15.2%
Non-musical plays 12.3% 9.4% 8.3%
Dance
Ballet 3.9% 2.9% 2.7%
Other dance 6.3% 5.2% 5.6%
Other types of live performance
Free music, theater, or dance of any kind
Not asked Not asked 15.9%
Other music, theater, or dance attendance not referenced in the main survey
Not asked Not asked 11.6%
Attendance at live book readings, poetry, or storytelling events, excluding elementary and high school performances
Not asked Not asked 4.1%
3 For the survey questions about music, dance, and plays, elementary and high
school performances were not included among possible responses.

2012 survey of public participation in the arts • 8
Number of performing arts attendances. Most arts organizations track attendance trends based on total tickets sold, admissions, or other measures of the total number of “attendances” at an arts event. Because the NEA’s survey respondents are asked to recall how many times they went to a specific activity in the previous 12 months, the SPPA enables reporting of total attendances by art form (excluding attendances at elementary or high school performances).
Figure 1-9 shows the average number of attendances per adult for each performing arts activity. For instance, in 2012 adults attended an average of 2.8 jazz events. The average number of jazz performances, classical music concerts, and musical plays attended per person declined from 2002 to 2008 but stayed the same from 2008 to 2012 (the slight differences observed in the table are not statistically relevant). Meanwhile, the average number of attendances at operas, non-musical plays, ballet performances, and other dance performances has stayed the same since 2002. In 2012, adults attended significantly fewer Latin, Spanish, or salsa music performances than they did in 2008.
Figure 1-9 also shows the total number of attendances for each performing arts activity. In 2012, there were more attendances at musical plays—72.5 million—than at any other type of performing arts studied in the SPPA. While the total number of attendances at musical plays increased from 2002 to 2008, total attendances declined from 2008 to 2012, a drop of ten million. As noted above, however, the average number of attendances per adult was statistically the same from 2008 to 2012. This means that fewer people attended musicals in 2012, but, of those who attended, they saw on average the same number of musicals as in 2008.
The total number of attendances at Latin, Spanish, or salsa music events, classical music concerts, and non-musical plays also saw substantial declines, although the average number of attendances per attendee was relatively unchanged. Several performing arts activities—jazz music, non-ballet dance forms, and opera—saw an increase in total number of attendances from 2008 to 2012, as shown in Figure 1-9.
Figure 1-9. Average and total number of attendances for performing arts activities: 2002, 2008, and 2012
Average number of attendances per attendee
Total number of attendances in millions
2002 2008 2012 2002 2008 2012
Music
Jazz 3.1 2.9 2.8 68.8 50.7 53.7
Classical music 3.1 2.9 2.6 72.8 60.4 53.1
Opera 2.0 1.8 2.0 13.3 8.8 10.0
Latin, Spanish, or salsa music
NA 3.5 2.4 NA 38.7 28.8
Plays
Musical plays 2.3 2.2 2.0 79.3 82.6 72.5
Non-musical plays 2.3 2.3 2.2 58.7 49.7 42.1
Dance
Ballet 1.7 1.6 1.5 13.5 10.6 9.6
Other 2.0 2.2 2.1 24.6 25.5 27.3
Gray shaded box indicates that the estimate is significantly different from the 2012 estimate at the .05 level
Summary of changes over time in performing arts attendanceJazz. Attendance at jazz events declined from 2002 to 2008 but stayed the same from 2008 to 2012 (Figure 1-8). In 2008, about 7.8 percent of all adults attended at least one jazz event; in 2012 the rate was 8.1 percent, but the difference is not statistically significant. In 2012, adults who attended a jazz performance went to an average of 2.8 events (Figure 1-9). This is lower than in 2002 but the same as in 2008.
Classical music. The SPPA defines classical music as symphony, chamber, or choral music. Like jazz, attendance at classical music events declined from 2002 to 2008, but stayed the same from 2008 to 2012 (Figure 1-8). About 9 percent of adults attended a performance in each of those years, averaging 2.6 events per attendee in 2012, and a comparable 2.9 events in 2008. Both are lower than the 3.1 events per person reported in 2002.
Opera. Two percent of Americans attended the opera at least once in 2012, the same rate as in 2008. In 2002, the rate was 3 percent—a statistically significant difference. However, the average number of opera events attended per person has not changed from 2002, when each opera-goer went to roughly 2 performances.

9 • chapter 1. visual and performing arts attendance
Latin, Spanish, or salsa music. The 2002 SPPA did not ask specifically about attendance at Latin, Spanish, or salsa music activities, but in 2008 and 2012 about 5 percent of American adults attended a Latin, Spanish, or salsa music performance. As noted, Americans attended significantly fewer Latin, Spanish, or salsa music performances per person in 2012 than in 2008 (Figure 1-9).
Outdoor performing arts festival. Twenty-one percent of adults attended at least one performing arts festival in 2012, the same rate of attendance as in 2008. Outdoor arts festivals were not asked about in the 2002 SPPA, so comparison data are not available. The 2008 and 2012 SPPAs did not ask about the number of festivals attended.
Musical and non-musical plays. Americans are nearly twice as likely to attend a musical play as a non-musical play. About 15 percent attended a musical play in 2012, a statistically significant decrease compared with about 17 percent in both 2002 and 2008. On average, musical play-goers in 2012 attended two musicals per year.
In 2002, about 12 percent of American adults went to a non-musical play; in 2008 this dropped to 9 percent, and in 2012 to 8 percent (a statistically significant decrease). However, the average number of non-musical plays attended per person (2) has not changed since 2002 (Figure 1-9).
Dance. Ten years ago, about 4 percent of Americans attended a ballet, which dropped to 3 percent in 2008 and 2012. Yet the average number of ballets attended per person (1.5 performances) has not changed since 2002.
The percent of adults going to non-ballet dance performances in 2012 (about 6 percent) has not changed over the past decade, nor has the average number of dance performances attended per person (two events a year).
Demographic Characteristics of Performing Arts Audiences
The following figures show demographic characteristics of performing arts audiences in slightly different ways.
• Figure 1-10 presents the demographic distribution of people who attend different types of arts activities. Each attendee is counted once in the data.
• Figure 1-11 shows the rate of attendance for different demographic subgroups in 2002 and 2012, based on individuals who attended an activity at least once in the 12-month SPPA period. (For some types of performing arts, only 2008 and 2012 data are available.)
• Figure 1-12 shows the average number of attendances per attendee across demographic subgroups.
Across demographic subgroups, most rates of attendance are lower in 2012 than in 2002—not a surprising finding, as overall attendance rates are lower in 2012 than a decade ago. However, this trend has some notable exceptions. Apart from showing modest declines in jazz attendance, the rate at which African Americans go to performing arts events has not changed since 2002, whereas most other racial and/or ethnic groups have seen a drop-off in attendance. Older Americans are the only demographic group to show an increase in attendance over a decade ago. Their rates of attendance at classical music, opera, musicals, and non-musicals were significantly higher in 2012 than in 2002.
The following paragraphs discuss rates of attendance at performing arts activities for demographic subgroups from 2002 to 2012.
Jazz. In 2002, men and women attended jazz performances at equal rates, whereas in 2012 women were slightly more likely than men to attend. In both 2002 and 2012, African Americans were more likely to attend a jazz performance than other racial and/or ethnic groups (Figure 1-11). Americans of “other” races (a category that includes Asian Americans) saw no change in jazz attendance from 2002 to 2012. In 2002, jazz was most popular among adults 35 to 54 (they attended at a rate of 13 or 14 percent). In 2012, by contrast, the age group most likely to attend jazz was 55 to 64 (at a rate of 10 percent).
As with other types of performing arts activities, attendance was higher in both 2002 and 2012 for groups with greater levels of formal education. In 2002, about 24 percent of people with a graduate degree attended jazz; in 2012, that rate dropped to 18 percent but was still higher than for people with less education.

2012 survey of public participation in the arts • 10
The family income group most likely to attend a jazz event in 2012 earned $150,000 or more (16 percent of adults from these families attended at least one jazz performance).
Classical music. Patterns of attendance at classical music concerts related to gender, race/ethnicity, and educational level have not changed much over the past decade. In 2012, as in 2002, women were slightly more likely to attend a classical music concert than men, non-Hispanic white adults had a higher rate of attendance than other racial or ethnic subgroups, and better-educated adults had a higher rate of attendance than less-educated adults. Of the four racial/ethnic groups for which SPPA data are available, people from “other” races/ethnicities (including Asian) showed the second highest rate of classical music attendance, after non-Hispanic whites. The pattern of attendance related to age, however, has changed somewhat.
A decade ago, middle-aged Americans (those 45 to 64 years old) were more likely to attend a classical music performance than any other age group; in 2012, by contrast, the highest rate of attendance was among older Americans—those in the 65 to 74 age group. Indeed, across all types of performing arts for which comparisons can be made, one of the few demographic subgroups whose 2012 rate of attendance exceeded its 2002 rate is older adults, with respect to classical music performances in particular (Figure 1-11).
Classical music attendance increases with income. Over a third of the audiences in 2012 came from families earning $100,000 or more per year.
Opera. About 59 percent of the audience for live opera is female (Figure 1-10). Almost three-quarters of the opera audience has at least a college degree. About 8 percent of adults with a graduate education went to the opera at least once in 2012, compared with less than 1 percent of adults with a high school education or less. Over 40 percent of opera-goers earn at least $100,000 per year. Non-Hispanic whites are slightly more likely than Hispanics and African Americans to attend opera. In 2012, attendance by people of “other” races (including Asians) was on par with rates of attendance among non-Hispanic whites (Figure 1-11).
The percentage of African Americans who attended opera held steady over the last decade, while the percentage of Hispanic and white attendees declined (Figure 1-11). Patterns of attendance related to age and education have been fairly stable over the past 10 years, with older and more educated Americans being the most likely opera-goers. Two age groups, those 35 to 44 and those over 75, showed an increase in their rate of attendance from 2002 to 2012.
Latin, Spanish, and salsa music. A question on attendance at Latin music performances was added to the SPPA in 2008. The audience for live Latin music in 2012 was 53 percent Hispanic Americans, 36 percent non-Hispanic whites, and 10 percent other racial/ethnic groups (Figure 1-10). In 2012, 18 percent of all Hispanic adults attended at least one Latin music event, equivalent to the 2008 rate of attendance. The rates at which different racial/ethnic groups attended Latin music in 2012 has not changed since 2008, with one exception: African Americans were about twice as likely to attend Latin music in 2012 as they were in 2008. However, the percentages were quite small in both years (3 percent and 1.6 percent, respectively).
In 2008 and 2012, younger adults (ages 18 to 24) were the age group most likely to go to a Latin music performance; about 7 percent of this group attended Latin music. Rates of attendance among different age groups did not change from 2008 to 2012.
Unlike the case with other art forms tracked in the SPPA, the likelihood of attending a Latin music performance did not rise with income and educational level: people of all educational levels and incomes were equally likely to attend.
Outdoor performing arts festivals. A question on attendance at this type of event was added to the SPPA in 2008.
In 2012, men and women attended performing arts festivals in about equal proportions—roughly a fifth of each, unchanged from 2008. The rates of attendance among different racial/ethnic groups have not changed much since 2008, with one exception: Hispanic adults were slightly more like to go to a performing arts festival in 2012 than in 2008.

11 • chapter 1. visual and performing arts attendance
Although people with more education were the most likely to go to outdoor performing arts festivals in 2012, about 25 percent of attendees had no more than a high school education (a higher proportion than for audiences of any other type of performing arts event except for Latin music concerts).
A third of Americans earning at least $150,000 attended an outdoor performing arts festival in 2012.
Musical plays. More women than men attended musicals in 2012—women were 59 percent of musical play-goers in 2012—and the gender difference has not changed much since 2002. Over one-half the attendees of musical plays in 2012 were college graduates or had attended a graduate or professional school (Figure 1-10). The relationship between attendance at musical plays and educational level has remained more or less constant over the past decade: the more education a person has, the more likely he or she is to attend. In 2002 and 2012, non-Hispanic white adults had higher rates of attendance at musicals than did other racial and/or ethnic groups. About 75 percent of 2012 attendees were at least 35 years of age.
Non-musical plays. Women are more likely than men to attend non-musical plays, similar to the pattern for musical plays (Figure 1-11). This trend held from 2002 to 2012, although the gender gap lessened. In both 2002 and 2008, the racial/ethnic group most likely to attend a non-musical was non-Hispanic white and the least likely group was Hispanic (Figure 1-11). In 2002, the age group most likely to attend a non-musical was 45 to 54 (attending at a rate of 15 percent) but in 2012 the most likely attendee was older—65 to 74. The relationship between attendance at a non-musical and higher education was constant from 2002 to 2012.
Ballet. Women comprise much more of the nation’s ballet audience than men, and the gender divide is greater for ballet than for any other performing arts. In 2012, almost two-thirds of ballet attendees were female (Figure 1-10). Audiences for ballet also have the smallest representation of racial and ethnic minorities—in 2012, 80 percent of attendees were non-Hispanic white adults. Older Americans and younger Americans were just as likely to attend the ballet in 2012 as they were in 2002, but adults from 35 to 54 years of age were less likely to attend the ballet than a decade ago.
Other dance. Rates of attendance for other dance performances (non-ballet) held steady or increased among all age groups from 2002 to 2012. Over half the people attending other dance performances were
between the ages of 35 and 64. In 2002 and 2012, formal education and family income played a large part in predicting attendance at these events. In 2002 and 2012, more women than men attended these performances. The percentage of minorities who attended other dance performances in 2012 increased over 2002, whereas the percentage of non-Hispanic white adults stayed the same. The racial/ethnic group with the highest rate of attendance in 2012 was comprised of Asian Americans, Pacific Islanders, and “other” races or ethnicities.
Other music, theater, or dance. The 2012 survey asked respondents if they had attended any music, theater, or dance form not specifically referenced in the main questionnaire. This might include rock concerts, hip-hop shows, or other art forms that respondents were not asked about. This question was not asked in previous years.
Equal proportions of men and women attended these types of events in 2012. Non-Hispanic white adults were about twice as likely as adults from other races and/or ethnicities to attend, and adults from 18 to 24 years of age were twice as likely as adults ages 75 and older to attend. As with other types of art events, the rate of attendance increased with income and education.
Live book readings or poetry or storytelling events. A question on attending live spoken-word events, such as author readings or poetry or storytelling events, was asked for the first time in the 2012 SPPA.
Five percent of women attended a live book reading or storytelling event, compared with 3 percent of men. African Americans were more likely to attend than any other racial or ethnic group. Five percent of African Americans went to a book reading or storytelling event in 2012, compared with 4 percent of non-Hispanic white Americans. Younger adults attended at slightly higher rates than older Americans, and people with a college degree or higher attended at far greater rates than adults with less education.
Free music, theater, or dance. Another new question in the SPPA 2012 concerned the attendance of “free” music, theater, or dance events.
About 16 percent of Americans attended a free music, theater, or dance event in 2012. Adults 18 to 24 had the highest rate of participation of all age groups (21 percent). Participation rates rose with education and income, demographic characteristics which typically increase with age.

2012 survey of public participation in the arts • 12
Figure 1-10 shows that nearly three-fourths of the audience for free music, theater, and dance is non-Hispanic white. Half the audience is under age 45, about
44 percent have a college degree or higher, and over a quarter come from families that make $100,000 or more annually.
Figure 1-10. Demographic distribution of U.S. adults attending different types of performing arts events at least once in the past 12 months: 2012
U.S. popula-tion in
millions
Percent Jazz Classical music
Opera Latin music
Perform-ing arts festivals
Musical plays
Non- musical
plays
Ballet Other dance
Other types of music, theater, or dance
Live book read-ing or poetry
or story telling event
Free music, theater, or dance
(any type)
Gender
Male 113.1 48.1% 46.6% 43.9% 41.3% 46.1% 45.7% 40.7% 42.1% 36.0% 39.4% 47.2% 35.5% 44.0%
Female 121.9 51.9% 53.4% 56.1% 58.7% 53.9% 54.3% 59.3% 57.9% 64.0% 60.6% 52.8% 64.5% 56.0%
Total 100.0% 100.0% 100.0% 100.0% 100.0% 100.0% 100.0% 100.0% 100.0% 100.0% 100.0% 100.0% 100.0% 100.0%
Race/ethnicity
Hispanic 35.0 14.9% 9.1% 5.5% 7.8% 53.2% 11.6% 7.1% 6.4% 9.2% 11.9% 8.7% 8.5% 12.1%
White 155.7 66.3% 68.4% 83.2% 78.0% 36.5% 74.0% 80.4% 80.7% 79.4% 69.4% 80.2% 68.8% 71.4%
African American 26.8 11.4% 15.8% 5.1% 6.2% 6.6% 8.1% 7.0% 8.5% 6.9% 10.7% 5.7% 15.0% 10.0%
Other 17.5 7.4% 6.7% 6.2% 8.0% 3.7% 6.3% 5.5% 4.4% 4.5% 8.0% 5.4% 7.7% 6.5%
Total 100.0% 100.0% 100.0% 100.0% 100.0% 100.0% 100.0% 100.0% 100.0% 100.0% 100.0% 100.0% 100.0% 100.0%
Age
18–24 30.4 13.0% 14.5% 9.7% 10.6% 17.9% 15.5% 11.0% 9.8% 11.2% 13.9% 15.7% 14.3% 16.9%
25–34 41.0 17.4% 17.2% 14.5% 18.6% 21.8% 19.4% 15.7% 15.8% 19.9% 16.1% 19.2% 22.0% 16.1%
35–44 39.6 16.9% 16.2% 12.2% 9.6% 18.6% 17.4% 14.3% 15.0% 17.2% 17.5% 15.8% 19.4% 16.6%
45–54 43.7 18.6% 18.3% 17.4% 15.0% 17.0% 19.3% 20.7% 21.4% 15.9% 18.3% 19.8% 14.5% 19.9%
55–64 38.3 16.3% 20.2% 20.5% 20.8% 16.7% 16.3% 20.5% 17.9% 18.3% 18.6% 15.8% 16.3% 16.7%
65–74 23.8 10.1% 9.8% 16.0% 15.4% 5.7% 8.7% 11.8% 12.9% 12.2% 11.0% 9.2% 9.2% 9.0%
75+ 18.1 7.7% 3.8% 9.7% 10.0% 2.2% 3.4% 6.1% 7.2% 5.3% 4.5% 4.5% 4.2% 4.8%
Total 100.0% 100.0% 100.0% 100.0% 100.0% 100.0% 100.0% 100.0% 100.0% 100.0% 100.0% 100.0% 100.0% 100.0%
Highest level of education
Grade school 9.9 4.2% 0.4% 0.4% 0.7% 5.7% 1.3% 0.4% 0.2% 0.2% 1.3% 0.9% 1.1% 1.0%
Some high school 19.0 8.1% 1.3% 1.5% 0.8% 8.2% 3.1% 1.6% 1.8% 1.8% 1.8% 2.4% 3.0% 4.4%
High school graduate 70.9 30.2% 16.8% 10.6% 5.2% 20.0% 20.1% 16.4% 14.1% 12.4% 16.5% 20.8% 13.0% 17.6%
Some college 68.7 29.2% 29.6% 24.4% 23.4% 31.0% 32.5% 28.1% 27.4% 24.8% 31.2% 31.4% 31.1% 33.0%
College graduate 43.0 18.3% 29.7% 33.5% 33.0% 22.1% 26.9% 32.4% 32.5% 32.2% 27.2% 26.9% 30.2% 28.6%
Graduate school 23.5 10.0% 22.1% 29.6% 37.0% 13.0% 16.1% 21.1% 24.2% 28.6% 22.1% 17.7% 21.6% 15.4%
Total 100.0% 100.0% 100.0% 100.0% 100.0% 100.0% 100.0% 100.0% 100.0% 100.0% 100.0% 100.0% 100.0% 100.0%
Family income
Less than $20K 40.9 17.4% 10.3% 7.8% 7.4% 17.4% 10.5% 7.1% 7.9% 8.5% 11.6% 8.2% 11.9% 10.5%
$20K to $50K 76.0 32.3% 21.2% 20.7% 21.4% 26.5% 25.6% 20.5% 22.5% 21.8% 22.2% 25.0% 27.1% 26.3%
$50K to $75K 43.9 18.7% 18.9% 19.6% 17.1% 19.4% 20.5% 20.6% 17.7% 21.4% 21.1% 20.5% 20.6% 19.8%
$75K to $100K 27.6 11.7% 15.0% 14.0% 11.6% 14.2% 15.1% 15.8% 16.6% 12.4% 16.0% 15.4% 15.6% 14.8%
$100K to $150K 27.1 11.5% 18.0% 19.8% 20.2% 13.6% 14.9% 18.5% 18.7% 18.3% 16.4% 17.4% 14.1% 16.8%
$150K and over 19.6 8.3% 16.6% 18.2% 22.3% 8.8% 13.4% 17.5% 16.5% 17.6% 12.7% 13.5% 10.8% 11.8%
Total 100.0% 100.0% 100.0% 100.0% 100.0% 100.0% 100.0% 100.0% 100.0% 100.0% 100.0% 100.0% 100.0% 100.0%

13 • chapter 1. visual and performing arts attendance
Figure 1-11 (part 1). Rates of attendance (based on adults participating at least once in the past 12 months), by demographic subgroup: 2002 and 2012
Jazz 2002
Jazz 2012
Classical music 2002
Classical music 2012
Opera 2002
Opera 2012
Musical plays 2002
Musical plays 2012
Non- musical
plays 2002
Non- musical
plays 2012
all adults 10.8% 8.1% 11.6% 8.8% 3.2% 2.1% 17.1% 15.2% 12.3% 8.3%
Gender
Male 10.7% 7.9% 10.3% 8.0% 2.8% 1.8% 14.0% 12.9% 10.3% 7.3%
Female 10.8% 8.3% 12.7% 9.5% 3.5% 2.4% 20.0% 17.3% 14.2% 9.2%
Race/ethnicity
Hispanic 6.2% 5.0% 5.5% 3.3% 1.8% 1.1% 6.9% 7.3% 6.2% 3.6%
White 11.4% 8.4% 13.7% 11.0% 3.5% 2.5% 20.1% 18.4% 14.2% 10.1%
African American 12.7% 11.2% 4.5% 4.0% 1.1% 1.2% 10.3% 9.3% 7.1% 6.2%
Other 7.3% 7.4% 10.3% 7.3% 2.5% 2.3% 11.9% 11.2% 10.0% 4.9%
Age
18–24 10.5% 9.2% 7.8% 6.7% 2.0% 1.8% 14.8% 13.0% 11.4% 6.4%
25–34 10.8% 8.0% 9.0% 7.3% 3.0% 2.3% 15.4% 13.6% 10.7% 7.5%
35–44 13.0% 7.8% 10.7% 6.4% 0.3% 1.2% 19.1% 12.9% 13.0% 7.3%
45–54 13.9% 7.9% 15.2% 8.2% 4.0% 1.7% 19.3% 16.9% 15.2% 9.5%
55–64 8.8% 10.0% 15.6% 11.0% 4.2% 2.7% 19.7% 19.0% 13.8% 9.0%
65–74 7.6% 7.9% 12.5% 13.9% 4.0% 3.3% 16.6% 17.7% 13.0% 10.6%
75+ 3.9% 3.9% 9.5% 10.9% 1.8% 2.7% 10.1% 11.9% 5.4% 7.8%
Highest level of education
Grade school 0.9% 0.9% 1.5% 0.9% 0.0% 0.3% 1.6% 1.6% 1.1% 0.3%
Some high school 2.7% 1.3% 1.9% 1.6% 0.8% 0.2% 4.1% 2.9% 3.7% 1.8%
High school graduate 5.3% 4.5% 4.5% 3.1% 0.8% 0.4% 9.1% 8.3% 5.7% 3.9%
Some college 12.2% 8.2% 11.5% 7.3% 2.8% 1.7% 19.4% 14.6% 12.7% 7.8%
College graduate 19.4% 13.1% 21.9% 15.9% 6.4% 3.8% 30.2% 26.7% 22.5% 14.6%
Graduate school 24.0% 17.9% 34.1% 26.0% 10.9% 7.9% 37.6% 32.1% 31.8% 20.0%
Family income
Less than $20K 4.8% 3.9% 0.9% 6.2% 3.8%
$20K to $50K 5.3% 5.6% 1.4% 9.6% 5.8%
$50K to $75K 8.2% 9.2% 1.9% 16.8% 7.9%
$75K to $100K 10.2% 10.3% 2.1% 20.1% 11.6%
$100K to $150K 12.6% 15.1% 3.7% 24.6% 13.5%
$150K and over 16.3% 19.4% 5.8% 32.4% 16.6%
Gray shaded box indicates that the estimate is significantly different from the 2012 estimate at the .05 level
Significance testing shows differences between 2002 and 2012 results. The 2002 SPPA did not ask about Latin music; performing arts festivals; any other music, theater, or dance; live book readings or storytelling; or free music, theater, or dance. Significance tests were not conducted on family income categories. This is because the dollars have not been adjusted for inflation.
2012 survey of public participation in the arts • 14
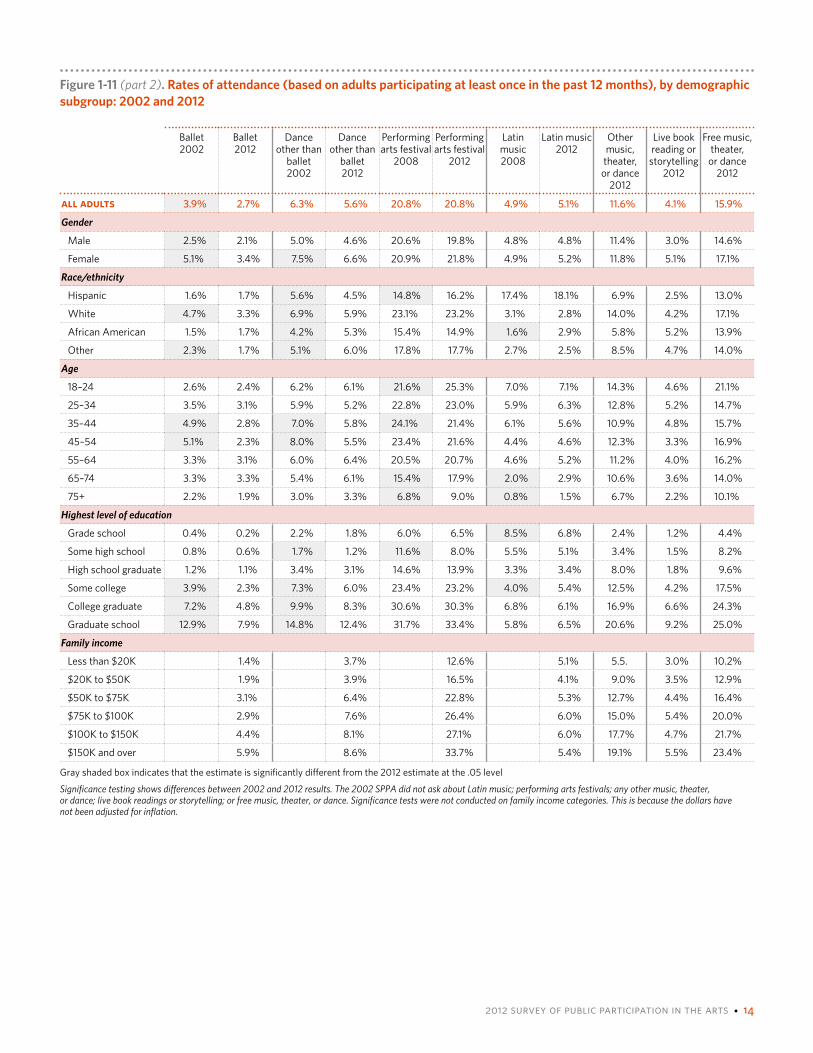
Figure 1-11 (part 2). Rates of attendance (based on adults participating at least once in the past 12 months), by demographic subgroup: 2002 and 2012
Ballet 2002
Ballet 2012
Dance other than
ballet 2002
Dance other than
ballet 2012
Performing arts festival
2008
Performing arts festival
2012
Latin music 2008
Latin music 2012
Other music, theater, or dance
2012
Live book reading or
storytelling 2012
Free music, theater, or dance
2012
all adults 3.9% 2.7% 6.3% 5.6% 20.8% 20.8% 4.9% 5.1% 11.6% 4.1% 15.9%
Gender
Male 2.5% 2.1% 5.0% 4.6% 20.6% 19.8% 4.8% 4.8% 11.4% 3.0% 14.6%
Female 5.1% 3.4% 7.5% 6.6% 20.9% 21.8% 4.9% 5.2% 11.8% 5.1% 17.1%
Race/ethnicity
Hispanic 1.6% 1.7% 5.6% 4.5% 14.8% 16.2% 17.4% 18.1% 6.9% 2.5% 13.0%
White 4.7% 3.3% 6.9% 5.9% 23.1% 23.2% 3.1% 2.8% 14.0% 4.2% 17.1%
African American 1.5% 1.7% 4.2% 5.3% 15.4% 14.9% 1.6% 2.9% 5.8% 5.2% 13.9%
Other 2.3% 1.7% 5.1% 6.0% 17.8% 17.7% 2.7% 2.5% 8.5% 4.7% 14.0%
Age
18–24 2.6% 2.4% 6.2% 6.1% 21.6% 25.3% 7.0% 7.1% 14.3% 4.6% 21.1%
25–34 3.5% 3.1% 5.9% 5.2% 22.8% 23.0% 5.9% 6.3% 12.8% 5.2% 14.7%
35–44 4.9% 2.8% 7.0% 5.8% 24.1% 21.4% 6.1% 5.6% 10.9% 4.8% 15.7%
45–54 5.1% 2.3% 8.0% 5.5% 23.4% 21.6% 4.4% 4.6% 12.3% 3.3% 16.9%
55–64 3.3% 3.1% 6.0% 6.4% 20.5% 20.7% 4.6% 5.2% 11.2% 4.0% 16.2%
65–74 3.3% 3.3% 5.4% 6.1% 15.4% 17.9% 2.0% 2.9% 10.6% 3.6% 14.0%
75+ 2.2% 1.9% 3.0% 3.3% 6.8% 9.0% 0.8% 1.5% 6.7% 2.2% 10.1%
Highest level of education
Grade school 0.4% 0.2% 2.2% 1.8% 6.0% 6.5% 8.5% 6.8% 2.4% 1.2% 4.4%
Some high school 0.8% 0.6% 1.7% 1.2% 11.6% 8.0% 5.5% 5.1% 3.4% 1.5% 8.2%
High school graduate 1.2% 1.1% 3.4% 3.1% 14.6% 13.9% 3.3% 3.4% 8.0% 1.8% 9.6%
Some college 3.9% 2.3% 7.3% 6.0% 23.4% 23.2% 4.0% 5.4% 12.5% 4.2% 17.5%
College graduate 7.2% 4.8% 9.9% 8.3% 30.6% 30.3% 6.8% 6.1% 16.9% 6.6% 24.3%
Graduate school 12.9% 7.9% 14.8% 12.4% 31.7% 33.4% 5.8% 6.5% 20.6% 9.2% 25.0%
Family income
Less than $20K 1.4% 3.7% 12.6% 5.1% 5.5. 3.0% 10.2%
$20K to $50K 1.9% 3.9% 16.5% 4.1% 9.0% 3.5% 12.9%
$50K to $75K 3.1% 6.4% 22.8% 5.3% 12.7% 4.4% 16.4%
$75K to $100K 2.9% 7.6% 26.4% 6.0% 15.0% 5.4% 20.0%
$100K to $150K 4.4% 8.1% 27.1% 6.0% 17.7% 4.7% 21.7%
$150K and over 5.9% 8.6% 33.7% 5.4% 19.1% 5.5% 23.4%
Gray shaded box indicates that the estimate is significantly different from the 2012 estimate at the .05 level
Significance testing shows differences between 2002 and 2012 results. The 2002 SPPA did not ask about Latin music; performing arts festivals; any other music, theater, or dance; live book readings or storytelling; or free music, theater, or dance. Significance tests were not conducted on family income categories. This is because the dollars have not been adjusted for inflation.

15 • chapter 1. visual and performing arts attendance
The chart below shows a positive link between arts attendance and family income—a relationship that varies by type of arts performance. The relationship is strongest between family income and attendance at musicals, followed by plays, classical music, and jazz performances. For other dance performances, the relationship between income and attendance is minimal; for Latin music performances, it is non-existent.
Chart 1-2. Percentage of U.S. adults who attended a performing arts event, by art form and family income level: 2012
0%
11%
22%
33%
$150K or more$100K to $150K75K to $100K$50K to $75K$20K to $50KLess than $20K
Jazz Classical Opera Latin Plays Musicals Ballet Other dance
Opera 2.1%
Latin 5.4%Ballet 2.9%
Other dance 3.9%
Classical 19.4%
Opera 5.8%Ballet 5.9%
Opera 3.7%
Ballet 4.4%
Latin 6.0%
Latin 6.0%
Opera 1.9%
Ballet 3.1%
Classical 9.2%
Latin 5.3%
Plays 7.9%
Jazz 8.2%
Opera 1.4%
Ballet 1.9%Ballet 1.4%
Opera 0.9%
Plays 11.6%
Latin 4.1%
Classical 5.6%
Other dance 8.6%
Other dance 6.4%
Plays 3.8%Classical 3.9%
Latin 5.1%Musicals 6.2%
Other dance 3.7%
Jazz 4.8% Jazz 5.3%
Musicals 9.6%
Plays 5.8%
Classical 10.3% Jazz 12.6%
Plays 13.5%Jazz 16.3%
Plays 16.6%Musicals 16.8%
Musicals 20.1%
Musicals 24.6%
Musicals 32.4%
Classical 15.1%
Other dance 8.1%Other dance 7.6%Jazz 10.2%

2012 survey of public participation in the arts • 16
Figure 1-12. Average attendances per attendee in the past 12 months, by demographic subgroup: 2012 and 2002
Jazz Classical music
Opera Latin music Musical plays Non-musical plays
Ballet Other dance
Gender
Male (2012) 2.9 2.5 2.1 2.6 2.0 2.2 1.5 2.1
Male (2002) 3.4 3.0 2.3 * 2.2 2.4 1.9 2.2
Female (2012) 2.8 2.6 2.0 2.3 2.0 2.1 1.5 2.1
Female (2002) 2.9 3.1 1.8 * 2.3 2.3 1.6 1.9
Race
White (2012) 2.8 2.6 2.1 2.2 2.1 2.2 1.5 2.0
White (2002) 3.0 3.1 2.1 * 2.3 2.3 1.7 2.1
Non-white (2012) 2.8 2.5 1.8 2.5 1.9 2.0 1.7 2.3
Non-white (2002) 3.4 2.9 1.6 * 2.2 2.4 1.7 1.8
Age
18–34 (2012) 3.0 2.3 2.0 2.6 1.9 2.1 1.4 2.6
18–34 (2002) 2.9 2.8 1.7 * 2.2 2.2 1.4 1.8
35–64 (2012) 2.7 2.3 1.9 2.3 2.0 2.0 1.5 1.8
35–64 (2002) 3.2 2.9 2.1 * 2.3 2.3 1.7 1.9
65 or older (2012 3.2 3.4 2.3 2.1 2.4 2.6 1.7 2.1
65 or older (2002) 3.1 3.9 2.4 * 2.3 3.0 2.4 3.4
Education
Non-college graduates (2012) 2.8 2.4 1.9 2.4 2.0 1.9 1.5 2.3
Non-college graduates (2002) 3.0 2.6 1.8 * 2.1 2.1 1.4 2.1
College graduate (2012) 2.9 2.7 2.1 2.3 2.1 2.4 1.5 1.9
College graduate (2002) 3.2 3.4 2.2 * 2.4 2.5 1.9 2.0
Family income
Less than $50K 2.8 2.5 2.0 2.3 2.0 2.2 1.6 2.1
$50K to $100K 3.1 2.7 2.1 2.6 2.0 2.0 1.5 2.2
$100K and over 2.5 2.6 2.1 2.3 2.1 2.3 1.5 2.0
Gray shaded box indicates that the estimate is significantly different from the overall 2012 estimate at the .05 level
Pink shaded box indicates that the estimate is significantly different from the 2012 subgroup estimate at the .05 level

17 • chapter 1. visual and performing arts attendance
Visual Arts in General
The 2012 SPPA includes questions about visits to art museums or galleries, attendance at visual arts festivals or craft fairs, and visits to parks, monuments, buildings, or neighborhoods for those places’ historic or design value.
People attending visual arts sites or events. Forty-nine million U.S. adults (21 percent of all adults) went to an art museum or art gallery at least once in the 12 months ending in July 2012, and 53 million (22 percent) went to a craft fair or visual arts festival. Since 2002, the percentage of adults going to an art museum or art gallery has declined (Figure 1-14). The overall attendance estimates between 2002 and 2012 are not comparable because the SPPA questions on attending craft fairs or festivals were quite different.
The number of adults visiting parks or monuments or touring buildings or neighborhoods for their “historic or design value” dropped significantly from 2002 to 2008 and then leveled off. About 24 to 25 percent went to at least one of those sites in 2008 and 2012, a drop from 32 percent in 2002. Although the decline from 2008 to 2012 is statistically significant, it is a modest change.
Between 2002 and 2008, attendance at craft fairs dropped 9 percentage points, but 2012 attendance rates were only slightly lower than in 2008. (See Figure 1-13.)
From 2002 to 2008, the percentage of adults touring a park, monument, building or neighborhood or monument for historic or design purposes dropped seven points; from 2008 to 2012 there was an additional one-point decline. From 2002 to 2008 the percentage visiting an art museum or gallery dropped four points, and the share fell another two points in 2012.
Visits. Adults made about 132 million visits to art museums and art galleries in 2012, and, on average, attendees went 2.7 times (Figure 1-14). Between 2002 and 2008 the number of visits declined substantially (by about 42 million), but between 2008 and 2012 the drop was smaller (a difference of about 16 million).
The 2008 and 2012 SPPAs did not track the number of visits per respondent to visual art festivals and craft fairs or to parks, monuments, buildings, and neighborhoods of historic or design value.
Figure 1-13. Percentage of U.S. adults attending visual arts activities or events: 2002, 2008, and 2012
2002 2008 2012
Art museums/ galleries
26.5% 22.7% 21.0%
Visual arts festivals or craft fairs
33.4 24.5% 22.4%
Parks, monuments, buildings, or neighborhoods visited for historic or design value
31.6% 24.9% 23.9%
Gray shaded box indicates that the estimate is significantly different from the 2012 estimate at the .05 level
Figure 1-14. Average number of visits per attendee and millions of visits to art museums or galleries: 2002, 2008, and 2012
2002 2008 2012
Art museums/ galleries
3.5 2.9 2.7
Millions of visits to art museums/ galleries
190M 148M 132M
Gray shaded box indicates that the estimate is significantly different from the 2012 estimate at the .05 level

2012 survey of public participation in the arts • 18
Demographic Characteristics of Visual Art-Goers
The demographic makeup of adults who attend visual arts events has not changed much since 2002, with one notable exception. The oldest Americans, age 75 and up, were more likely to attend visual arts in 2012 than they were a decade ago. This is the only demographic subgroup to show an increase in participation. In fact, other subgroups—related to gender, race, and education level—experienced a decline.
Art museums and galleries. Demographic characteristics of people who go to art museums and galleries are found in Figure 1-15. About 57 percent of people who went to art museums or art galleries in 2012 were women. Among adults who visited at least once in a 12-month period, two-thirds were younger than 55 years of age. In 2012, the racial/ethnic group most likely to visit an art museum or gallery was non-Hispanic white, a change from 2002, when people of races and ethnicities other than white, African American, and Hispanic comprised the group most likely to attend (Figure 1-16).
Regarding age groups, in 2002 the highest rate of attendance was among adults aged 45 to 54; a third of this group went to an art museum or gallery at least once that year. By 2012, the rate dropped to 22 percent. Only one age group experienced an increase in its rate of museum attendance from 2002 to 2012: Americans 75 and older. In 2002, about 13 percent visited an art museum or gallery, and in 2012 the rate rose to 16 percent.
The relationship between educational attainment and museum attendance is consistent from 2002 to 2012; rates of attendance increased exponentially with education (Figure 1-16). Nearly 84 percent of people who visited an art museum or gallery at least once in 2012 had at least some college education (Figure 1-15).
Craft fairs and visual arts festivals. Figure 1-15 provides demographic data on people who go to visual arts festivals and craft fairs. (Demographic data about people who attend outdoor performing arts festivals are shown in Figure 1-10.) In 2012, about 61 percent of people who went to these events were women; one out of every four American women went in 2012, compared with 18 percent of men (Figure 1-16).
Places of historic or design interest. The 2012 SPPA asked respondents to report visits they made to any park, monument, building, or neighborhood of historic or design value. Nearly a quarter of the U.S. adult population made such visits in 2012.
Figure 1-16 shows that women are slightly more likely than men to visit or tour sites of historic or design value (25 percent of women went in 2012, versus 23 percent of men). All age groups have a similar likelihood of doing so, except for people 75 and older, who are less likely than younger adults. The nation’s oldest adults were, however, more likely to go in 2012 than in 2002. And people with higher levels of education were much more likely than less-educated adults to visit such sites.

19 • chapter 1. visual and performing arts attendance
Inside the SPPA: Asking about Visits to Places with Design or Historic Value
The 2012 SPPA experimented with different ways of asking about adult visits to places of historic or design value. The goal was to understand how responses would vary if the question specifically included “architectural” (rather than just historic- or design-related) reasons for visiting a site. Another goal was to understand what the responses would be if adults were asked about visits to buildings and neighborhoods in one question, and about visits to parks and monuments in another.
Consequently, two new questions were asked as part of an experimental set of questions (known as “Core 2”). Respondents were randomly assigned to answer either the main survey questions (Core 1) or the experimental questions.
The underlying assumption of the two-question approach is that people are more likely to recall visiting buildings or neighborhoods for their historic, architectural, or design value if the question is not bundled with one about parks and monuments. While the estimates are not directly comparable, this hypothesis was borne out. The combined “yes” responses from the two questions in Core 2 accounted for a greater percentage of U.S. adults than did the yes responses from Core 1 alone (25.8 percent versus 23.9 percent). To facilitate trend analysis, this report uses the Core 1 estimates, but future SPPA surveys may adopt the two-question approach.
• CORE 1 (Q10A) [During the last 12 months] did you visit an historic park or monument, or tour buildings or neighborhoods for their historic or design value?
• CORE 2 (Q10A) [During the last 12 months,] did you go see any buildings or neighborhoods for their historical, architectural, or design value?
• CORE 2 (Q11A) [During the last 12 months,] did you go visit a park or monument for its historical, architectural, or design value?
YES NO TOTAL
Core 1 (10a) Version 23.9% 76.1% 100.0%
Core 2 10a 16.9% 83.1% 100.0%
Core 2 11a 21.5% 78.5% 100.0%
Core 2 10a or 11a 25.8% 74.2% 100.0%

2012 survey of public participation in the arts • 20
Figure 1-15. Demographic distribution of U.S. adults attending different types of visual arts events at least once in the past 12 months: 2012
2012 U.S. Population Art museums or galleries
2012
Craft fairs and visual arts
festivals 2012
Places visited for design or historic
value 2012
Millions Percent
all adults 235.0
Gender
Male 113.1 48.1% 42.9% 38.9% 46.4%
Female 121.9 51.9% 57.1% 61.1% 53.6%
Total 100.0% 100.0% 100.0% 100.0%
Race/ethnicity
Hispanic 35.0 14.9% 10.1% 11.1% 8.5%
White 155.7 66.3% 76.0% 77.4% 78.6%
African American 26.8 11.4% 6.5% 6.1% 6.2%
Other 17.5 7.4% 7.4% 5.4% 6.6%
Total 100.0% 100.0% 100.0% 100.0%
Age
18–24 30.4 13.0% 11.1% 10.4% 11.0%
25–34 41.0 17.4% 18.4% 16.8% 18.3%
35–44 39.6 16.9% 17.1% 16.6% 16.5%
45–54 43.7 18.6% 19.5% 20.4% 20.5%
55–64 38.3 16.3% 17.5% 18.8% 18.1%
65–74 23.8 10.1% 10.8% 11.7% 10.8%
75+ 18.1 7.7% 5.7% 5.2% 4.9%
Total 100.0% 100.0% 100.0% 100.0%
Highest level of education
Grade school 9.9 4.2% 0.7% 1.1% 0.7%
Some high school 19.0 8.1% 1.7% 2.9% 2.0%
High school graduate 70.9 30.2% 14.1% 21.8% 16.7%
Some college 68.7 29.2% 27.3% 30.6% 30.4%
College graduate 43.0 18.3% 32.7% 27.1% 29.7%
Graduate school 23.5 10.0% 23.5% 16.4% 20.4%
Total 100.0% 100.0% 100.0% 100.0%
Family income
Less than $20K 40.9 17.4% 8.4% 9.5% 8.7%
$20K to $50K 76.0 32.3% 21.6% 25.8% 22.0%
$50K to $75K 43.9 18.7% 19.6% 20.5% 19.7%
$75K to $100K 27.6 11.7% 15.0% 15.3% 15.0%
$100K to $150K 27.1 11.5% 18.4% 15.5% 18.6%
$150K and over 19.6 8.3% 17.0% 13.4% 16.1%
Total 100.0% 100.0% 100.0% 100.0%

21 • chapter 1. visual and performing arts attendance
Figure 1-16. Visual arts rates of attendance (based on adults participating at least once in past 12 months), by demographic group: 2002 and 2012
Art museum or gallery
2002
Art museum or gallery
2012
Craft fairs and arts festivals
20024
Craft fairs and visual arts
festivals2012
Places visited for design
or historic value2002
Places visited for design
or historic value2012
26.5% 21.0% 33.4% 22.4% 31.6% 23.9%
Gender
Male 24.6% 18.7% 27.0% 18.2% 30.5% 23.1%
Female 28.2% 23.1% 39.2% 26.4% 32.5% 24.6%
Race/ethnicity
Hispanic 16.1% 14.3% 20.3% 16.8% 17.2% 13.8%
White 29.5% 24.1% 38.0% 26.2% 36.0% 28.3%
African American 14.8% 11.9% 19.7% 12.0% 17.9% 13.1%
Other 32.7% 21.2% 25.8% 16.3% 30.4% 21.2%
Age
18–24 23.7% 18.3% 29.2% 18.3% 28.3% 20.5%
25–34 26.7% 22.0% 33.5% 21.6% 33.3% 25.1%
35–44 27.4% 21.2% 37.2% 22.0% 35.8% 23.3%
45–54 32.9% 22.0% 38.8% 24.6% 38.0% 26.2%
55–64 27.8% 22.5% 35.1% 25.8% 24.2% 26.5%
65–74 23.4% 22.4% 31.1% 26.1% 24.2% 25.5%
75+ 13.4% 15.5% 15.7% 15.0% 12.8% 15.0%
Highest level of education
Grade school 4.5% 3.6% 8.4% 5.9% 6.3% 3.9%
Some high school 7.7% 4.3% 14.0% 8.0% 11.4% 5.9%
High school graduate 14.2% 9.9% 25.7% 16.3% 20.2% 13.3%
Some college 29.0% 19.7% 38.2% 23.6% 36.5% 25.0%
College graduate 46.6% 37.2% 51.9% 32.9% 51.2% 38.4%
Graduate school 58.8% 49.3% 51.9% 36.9% 56.8% 48.8%
Family income
Less than $20K 10.2% 12.3% 12.1%
$20K to $50K 14.0% 17.9% 16.2%
$50K to $75K 22.1% 24.5% 25.1%
$75K to $100K 26.5% 28.9% 30.1%
$100K to $150K 33.8% 30.5% 38.8%
$150K and over 43.2% 36.4% 46.6%
Gray shaded box indicates that the estimate is significantly different from the 2012 estimate at the .05 level
4 The question in 2002 was broader. It asked about any arts festivals, not just
about craft or visual arts festivals, and thus the 2012 estimates are not directly
comparable.

2012 survey of public participation in the arts • 22
Predictors of Benchmark Arts Attendance
A number of demographic characteristics discussed in this chapter, such as education, gender, and age, are strongly correlated with arts attendance. The typical pattern is that, with the exception of the very oldest Americans, older adults attend “benchmark” arts events more often than younger adults, females attend more often than men, and people with higher levels of education attend more often than the less educated. Regression analysis using a “least squares model” was done to identify the importance of these factors relative to one another in predicting arts attendance.
Regression analysis shows the central role that educational attainment played in predicting arts attendance or visitation in 2012. This was also true in 2002 and 2008.
In 2012, for example, respondents with a college degree were 37 percent more likely than people who had completed only grade school to attend a benchmark arts activity, when controlling for other factors. (Demographic characteristics with a marginal impact of “0” shown in Figure 1-17 represent the base case of the model against which the relative impact of other characteristics can be compared. Statistically significant factors influencing attendance at a benchmark arts activity are highlighted in bold.)
Differences among the 2002, 2008, and 2012 regression models also indicate that some of the key predictors of benchmark attendance are changing. Education is still the main factor in predicting arts attendance and is still a stronger predictor of arts attendance than income, race/ethnicity, or age. However, overall differences in attendance by education group narrowed slightly between 2002 and 2008 and more significantly between 2008 and 2012, which means that benchmark arts participation declined more for higher-educated respondents after controlling for other demographic characteristics.
Similarly, in 2012, living in the Pacific region of the country remained a positive factor in determining whether or not a person attended an arts event. However, it was less of a factor in 2012 than in 2002. As expected, residing in metro areas was a positive factor for attendance in each year of the survey. Meanwhile, being a non-U.S. citizen was consistently a negative factor in determining the likelihood of attending a benchmark arts event.
Figure 1-17. Effects of demographic characteristics on the likelihood of benchmark arts attendance in the past 12 months: 2002, 2008, and 2012
2012benchmark arts event
2008 2002
Gender
Male -5.8% -6.5% -9.8%
Female 0.0% 0.0% 0.0%
Race and Ethnicity
Hispanic -10.4% -8.3% -5.7%
White 0.0% 0.0% 0.0%
African American -6.4% -9.7% -8.9%
Other -10.9% -11.8% -9.7%
Age
18–24 0.0% 0.0% 0.0%
25–34 1.6% -4.0% -0.7%
35–44 1.9% -4.1% 0.4%
45–54 2.6% -4.9% 0.5%
55–64 1.7% -6.0% -2.5%
65–74 -0.2% -1.2% -0.1%
75+ -7.0% -9.7% -10.1%
Education
Grade school 0.0% 0.0% 0.0%
Some high school 2.6% 11.3% 10.7%
High school graduate 9.0% 14.4% 21.4%
Some college 19.7% 32.3% 39.9%
College graduate 36.7% 48.3% 53.1%
Graduate school 46.6% 55.4% 58.8%
Family income
Less than $30K 0.0% 0.0% 0.0%
$30k to $50K 16.1% 9.1% 5.5%
$50K to $75K 19.1% 12.6% 11.7%
$75K or more 22.8% 22.2% 20.4%
Region
New England 0.0% 0.0% 0.0%
Middle Atlantic -0.9% -2.6% 4.7%
South Atlantic 0.9% -5.3% 0.2%
East South Central -0.4% -9.1% -3.5%
East North Central -2.1% -0.5% 5.1%
West South Central -6.9% -7.2% 1.2%
West North Central -4.2% -2.9% 5.9%
Mountain 0.5% 0.4% 8.9%
Pacific 3.7% 4.8% 8.0%
Other
Reside in metro area 9.2% 6.9% 8.3%
Married 0.9% -2.2% -3.7%
No child under 18 6.7% 3.0% 5.6%
Non-citizen -6.6% -8.0% -8.2%

23 • chapter 1. visual and performing arts attendance
Attendance at Live Music Performances
The 2012 SPPA included an experimental set of questions to test new ways of asking about participation in the arts. The experimental questions were asked of a random half of all respondents; the other half received the traditional set of questions, which have not changed significantly over time. The new questions began with a general item about attendance at any live music performance in the past 12 months, followed by items about specific types of live music for those who answered yes to the general question.
Live attendance estimates for jazz, Latin music, classical music, and opera were significantly lower in response to the experimental questions than in response to the main survey questions about attendance. The difference probably occurs because people are better able to recall attendance when asked about a specific type of event. In addition, the experimental items led with a general question about attending any music performance. A “no” response to this question might have erroneously excluded some respondents who would have replied “yes” to one of the specific types of music performances. Therefore, the population estimates in this report for attending live musical events use only responses from the traditional section of the SPPA survey.
Type of Live MusicWhile the experimental questions are not used to produce 2012 population estimates, they provide insight into the types of live music performances people attend. For adults who went to a live music performance in 2012, Figure 1-18 shows the type of music performance they attended. Overall, 43.6 percent of adults who attended live music attended a live pop or rock music show, by far the most common genre of live music attended in 2012. Opera was the least reported genre of live music attended (4.8 percent).
Demographic DifferencesThe many significant differences highlighted in Figure 1-18 show that, for people who attended a live music performance in 2012, the type of music varied significantly depending on the person’s gender, age, race/ethnicity, education, and family income.
Women who attended a live music performance had higher rates of attending all music genres than men, with two exceptions: rap and pop/rock music. Of the racial and ethnic groups, Hispanics were most likely to attend Latin, Spanish, or salsa music performances. African Americans were most likely to attend jazz, hymns, blues, and rap music, and non-Hispanic whites were most likely to attend country, pop, and rock music. The racial and ethnic group most likely to attend opera, classical music, and folk music was comprised of people of “other” race and/or ethnicities (e.g., Asian Americans and Pacific Islanders). With respect to age differences, younger adults were the most likely to attend rap, pop, and rock music events, and older people were more likely to attend classical and opera performances.

2012 survey of public participation in the arts • 24
Figure 1-18. Genres of music attended by adults who reported attending any live music performance in the past 12 months: 2012
Jazz Latin Classical Opera Hymns Country Rap Blues Folk Pop/rock
% attending % attending % attending % attending % attending % attending % attending % attending % attending % attending
all adults 15.9% 9.1% 18.2% 4.8% 14.2% 20.2% 8.7% 13.1% 9.8% 43.6%
Gender
Males 15.3% 8.5% 16.6% 4.1% 12.2% 19.3% 9.7% 12.1% 8.5% 46.4%
Females 16.3% 9.6% 19.5% 5.5% 16.0% 20.9% 7.8% 14.0% 10.9% 41.1%
Race/ethnicity
Hispanic 13.2% 46.1% 12.2% 2.8% 4.8% 10.0% 15.8% 7.6% 5.8% 34.9%
White 14.5% 4.9% 19.7% 4.9% 13.5% 23.7% 5.8% 11.6% 10.9% 48.6%
African American 32.0% 6.7% 6.1% 1.7% 34.1% 0.4% 24.6% 31.3% 1.2% 11.4%
Other 15.7% 8.4% 25.5% 12.7% 9.9% 16.4% 14.1% 16.1% 13.5% 36.0%
Age
18–24 12.0% 9.2% 11.0% 2.2% 11.0% 18.8% 24.6% 10.7% 8.3% 55.9%
25–34 12.5% 9.3% 13.5% 3.7% 9.2% 20.4% 13.8% 13.4% 10.1% 49.7%
35–44 15.8% 12.3% 15.6% 3.8% 11.5% 18.6% 5.8% 12.7% 9.5% 46.9%
45–54 16.8% 8.8% 16.7% 4.7% 13.7% 19.2% 3.1% 13.7% 8.6% 42.3%
55–64 21.8% 9.3% 23.0% 5.9% 19.2% 22.6% 2.4% 17.3% 11.3% 37.7%
65–74 19.1% 5.8% 31.3% 9.7% 22.6% 21.3% 1.2% 13.3% 13.0% 30.3%
75+ 14.1% 2.5% 36.5% 9.7% 25.6% 23.1% 0.0% 5.7% 8.5% 14.2%
Highest level of education
Grade school 19.9% 34.2% 19.5% 3.6% 8.0% 9.0% 0.0% 15.8% 10.6% 18.1%
Some high school 9.6% 26.8% 4.4% 3.1% 10.0% 18.2% 11.4% 11.2% 3.0% 32.6%
High school graduate 12.3% 8.4% 8.0% 1.5% 12.8% 22.2% 10.0% 10.0% 4.9% 37.8%
Some college 14.1% 8.5% 13.5% 3.3% 12.9% 21.6% 13.0% 13.8% 7.9% 47.5%
College graduate 17.8% 7.6% 23.9% 5.9% 14.9% 19.4% 6.0% 14.8% 12.7% 48.2%
Graduate school 21.1% 9.3% 31.8% 10.1% 18.1% 17.2% 3.5% 12.8% 15.3% 38.9%
Family income
Less than $20K 17.3% 12.3% 16.0% 5.0% 20.8% 20.2% 10.7% 12.2% 11.4% 34.5%
$20K to $50K 13.1% 12.0% 13.2% 3.2% 15.8% 18.9% 14.0% 14.8% 9.4% 39.2%
$50K to $75K 17.1% 10.8% 15.6% 4.4% 15.1% 21.9% 6.4% 13.1% 10.0% 39.9%
$75K to $100K 13.2% 6.4% 19.8% 5.7% 12.5% 22.7% 6.3% 10.6% 8.1% 50.7%
$100K to $150K 17.7% 5.4% 21.8% 6.0% 10.5% 21.2% 6.9% 12.4% 10.3% 50.8%
$150K and over 18.3% 7.0% 25.5% 5.5% 12.3% 15.9% 6.3% 14.2% 10.0% 45.8%
Gray shaded box indicates that the estimate is significantly different from the overall 2012 estimate at the .05 level

A child uses a cell phone to see infrared “lightning” in Dan Goods’s Beneath the Surface installation. The piece simulated the experience that the Juno spacecraft might have as it explores the atmosphere of Jupiter. Photo courtesy of NASA/JPL-Caltech
Chapter 2. Arts Consumption through Electronic Media

2012 survey of public participation in the arts • 26
Sample Findings
• Americans were more likely to watch or listen to broadcast arts performances using traditional sources such as TV and radio than the Internet (54 percent compared with 45 percent).
• In 2012, literature was the only arts genre that drew a larger audience by the Internet than by TV or radio.
• Nearly half of all American adults watched or listened to a broadcast or recorded performance of rock, pop, country, folk, rap, or hip-hop music in 2012. This far surpasses the number of Americans who attended any benchmark arts event in 2012.
• Jazz is the only performing art listened to by equal numbers of men and women.
• Opera participation exclusively via media has the smallest audience of any performing art form studied in the SPPA. It also has the smallest participation rate for any performing art form attended live. Women make up 62 percent of the opera media audience.
• The audience for Latin music is younger than for nearly all other broadcast or recorded performances. It is also the least educated. Seventy-five percent of the Latin music audience has less than a college degree.
• Among all types of performing art forms captured by the SPPA, musical plays and non-musical plays have the unique distinction of attracting more participants through live events than through broadcast or recorded media.
• Over two-thirds of people watching dance performances via media in 2012 were women. Nearly three-quarters of the adult audience was 25 to 64.
• Over one-fourth of American adults shared photography using a computer, mobile device, or the Internet, and one-fifth shared music.
• In 2012 over half the American adult population (53 percent) used a handheld or mobile device, such as a smart phone, MP3 player, eBook reader, or a laptop, notebook or tablet computer, and about one-third of adults (and nearly two-thirds of mobile device users) used an electronic device to download, watch, or listen to music.

27 • chapter 2. arts consumption through electronic media
The rapid evolution of new media platforms over the past three decades has posed a recurring challenge to SPPA investigators as they attempt to gauge the expansive role of technology in driving arts participation patterns. Over the years, the survey’s questions about media and technology have changed accordingly—a factor that limits long-term trend analyses. This section, therefore, focuses on arts consumption through media in 2012, the most recent survey year.
In 2012, 71 percent of U.S. adults watched or listened to the arts through some form of electronic media. This estimate includes people who consumed arts via their TV or radio, the Internet, a handheld or mobile device, or a DVD, CD, tape, or record player.
Watching or Listening to Arts Broadcasts or Recordings via TV/Radio or the Internet
The 2012 SPPA questions on arts consumption via electronic media began with questions about watching or listening to arts broadcasts via TV, radio, or the Internet. The introductory language to this section of the survey stated: “The following questions are about ways people use television, radio, the Internet, and other electronic media. We will first be asking about traditional media such as TV and radio and then ask a few questions about the use of the Internet and handheld or mobile devices.”
This phrasing was meant to encourage respondents to differentiate TV/radio5 from the Internet, even though the Internet can be used as a platform for experiencing either of those more traditional media. Indeed, the 2012 survey results showed that more adults reported consuming arts broadcasts or recordings via TV or radio than reported using the Internet to do so (54 percent of U.S. adults, compared with 45 percent). It is nonetheless impressive that nearly half of all adults consumed art broadcasts or recordings via the Internet, given that a free format for video streaming on the Internet was not implemented until 20026.
5 Respondents were not asked to respond about TV separately from radio.
6 In 2002, Adobe Flash became the first standardized video streaming format that
could be downloaded for free, giving a much larger audience the ability to do
video streaming online.
Types of broadcasts or recordings Figure 2-1 shows that 47 percent of U.S. adults used TV/radio or the Internet to consume broadcasts or recordings of rock, pop, country, folk, rap, or hip-hop music—far more media participants than for any other art form. Classical music was the next most commonly viewed or heard art form via broadcast or recording (14 percent of adults), followed by Latin, Spanish, or salsa music (13 percent), and jazz (12 percent). In addition, 10 percent of adults viewed or listened to programs or information about books or writers.
In addition, 27 percent of U.S. adults reported using a DVD, CD player, or record or tape player to watch or listen to music or programs about theater, dance, visual arts, or literature. People who reported using these types of devices were not asked specifically about the types of art broadcasts or recordings they watched or listened to. However, because this question came after survey items about TV or radio, respondents most likely included watching or listening via DVD, CD, or tape player in their responses to the list of activities done via TV or radio.
Figure 2-1. Number and percentage of U.S. adults who used TV/radio or the Internet to watch or listen to an arts broadcast or recording at least once in the past 12 months: 2012
Percentage Number of adults
2012 2012
Jazz 11.8% 27,729,238
Latin, Spanish, or salsa music 12.6% 29,609,187
Classical music 13.6% 31,959,122
Opera 4.3% 10,104,722
Other music, such as rock, pop, country, folk, rap, or hip-hop
46.9% 110,211,972
Theater productions, such as a musical or stage play
7.1% 16,684,542
Ballet, modern, or contemporary dance
4.5% 10,574,709
Other dance programs or shows 9.2% 21,619,406
Programs or information about the visual arts
9.4% 22,089,393
Programs or information about books or writers
10.0% 23,499,354
Other books, short stories, or poetry read aloud
7.1% 16,684,542

2012 survey of public participation in the arts • 28
TV/radio versus the InternetFigure 2-2 and Charts 2-1 and 2-2 reveal differences in the percentage of the population who use TV and/or radio versus the Internet to consume arts broadcasts or recordings. In 2012, TV and radio were used more often than the Internet to watch or listen to each type of arts performance or programming specified, with one exception. Five percent of adults used the Internet to watch or listen to books, short stories, or poetry read aloud, compared with 4 percent for TV/radio broadcasts or recordings of such activity.
Overall, a quarter of the adult population watched or listened to rock, pop, country, folk or hip-hop over the Internet in 2012. That year, 14 percent of adults watched or listened to classical music through electronic media in general, and just over twice that number of adults reported watching or listening to classical music on TV/ radio versus the Internet. (DVDs, CDs, tape players, or record players were not named specifically in the question, but there is no reason to believe that respondents excluded them.)
Chart 2-1. Percentage of U.S. adults who consumed music via TV/radio, the Internet, or both: 2012
0%
5%
10%
15%
20%
25%
30%
35%
40%
45%
50%
Other musicOperaClassicalLatinJazz
2.2%
3.0%
6.6%
2.1%
3.3%
7.2%
1.9%
3.9%
7.8%0.8%2.8%
6.8%
18.1%
22.0%
0.7%
TV/radio Both Internet
Figure 2-2. Number and percentage of U.S. adults who watched or listened to an arts broadcast or recording at least once in the past 12 months via TV/radio or the Internet: 2012
TV or radio Internet TV/radio, Internet, or both
Estimated number of adults
Jazz 9.6% 5.2% 11.8% 27,729,238
Latin, Spanish, or salsa music
10.5% 5.4% 12.6% 29,844,180
Classical music 11.7% 5.8% 13.6% 31,959,122
Opera 3.6% 1.5% 4.3% 10,104,722
Other music, such as rock, pop, country, folk, rap, or hip-hop
40.1% 24.9% 46.9% 109,976,979
Theater productions, such as a musical or stage play
6.2% 2.1% 7.1% 16,684,542
Ballet, modern, or contemporary dance
3.9% 1.3% 4.5% 10,574,709
Other dance programs or shows
8.3% 2.2% 9.2% 21,619,406
Programs or information about the visual arts
7.6% 4.1% 9.4% 22,089,393
Programs or information about books or writers
7.5% 5.3% 10.0% 23,499,354
Other books, short stories, or poetry read aloud
3.8% 4.6% 7.1% 16,684,542
Chart 2-2. Percentage of U.S. adults who used TV/radio, the Internet, or both, to consume selected types of arts broadcasts, by type: 2012
0%
2%
4%
6%
8%
10%
12%
Literature read aloud
Books/writers
Visual arts
Other dance
Ballet/modern
Theater
1.2%
0.9%
5.3%
0.7%
0.6%
3.3%
1.3%
0.9%
7.4%
2.3%
1.8%
5.8%
2.8%
2.5%
5.0%
2.1%
3.2%
1.3%
TV/radio Both Internet

29 • chapter 2. arts consumption through electronic media
Audience Demographics for Arts Broadcasts or Recordings
Figure 2-3 shows the demographic make-up of 2012 audiences for different types of performing arts broadcasts or recordings, and Figure 2-4 shows the rate at which demographic subgroups consumed those artworks.
Jazz. Twelve percent of adults listened to jazz via media broadcast. Jazz is the only performing art form listened to by equal percentages of men and women (Figure 2-4). Forty percent of American adults watching and listening to jazz are 45 to 64. African Americans experience jazz via broadcasts or recordings at a higher rate than do non-Hispanic whites and other racial/ethnic groups (see Chart 2-3). Hispanic Americans are the least likely to watch or listen to jazz. About one-fifth of all adults with graduate degrees reported listening to or watching jazz via media in 2012.
Classical music. Women constitute more of the classical music audience (via broadcasts or recordings) than do men. Half the adults who watch or listen to classical music via media are 25 to 54 years old. About 29 percent of people who have a graduate education reported watching or listening to classical music via media, compared with 7 percent of respondents who had completed high school but did not attend college.
Opera. Opera participation exclusively via media has the smallest audience of any performing art studied in the SPPA. It also has the smallest participation rate of the performing art forms attended live. In 2012, about 4 percent of adults reported watching or listening to opera broadcasts or recordings. Rates of participation through media increase with age (7 percent of adults 75 and older watch or listen to opera via media, compared with 3 percent of adults 18 to 24), income (7 percent of Americans earning $150,000 or more watch or listen, compared with 4 percent in the lowest income bracket), and formal education (9 percent of people with graduate degrees, compared with 3 percent of high school graduates). Women make up 62 percent of the opera media audience (Figure 2-3).
Latin music. About 13 percent of adults listened to or watched Latin music via media in 2012. Roughly equal proportions of women and men watch or listen to Latin music. Hispanics represent 56 percent of people watching or listening to Latin music, and non- Hispanic whites form 35 percent of the media audience (see Figure 2-3).
As shown in Figure 2-4, about 47 percent of Latinos watch or listen to Latin music, compared with 7 percent of non-Hispanic whites and 7 percent of African Americans. Younger adults are the most likely to listen to Latin music. The audience for Latin music is younger than for all other broadcast performances except for other music. It is also
the least educated. Seventy-five percent of the Latin music audience has less than a college degree.
Other music. Similar proportions of men and women watch or listen to other music broadcasts or recordings—rock, pop, country, folk, rap, or hip-hop—as shown in Figure 2-4. The age group most likely to watch or listen to other music is 18 to 24; the group least likely is 75 and older. Although young adults are the most likely to listen to other music, the likelihood increases with formal education. Individuals with less than a high school diploma are the least likely to listen to other music. Of the adults who listen to other music, 73 percent are non-Hispanic white.
Theater productions. Among all types of performing arts captured by the SPPA, musical plays and non-musical plays have the unique distinction of attracting more participants through live events than through broadcast or recorded media. About 7 percent of adults reported watching or listening to theater productions through media in the 2012 SPPA. By contrast, almost double that proportion—15 percent of U.S. adults—reported seeing a live musical play in 2012, and 8 percent saw a non-musical play. Adults with the most education and the highest income are the most likely to watch a theater production broadcast or recording. The audience for this type of performance is predominantly non-Hispanic white (77.5 percent) (see Figure 2-3).
Dance. Unlike the survey questions for live arts participation, the media-related questions did not ask separately about ballet. Rather, the 2012 question grouped together ballet, modern, and contemporary dance. About 5 percent of adults watched or listened to a recorded or broadcasted dance performance.
Over two-thirds of people watching dance performances via media in 2012 were women. Nearly three-quarters of the audience was 25 to 64. Young adults age 18 to 24 were the least likely to watch a dance performance. Participation in dance via broadcast media is greatest for people with more formal education. Ballet (and theater) had the highest reported audience of adults in the “other” race/ethnicity category (8.5 percent) (see Figure 2-3).
Other dance. A question new to the 2012 SPPA asked about “other” dance, such as ballroom, swing, hip-hop, or country dancing. Nine percent of adults, two-thirds of them women, watched other dance via electronic media in 2012. The audience for other types of dance performances is comprised primarily of non-white Hispanics (70 percent of the audience) and adults with a high school diploma, some college, or a college degree (79 percent). The greater the income and the higher the education, the more likely an American is to watch a broadcast dance performance.

2012 survey of public participation in the arts • 30
Figure 2-3. Demographic distribution of U.S. adults watching or listening to performing arts broadcasts or recordings via TV/radio or the Internet at least once in the past 12 months, by art form: 2012
2012 U.S. adult population
Jazz Classical music
Opera Latin, Spanish, or salsa music
Other music Theater production,
e.g., a musical or stage play
Ballet/ modern/
contempo-rary dance
Other dance programs or
showsMillions Percent
Gender
Male 113.1 48.1% 48.0% 42.8% 37.8% 48.8% 48.3% 39.1% 30.8% 33.1%
Female 121.9 51.9% 52.0% 57.2% 62.2% 51.2% 51.7% 60.9% 69.2% 66.9%
Total 100.0% 100.0% 100.0% 100.0% 100.0% 100.0% 100.0% 100.0%
Race/ethnicity
Hispanic 35.0 14.9% 10.5% 9.9% 11.8% 55.6% 11.1% 7.2% 13.1% 10.8%
White 155.7 66.3% 63.9% 77.3% 73.8% 35.4% 72.4% 77.3% 67.3% 70.1%
African American 26.8 11.4% 18.6% 5.8% 8.0% 6.0% 9.9% 9.8% 11.1% 10.7%
Other 17.5 7.4% 7.0% 6.9% 6.4% 3.0% 6.6% 5.6% 8.5% 8.4%
Total 100.0% 100.0% 100.0% 100.0% 100.0% 100.0% 100.0% 100.0%
Age
18–24 30.4 13.0% 10.2% 7.7% 7.7% 13.8% 16.2% 8.7% 8.6% 11.3%
25–34 41.0 17.4% 16.2% 17.0% 15.9% 23.1% 21.1% 15.1% 18.4% 16.7%
35–44 39.6 16.9% 19.1% 16.2% 13.9% 20.4% 17.8% 13.4% 15.3% 16.4%
45–54 43.7 18.6% 18.6% 16.5% 16.3% 15.6% 18.1% 19.0% 18.6% 18.4%
55–64 38.3 16.3% 21.0% 17.8% 20.0% 15.1% 15.3% 21.4% 19.2% 18.6%
65–74 23.8 10.1% 10.2% 14.7% 14.0% 6.9% 7.7% 12.2% 10.0% 11.4%
75+ 18.1 7.7% 4.8% 10.1% 12.2% 5.0% 3.7% 19.3% 9.8% 7.3%
Total 100.0% 100.0% 100.0% 100.0% 100.0% 100.0% 100.0% 100.0%
Highest level of education
Grade school 9.9 4.2% 0.8% 0.9% 1.0% 8.8% 1.0% 0.7% 1.1% 1.6%
Some high school 19.0 8.1% 3.6% 3.1% 4.1% 12.8% 5.7% 1.7% 4.5% 5.8%
High school graduate 70.9 30.2% 18.8% 15.9% 17.7% 25.6% 27.2% 17.1% 17.1% 21.7%
Some college 68.7 29.2% 32.6% 29.8% 28.0% 27.4% 33.5% 32.7% 31.3% 34.6%
College graduate 43.0 18.3% 26.3% 28.4% 27.3% 14.2% 20.9% 27.6% 29.3% 22.9%
Graduate school 23.5 10.0% 18.0% 21.9% 22.0% 11.2% 11.6% 20.3% 16.6% 13.4%
Total 100.0% 100.0% 100.0% 100.0% 100.0% 100.0% 100.0% 100.0%
Family income
Less than $20K 40.9 17.4% 13.0% 13.2% 16.1% 20.0% 14.6% 12.1% 13.8% 13.2%
$20K to $50K 76.0 32.3% 26.3% 24.9% 29.0% 33.9% 28.6% 23.9% 27.7% 27.8%
$50K to $75K 43.9 18.7% 20.4% 20.0% 17.5% 19.9% 19.7% 21.6% 18.7% 20.4%
$75K to $100K 27.6 11.7% 12.0% 13.5% 11.2% 9.9% 13.5% 13.1% 13.3% 11.2%
$100K to $150K 27.1 11.5% 16.0% 14.8% 13.1% 9.9% 14.2% 14.8% 13.5% 16.4%
$150K and over 19.6 8.3% 12.3% 13.5% 13.1% 6.5% 9.5% 14.4% 13.0% 10.9%
Total 100.0% 100.0% 100.0% 100.0% 100.0% 100.0% 100.0% 100.0%

31 • chapter 2. arts consumption through electronic media
Figure 2-4. Percentage of U.S. adults watching or listening to arts broadcasts or recordings via TV/radio or the Internet at least once in the past 12 months: 2012
2012 U.S. adult population
Jazz Classical music
Opera Latin, Spanish, or salsa music
Other music Theater productions musical or stage plays
Ballet/ modern/
contempo-rary dance
Other dance programs or
showsMillions Percent
all adults 235.0 100.0% 11.8% 13.6% 4.3% 12.6% 46.9% 7.1% 4.5% 9.2%
Gender
Male 113.1 48.1% 11.8% 12.1% 3.4% 12.8% 47.3% 5.8% 2.9% 6.3%
Female 121.9 51.9% 11.8% 14.9% 5.1% 12.4% 46.5% 8.4% 6.0% 11.8%
Race/ethnicity
Hispanic 35.0 14.9% 8.2% 8.9% 3.4% 46.4% 34.5% 3.4% 3.9% 6.6%
White 155.7 66.3% 11.4% 15.9% 4.8% 6.8% 51.4% 8.4% 4.6% 9.7%
African American 26.8 11.4% 19.6% 7.1% 3.1% 6.8% 41.3% 6.2% 4.5% 8.7%
Other 17.5 7.4% 10.8% 12.3% 3.6% 5.0% 40.3% 5.3% 5.0% 10.1%
Age
18–24 30.4 13.0% 9.6% 8.3% 2.6% 13.9% 60.5% 4.9% 3.1% 8.3%
25–34 41.0 17.4% 10.7% 13.0% 3.8% 16.3% 55.5% 6.0% 4.7% 8.6%
35–44 39.6 16.9% 12.9% 12.7% 3.4% 14.8% 48.1% 5.5% 4.0% 8.6%
45–54 43.7 18.6% 12.0% 12.3% 3.9% 10.8% 46.6% 7.5% 4.6% 9.3%
55–64 38.3 16.3% 15.7% 15.4% 5.5% 12.1% 45.7% 9.7% 5.5% 10.8%
65–74 23.8 10.1% 11.5% 19.1% 5.7% 8.3% 34.5% 8.3% 4.3% 10.0%
75+ 18.1 7.7% 7.2% 17.6% 6.7% 8.1% 22.1% 9.4% 5.7% 8.6%
Highest level of education
Grade school 9.9 4.2% 2.2% 3.0% 1.1% 27.6% 12.2% 1.2% 1.3% 3.6%
Some high school 19.0 8.1% 5.3% 5.3% 2.2% 20.2% 33.5% 1.5% 2.5% 6.6%
High school graduate 70.9 30.2% 7.4% 7.2% 2.5% 10.7% 42.3% 4.1% 2.6% 6.6%
Some college 68.7 29.2% 13.3% 14.0% 4.2% 11.9% 54.3% 8.1% 4.9% 11.0%
College graduate 43.0 18.3% 16.7% 20.8% 6.3% 9.7% 52.8% 10.6% 7.1% 11.3%
Graduate school 23.5 10.0% 20.4% 28.6% 9.1% 13.6% 52.2% 13.9% 7.2% 11.8%
Family income
Less than $20K 40.9 17.4% 8.7% 10.2% 3.9% 14.2% 38.7% 4.9% 3.5% 6.8%
$20K to $50K 76.0 32.3% 9.9% 10.8% 4.0% 13.6% 42.6% 5.4% 4.0% 8.1%
$50K to $75K 43.9 18.7% 12.7% 14.3% 4.0% 13.2% 48.5% 8.1% 4.4% 9.9%
$75K to $100K 27.6 11.7% 11.9% 15.5% 4.0% 10.5% 53.0% 7.9% 5.1% 8.7%
$100K to $150K 27.1 11.5% 15.9% 16.9% 4.7% 10.5% 55.7% 8.9% 5.1% 12.7%
$150K and over 19.6 8.3% 18.0% 22.8% 7.0% 10.2% 55.2% 12.8% 7.3% 12.4%
Gray Shaded Box indicates that the estimate is significantly different from the overall 2012 estimate at the .05 level

2012 survey of public participation in the arts • 32
Visual Arts Programs
Respondents to the 2012 SPPA were asked if they had watched or listened to a broadcasted or recorded program about the visual arts within the last 12 months. Such programs might have featured, for example, painting, sculpture, graphic design, or photography. The wording of this question was new to the 2012 SPPA instrument. Results indicate that 9 percent of adults, about 22 million people, had watched or listened to a program on the visual arts in 2012. People most likely to watch or listen to visual arts-related programs are high-income earners and those who hold a college or graduate degree (14 percent of the highest income earners and 18 percent of people with a graduate degree watch or listen to visual arts programs). (See Figure 2-5 and Chart 2-3.)
Literary Programs
The SPPA asked respondents whether they had watched or listened to a program or to information about books or writers. Ten percent of American adults (about 23.5 million) watched or listened to a program about books or writers in 2012 (Figure 2-5) and about 5 percent (approximately 12.5 million) used the Internet to watch or listen to a program about books or writers (Figure 2-6). The likelihood that a person watches or listens to a program on books or writers rises with income and education. In fact, as shown in Chart 2-3, formal education has more of an impact on watching or listening to programs about books or writers than it does on listening to books, short stories, or poetry read aloud or watching or listening to a program on the visual arts. Nearly one-quarter of people with a graduate degree reported watching or listening in 2012. Sixty percent of the audience for programs on books or writers is female, and 76 percent is non-Hispanic white.
Books, Short Stories, or Poetry Read Aloud
Respondents to the 2012 SPPA were asked if they had used the Internet to listen to live or recorded books, short stories, or poetry read aloud in the past 12 months. Seven percent of U.S. adults, or about 16.4 million people, had listened to live or recorded books, short stories, or poetry on the Internet. People of all ages are about equally likely to listen (with the exception of adults 75 and older, who are less likely), and rates of listening increase with formal education and income. Women are more likely than men to listen to literature read aloud. Listening to live or recorded literature is the only arts genre that drew a larger audience by the Internet than by TV or radio (Figure 2-2).
Chart 2-3. Percentage of U.S. adults who used TV/radio, the Internet, or both, to consume selected arts broadcasts or recordings, by highest level of educational attainment: 2012
0%
5%
10%
15%
20%
25%
30%
Books, stories, or poetry read aloud
Programs about books or writers
Programs about visual arts
Some college College Graduate school
Grade school Some high school High school
3.9%3.4%
4.9%
10.6%
13.5%
18.2%
2.0%1.8%
4.8%
9.7%
15.9%
24.4%
0.2%
2.8%
7.4%
10.8%
4.1%
14.1%

33 • chapter 2. arts consumption through electronic media
Figure 2-5. Percentage and demographic distribution of U.S. adults watching or listening to arts broadcasts or recordings via TV/radio or the Internet at least once in the past 12 months: 2012
2012 U.S. adult population Visual arts programs Programs on books or writers Books, short stories, or poetry read aloud
Millions Percent Distribution % of subgroup Distribution % of subgroup Distribution % of subgroup
9.4% 10.0% 7.1%
Gender
Male 113.1 48.1% 45.7% 8.9% 40.0% 8.3% 37.6% 5.5%
Female 121.9 51.9% 54.3% 9.8% 60.0% 11.5% 62.4% 8.5%
Total 100.0% 100.0% 100.0%
Race/ethnicity
Hispanic 35.0 14.9% 10.0% 6.2% 8.0% 5.3% 10.4% 4.9%
White 155.7 66.3% 76.1% 10.8% 76.1% 11.5% 72.3% 7.7%
African American 26.8 11.4% 6.5% 5.4% 8.1% 7.2% 9.0% 5.6%
Other 17.5 7.4% 7.4% 9.0% 7.7% 10.0% 8.4% 7.7%
Total 100.0% 100.0% 100.0%
Age
18–24 30.4 13.0% 8.9% 6.7% 8.9% 7.1% 13.2% 7.4%
25–34 41.0 17.4% 19.6% 10.3% 17.6% 9.8% 22.1% 8.7%
35–44 39.6 16.9% 13.9% 7.5% 16.6% 9.5% 18.0% 7.3%
45–54 43.7 18.6% 20.1% 10.4% 17.7% 9.7% 16.1% 6.2%
55–64 38.3 16.3% 19.2% 11.4% 20.1% 12.7% 18.7% 8.4%
65–74 23.8 10.1% 10.9% 9.7% 11.5% 11.0% 7.9% 5.4%
75+ 18.1 7.7% 7.4% 8.9% 7.6% 9.7% 4.0% 3.7%
Total 100.0% 100.0% 100.0%
Highest level of education
Grade school 9.9 4.2% 1.7% 3.9% 0.8% 2.0% 0.1% 0.2%
Some high school 19.0 8.1% 2.9% 3.4% 1.4% 1.8% 3.1% 2.8%
High school graduate 70.9 30.2% 15.9% 4.9% 14.4% 4.8% 17.4% 4.1%
Some college 68.7 29.2% 32.6% 10.6% 28.2% 9.7% 30.2% 7.4%
College graduate 43.0 18.3% 26.7% 13.5% 29.6% 15.9% 28.4% 10.8%
Graduate school 23.5 10.0% 20.3% 18.2% 25.6% 24.4% 20.7% 14.1%
Total 100.0% 100.0% 100.0%
Family income
Less than $20K 40.9 17.4% 11.5% 6.1% 10.5% 5.9% 12.0% 4.8%
$20K to $50K 76.0 32.3% 27.2% 8.1% 22.4% 7.1% 24.1% 5.4%
$50K to $75K 43.9 18.7% 20.0% 9.9% 20.8% 10.8% 18.4% 6.8%
$75K to $100K 27.6 11.7% 13.9% 11.0% 13.8% 11.6% 12.9% 7.7%
$100K to $150K 27.1 11.5% 15.1% 11.9% 17.1% 14.3% 17.1% 10.2%
$150K and over 19.6 8.3% 12.3% 14.2% 15.5% 19.1% 15.5% 13.5%
Total 100.0% 100.0% 100.0%
Gray Shaded Box indicates that the estimate is significantly different from the overall 2012 estimate at the .05 level

2012 survey of public participation in the arts • 34
Consuming Art via Internet: Viewing, Listening, or Downloading
This section describes responses from the 2012 respondents who reported using the Internet. Seventy-one percent7 of 2012 SPPA respondents used the Internet for any purpose in the past 12 months, similar to the 70 percent in 2008 but much higher than the 54 percent in 2002. The 71 percent of SPPA respondents who used the Internet were asked if they used the Internet to watch, listen to, or download a variety of arts types.
The most common type of performing arts activity for which Americans use the Internet is to access music such as rock, pop, country, folk, rap, or hip-hop (see Figure 2-6). Twenty-five percent of adults (35 percent of Internet users) watched, listened to, or downloaded these types of music in 2012. The least common use of the Internet was to watch, listen to, or download ballet, modern, or contemporary dance (1 percent of the population, and 2 percent of Internet users), or opera (2 percent of both groups).
7 The Pew Internet & American Life Project and other sources estimate that
between 78 and 80 percent of American adults used the Internet in 2012. One
possible reason the estimate from the SPPA is lower is because of the SPPA’s
focus on arts rather than technology. In other words, infrequent users of
computers or handheld devices may only report using the Internet if they are first
given a list of tasks associated with Internet use.
Figure 2-6. Percentage of U.S. adults who used the Internet to explore the arts in the past 12 months: 2012
Percent of Internet users
Percent of U.S. adult
population
Number of adults
Adult population who used the Internet
71.0% 166,845,416
Used the Internet to watch, listen, or download
Jazz 7.3% 5.2% 12,179,715
Latin, Spanish, or salsa music
7.6% 5.4% 12,680,252
Classical music 8.2% 5.8% 13,681,324
Opera 2.1% 1.5% 3,503,754
Other music 35.1% 24.9% 58,562,741
Theater productions 3.0% 2.1% 5,005,362
Ballet, modern, or contemporary dance
1.8% 1.3% 3,003,217
Dance programs or shows
3.1% 2.2% 5,172,208
Programs about visual arts
5.8% 4.1% 9,677,034
Programs about books or writers
7.4% 5.3% 12,346,561
Books, short stories, poetry read aloud
6.5% 4.6% 10,844,952

35 • chapter 2. arts consumption through electronic media
Using Handheld or Mobile Devices to Watch, Listen to, or Download Art
The SPPA’s section on arts consumption via electronic media also asked adults whether they used any handheld or mobile devices and, if so, whether they did so for the purpose of accessing art.
In 2012, over half the American adult population (53 percent) used a handheld or mobile device, such as a smart phone, MP3 player, eBook reader, or a laptop, notebook, or tablet computer. About one-third of adults (and nearly two-thirds of mobile device users) used the electronic device to download, watch, or listen to music (Figure 2-7). The least common usage was to watch, listen to, or download theater or dance performances.
Women responding to the 2012 SPPA were more likely than men to use a handheld or mobile device to read, listen to, or download novels, short stories, or plays, or to watch or download theater or dance. Younger adults were much more likely to report using such devices in general and also to report using them for accessing art (Chart 2-4). Compared with people who report watching TV or using the Internet, use of a handheld or mobile device is more strongly related to educational and family income. Therefore, and not surprisingly, a large percentage of high income earners (those with family income over $150,000) used handheld or mobile devices to access the arts.
Chart 2-4. Percentage of U.S. adults who consumed art via mobile/handheld device, by art form and age group: 2012
0%
10%
20%
30%
40%
50%
60%
Visual artsTheater or danceMusicLiterature
Age 18-34 Age 35-64 Age 65+
19.8%
17.0%
7.1%
56.7%
30.4%
7.7%5.4%
2.9%1.3%
10.9%
7.9%
2.9%

2012 survey of public participation in the arts • 36
Chart 2-4. Percentage of U.S. adults who consumed art via mobile/handheld device, by art form and age group: 2012
0%
10%
20%
30%
40%
50%
60%
Visual artsTheater or danceMusicLiterature
Age 18-34 Age 35-64 Age 65+
19.8%
17.0%
7.1%
56.7%
30.4%
7.7%5.4%
2.9%1.3%
10.9%
7.9%
2.9%
Figure 2-7. Percentage of U.S. adults who used mobile or handheld devices to explore the arts: 2012
U.S. adult population who used a mobile
or handheld device for any reason
Read, listen to, or download any
novels, short stories, poetry or plays
Watch, listen to, or download any music
Watch, listen to, or download any theater or
dance performances
Download or view any visual arts (paintings,
sculpture, graphic design, photography)
all adults 53.2% 16.0% 34.2% 3.4% 7.9%
population 125,016,565 37,684,035 80,234,551 7,861,239 18,467,673
Gender
Males 54.1% 14.1% 35.2% 2.9% 7.7%
Females 52.4% 17.8% 33.5% 3.9% 8.0%
Race/ethnicity
Hispanic 46.2% 11.4% 31.5% 2.3% 6.2%
White 55.9% 18.2% 35.8% 3.3% 8.6%
African American 46.1% 10.6% 29.6% 4.3% 5.9%
Other 54.7% 14.9% 34.0% 4.9% 8.0%
Age
18–24 71.9% 19.6% 59.5% 6.7% 10.7%
25–34 71.9% 20.0% 54.9% 4.6% 11.0%
35–44 62.7% 18.9% 39.3% 2.8% 9.4%
45–54 51.8% 16.6% 29.1% 3.3% 7.7%
55–64 43.2% 15.2% 22.0% 2.5% 6.2%
65–74 30.6% 9.7% 11.8% 2.1% 4.5%
75+ 13.6% 3.8% 2.4% 0.3% 0.9%
Highest level of education
Grade school 11.9% 1.9% 5.8% 0.2% 0.6%
Some high school 31.3% 6.6% 19.9% 2.1% 3.0%
High school graduate 40.6% 8.1% 24.3% 2.4% 3.8%
Some college 59.8% 17.3% 39.6% 3.0% 7.8%
College graduate 70.1% 24.1% 46.1% 5.4% 13.2%
Graduate school 74.5% 34.0% 49.5% 5.9% 17.3%
Family income
Less than $20K 35.1% 8.0% 21.0% 2.3% 4.5%
$20K to $50K 44.3% 10.7% 27.7% 2.9% 5.8%
$50K to $75K 56.3% 15.7% 34.6% 3.0% 8.5%
$75K to $100K 65.7% 20.7% 43.0% 4.4% 9.2%
$100K to $150K 70.4% 24.2% 47.5% 4.0% 10.4%
$150K and over 77.0% 36.3% 55.9% 6.0% 17.0%
Gray Shaded Box indicates that the estimate is significantly different from the overall 2012 estimate at the .05 level

Chapter 3. Creating, Performing, and Sharing Art
Visual arts students at the South Carolina Governor’s School for the arts paint in the studio. Photo Courtesy of Emily Allen

2012 survey of public participation in the arts • 38
Sample Findings
• Social dancing is the most common way Americans performed art in 2012, followed by playing a musical instrument.
• Women are more likely than men to dance. African Americans are the racial/ethnic group most likely to dance formally, and Hispanics are the racial/ethnic group most likely to dance socially. The rates of dance participation are highest for young adults (18 to 34) and increase with educational level and family income.
• Likelihood of performing arts with others is inversely related to age—younger adults are far more likely than older adults to perform with others—and positively related to education: the greater the education, the more likely a person is to perform with others.
• Among Americans of all racial/ethnic backgrounds, African Americans are the most likely to perform art in a group.
• The percentage of American adults who performed or practiced jazz, classical music, or opera has not changed much since 2002.
• The percentage of people in a choral or glee club or who performed in a musical or non-musical stage play has declined since 2002.
• Nineteen percent of American adults in 2012 used electronic media to share art that they themselves had created, edited, or remixed.
• Men are more likely than women to use electronic media to create, perform, or share art. This pattern stands in contrast to most forms of arts participation, in which women typically lead men.
• Large proportions of adults who create music or visual art do so through electronic media. African Americans are more likely than any other racial/ethnic group to have created or performed their art in this way.
• Twelve percent of Americans take photographs for artistic purposes, making photography the most common form of arts creation. Scrapbooking is the second most common form.

39 • chapter 3. creating, performing, and sharing art
The SPPA captured arts participation far beyond attending, watching, and listening to live or broadcasted performances. It also measured levels of participation through performing, creating, and sharing artwork. The 2012 SPPA used a broader definition of creating or performing arts than past SPPA studies by including social dancing, informal singing, and a few other new or more broadly defined arts activities.
The 2012 SPPA also asked, for the first time, questions about how art is shared, edited, and preserved. Similar to findings reported in the previous chapter on arts participation through the media, technology has altered how people engage in various art activities. The 2012 SPPA asked people if they used a computer, a handheld or mobile device, or the Internet to share, create, perform, edit, or remix art. Overall, about 43 percent of American adults, or 102 million people, reported that they had done so in the past year.
Performing Art, Alone or with Others
The 2012 SPPA captured performances in the arts, both formal and informal, including playing a musical instrument, acting, dancing, and singing. Nearly one- third of American adults, or 74 million people, engaged in social dancing, making it the most common way Americans performed an art (see Figure 3-1).
Figure 3-1. Percentage of Americans and millions of U.S. adults engaging in the performing arts: 2012
Percent of 2012 population
Estimated number of adults
Play a musical instrument
12.1% 28,434,219
Play a musical instrument (with others)
5.1% 11,984,671
Do any acting 1.4% 3,289,910
Do any social dancing
31.6% 74,257,960
Do any formal dancing 5.1% 11,984,671
Perform or practice singing
8.7% 20,444,438
Do any singing with other people
6.8% 15,979,561
Playing a musical instrumentTwelve percent of Americans played a musical instrument in the past 12 months, about the same as in 2008. Five percent played a musical instrument as part of a group. Playing a musical instrument is the second most common way adults personally perform the arts (behind social dancing).
Of adults who played an instrument in the past year, 53 percent are men, and over one-third are under 35 years of age. The likelihood of playing a musical instrument increases with education and family income. With regard to race and ethnicity, 14 percent of non-Hispanic white adults played an instrument, compared with 7 percent of African Americans and Hispanics.
ActingSlightly more than one percent of adults engaged in acting during the last 12 months (Figure 3-1). The proportions of male and female thespians are equal. African Americans are about twice as likely to be involved in acting as whites, and young adults aged 18 to 24 are at least twice as likely as all other age groups to act (see Figure 3-3). Likelihood of acting increases with educational level.
DancingDancing is the most common way American adults perform art. Social dancing, such as ballroom, hip-hop, swing, or country line dance, is more popular than formal dance performance, which includes ballet, modern, jazz, or tap dance. Nearly one-third of adults (32 percent) engaged in social dancing during the past year, and about 5 percent engaged in more formal kinds of dancing.
Women are more likely than men to dance. African Americans are the racial and ethnic group most likely to dance formally, and Hispanics are the groups most likely to dance socially. The rates of dance participation are highest for younger adults (18 to 34) and increase with educational level and family income.
Chart 3-1 shows that younger adults (18 to 24) are quite active at both social dancing and playing a musical instrument. However, the number of adults playing a music instrument quickly declines after age 25, while social dancing doesn’t see a decline until age 35. After age 25, there is not any other significant decline in playing a musical instrument, while social dancing declines more steadily after age 35.

2012 survey of public participation in the arts • 40
SingingNine percent of Americans performed or practiced singing during the last 12 months, and 7 percent sang with others. As singers, women outnumber men. African Americans are more likely to be singers than are adults of any other racial or ethnic group, and 18- to 24-year-olds are more likely to sing than are adults of any other age group. The likelihood of singing increases with educational level and family income.
Performing with OthersCompared with previous SPPA studies, the 2012 survey questionnaire defined performing art in broader terms. There were survey questions about solo performing in addition to performing with others. About 15 percent of adults in the 2012 SPPA performed art with others (Figure 3-3). Likelihood of performing is inversely related to age—younger adults are far more likely than older adults to perform with others—and is positively related to education: the greater the educational level, the more likely is a person to perform with others. African Americans are the racial/ethnic group most likely to perform with others (17 percent).
Chart 3-1. Percentage of U.S. adults who played a musical instrument and/or did social dancing, by age group: 2012
0%
10%
20%
30%
40%
50%
Age 75+Age 65–74Age 55–64Age 45–54Age 35–44Age 25–34Age 18–24
Social dancingPlaying an instrument
41.5% 41.8%
32.0% 31.6%
27.1%
22.6%
12.5%
6.9%
9.9%10.9%11.1%12.2%11.5%
20.6%

41 • chapter 3. creating, performing, and sharing art
Figure 3-2. Demographic distribution of U.S. adults engaging in the performing arts, by activity: 2012
2012 U.S. adult population Playing a musical
instrument
Acting Performing formal dance
Dancing socially
Singing Perform with others
Millions Percent
all adults 235.0 100.0% 100.0% 100.0% 100.0% 100.0% 100.0% 100.0%
Gender
Male 113.1 48.1% 52.7% 48.5% 37.8% 45.5% 42.4% 46.7%
Female 121.9 51.9% 47.3% 51.5% 62.2% 54.5% 57.6% 53.3%
Total 100.0% 100.0% 100.0% 100.0% 100.0% 100.0% 100.0%
Race/ethnicity
Hispanic 35.0 14.9% 8.7% 8.8% 16.8% 17.8% 9.7% 11.9%
White 155.7 66.3% 75.8% 67.2% 61.4% 64.9% 67.3% 68.4%
African American 26.8 11.4% 6.5% 20.3% 13.2% 10.6% 16.0% 12.3%
Other 17.5 7.4% 9.0% 3.8% 8.6% 6.6% 7.1% 7.3%
Total 100.0% 100.0% 100.0% 100.0% 100.0% 100.0% 100.0%
Age
18–24 30.4 13.0% 21.7% 28.0% 19.2% 16.7% 17.5% 19.7%
25–34 41.0 17.4% 16.5% 19.9% 18.6% 23.0% 14.9% 16.0%
35–44 39.6 16.9% 17.2% 14.7% 15.2% 17.2% 15.0% 15.5%
45–54 43.7 18.6% 17.3% 13.2% 19.2% 18.8% 19.0% 18.5%
55–64 38.3 16.3% 14.7% 14.0% 15.5% 14.0% 18.5% 16.4%
65–74 23.8 10.1% 8.2% 7.6% 8.0% 7.2% 9.0% 8.8%
75+ 18.1 7.7% 4.5% 2.6% 4.4% 3.1% 6.3% 5.0%
Total 100.0% 100.0% 100.0% 100.0% 100.0% 100.0% 100.0%
Highest level of education
Grade school 9.9 4.2% 0.5% 2.4% 1.9% 2.3% 2.0% 1.5%
Some high school 19.0 8.1% 3.5% 4.9% 4.0% 5.7% 4.8% 4.6%
High school graduate 70.9 30.2% 19.3% 19.3% 23.9% 24.1% 23.5% 23.1%
Some college 68.7 29.2% 33.5% 29.1% 35.9% 30.6% 32.2% 33.8%
College graduate 43.0 18.3% 25.9% 30.4% 20.5% 24.6% 23.8% 22.6%
Graduate school 23.5 10.0% 17.3% 13.8% 13.8% 12.8% 13.7% 14.4%
Total 100.0% 100.0% 100.0% 100.0% 100.0% 100.0% 100.0%
Family income
Less than $20K 40.9 17.4% 13.9% 19.5% 12.2% 11.9% 17.6% 14.6%
$20K to $50K 76.0 32.3% 24.1% 24.1% 29.4% 26.9% 28.0% 27.0%
$50K to $75K 43.9 18.7% 22.1% 23.5% 18.2% 19.5% 19.2% 20.6%
$75K to $100K 27.6 11.7% 13.7% 10.0% 16.0% 14.3% 13.0% 14.2%
$100K to $150K 27.1 11.5% 13.9% 11.1% 13.2% 15.5% 12.8% 13.3%
$150K and over 19.6 8.3% 12.3% 11.9% 10.9% 11.9% 9.5% 10.4%
Total 100.0% 100.0% 100.0% 100.0% 100.0% 100.0% 100.0%

2012 survey of public participation in the arts • 42
Figure 3-3. Percentage of U.S. adults engaging in the performing arts, by activity: 2012
2012 U.S. adult population Playing a musical
instrument
Acting Performing formal dance
Dancing socially
Singing Perform with others
Demographics on performing art
Millions Percent
all adults 235.0 100.0% 12.1% 1.4% 5.1% 31.6% 8.7% 14.8%
Gender
Male 113.1 48.1% 13.2% 1.4% 4.0% 29.8% 7.7% 14.4%
Female 121.9 51.9% 11.0% 1.4% 6.1% 33.1% 9.7% 15.2%
Race/ethnicity
Hispanic 35.0 14.9% 6.8% 0.8% 5.5% 36.3% 5.5% 11.5%
White 155.7 66.3% 13.9% 1.4% 4.8% 31.2% 8.9% 15.4%
African American 26.8 11.4% 7.2% 2.6% 6.2% 30.9% 12.8% 16.7%
Other 17.5 7.4% 13.5% 0.7% 5.5% 26.2% 7.7% 13.6%
Age
18–24 30.4 13.0% 20.6% 3.1% 7.7% 41.5% 12.0% 23.0%
25–34 41.0 17.4% 11.5% 1.6% 5.5% 41.8% 7.5% 13.7%
35–44 39.6 16.9% 12.2% 1.2% 4.5% 32.0% 7.7% 13.5%
45–54 43.7 18.6% 11.1% 1.0% 5.2% 31.6% 8.8% 14.7%
55–64 38.3 16.3% 10.9% 1.2% 4.8% 27.1% 9.9% 14.9%
65–74 23.8 10.1% 9.9% 1.1% 4.1% 22.6% 7.8% 13.0%
75+ 18.1 7.7% 6.9% 0.5% 2.9% 12.5% 7.0% 9.5%
Highest level of education
Grade school 9.9 4.2% 1.5% 0.8% 2.4% 17.8% 4.3% 5.6%
Some high school 19.0 8.1% 4.9% 0.8% 2.4% 21.0% 4.9% 8.0%
High school graduate 70.9 30.2% 7.6% 0.9% 4.0% 25.0% 6.7% 11.2%
Some college 68.7 29.2% 14.3% 1.4% 6.5% 34.1% 9.9% 17.7%
College graduate 43.0 18.3% 16.5% 2.2% 5.5% 41.0% 10.9% 17.7%
Graduate school 23.5 10.0% 21.4% 2.0% 7.2% 41.2% 12.3% 21.8%
Family income
Less than $20K 40.9 17.4% 9.6% 1.6% 3.6% 21.5% 8.8% 12.4%
$20K to $50K 76.0 32.3% 9.0% 1.0% 4.7% 26.5% 7.6% 12.5%
$50K to $75K 43.9 18.7% 14.0% 1.7% 4.9% 32.3% 8.8% 16.0%
$75K to $100K 27.6 11.7% 14.4% 1.2% 7.2% 39.2% 9.9% 18.4%
$100K to $150K 27.1 11.5% 14.2% 1.3% 5.7% 41.6% 9.4% 16.6%
$150K and over 19.6 8.3% 18.2% 2.0% 6.7% 46.0% 10.1% 18.9%
Gray shaded box indicates that the estimate is significantly different from the 2012 overall estimate at the .05 level

43 • chapter 3. creating, performing, and sharing art
Types of music or songs performedAdults who played a musical instrument, sang, danced, or acted during the last 12 months were asked for information about the type of music they performed. Figure 3-4 shows that participating in a choral group, choir, or glee club is the most common type of musical performance, followed by performing or practicing classical music in general. Chart 3-2 displays distinct gender differences in type of music performed. Women are much more likely to practice or perform choral or glee club music and men are much more likely to practice or perform Jazz.
JazzThe percentage of American adults who performed or practiced jazz has not changed much since 2002 (Figure 3-4). Male jazz players outnumber females at a rate of two to one (Figure 3-5). Over half the jazz players are under 45 years of age, and half have a college degree or higher.
Figure 3-4. Percentage of U.S. adults who practiced or performed music of various types: 2012
Percent of adults
Practiced or performed: 2002 2008 2012
Jazz 1.3% 1.4% 1.0%
Classical music 1.8% 3.1% 2.3%
Opera 0.7% 0.4% 0.4%
Latin music Not Asked Not Asked 1.3%
Choral or glee club music 4.8% 5.2% 3.2%
Musical or non-musical stage play*
2.8% 1.0% 0.9%
Gray shaded box indicates that the estimate is significantly different from the 2012 estimate at the .05 level
* Musicals and non-musical stage plays were addressed as separate questions in 2002 and 2008.
Classical MusicThe percentage of adults practicing or performing classical music during the past 12 months is not significantly different from 2002 levels. The 5 million adults who practiced or performed classical music during the 12-month SPPA period are comprised of more women than men. The racial and ethnic group most likely to play classical music is comprised of people who are not Hispanic, not white, and not African American. Young adults aged 18 to 24 are by far the age group most likely to play. The likelihood of practicing or performing classical music increases with education: 22 percent of people who play music and hold a graduate degree perform or practice classical music (Figure 3-6).
OperaLess than 1 percent of Americans practiced or performed opera in 2012, the same percentage as in 2008, and statistically the same as in 2002. Women are nearly three times as likely to sing opera as men, and Hispanic adults are three times as likely as non-Hispanic whites and African Americans to sing opera. Opera singers tend to be younger and are more likely than not to have had some college education.
Latin, Spanish, or Salsa MusicOne percent of American adults practice or perform Latin, Spanish, or salsa music. (Trend data before 2008 are unavailable for this art form.) Over one-quarter of Hispanic adults who play a musical instrument, sing, or dance either practice or perform Latin music. Young adults aged 18 to 24 are the group most likely to play, but the nation’s oldest Americans are nearly as likely. Roughly 7 percent of people age 75 and older who play a musical instrument, sing, or dance practice or perform Latin, Spanish, or salsa music, which is more than the share of 25- to 34-year-olds (6 percent) and 35- to 44-year-olds (4 percent). People with no more than a grade school education are highly likely to play Latin music over any other kind of music. A full 30 percent of people who play music and have no more than a grade school education practice or perform Latin music (Figure 3-6).

2012 survey of public participation in the arts • 44
Choral Group, Choir, or Glee ClubParticipation in adult glee clubs and choirs has declined over the past ten years, dropping from 5 percent in 2002 and 2008 to 3 percent in 2012. About 18 percent of all singers participate in a choir or glee club (Figure 3-6). In 2012, women comprised two-thirds of glee club and choir participants. Over one-fifth of American women who sing, and 14 percent of men who sing, participate in a choir or glee club. African Americans are about three times as likely as adults from other racial and ethnic groups to sing in a choir or glee club. Of African Americans who sing, nearly 40 percent sing in a choir or glee club.
Musical or Non-Musical Stage PlayParticipation in a musical or non-musical stage play has held steady since 2008, but remains lower than ten years ago. In 2002, 3 percent of adults performed in a musical or non-musical play, compared with 1 percent in 2008 and 2012, a statistically significant decline8. Women and men are equally likely to be in a musical or non-musical play. Among racial and ethnic groups, African Americans are the most likely to be in a play, and among age groups, people aged 18 to 24 are the most likely. Participation in a musical or non-musical play is not positively related to educational level or family income.
8 While this is a statistically significant change, the decline could be a result of
combining separate questions on musical and non-musical stage plays into
a single question in 2012. In 2002 and 2008, the two types of plays were handled
as separate questions.
Chart 3-2. Gender differences in practicing/performing art, by specific art form
0%
5%
10%
15%
20%
25%
Musicals/plays
Choral/glee
Latin musicOperaClassicalJazz
6.2%
2.9%
12.4%13.4%
0.8%
2.2%
5.9%6.2%
22.1%
3.9%3.7%
14.0%
Males Females
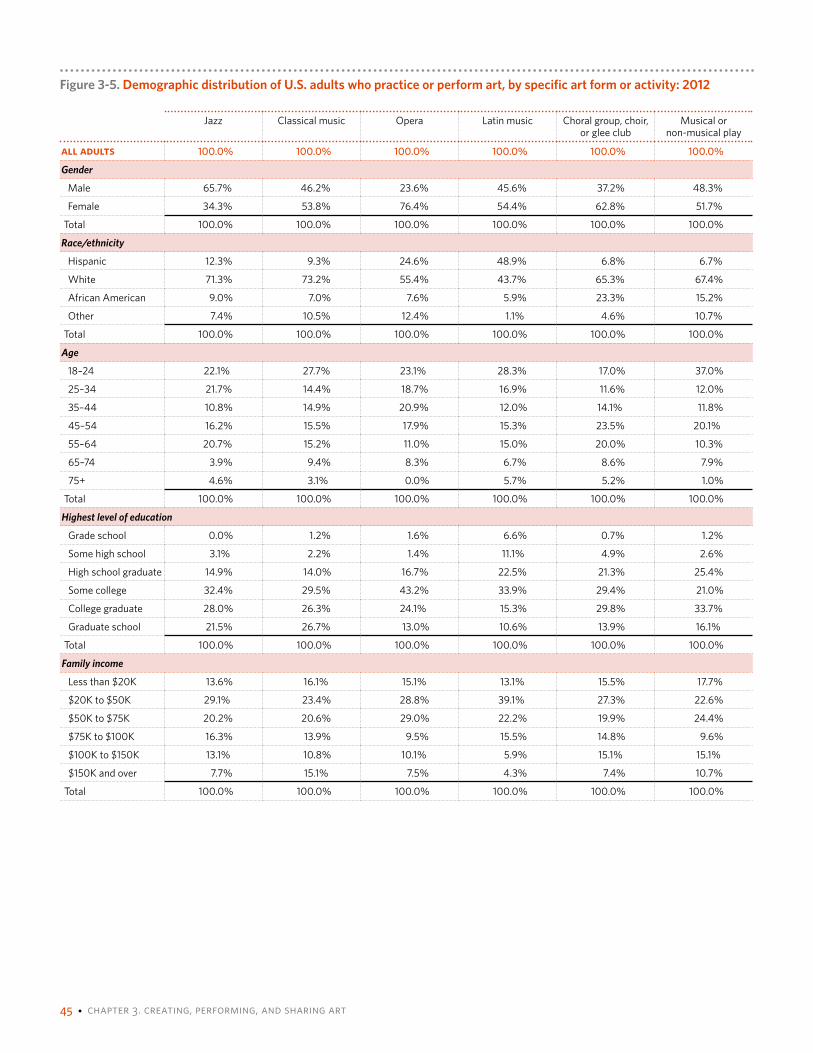
45 • chapter 3. creating, performing, and sharing art
Figure 3-5. Demographic distribution of U.S. adults who practice or perform art, by specific art form or activity: 2012
Jazz Classical music Opera Latin music Choral group, choir, or glee club
Musical or non-musical play
all adults 100.0% 100.0% 100.0% 100.0% 100.0% 100.0%
Gender
Male 65.7% 46.2% 23.6% 45.6% 37.2% 48.3%
Female 34.3% 53.8% 76.4% 54.4% 62.8% 51.7%
Total 100.0% 100.0% 100.0% 100.0% 100.0% 100.0%
Race/ethnicity
Hispanic 12.3% 9.3% 24.6% 48.9% 6.8% 6.7%
White 71.3% 73.2% 55.4% 43.7% 65.3% 67.4%
African American 9.0% 7.0% 7.6% 5.9% 23.3% 15.2%
Other 7.4% 10.5% 12.4% 1.1% 4.6% 10.7%
Total 100.0% 100.0% 100.0% 100.0% 100.0% 100.0%
Age
18–24 22.1% 27.7% 23.1% 28.3% 17.0% 37.0%
25–34 21.7% 14.4% 18.7% 16.9% 11.6% 12.0%
35–44 10.8% 14.9% 20.9% 12.0% 14.1% 11.8%
45–54 16.2% 15.5% 17.9% 15.3% 23.5% 20.1%
55–64 20.7% 15.2% 11.0% 15.0% 20.0% 10.3%
65–74 3.9% 9.4% 8.3% 6.7% 8.6% 7.9%
75+ 4.6% 3.1% 0.0% 5.7% 5.2% 1.0%
Total 100.0% 100.0% 100.0% 100.0% 100.0% 100.0%
Highest level of education
Grade school 0.0% 1.2% 1.6% 6.6% 0.7% 1.2%
Some high school 3.1% 2.2% 1.4% 11.1% 4.9% 2.6%
High school graduate 14.9% 14.0% 16.7% 22.5% 21.3% 25.4%
Some college 32.4% 29.5% 43.2% 33.9% 29.4% 21.0%
College graduate 28.0% 26.3% 24.1% 15.3% 29.8% 33.7%
Graduate school 21.5% 26.7% 13.0% 10.6% 13.9% 16.1%
Total 100.0% 100.0% 100.0% 100.0% 100.0% 100.0%
Family income
Less than $20K 13.6% 16.1% 15.1% 13.1% 15.5% 17.7%
$20K to $50K 29.1% 23.4% 28.8% 39.1% 27.3% 22.6%
$50K to $75K 20.2% 20.6% 29.0% 22.2% 19.9% 24.4%
$75K to $100K 16.3% 13.9% 9.5% 15.5% 14.8% 9.6%
$100K to $150K 13.1% 10.8% 10.1% 5.9% 15.1% 15.1%
$150K and over 7.7% 15.1% 7.5% 4.3% 7.4% 10.7%
Total 100.0% 100.0% 100.0% 100.0% 100.0% 100.0%

2012 survey of public participation in the arts • 46
Figure 3-6. Percentage of U.S. adults who practice or perform arts, by specific art form or activity: 2012
Demographics on Performing Art
Jazz Classical music Opera Latin music Choral group, choir, or glee club
Musical or non-musical play
all adults 4.4% 12.9% 1.6% 6.1% 18.2% 3.8%
Gender
Male 6.2% 12.4% 0.8% 5.9% 14.0% 3.9%
Female 2.9% 13.4% 2.2% 6.2% 22.1% 3.7%
Race/ethnicity
Hispanic 5.0% 12.4% 3.5% 27.3% 12.7% 2.4%
White 4.5% 13.3% 1.2% 3.8% 16.7% 3.7%
African American 3.7% 8.2% 1.1% 3.4% 38.9% 5.4%
Other 3.9% 16.4% 2.3% 1.1% 10.0% 4.9%
Age
18–24 5.3% 18.5% 2.0% 9.3% 16.0% 7.6%
25–34 6.0% 11.9% 1.8% 6.3% 13.5% 2.8%
35–44 2.9% 11.5% 2.0% 4.4% 15.3% 2.7%
45–54 3.9% 11.1% 1.5% 5.1% 23.8% 4.2%
55–64 5.7% 12.2% 1.1% 5.7% 22.7% 2.5%
65–74 1.9% 13.6% 1.4% 4.5% 17.7% 3.4%
75+ 3.8% 7.3% 0.0% 6.5% 17.4% 0.7%
Highest level of education
Grade school 0.0% 12.8% 1.9% 31.0% 10.5% 3.7%
Some high school 3.1% 6.4% 0.5% 15.3% 19.5% 2.2%
High school graduate 2.9% 8.3% 1.2% 6.0% 17.7% 4.3%
Some college 4.3% 11.6% 2.0% 6.1% 16.2% 2.4%
College graduate 5.3% 14.2% 1.6% 4.0% 22.7% 5.5%
Graduate school 6.4% 22.3% 1.4% 4.4% 16.4% 4.2%
Family income
Less than $20K 4.1% 13.5% 1.6% 5.5% 18.3% 4.7%
$20K to $50K 4.8% 11.5% 1.7% 8.9% 18.9% 3.2%
$50K to $75K 4.4% 13.0% 2.2% 6.7% 17.6% 4.6%
$75K to $100K 5.1% 13.4% 1.1% 6.7% 20.1% 2.6%
$100K to $150K 4.4% 10.9% 1.2% 2.7% 21.4% 4.4%
$150K and over 3.0% 17.0% 1.0% 2.3% 11.7% 3.6%
Gray shaded box indicates that the estimate is significantly different from the 2012 overall estimate at the .05 level

47 • chapter 3. creating, performing, and sharing art
Performing, Creating, and Sharing Art via Electronic Media and Other Methods
Another significant change to the 2012 SPPA is that it broadens the measure of arts participation to include creating and sharing music and art through electronic media. This section relates specifically to the use of electronic technology for creating or performing music, visual art, dance, creative writing, or photography during the last 12 months.
Because new questions were added to the SPPA to stay current with technological changes, and because question wording has evolved over time, trend analysis involving prior-year SPPA results is possible only for visual art and creative writing.
Chart 3-3 illustrates some distinct gender differences in practicing and performing art. Women are more likely to create visual art than men, and far more likely to create scrapbooks. Men are more likely than women to create music, and they are far more likely to create films or videos.
Chart 3-3. Gender differences in creating or performing art
0%
5%
10%
15%
20%
25%
Creativ
e
writing
Scrapbooks
Visual
artPhoto
s
Film
s/
video
Dance
Music
4.5%
0.9%
2.1%
13.2%
4.7%
6.7%
2.9%
9.8%
6.2%
1.6%
3.6%
11.5%
5.6%5.6%
Males Females
MusicFigure 3-7 shows that 5 percent of American adults, or nearly 12 million people, created or performed music in the twelve-month period addressed by the 2012 SPPA. This is without regard for the method or tools used.
Of the 12 million people who created or performed music, 28 percent used a computer, a handheld or mobile device, or the Internet for that purpose (Figure 3-11). Of adults who created, performed, recorded, edited, or remixed music, 44 percent e-mailed, posted, or shared it electronically.
Figure 3-7. Number and percentage of U.S. adults creating or performing arts at least once in the past 12 months: 2012
Percent of adults who created
or performed art
Number of adults who created
or performed art
Music 5.0% 11,749,677
Dance 1.3% 3,054,916
Artistic films or videos 2.8% 6,579,819
Artistic photographs 12.4% 29,139,199
Visual arts 5.7% 13,394,632
Scrapbooking 6.5% 15,274,580
Creative writing 5.9% 13,864,619
Any of the above 23.2% 44,648,773
Not taking into account the medium used, men are slightly more likely than women to create or perform music (see Figure 3-9). About 5 percent of American adults—6 percent of all men and almost 5 percent of all women—created or performed music during the 12-month SPPA period (again, without regard for the method used). Adults aged 18 to 24 are more likely than any other age group to create or perform music, and the likelihood of creating or performing music increases with education. The family income group most likely to create or perform music is the highest income group ($150,000 or more); least likely is the lowest income group (less than $20,000).

2012 survey of public participation in the arts • 48
Figure 3-8. Demographic distribution of U.S. adults creating or performing arts of various kinds during the last 12 months: 2012
U.S. adult population Music Dance Films/videos Photos Visual arts Scrapbooks Creative writing
Millions Percent
Gender
Male 113.1 48.1% 53.4% 32.9% 60.6% 44.7% 39.3% 21.7% 45.3%
Female 121.9 51.9% 46.6% 67.1% 39.4% 55.3% 60.7% 78.3% 54.7%
Total 100.0% 100.0% 100.0% 100.0% 100.0% 100.0% 100.0% 100.0%
Race/ethnicity
Hispanic 35.0 14.9% 12.2% 17.7% 11.3% 9.4% 9.5% 11.2% 10.2%
White 155.7 66.3% 69.8% 60.2% 68.4% 76.7% 74.8% 73.1% 75.1%
African American 26.8 11.4% 10.1% 16.0% 12.3% 7.6% 7.0% 9.4% 8.4%
Other 17.5 7.4% 7.9% 6.5% 8.0% 6.3% 8.7% 6.3% 6.3%
Total 100.0% 100.0% 100.0% 100.0% 100.0% 100.0% 100.0% 100.0%
Age
18–24 30.4 13.0% 21.9% 27.6% 20.2% 13.8% 20.8% 13.4% 22.0%
25–34 41.0 17.4% 17.2% 14.0% 21.6% 21.2% 18.0% 26.1% 18.3%
35–44 39.6 16.9% 13.9% 18.7% 24.4% 18.6% 16.3% 18.9% 17.8%
45–54 43.7 18.6% 20.0% 14.7% 16.8% 18.9% 16.6% 15.3% 13.7%
55–64 38.3 16.3% 14.7% 12.3% 11.5% 15.8% 16.4% 11.1% 14.7%
65–74 23.8 10.1% 6.1% 9.4% 4.2% 8.2% 7.1% 8.4% 7.1%
75+ 18.1 7.7% 6.2% 3.3% 1.4% 3.5% 4.7% 6.8% 6.4%
Total 100.0% 100.0% 100.0% 100.0% 100.0% 100.0% 100.0% 100.0%
Highest level of education
Grade school 9.9 4.2% 2.3% 0.9% 0.0% 0.8% 0.5% 1.2% 0.2%
Some high school 19.0 8.1% 4.1% 9.7% 2.7% 2.2% 3.4% 3.4% 2.3%
High school graduate 70.9 30.2% 18.6% 15.9% 18.1% 16.2% 18.1% 23.1% 16.8%
Some college 68.7 29.2% 32.2% 41.6% 33.0% 32.6% 31.4% 31.2% 31.7%
College graduate 43.0 18.3% 26.0% 13.3% 30.4% 29.8% 31.2% 24.2% 25.9%
Graduate school 23.5 10.0% 16.8% 18.5% 15.8% 18.3% 15.4% 16.9% 23.2%
Total 100.0% 100.0% 100.0% 100.0% 100.0% 100.0% 100.0% 100.0%
Family income
Less than $20K 40.9 17.4% 12.1% 14.4% 10.5% 9.0% 11.2% 10.1% 13.4%
$20K to $50K 76.0 32.3% 27.7% 28.9% 21.9% 25.2% 28.0% 30.3% 29.4%
$50K to $75K 43.9 18.7% 21.6% 28.6% 23.7% 22.7% 19.5% 24.8% 15.6%
$75K to $100K 27.6 11.7% 14.6% 10.9% 14.4% 12.8% 15.2% 13.4% 17.0%
$100K to $150K 27.1 11.5% 12.1% 9.7% 14.7% 15.6% 15.9% 11.7% 14.0%
$150K and over 19.6 8.3% 11.9% 7.4% 14.8% 14.6% 10.2% 9.8% 10.7%
Total 100.0% 100.0% 100.0% 100.0% 100.0% 100.0% 100.0% 100.0%

49 • chapter 3. creating, performing, and sharing art
Figure 3-9. Percentage of U.S. adults creating or performing arts during the last 12 months: 2012
Music Dance Films/videos Photos Visual arts Scrapbooks Creative writing
all adults 5.0% 1.3% 2.8% 12.4% 5.7% 6.5% 5.9%
Gender
Male 5.6% 0.9% 3.6% 11.5% 4.7% 2.9% 5.6%
Female 4.5% 1.6% 2.1% 13.2% 6.7% 9.8% 6.2%
Race/ethnicity
Hispanic 4.1% 1.5% 2.2% 7.9% 3.7% 4.9% 4.1%
White 5.3% 1.1% 2.9% 14.3% 6.4% 7.2% 6.7%
African American 4.3% 1.7% 3.0% 8.0% 3.4% 5.3% 4.3%
Other 5.5% 1.2% 3.2% 10.9% 6.9% 5.7% 5.2%
Age
18–24 8.6% 2.7% 4.5% 13.4% 9.3% 6.8% 10.2%
25–34 5.0% 1.0% 3.6% 15.4% 6.0% 9.9% 6.4%
35–44 4.2% 1.4% 4.2% 14.0% 5.6% 7.4% 6.4%
45–54 5.3% 1.0% 2.5% 12.4% 5.0% 5.3% 4.3%
55–64 4.4% 0.9% 2.0% 11.9% 5.7% 4.4% 5.3%
65–74 3.0% 1.2% 1.2% 10.0% 4.0% 5.4% 4.1%
75+ 3.8% 0.5% 0.5% 5.3% 3.3% 5.4% 4.6%
Highest level of education
Grade school 2.6% 0.3% 0.0% 2.2% 0.7% 1.8% 0.3%
Some high school 2.6% 1.6% 1.0% 3.5% 2.4% 2.8% 1.7%
High school graduate 3.0% 0.7% 1.7% 6.5% 3.4% 4.9% 3.2%
Some college 5.5% 1.8% 3.2% 13.9% 6.1% 7.0% 6.4%
College graduate 6.9% 0.9% 4.6% 19.7% 9.5% 8.4% 8.2%
Graduate school 9.0% 2.5% 4.8% 24.3% 9.4% 11.7% 14.7%
Family income
Less than $20K 3.6% 1.1% 1.8% 6.7% 3.8% 3.9% 4.7%
$20K to $50K 4.2% 1.1% 1.9% 9.4% 4.8% 6.0% 5.2%
$50K to $75K 5.8% 1.9% 3.6% 15.2% 6.0% 8.7% 5.0%
$75K to $100K 6.2% 1.2% 3.4% 13.4% 7.3% 7.4% 8.5%
$100K to $150K 5.3% 1.1% 3.6% 16.9% 7.9% 6.6% 7.2%
$150K and over 7.2% 1.1% 5.0% 21.9% 7.0% 7.7% 7.7%
Gray shaded box indicates that the estimate is significantly different from the 2012 overall estimate at the .05 level

2012 survey of public participation in the arts • 50
Of adults who used electronic media to create or perform music, men outnumber women by a ratio of 4 to 1, and three-quarters are under the age of 45 (see Figure 3-10). Over two-thirds of the people who use a computer, a handheld device, a mobile device, or the Internet to create music have at least some college education. Among all
U.S. adults who create or perform music, African Americans are almost twice as likely as non-Hispanic whites to use electronic media to do this (see Figure 3-11). Using electronic media to create or perform music is most common among young adults and among people from higher-income families.
Figure 3-10. Demographic distribution of U.S. adults using electronic media to create or perform art in the past 12 months, by art form: 2012
2012 US Population Create music Record, edit, or remix music
Record, edit, or remix dance
Record, edit, or remix films
or videos
Edit photos Create visual art
Millions Percent
Gender
Male 113.1 48.1% 72.1% 62.9% 48.3% 61.9% 42.8% 44.1%
Female 121.9 51.9% 27.9% 37.1% 51.7% 38.1% 57.2% 55.9%
Total 100.0% 100.0% 100.0% 100.0% 100.0% 100.0%
Race and ethnicity
Hispanic 35.0 14.9% 17.6% 12.6% 16.0% 12.8% 8.4% 7.3%
White 155.7 66.3% 24.9% 66.9% 56.8% 70.8% 78.5% 74.8%
African American 26.8 11.4% 17.2% 15.3% 23.3% 10.3% 6.2% 9.3%
Other 17.5 7.4% 3.8% 5.2% 3.8% 6.1% 6.9% 8.6%
Total 100.0% 100.0% 100.0% 100.0% 100.0% 100.0%
Age
18–24 30.4 13.0% 34.1% 29.4% 30.6% 26.3% 16.8% 21.6%
25–34 41.0 17.4% 22.5% 17.7% 13.0% 19.2% 22.5% 22.8%
35–44 39.6 16.9% 17.7% 12.1% 15.0% 20.2% 17.5% 13.9%
45–54 43.7 18.6% 16.8% 18.6% 19.7% 18.6% 19.4% 14.8%
55–64 38.3 16.3% 7.6% 13.6% 16.9% 10.2% 13.6% 18.0%
65–74 23.8 10.1% 0.3% 6.4% 3.6% 3.5% 7.2% 6.3%
75+ 18.1 7.7% 0.9% 2.1% 1.3% 2.0% 3.0% 2.8%
Total 100.0% 100.0% 100.0% 100.0% 100.0% 100.0%
Highest level of education
Grade school 9.9 4.2% 0.0% 0.3% 0.0% 0.0% 0.3% 0.0%
Some high school 19.0 8.1% 4.6% 4.6% 7.4% 2.0% 2.0% 1.6%
High school graduate 70.9 30.2% 16.2% 22.2% 8.8% 17.2% 14.3% 13.8%
Some college 68.7 29.2% 37.5% 32.0% 44.7% 35.0% 31.9% 31.5%
College graduate 43.0 18.3% 30.1% 26.4% 20.1% 32.0% 32.4% 35.1%
Graduate school 23.5 10.0% 11.6% 14.6% 18.9% 13.7% 19.1% 18.0%
Total 100.0% 100.0% 100.0% 100.0% 100.0% 100.0%
Family income
Less than $20K 40.9 17.4% 9.4% 11.8% 8.5% 7.3% 6.2% 8.3%
$20K to $50K 76.0 32.3% 23.7% 26.7% 26.9% 22.5% 23.1% 24.7%
$50K to $75K 43.9 18.7% 23.0% 22.0% 32.6% 27.3% 21.8% 21.3%
$75K to $100K 27.6 11.7% 16.1% 15.0% 14.0% 14.7% 16.0% 17.1%
$100K to $150K 27.1 11.5% 9.0% 10.9% 7.9% 11.4% 19.0% 15.6%
$150K and over 19.6 8.3% 18.9% 13.6% 10.0% 16.8% 13.9% 13.0%
Total 100.0% 100.0% 100.0% 100.0% 100.0% 100.0%

51 • chapter 3. creating, performing, and sharing art
Figure 3-11. Percentage of U.S. adults using electronic media to create or perform art in the past 12 months, by art form: 2012
Recorded, edited, or remixed music
Recorded, edited, or remixed dance
Recorded, edited, or remixed films or
videos
Edited photos Used electronic media
Of all adults who created or
performed music
Of all adults who created
visual art
all adults 4.4% 0.9% 2.2% 13.0% 28.4% 45.6%
Gender
Male 5.8% 0.9% 2.9% 11.6% 38.6% 55.9%
Female 3.1% 0.9% 1.6% 14.4% 16.9% 45.7%
Race/ethnicity
Hispanic 3.8% 0.9% 1.9% 7.4% 41.5% 38.3%
White 4.4% 0.7% 2.4% 15.4% 24.9% 49.7%
African American 5.8% 1.7% 2.0% 6.9% 48.1% 66.0%
Other 3.2% 0.5% 1.9% 12.5% 13.6% 49.3%
Age
18–24 10.2% 2.1% 4.6% 17.2% 43.9% 51.8%
25–34 4.6% 0.7% 2.5% 17.3% 37.4% 63.0%
35–44 3.2% 0.8% 2.8% 13.8% 36.5% 42.4%
45–54 4.3% 0.9% 2.2% 13.3% 23.7% 44.2%
55–64 3.7% 0.9% 1.4% 10.8% 14.7% 54.3%
65–74 2.8% 0.3% 0.8% 9.3% 1.7% 44.0%
75+ 1.1% 0.1% 0.6% 4.8% 4.1% 27.3%
Highest level of education
Grade school 0.3% 0.0% 0.0% 0.9% 0.0% 0.0%
Some high school 2.6% 0.8% 0.6% 3.2% 31.4% 23.7%
High school graduate 3.2% 0.2% 1.3% 6.1% 24.6% 38.0%
Some college 4.9% 1.3% 2.7% 14.3% 33.6% 50.0%
College graduate 6.2% 0.9% 3.8% 22.6% 32.6% 55.7%
Graduate school 6.9% 1.8% 3.3% 26.7% 19.5% 58.2%
Family income
Less than $20K 3.1% 0.4% 1.0% 4.8% 21.9% 36.9%
$20K to $50K 3.6% 0.7% 1.5% 9.1% 24.4% 43.8%
$50K to $75K 5.2% 1.5% 3.3% 15.3% 30.4% 54.3%
$75K to $100K 5.6% 1.0% 2.8% 17.7% 31.4% 56.1%
$100K to $150K 4.2% 0.6% 2.2% 21.6% 21.0% 48.8%
$150K and over 7.3% 1.1% 4.6% 21.9% 44.6% 63.2%
Gray shaded box indicates that the estimate is significantly different from the 2012 overall estimate at the .05 level

2012 survey of public participation in the arts • 52
Dance One percent of American adults, or three million people, created or performed dance during the 12-month SPPA period (Figure 3-9). Among people who created or performed dance, 3 percent used a computer, a handheld or mobile device, or the Internet to record, edit, or remix it (Figure 3-11).
Not taking into account the medium used, women are almost twice as likely as men to create or perform dance, and Hispanics and African Americans are slightly more likely than other racial or ethnic group to have created or performed dance in the last 12 months (Figure 3-9). Young adults aged 18 to 24 are two to three times as likely as other age groups to have created or performed dance. The likelihood of creating or performing dance does not vary much by family income bracket, although it does by educational level. Adults who attended graduate school are the most likely to create or perform dance.
Among adults who create or perform dance, men are more likely than women to use electronic media to do this activity, and young adults are more likely than older adults to use electronic media to do so (Figure 10). American adults who are not Hispanic, white, or African American are the most likely racial or ethnic group to record, edit, or remix dance performances (Figure 3-11).
Films and VideosThree percent of Americans, or 6.6 million people, created or filmed a video in the past 12 months (Figure 3-7), and 145,000 people (less than 0.1 percent of the population) edited or remixed a film or video. Of adults who created or filmed a video, 13 percent used a computer, a handheld device, a mobile device, or the Internet to e-mail, post, or share it.
Men are more likely than women to create a film or video. The likelihood of creating a film or video decreases with age and increases with educational level and family income (Figure 3-9).
Of the 145,000 people who edited or remixed a film or video in the 12-month SPPA period, two-thirds were men, over two-thirds were white, 80 percent had attended college or graduate school, and nearly 60 percent came from families that earned $75,000 or less (Figure 3-8).
Photography for artistic purposesTwelve percent of Americans take photographs for artistic purposes, making photography the most common form of arts creation (Figure 3-7). About 2 percent of adults do photo editing. Twenty-seven percent of adults who created, recorded, or remixed photographs shared them using a computer, a handheld or mobile device, or the Internet.
Women are more likely than men to take photographs for artistic purposes, and non-Hispanic whites are more likely than other ethnic and racial groups to take photographs (Figure 3-9). Of American adults who engage in photography, over one-third are younger than 35, compared with 12 percent of people 65 and older. The likelihood of engaging in photography increases with education and family income. Nearly one-quarter of Americans with a graduate education and over one-fifth of those from families earning at least $150,000 take photographs for artistic purposes (Figure 3-9).
Americans who do photo editing are most likely to be female, non-Hispanic white, young, highly educated, and to come from higher-income families (Figure 3-11).
Visual ArtSix percent of adults, or 13 million people, created visual art such as paintings, sculpture, or graphic designs in the 12-month SPPA period (Figure 3-9). Of the 13 million people who created visual art in the past 12 months, 46 percent created it using a computer, a handheld or mobile device, or the Internet (Figure 3-11), and 6 percent shared it that way.
Not taking into account the medium used, women are slightly more likely than men to create visual art, and Americans 18 to 24 are the most likely age group to create visual art (Figure 3-9). The likelihood of creating visual art increases with education and family income; only 3 percent of high school graduates create visual art, compared with about ten percent of college graduates.

53 • chapter 3. creating, performing, and sharing art
If, however, creation is restricted to the use of electronic media, then men are more likely than women to create visual art (Figure 3-11). While visual arts creators are predominantly women, adults who use electronic media for this purpose are predominantly men. Two-thirds of African Americans who create visual art use a computer or other device to do so, higher than for any other racial or ethnic group, and almost two-thirds of adults 25 to 34 who create visual art use electronic media, higher than for any other age group (Figure 3-11). The likelihood of using electronic media to create visual art increases with educational level.
ScrapbookingAbout 7 percent of American adults engage in scrapbooking, making it the second most common form of creating art, behind photography (Figure 3-7). Two percent of Americans share their scrapbooking electronically.
Women are three times as likely to scrapbook as men (Figure 3-9): 10 percent of American women scrapbook, compared with 3 percent of men. Scrapbooking appeals to a young audience and an educated one. Ten percent of adults aged 25 to 34 scrapbook, compared with 4 percent in the 55 to 64 age group. In 2012, about 12 percent of adults with a graduate degree engaged in scrapbooking, compared with 5 percent of adults with a high school diploma only. The family income group most likely to scrapbook earns $50,000–$75,000; the highest wage-earning families ($150,000 or more) are the second most likely group.
Creative WritingSix percent of adults did creative writing in the past 12 months (Figure 3-7), and 4 percent shared it electronically. The share of people doing creative writing has not changed in a statistically meaningful way over the past decade. (Creative writing is one of the few forms of arts creation for which data comparisons with previous survey years can be made.) In 2002 and 2008, about 7 percent wrote creatively.
Women are slightly more likely to write than men, and young people aged 18 to 24 are two times more likely to write than people in nearly every other age group (Figure 3-9). The likelihood of doing creative writing increases dramatically with education. Fifteen percent of Americans with a graduate degree write creatively, compared with 3 percent of high school graduates. The family income group most likely to write earns $75,000 to $100,000; the group least likely earns under $20,000 annually.
Craft Arts The 2012 SPPA asked several questions about creating craft arts. The results are shown in Figure 3-12. Overall, about 5 percent of American adults created pottery, ceramics, or jewelry; 8 percent created leatherwork, metalwork, or woodwork; and 13 percent did weaving, crocheting, quilting, needlepoint, knitting, or sewing.
Women and young adults aged 18 to 24 have much higher rates of creating pottery, ceramics, or jewelry (7 percent of each subgroup), while men and adults 45 to 64 have much higher rates of constructing art from metal, leather, or wood (14 percent and about 10 percent, respectively).
Weaving, crocheting, quilting, and needlepoint are activities done predominantly by women (23 percent of women compared with 2 percent of men) who are 55 or older.
Trend analysis on craft arts is not possible because of differences in question wording from prior SPPA surveys. However, the question on weaving and crocheting is similar enough to allow a comparison, which shows little change in participation from 2008 but a decline from 2002, when about 16 percent engaged in this activity.

2012 survey of public participation in the arts • 54
Chart 3-4 shows major gender differences in craft arts. Women are more likely than men to create pottery, ceramics, and jewelry and extremely more likely to do weaving, crocheting, quilting, needlepoint, knitting, or sewing. Men are far more likely than women to do leatherwork, metalwork, or woodwork.
Chart 3-4. Gender differences in craft arts
0%
5%
10%
15%
20%
25%
Weaving, crocheting, quilting, needlepoint,
knitting, or sewing
Creating leatherwork, metalwork, or
woodwork
Creating pottery, ceramics, or jewelry
2.1%
6.8%
13.5%
3.2%2.4%
23.2%
Males Females
Figure 3-12. Percentage of U.S. adults doing craft arts during the last 12 months: 2012
Creating pottery,
ceramics, or jewelry
Creating leatherwork,
metalwork, or woodwork
Weaving, crocheting,
quilting, needlepoint, knitting, or
sewing
all adults 4.5% 8.2% 13.2%
Gender
Male 2.1% 13.5% 2.4%
Female 6.8% 3.2% 23.2%
Race/ethnicity
Hispanic 2.5% 4.9% 9.4%
White 5.1% 10.2% 14.8%
African American 4.2% 3.2% 9.5%
Other 4.5% 4.5% 11.9%
Age
18–24 7.1% 7.8% 9.8%
25–34 4.2% 7.8% 10.6%
35–44 4.4% 7.5% 10.8%
45–54 4.6% 9.5% 13.5%
55–64 4.6% 10.2% 15.5%
65–74 3.6% 7.9% 19.0%
75+ 2.3% 4.1% 16.5%
Highest level of education
Grade school 1.3% 2.7% 10.8%
Some high school 2.2% 5.4% 7.2%
High school graduate 3.2% 7.1% 11.5%
Some college 5.8% 9.7% 14.0%
College graduate 6.1% 9.8% 16.2%
Graduate school 5.2% 8.8% 16.7%
Family income
Less than $20K 4.4% 5.5% 12.8%
$20K to $50K 4.1% 6.4% 12.9%
$50K to $75K 4.9% 10.7% 12.6%
$75K to $100K 5.2% 10.4% 15.4%
$100K to $150K 4.3% 10.4% 13.8%
$150K and over 5.4% 8.7% 12.7%
Gray shaded box indicates that the estimate is significantly different from the 2012 overall estimate at the .05 level

Chapter 4. Participation in Arts Learning Activities
Students participate in a school tour of FotoFest 2012. FotoFest is a biennial photography festival in Houston, Texas. Photo courtesy of FotoFest

2012 survey of public participation in the arts • 56
Sample Findings
• The percentage of U.S. adults taking music, creative writing, or visual arts lessons or classes at any point in their lives has increased over the past decade—by more than 15 percent for creative writing and visual arts and 5 percent for music.
• A trend toward greater racial and ethnic diversity of adults taking classes or lessons is evidenced by the higher rates of African Americans and Hispanics taking acting, dance, creative writing, and music appreciation classes in the past year.
• Music is the art form most commonly studied, whether through voice-training or learning to play an instrument.
• Photography or filmmaking is the only art form that more people reported learning through other means other than classes or lessons.
• Women, non-Hispanic whites, and 18- to 24-year-olds represent the demographic profile of adults who are the most likely to have taken music classes or lessons at some point in their lives.
• Nearly half of the nation’s adults (46 percent) recalled taking arts classes or lessons as a child, while one-third reported taking classes/lessons as an adult. Music is the art form most commonly studied as a child.
• The most frequent arts learning experience that occurs through adult classes or lessons is art appreciation and art history. Thirteen percent of Americans said they had participated in such learning as adults.
• More than half of all adults were exposed to the arts as a child, either through visiting an art museum or gallery or attending a live music, theater, or dance performance.
• Childhood experience in the arts is significantly associated with educational level obtained in adulthood. Over 70 percent of college graduates said they visited an art museum or gallery as a child, compared with 42 percent of adults who have only a high school diploma.

57 • chapter 4. participation in arts learning activities
As with all the other sections of the SPPA survey, the module on arts learning-related activities asks respondents to report any participation that occurred in the last 12 months. A defining feature of the arts learning module is that the majority of questions refer to activities covering the respondent’s lifetime. To that extent, this section of the survey may be regarded as emphasizing the value of lifelong learning as integral to arts participation.
Historically, the arts learning questions have specified music, visual arts, acting, ballet, dance, creative writing, art appreciation/art history, and music appreciation. The 2008 SPPA survey broadened the question on ballet lessons or classes to include all forms of dance, and the identical question was repeated in 2012. Prior to 2012, photography and filmmaking lessons or classes were named as examples of visual art classes, but respondents were not asked specifically if they had studied either art form. The 2012 SPPA asked directly about studying photography or filmmaking.
A more comprehensive change to the survey’s questions about arts learning questions involved expanding the conceptual framework of arts learning in 2012 to include learning through family or friends, learning that occurred as part of a family tradition, and learning through self-instruction and/or through books or the Internet. However, trend analysis (i.e., comparisons with results from prior survey years) is permissible only for the questions about arts classes or lessons.
Learning for a Lifetime: Participation in the Arts through Classes or Lessons
The percentage of Americans engaging in arts learning through lessons or classes at any point in their lives has increased over the past decade (see Figure 4-1 and Chart 4-1). The percentage of U.S. adults who in 2012 reported ever studying music, visual arts, or creative writing is greater than in 2002, and the 2012 percentage who ever studied acting, dance, art appreciation, or music appreciation is greater than in 2008. Some of these changes can be attributed to the entry of a new cohort of younger adults who in 2012 reported higher levels of arts learning than they did in 2002. At the same time, caution should be exercised in comparing estimates of changes over time.
Specifically, while the wording of many questions about taking lessons or classes has remained the same across all survey years (2002, 2008, and 2012), the inclusion of questions about learning through other means in 2012 could potentially have influenced how people responded in 2012. Enrollment in an arts lesson or class is highly correlated with years of formal education and income. People with greater levels of family income and personal education are the most likely to have studied the arts through formal methods. This finding is understandable in view of the discretionary income needed for private classes or lessons (see Figure 4-3).
Music is the art form most commonly studied, whether it is voice-training or learning to play an instrument. The number of Americans who have taken music lessons or classes during their lifetime, either in or out of school (Figure 4-1), has increased over the past decade, from 34 percent in 2002 to nearly 36 percent in 2012 (a 5 percent increase in the overall rate of participation in those activities, as shown in Chart 4-1).
Visual art, such as drawing, painting, pottery, weaving, or graphic or fashion design, is the second most commonly studied art form. Nearly one-fifth of all American adults have taken visual art classes or lessons at some point in their life, an increase over the 2002 and 2008 levels. This proportional growth likely would have been still greater had the question on visual arts classes included photography and filmmaking as examples, as happened in prior rounds of the SPPA.
About 17 percent of adults reported in 2012 that they had taken dance lessons or classes, compared with 12 percent in 2008. Of all art forms, dance learning experienced the largest jump in participation levels, as seen in Figure 4-1.
Eighteen percent of adults in 2012 said that at some point they had studied art appreciation or art history. This is roughly the same proportion of U.S. adults as in 2002. The return to 2002 participation levels represents an increase over 2008, when the share dropped to 14 percent. Fourteen percent of adults have taken music appreciation at some point, higher than in 2008 but lower than in 2002.

2012 survey of public participation in the arts • 58
Figure 4-1. Percentage of U.S. adults who took arts lessons or classes during their lifetime, by art form studied: 2002, 2008, and 2012
Percent of adults
2002 2008 2012
Music 33.9% 34.0% 35.6%
Visual arts 16.5% 17.0% 19.3%
Acting or theater 7.0% 5.9% 7.1%
Photography or filmmaking
Not comparable
Not comparable
9.4%
Dance Not comparable
12.1% 16.7%
Creative writing 13.1% 11.3% 15.4%
Art appreciation or Art history
18.3% 13.8% 17.6%
Music appreciation 16.1% 11.0% 13.8%
Gray shaded box indicates that the estimate is significantly different from the 2012 estimate at the .05 level
Chart 4-1. Percentage change in lifetime arts learning
-20% -10% 0% 10% 20%
Music
Visual arts
Acting or theater
Creative writing
Art appreciation or art history
Music appreciation
17.6%
-4.0%
1.4%
17.0%
5.0%
-16.7%
MusicWomen are somewhat more likely than men to have taken music classes or lessons at some point in their lives. Thirty-eight percent of all American adult women have taken music lessons, compared with 33 percent of men (Figure 4-3 and Chart 4-2). Non-Hispanic whites are substantially more likely to have taken music lessons than members of any other racial or ethnic group, and the youngest adults, (aged 18 to 24) are the most likely age group to have done so. The likelihood of taking music classes or lessons is closely correlated with higher education and income.
Visual artsNearly two-thirds of people who took visual arts as a child or as an adult are women (Figure 4-2). Americans who belong to a racial or ethnic group other than non-Hispanic white, Hispanic, and African American are the most likely to have taken visual arts (22 percent of this group) (Figure 4-3). Young adults are far more likely than older adults to have had a visual arts education, and people with at least some college education are far more likely than less educated people to have had a visual arts education. The highest income earners are among those most likely to have had visual arts training.
Acting or theaterNine percent of women and 5 percent of men have taken classes or lessons in acting and theater (Figure 4-3 and Chart 4-2). Non-Hispanic whites represent the racial and ethnic group most likely to have had acting or theater training (8 percent of them). Young adults, under the age of 35, are far more likely than adults 45 and older to have received such education. Americans with a graduate degree are far more likely than less educated people to have taken acting or theater classes, and individuals from high-earning families are more likely than individuals from lower-income families to have done so.
Photography or filmmakingOf the different forms of arts education listed in Figures 4-2 and 4-3, the gender divide is smallest for photography and filmmaking. Nine percent of men and 10 percent of women have had classes or lessons in photography and filmmaking. Eleven percent of non-Hispanic white adults and 4 percent of African Americans have had some education in photography and filmmaking. The likelihood of photography or filmmaking education is highly correlated with education and income (Figure 4-3).

59 • chapter 4. participation in arts learning activities
DanceNearly three-quarters of adults who have taken dance classes or lessons at some point in their lives are women (Figure 4-2) and 80 percent are non-Hispanic white. The tendency to pursue dance education does not vary much by age but it does by education and income. A third of all adults with a graduate degree have had dance lessons, compared with 9 percent of high school graduates. Similarly, nearly 30 percent of adults in the highest wage-earning families have taken dance in their lifetimes, compared with 10 percent of adults in families making less than $20,000 annually.
Creative writingFifteen percent of all American adults—17 percent of women and 13 percent of men—have taken a class or lesson in creative writing at some point (Figure 4-3 and Chart 4-2). The racial or ethnic group most likely to study creative writing is non-Hispanic white (18 percent). Younger adults 18 to 24 are twice as likely as the nation’s oldest adults to have studied creative writing. Education in creative writing is correlated with more education and more income. Twenty-nine percent of adults with a graduate degree and 24 percent of adults earning $150,000 or more have taken classes in creative writing.
Art appreciation or art historyEighteen percent of American adults have taken art appreciation or art history classes or lessons (Figure 4-3). About one-fifth of all women and 16 percent of all men have studied art appreciation. Non-Hispanic whites are the racial/ethnic group most likely to have taken an art appreciation lesson or class. The tendency to study art appreciation is inversely related to age; 23 percent of the youngest adults have studied it, compared with 11 percent of the oldest. The likelihood is also associated with education and income. The higher the education or income, the more likely a person has taken art appreciation.
Music appreciationFewer Americans take music appreciation classes than art appreciation (14 percent compared with 18 percent) (Figure 4-3). Similar to other forms of arts learning in Figures 4-2, 4-3, and Chart 4-2, more women than men have taken lessons or classes in music appreciation. Of the people who have taken music appreciation classes, over half (54 percent) are under 45 years of age (Figure 4-3). Thirty percent of adults with a graduate degree have taken music appreciation, compared with 6 percent of high school graduates. Adults from high wage-earning families are more likely than adults from lower-earning families to have studied music appreciation.
Chart 4-2. Gender differences in lifetime arts learning, by type of class or lesson
0%
10%
20%
30%
40%
Music
apprecia
tion
Art appre
ciatio
n
Creativ
e writ
ing
Dance
Photogra
phy or f
ilm
Acting or t
heater
Visual a
rts
Music
33.2%
37.8%
14.3%
23.9%
5.0%
9.1%10.0%
9.2%
23.7%
13.3%
17.4%
15.6%
19.5%
11.9%
15.5%
Males Females
8.7%

2012 survey of public participation in the arts • 60
Figure 4-2. Demographic distribution of U.S. adults who took arts classes or lessons at any time in their lives: 2012
2012 U.S. adult population
Music Visual arts Acting or theater
Photography or
filmmaking
Dance Creative writing
Art appreciation
Music appreciation
Millions Percent
all adults 235.0 100.0% 100.0% 100.0% 100.0% 100.0% 100.0% 100.0% 100.0% 100.0%
Gender
Male 113.1 48.1% 44.9% 35.6% 33.9% 44.4% 26.5% 41.5% 42.5% 41.6%
Female 121.9 51.9% 55.1% 64.4% 66.1% 55.6% 73.5% 58.5% 57.5% 58.4%
Total 100.0% 100.0% 100.0% 100.0% 100.0% 100.0% 100.0% 100.0%
Race/ethnicity
Hispanic 35.0 14.9% 7.9% 9.9% 8.4% 8.2% 8.9% 7.6% 8.3% 6.5%
White 155.7 66.3% 78.1% 74.3% 77.2% 80.0% 79.9% 77.7% 76.5% 77.0%
African American 26.8 11.4% 7.4% 7.3% 7.9% 5.8% 5.8% 8.2% 7.8% 8.8%
Other 17.5 7.4% 6.5% 8.5% 6.5% 6.1% 5.4% 6.6% 7.3% 7.7%
Total 100.0% 100.0% 100.0% 100.0% 100.0% 100.0% 100.0% 100.0%
Age
18–24 30.4 13.0% 15.9% 18.3% 19.6% 13.8% 13.6% 20.0% 16.8% 17.0%
25–34 41.0 17.4% 18.4% 20.7% 24.6% 21.1% 16.5% 21.9% 20.1% 21.3%
35–44 39.6 16.9% 16.9% 15.8% 19.1% 18.0% 15.9% 16.9% 17.6% 15.7%
45–54 43.7 18.6% 18.1% 16.6% 14.6% 17.7% 17.6% 16.5% 16.9% 14.9%
55–64 38.3 16.3% 16.0% 15.0% 13.2% 17.3% 18.8% 14.5% 15.6% 16.3%
65–74 23.8 10.1% 9.0% 8.7% 5.3% 7.9% 10.1% 7.1% 8.5% 9.5%
75+ 18.1 7.7% 5.8% 4.7% 3.6% 4.2% 6.8% 3.0% 4.5% 5.2%
Total 100.0% 100.0% 100.0% 100.0% 100.0% 100.0% 100.0% 100.0%
Highest level of education
Grade school 9.9 4.2% 0.6% 0.6% 0.1% 0.0% 0.5% 0.4% 0.2% 0.4%
Some high school 19.0 8.1% 2.9% 2.6% 2.6% 0.9% 2.6% 1.7% 1.0% 1.5%
High school graduate 70.9 30.2% 21.3% 18.8% 15.0% 15.6% 16.0% 11.7% 9.8% 12.6%
Some college 68.7 29.2% 33.1% 37.0% 28.3% 29.3% 31.5% 34.2% 33.1% 31.9%
College graduate 43.0 18.3% 27.1% 26.5% 31.8% 34.3% 29.6% 33.5% 34.8% 32.0%
Graduate school 23.5 10.0% 15.0% 14.5% 22.2% 19.8% 19.8% 18.4% 20.9% 21.6%
Total 100.0% 100.0% 100.0% 100.0% 100.0% 100.0% 100.0% 100.0%
Family income
Less than $20K 40.9 17.4% 12.4% 13.2% 15.0% 10.8% 9.7% 11.6% 10.4% 10.7%
$20K to $50K 76.0 32.3% 26.2% 27.7% 24.3% 23.2% 24.3% 25.4% 22.5% 23.5%
$50K to $75K 43.9 18.7% 19.2% 19.9% 20.0% 18.0% 20.7% 19.8% 21.1% 19.7%
$75K to $100K 27.6 11.7% 14.2% 14.2% 14.5% 16.8% 13.8% 13.8% 15.7% 15.9%
$100K to $150K 27.1 11.5% 15.4% 13.7% 14.3% 15.1% 16.4% 16.2% 15.2% 16.7%
$150K and over 19.6 8.3% 12.7% 11.4% 11.9% 16.0% 15.1% 13.3% 15.1% 13.5%
Total 100.0% 100.0% 100.0% 100.0% 100.0% 100.0% 100.0% 100.0%

61 • chapter 4. participation in arts learning activities
Figure 4-3. Percentage of U.S. adults who took arts classes or lessons at any time in their lives and percentage who took such classes or lessons within the last 12 months (in parentheses): 2012
Music Visual arts Acting Photography/filmmaking
Dance Creative writing
Art appreciation or
art history
Music appreciation
all adults 35.6% (2.0%)
19.3% (2.0%)
7.1% (0.3%)
9.4% (1.2%)
16.7%(1.8%)
15.4%(1.7%)
17.6%(1.5%)
13.8%(1.0%)
Gender
Male 33.2% (1.9%)
14.3% (1.1%)
5.0% (0.3%)
8.7% (1.0%)
9.2% (0.7%)
13.3%(1.2%)
15.6%(1.2%)
11.9%(0.8%)
Female 37.8% (2.2%)
23.9% (2.7%)
9.1% (0.4%)
10.0% (1.4%)
23.7%(2.8%)
17.4%(2.2%)
19.5%(1.7%)
15.5%(1.1%)
Race/ethnicity
Hispanic 19.3% (1.6%)
13.1% (1.1%)
4.1% (0.4%)
5.2% (1.3%)
10.2%(2.2%)
7.9%(1.8%)
10.0%(0.9%)
6.2%(1.2%)
White 41.6% (2.2%)
21.4% (2.3%)
8.2% (0.3%)
11.2% (1.3%)
19.9%(1.7%)
17.9%(1.7%)
20.2%(1.5%)
15.9%(0.8%)
African American 23.9% (1.8%)
12.6% (0.9%)
5.1% (0.6%)
4.9% (0.6%)
8.7%(2.1%)
11.4%(1.7%)
12.5%(1.0%)
11.0%(1.0%)
Other 31.4% (2.1%)
22.1% (2.5%)
6.2% (0.2%)
7.7% (0.7%)
12.1%(1.1%)
13.7%(2.0%)
17.5%(3.4%)
14.2%(1.5%)
Age
18–24 42.9% (5.3%)
26.9% (3.5%)
10.6% (1.0%)
9.8%(2.6%)
17.3%(3.0%)
23.6%(5.9%)
22.6%(5.2%)
17.9%(3.1%)
25–34 37.6% (1.1%)
23.0% (2.7%)
10.0% (0.4%)
11.3%(1.2%)
16.5%(1.4%)
19.5%(2.4%)
20.4%(1.9%)
16.9%(1.2%)
35–44 35.6% (1.7%)
18.0% (1.4%)
8.0% (0.4%)
10.0%(1.1%)
15.7%(2.2%)
15.3%(1.1%)
18.3%(0.5%)
12.8%(0.8%)
45–54 34.0% (1.8%)
17.0% (1.2%)
5.5% (0.1%)
8.8%(1.1%)
15.5%(1.2%)
13.5%(0.8%)
15.8%(0.7%)
11.0%(0.3%)
55–64 33.5% (2.0%)
17.1% (1.5%)
5.6% (0.3%)
9.6%(0.9%)
18.5%(2.1%)
13.2%(0.7%)
16.2%(0.9%)
13.2%(0.4%)
65–74 33.9% (1.4%)
17.7% (2.0%)
4.0% (0.0%)
7.8%(0.9%)
17.8%(1.1%)
11.6%(0.6%)
15.8%(0.7%)
13.8%(0.6%)
75+ 28.7% (0.6%)
12.7% (1.6%)
3.6%(0.0%)
5.4%(0.3%)
15.9%(0.7%)
6.4%(0.3%)
11.1%(0.4%)
10.0%(0.2%)
Highest level of education
Grade school 5.6% (0.2%)
2.7% (0.2%)
0.2% (0.0%)
0.0%(0.0%)
2.0%(0.0%)
1.7%(0.4%)
1.0%(0.0%)
1.5%(0%)
Some high school 13.4% (0.6%)
6.6% (0.2%)
2.4% (0.0%)
1.1%(0.2%)
5.6%(1.0%)
3.5%(0.1%)
2.4%(0.0%)
2.7%(0.0%)
High school graduate 24.6% (1.0%)
11.7% (0.9%)
3.4% (0.2%)
4.7%(0.5%)
8.6%(1.1%)
5.8%(0.9%)
5.6%(0.6%)
5.6%(0.4%)
Some college 40.7% (2.4%)
24.7% (2.4%)
7.0% (0.5%)
9.5%(1.4%)
18.2%(1.7%)
18.2%(3.1%)
20.3%(3.2%)
15.2%(1.7%)
College graduate 51.3% (2.8%)
27.2% (3.0%)
12.0% (0.5%)
17.1%(2.1%)
26.3%(2.6%)
27.5%(2.2%)
32.9%(1.6%)
23.6%(1.1%)
Graduate school 54.6% (4.6%)
28.6% (4.1%)
16.0% (0.6%)
19.0%(2.2%)
33.9%(4.1%)
29.1%(1.3%)
37.8%(0.7%)
30.6%(1.4%)
Family income
Less than $20K 26.6% (1.7%)
15.3% (1.2%)
6.4% (0.6%)
6.1%(0.9%)
9.8%(1.3%)
10.7%(1.8%)
11.0%(1.6%)
8.8%(1.2%)
$20K to $50K 29.2% (1.6%)
16.8% (1.7%)
5.4% (0.4%)
6.8%(0.6%)
12.7%(1.2%)
12.3%(1.6%)
12.5%(1.1%)
10.2%(1.0%)
$50K to $75K 36.0% (2.5%)
20.2% (1.3%)
7.5% (0.2%)
8.9%(0.9%)
18.2%(2.1%)
16.0%(1.6%)
19.6%(1.5%)
14.3%(0.7%)
$75K to $100K 42.6% (1.4%)
23.1% (2.7%)
8.8% (0.2%)
13.3%(1.4%)
19.6%(1.6%)
18.0%(2.1%)
23.6%(0.9%)
18.6%(0.3%)
$100K to $150K 44.8% (2.9%)
21.6% (2.2%)
8.3%(0.4%)
11.5%(1.7%)
22.4%(3.1%)
20.4%(2.0%)
21.9%(2.2%)
19.0%(1.1%)
$150K and over 52.6% (3.0%)
25.7% (4.3%)
9.9% (0.5%)
17.6%(3.7%)
29.4%(2.3%)
23.9%(1.7%)
31.0%(2.1%)
21.9%(1.5%)

2012 survey of public participation in the arts • 62
Art Classes or Lessons within the Last 12 Months
As a mode of arts participation, taking arts classes or lessons trailed far behind attending arts events or creating, performing, or sharing art. In 2012, just 2 percent of adults took classes or lessons in music, visual art, dance, creative writing, art appreciation, or art history in the previous 12 months (Figure 4-3). However, a promising trend is emerging as the number of adults taking lessons or classes during the past 12 months has increased from 2002 for all art forms except acting or theater. Furthermore, most of the recent increases are statistically significant, and acting or theater in 2012 remained the same as it was in 2008.
Figure 4-4. Percentage of U.S. adults who took arts lessons or classes during the past 12 months: 2012
2002 2008 2012
Music 1.4% 1.3% 2.0%
Visual arts 1.7% 2.0% 2.0%
Acting or theater 0.5% 0.3% 0.3%
Photography or filmmaking
Not comparable
Not comparable
1.2%
Dance Not comparable
1.1% 1.8%
Creative writing 1.0% 1.3% 1.7%
Art appreciation or Art history
1.0% 1.3% 1.5%
Music appreciation 0.6% 0.5% 1.0%
Gray shaded box indicates that the estimate is significantly different from the 2012 estimate at the .05 level
Overall, 7.3 percent of Americans engaged in arts learning through classes or lessons in last 12 months. As expected, college-age adults (aged 18 to 24) are the most likely to be taking arts lessons or classes (Figure 4-4). While a higher percentage of white adults reported taking arts classes or lessons at any point in their lives, the share of all adults who had taken classes/lessons in the last 12 months was much more diverse. Evidence for this is shown by the relatively higher rates of African Americans and Hispanics taking acting, dance, creative writing, and music appreciation classes/lessons in the past year versus at any time in their lives. If this trend continues into the future, the historical gap between whites and non-whites who have had formal education in the arts eventually may close.
Adults 18 to 24 The arts learning participation rates for adults 18 to 24 is especially informative. Younger adults are better able to recall whether they have taken classes as a child, making their reporting more reliable. Figure 4-5 shows the percentage of 18- to 24-year-olds taking arts classes or lessons at any time in their life and the percentage taking them within the last 12 months in 2002, 2008, and 2012. A positive and promising sign for future arts participation is that lifetime participation in the arts for adults 18 to 24 has increased from 2008 levels across all comparable genres and also increased from 2002 levels for all genres except taking acting or theater classes. In fact, the number of 18- to 24-year-olds taking visual arts classes in 2012 probably would have been even greater had the question included photography and filmmaking as it did in 2002 and 2008.

63 • chapter 4. participation in arts learning activities
Figure 4-5. Percentage of 18- to 24-year-olds who took arts classes or lessons at any time in their lives and percentage who took art classes or lessons within the last 12 months: 2002, 2008, and 2012
Percent who took art classes/lessons at any time in their lives Percent who took art classes/lessons during the last 12 months
2002 2008 2012 2002 2008 2012
Music 36.6% 37.5% 42.9% 5.3% 2.2% 5.3%
Visual arts 21.9% 21.5% 26.9% 5.8% 5.7% 3.5%
Acting or theater 11.0% 9.0% 10.6% 2.9% 1.3% 1.0%
Photography or filmmaking
Not comparable Not comparable 9.8% Not comparable Not comparable 2.6%
Dance Not comparable 11.9% 17.3% Not comparable 2.3% 3.0%
Creative writing 16.9% 17.5% 23.6% 4.7% 5.2% 5.9%
Art appreciation or art history
18.7% 15.1% 22.6% 5.1% 5.9% 5.2%
Music appreciation 16.1% 13.6% 17.9% 3.7% 3.7% 3.1%
Gray shaded box indicates that the estimate is significantly different from the 2012 estimate at the .05 level
Visual Arts in 2002 and 2008 included photography and filmmaking
2002 SPPA did not ask about dance other than ballet
Learning for a Lifetime: Childhood versus Adulthood, and Formal versus Informal Instruction
Figure 4-6 shows Americans’ patterns of participation in arts learning when the definition is broadened to include informal teaching methods. Informal learning may include learning from family or friends, self-instruction or learning from books, and learning through the Internet (fourth column). The information in Figure 4-5 differs from Figure 4-2 in showing the distinction between classes taken as a child and classes taken as an adult. Figure 4-2, by contrast, reports a consolidation of the two stages of learning.
Music tops the list as the most common art form studied when the survey respondents were children (Figure 4-6). Nearly a third of adults said they took music classes or lessons as a child. The second most common art form studied as children is visual arts; 14 percent learned visual arts through classes or lessons. As children, survey respondents were the least likely to have taken photography or filmmaking classes (5 percent).
As adults, meanwhile, the most common form of arts learning that occurred through adult classes or lessons is art appreciation and art history. Thirteen percent of Americans said they enrolled in these classes or lessons as adults. Through adult classes or lessons, the least commonly studied art form is acting and theater. Only 3 percent of Americans engaged in this type of learning as adults.
Adults are about as likely to study dance through classes and lessons as through less formal methods, such as learning from a friend or by teaching oneself. Seventeen percent of Americans took dance lessons at some point in their lives, and 16 percent reported learning dance some other way. Photography, too, is often learned informally. Nine percent of adults took photography and filmmaking lessons or classes, while 13 percent said they learned through other means. Music, however, is much more likely to be learned through formal instruction. Thirty-six percent of adults took music lessons or classes at some point, while 18 percent learned from a friend or family member or by teaching themselves.
Figure 4-6. Percentage of U.S. adults who participated in arts learning during their lifetime, by art form studied and by mode of learning: 2012
Percent of U.S. adult population
Took classes/lessons
as a child
Took classes/lessons
as an adult
Learned through
other means
43.0% 32.8% 36.6%
Music 32.8% 11.3% 18.3%
Visual arts 13.9% 11.4% 10.3%
Acting or theater 6.0% 2.8% 4.2%
Photography or filmmaking
4.8% 6.5% 13.2%
Dance 11.6% 9.6% 16.0%
Creative writing 10.1% 11.2% 7.3%
Art appreciation or Art history
8.9% 13.0% 10.7%
Music appreciation 8.9% 8.5% 11.4%

2012 survey of public participation in the arts • 64
Learning in the arts occurs more commonly in school than outside it (Figure 4-7 and Chart 4-3). The one exception is dance.
Figure 4-7. Percentage of U.S. adults who participated in arts learning at any time in their lives, by whether such learning occurred in or outside of school: 2012
Percent of U.S. adult population Number of adults
Took Classes/lessons in school Took classes/lessons outside school
Took classes/lessons in school Took classes/lessons outside school
Music 28.1% 19.8% 66,070,785 46,528,722
Visual arts 15.5% 8.7% 36,455,958 20,529,036
Acting or theater 6.3% 2.3% 14,865,927 5,355,738
Photography or filmmaking
7.3% 3.8% 17,154,529 8,894,741
Dance 7.5% 12.9% 17,699,009 30,314,167
Creative writing 14.7% 2.9% 34,659,668 6,795,308
Art appreciation or art history
17.1% 2.5% 40,183,896 5,831,600
Music appreciation 12.9% 2.8% 30,314,167 6,680,396
Chart 4-3. Percentage of arts learning occurring in school versus outside school
0%
25%
50%
75%
100%
Music appreciation
Art appreciatio
n
Creative w
riting
Dance
Photography or film
Acting
Visual arts
Music
In-school Outside of school
19.8%
28.1%
8.7%
15.5%
2.3%
6.3%
3.8%
7.3%
12.9%
7.5%
2.9%
14.7%
2.5%
17.1%
2.8%
12.9%

65 • chapter 4. participation in arts learning activities
Over half of American adults were exposed to the arts as a child, either through visiting an art museum or gallery or attending a live music, theater, or dance performance (Figure 4-8). More women than men experienced the arts, as children, through these activities. The oldest generation of Americans is less likely to report having participated in these activities as a child. Over 60 percent of Americans currently aged 18 to 24 visited an art museum or gallery between the ages of 5 and 17, compared with 38 percent of Americans now 75 or older. Even taking into account the possibility of misreporting experiences that occurred decades earlier, the difference is large. Similarly, Americans 65 and older are less likely to have attended a live music, theater, or dance performance than are younger Americans.
Childhood experience with the arts is significantly associated with the adults’ educational level and family income. Over 70 percent of college graduates said they visited an art museum or gallery as a child, compared with 42 percent of adults with only a high school diploma. And 41 percent of people from families that currently earn less than $20,000 annually said they visited an art museum or gallery as a child, compared with 75 percent of adults from families now earning $150,000 or more (Figure 4-8). The same trend is true for attendance at a live music, theater, or dance performance as a child. One interpretation of this data is that children who are privileged enough to visit an art museum or gallery also enjoy socioeconomic advantages such as the ability to receive a college education. Another interpretation is that the experience of early participation in the arts encourages children to pursue other opportunities, such as education, to expand their horizons.
Figure 4-8. Demographic distribution of U.S. adults who experienced arts as a child, by activity: 2012
U.S. adult population Visited an art museum
or gallery as a child
Attended a live music,
theater, or dance
performance as a child
Millions Percent
235.0 100.0% 54.3% 55.6%
Gender
Male 113.1 48.1% 52.6% 53.4%
Female 121.9 51.9% 55.9% 57.7%
Race/ethnicity
Hispanic 35.0 14.9% 39.0% 43.2%
White 155.7 66.3% 59.2% 60.3%
African American
26.8 11.4% 44.9% 46.8%
Other 17.5 7.4% 55.4% 50.8%
Age
18–24 30.4 13.0% 60.8% 62.0%
25–34 41.0 17.4% 56.3% 59.9%
35–44 39.6 16.9% 57.7% 61.4%
45–54 43.7 18.6% 54.6% 55.1%
55–64 38.3 16.3% 53.9% 54.0%
65–74 23.8 10.1% 48.2% 46.2%
75+ 18.1 7.7% 37.7% 36.7%
Highest level of education
Grade school 9.9 4.2% 8.7% 17.1%
Some high school
19.0 8.1% 32.4% 30.7%
High school graduate
70.9 30.2% 42.1% 44.0%
Some college 68.7 29.2% 61.3% 61.3%
College graduate
43.0 18.3% 73.6% 73.6%
Graduate school 23.5 10.0% 76.5% 76.5%
Family income
Less than $20K 40.9 17.4% 41.1% 41.1%
$20K to $50K 76.0 32.3% 47.1% 47.1%
$50K to $75K 43.9 18.7% 56.2% 56.2%
$75K to $100K 27.6 11.7% 63.5% 63.5%
$100K to $150K 27.1 11.5% 65.1% 65.1%
$150K and over 19.6 8.3% 74.9% 74.9%

2012 survey of public participation in the arts • 66
Arts Learning Experiences of Children, According to Responding Parents
Twenty-four percent of adults in the survey had school-aged children, aged 5 to 17. Two-thirds of these parents said their child was taught art or music in school, and one-quarter said their child received arts or music instruction outside school. With the exception of elementary, middle, or high school performances, 42 percent of children went to an art museum or gallery or attended a live music, theater, or dance performance during the last 12 months.
Non-Hispanic white parents were more likely than parents from other racial and/or ethnic groups to have children who received arts or music instruction, in school and out, and they also were more likely to have children who attended a live arts performance or visited an art museum or gallery (Figure 4-9).
The more educated the parents or the higher the family’s income, the more likely children were to have taken arts or music classes in or out of school, attended a live music, theater, or dance performance, or visited an art museum or gallery. Parental age is also a noteworthy variable: children whose parents were 35 or older were more likely than children with younger parents to have taken arts or music classes in or out of school, attended a live music, theater, or dance performance, or to have visited an art museum or gallery.
Figure 4-9. Demographic distribution of U.S. adults whose school-age children received arts or music instruction, attended a live arts performance, or visited an art museum or gallery during the last 12 months: 2012
U.S. adults with children between ages 5 and 17 Note: Adults with school-aged children compose 24% of
the U.S. population
Child was taught art or music
in school
Child was taught art or music
outside school
Child went to an art museum
or gallery or attended a
live music, dance, or theater
performance
all parents of school-age children
69.4% 24.8% 42.1%
Gender
Male 71.0% 27.2% 45.4%
Female 68.2% 22.8% 39.4%
Race/ethnicity
Hispanic 55.7% 10.2% 28.9%
White 75.1% 30.7% 48.3%
African American
66.9% 19.3% 33.1%
Other 65.8% 25.6% 42.3%
Age
18–34 64.9% 19.4% 31.9%
35–64 72.9% 27.3% 46.8%
Highest level of education
Grade school 43.0% 5.6% 18.6%
Some high school
63.7% 7.5% 30.9%
High school graduate
59.2% 13.5% 31.0%
Some college 72.4% 29.1% 42.5%
College graduate
82.2% 40.6% 55.6%
Graduate school 82.7% 38.5% 66.9%
Family income
Less than $50K 61.5% 14.5% 29.4%
$50K to $100K 74.6% 28.0% 44.6%
$100K and over 77.1% 38.8% 61.0%
Gray shaded box indicates that the estimate is significantly different from the 2012 estimate at the .05 level

Laura Moulton converses with a patron of Street Books, the mobile library she established for homeless individuals in Portland, Oregon. Photo by Jodi Darby
Chapter 5. Reading and Film Attendance

2012 survey of public participation in the arts • 68
Sample Findings
• Over half of American adults read at least one book in 2012. This is unchanged from 2008, but in 2002 slightly more adults read books.
• The percentage of adults reading a play, poem, or novel in 2012 dropped to 2002 levels (47 percent) after increasing to 50 percent in 2008.
• Women are far more likely to read books or literature than are men.
• Men are more likely to read nonfiction than fiction, while the opposite is true for women.
• Reading of books and literature has increased among older adults in the past decade.
• Movie-going is as popular today as it was a decade ago. Over three-fourths of the youngest adults (aged 18 to 24) attended a movie in 2012.
• Movie-going among all racial and ethnic subgroups declined from 2002 to 2008 but rose to 2002 levels in 2012. In fact, movie-going among African Americans is higher in 2012 than it was ten years ago.
• While the overall rate of movie-going was the same as in 2002, far greater numbers of older adults went to see a movie in 2012 than 10 years ago—particularly adults 75 years of age and older.
• Two percent of adults attended a film festival in 2012, with men and women attending at equal rates.
• About 4 percent of adults belonged to a book club or reading group in 2012.

69 • chapter 5. reading and film attendance
Reading Books and/or Literature
Since its inception, the SPPA has captured data on how many American adults read literature, as measured by the percentage who read at least one novel or short story, poem, or play during the past 12 months. In 1992, the survey began also to track adults who had read any book not required for work or school. In 2012, the survey included an experimental module, which asked for the first time about reading fiction versus nonfiction.
In 2012, 55 percent of adults reported reading, during the previous 12 months, at least one book that was not required for work or school. This share is unchanged from 2008 but slightly lower than the 2002 rate (Figure 5-1). The percentage of adults reading a play, poem, or novel or short story in 2012 (see “Literature” in Figure 5-1) dropped to 2002 levels (47 percent) after increasing to 50 percent in 2008. Poetry-reading in particular has seen a sharp drop from 2002 levels.
Figure 5-1. Reading activity: 2002, 2008, and 2012
Percent of U.S. adult population
Reading during the past 12 months
2002 2008 2012
Read any book not required for work or school
56.6% 54.3% 54.6%
Literature (plays, poetry, or novels or short stories)
46.7% 50.2% 47.0%
Read novels or short stories
45.1% 47.0% 45.2%
Read plays 3.6% 2.6% 2.9%
Read poetry 12.1% 8.3% 6.7%
Gray shaded box indicates that the estimate is significantly different from the 2012 estimate at the .05 level
Demographic information on readers of books and/or literature is presented in Figure 5-2. Far more women than men read books and/or literature; 64 percent of women read at least one book in 2012, compared with 45 percent of men, and 56 percent of women read literature, compared with 37 percent of men.
The 65 to 74 age group is the most likely to read books (60 percent of adults in this bracket) and literature (52 percent). Book and/or literature readership rates among all other age groups are similar to each other.
In 2012, over 50 percent of non-Hispanic white Americans, 40 percent of African Americans, and 31 percent of Hispanic Americans reported reading literature.
The rate of reading books and literature increases with educational level (Chart 5-1). Over 80 percent of Americans who attended graduate school read at least one book in the past 12 months, and 70 percent read literature. The largest differences in literary reading are related to education level—two-thirds of people with a college degree read literature, compared to slightly more than one-third of people with a high school education.
Chart 5-1. Percentage of U.S. adults who read books and/or literature during the past 12 months, by highest level of educational attainment: 2012
0% 25% 50% 75% 100%
Graduate school
College graduate
Some college
High school graduate
Some high school
Grade school
16.9%
21.6%
22.9%
27.7%
36.9%
41.2%
50.3%
59.8%
63.0%
72.5%
69.5%
81.7%
Read literature Read books Linear (read books)

2012 survey of public participation in the arts • 70
Figure 5-2. Demographic distribution and percentage of U.S. adults who read books and/or literature during the past 12 months: 2012
Demographic distribution of adults who read
Proportion of adults who read
Millions Percent Books Literature Books Literature
all adults 235.0 100.0% 100.0% 54.6% 47.0%
Gender
Male 113.1 48.1% 39.4% 37.9% 44.7% 37.0%
Female 121.9 51.9% 60.6% 62.1% 63.7% 56.1%
Total 100.0% 100.0% 100.0%
Race/ethnicity
Hispanic 35.0 14.9% 9.9% 9.8% 36.4% 31.0%
White 155.7 66.3% 73.7% 73.9% 60.6% 52.3%
African American 26.8 11.4% 9.6% 9.6% 46.4% 40.2%
Other 17.5 7.4% 6.8% 6.6% 49.8% 41.7%
Total 100.0% 100.0% 100.0%
Age
18–24 30.4 13.0% 12.1% 13.0% 51.8% 47.9%
25–34 41.0 17.4% 17.6% 17.8% 54.9% 47.9%
35–44 39.6 16.9% 16.4% 16.3% 53.0% 45.1%
45–54 43.7 18.6% 18.2% 17.7% 53.2% 44.7%
55–64 38.3 16.3% 17.0% 16.8% 56.6% 48.2%
65–74 23.8 10.1% 11.3% 11.2% 61.0% 51.9%
75+ 18.1 7.7% 7.4% 7.2% 52.2% 43.8%
Total 100.0% 100.0% 100.0%
Highest level of education
Grade school 9.9 4.2% 1.7% 1.5% 21.6% 16.9%
Some high school 19.0 8.1% 4.1% 4.0% 27.7% 22.9%
High school graduate 70.9 30.2% 22.6% 23.5% 41.2% 36.9%
Some college 68.7 29.2% 31.9% 31.3% 59.8% 50.3%
College graduate 43.0 18.3% 24.7% 24.9% 72.5% 63.0%
Graduate school 23.5 10.0% 15.0% 14.8% 81.7% 69.5%
Total 100.0% 100.0% 100.0%
Family income
Less than $20K 40.9 17.4% 13.9% 13.5% 43.5% 36.5%
$20K to $50K 76.0 32.3% 28.3% 29.0% 47.7% 42.2%
$50K to $75K 43.9 18.7% 19.3% 18.9% 56.8% 47.7%
$75K to $100K 27.6 11.7% 13.6% 13.4% 51.8% 52.8%
$100K to $150K 27.1 11.5% 14.1% 14.0% 67.1% 57.0%
$150K and over 19.6 8.3% 10.9% 11.2% 72.3% 63.3%
Total 100.0% 100.0% 100.0%

71 • chapter 5. reading and film attendance
Figure 5-3 shows 2012 readership rates for demographic subgroups and different reading materials.
Men are more likely to read nonfiction books than fiction, while the opposite holds true for women: 55 percent of women read fiction in 2012, and 48 percent read nonfiction. Young adults are more likely to read
fiction than nonfiction books, whereas the oldest Americans (aged 75 and older) are more likely to read nonfiction books.
Reading is positively correlated with educational level and family income, regardless of type of reading material.
Figure 5-3. Percentage of U.S. adults who read books and/or literature during the past 12 months, by choice of reading materials: 2012
Read fiction books Read nonfiction books Read novels or short stories
Read plays Read poetry
Demographics Distribution of readers
% that read Distribution of readers
% that read Distribution of readers
% that read Distribution of readers
% that read Distribution of readers
% that read
all adults 100.0% 44.4% 100.0% 42.7% 100.0% 45.2% 100.0% 2.9% 100.0% 6.7%
Gender
Male 35.3% 33.3% 41.0% 36.8% 37.3% 35.1% 38.1% 2.3% 37.3% 5.2%
Female 64.7% 54.5% 59.0% 48.2% 62.7% 54.6% 61.9% 3.4% 62.7% 8.0%
Total 100.0% 100.0% 100.0% 100.0% 100.0%
Race/ethnicity
Hispanic 8.6% 26.9% 9.7% 29.0% 9.5% 28.9% 8.2% 1.6% 11.0% 4.9%
White 76.3% 59.2% 73.9% 47.0% 74.6% 50.8% 80.5% 3.5% 72.0% 7.2%
African American 8.9% 36.8% 9.8% 38.0% 9.4% 37.7% 7.8% 2.0% 11.7% 6.9%
Other 6.2% 37.9% 6.6% 38.6% 6.6% 39.8% 3.6% 3.6% 5.3% 4.7%
Total 100.0% 100.0% 100.0% 100.0% 100.0%
Age
18–24 12.9% 45.3% 11.3% 39.2% 12.9% 45.8% 17.9% 4.0% 15.6% 8.2%
25–34 17.0% 45.0% 16.0% 41.3% 17.8% 46.0% 17.0% 2.8% 17.6% 6.7%
35–44 17.0% 42.6% 17.0% 41.3% 16.4% 43.7% 12.7% 2.1% 15.3% 6.0%
45–54 18.6% 43.0% 18.9% 41.9% 17.7% 42.9% 17.5% 2.7% 13.5% 4.8%
55–64 16.7% 45.4% 17.8% 45.4% 16.8% 46.5% 17.8% 3.1% 18.1% 7.4%
65–74 10.9% 48.8% 11.2% 48.6% 11.3% 50.4% 10.6% 3.0% 11.5% 7.6%
75+ 7.0% 40.4% 7.9% 42.6% 7.2% 42.1% 6.5% 2.4% 7.3% 7.3%
Total 100.0% 100.0% 100.0% 100.0% 100.0%
Highest level of education
Grade school 0.9% 12.1% 1.4% 19.2% 1.4% 15.4% 1.1% 0.7% 1.7% 2.7%
Some high school 3.6% 21.5% 3.8% 21.2% 3.8% 20.9% 2.6% 0.9% 4.1% 3.3%
High school graduate 22.7% 33.1% 22.1% 31.0% 23.0% 34.8% 18.3% 1.8% 22.0% 4.9%
Some college 30.9% 49.1% 29.8% 45.7% 31.6% 49.0% 30.7% 3.0% 29.0% 6.6%
College graduate 26.7% 60.5% 26.2% 57.3% 25.2% 61.4% 26.3% 4.1% 24.4% 8.7%
Graduate school 15.2% 65.8% 16.6% 68.8% 15.0% 68.0% 21.0% 6.0% 18.8% 12.5%
Total 100.0% 100.0% 100.0% 100.0% 100.0%
Family income
Less than $20K 12.3% 34.3% 13.4% 35.3% 13.3% 34.6% 12.5% 2.1% 17.0% 6.5%
$20K to $50K 26.7% 37.6% 26.9% 36.7% 28.8% 40.4% 27.3% 2.4% 28.5% 5.9%
$50K to $75K 20.1% 46.6% 20.2% 44.8% 18.7% 45.4% 14.5% 2.2% 20.3% 7.3%
$75K to $100K 13.1% 41.9% 13.0% 39.7% 13.6% 51.7% 14.0% 3.4% 11.0% 6.2%
$100K to $150K 15.6% 56.8% 14.5% 51.2% 14.3% 56.1% 17.1% 4.3% 12.6% 7.3%
$150K and over 12.1% 61.3% 11.9% 58.6% 11.3% 61.5% 14.6% 5.1% 10.5% 8.4%
Total 100.0% 100.0% 100.0% 100.0% 100.0%
Gray shaded box indicates that the estimate is significantly different from the 2012 estimate at the .05 level

2012 survey of public participation in the arts • 72
Chart 5-2 shows that over half of readers read both fiction and nonfiction. Of adults who read only one type of literature, slightly more read fiction than nonfiction.
Chart 5-2. Percentage of U.S. adult readers who read fiction, nonfiction, or both
Both 58.1%
Fiction 22.7%
Nonfiction19.2%

73 • chapter 5. reading and film attendance
Reading levels were higher among older adults in 2012 than in 2002 and 2008 (Figure 5-4). About 54 percent of adults between 65 and 74 years old read at least one book in 2002 and 2008 (compared with 60 percent in 2012), and 44 to 47 percent over 75 reported doing so over the same period (compared with 53 percent in 2012). With the exception of adults over 65, literary reading rates from 2008 to 2012 declined for all age groups.
Among non-Hispanic white Americans, Hispanics, and African Americans, the 2012 rates of reading were similar to the 2002 rates, albeit lower than in 2008.
A significant decline occurred from 2008 to 2012 in the literary reading rate among adults with only some high school education, dropping from 34 percent to 23 percent. However, the rate of 23 percent is the same as in 2002.
Figure 5-4. Percentage of U.S. adults who read books and/or literature during the past 12 months: 2002, 2008, and 2012
2002 2008 2012
Books Literature Books Literature Books Literature
all adults 56.6% 46.7% 54.3% 50.2% 54.6% 47.0%
Gender
Male 48.3% 37.6% 46.3% 41.9% 44.7% 37.0%
Female 64.2% 55.1% 61.7% 58.0% 63.7% 56.1%
Race/ethnicity
Hispanic 35.6% 26.5% 32.8% 31.9% 36.4% 31.0%
White 61.3% 51.4% 60.8% 55.7% 60.6% 52.3%
African American 47.1% 37.1% 43.4% 42.6% 46.4% 40.2%
Other 56.1% 43.7% 47.7% 43.9% 49.8% 41.7%
Age
18–24 52.0% 42.8% 50.7% 51.7% 51.8% 47.9%
25–34 58.9% 47.7% 54.1% 50.1% 54.9% 47.9%
35–44 59.0% 46.6% 56.2% 50.8% 53.0% 45.1%
45–54 60.7% 51.6% 54.2% 50.3% 53.2% 44.7%
55–64 57.5% 48.9% 58.4% 53.1% 56.6% 48.2%
65–74 53.8% 45.3% 54.5% 49.1% 61.0% 51.9%
75+ 44.3% 36.7% 47.4% 42.3% 52.2% 43.8%
Highest level of education
Grade school 22.8% 14.0% 18.7% 18.5% 21.6% 16.9%
Some high school 30.8% 23.3% 33.4% 34.3% 27.7% 22.9%
High school graduate 46.0% 37.7% 41.5% 39.1% 41.2% 36.9%
Some college 63.9% 52.9% 60.0% 56.2% 59.8% 50.3%
College graduate 76.7% 63.1% 74.1% 66.6% 72.5% 63.0%
Graduate school 84.2% 74.3% 80.8% 71.2% 81.7% 69.5%
Family income
Less than $20K 43.5% 36.5%
$20K to $50K 47.7% 42.2%
$50K to $75K 56.8% 47.7%
$75K to $100K 51.8% 52.8%
$100K to $150K 67.1% 57.0%
$150K and over 72.3% 63.3%
Gray shaded box indicates that the estimate is significantly different from the 2012 estimate at the .05 level

2012 survey of public participation in the arts • 74
The 2012 SPPA added a question about whether people participated in a book club or reading group. About 4 percent of adults participated in a book club or reading group in 2012 (Figure 5-5). Similar to reading literature, participating in a book club or reading group is positively related to education and family income. African Americans are slightly more likely than adults from other racial/ethnic backgrounds to belong to a book club, and Hispanics are the least likely racial/ethnic group to belong to one.
Figure 5-5. Percentage of adults who belong to a book club or reading group: 2012
Demographic distribution of participants
Percent who participated
all adults 100.0% 3.5%Gender
Male 25.2% 1.9%
Female 74.8% 5.1%
Race/ethnicity
Hispanic 5.3% 1.4%
White 72.5% 3.8%
African American 16.6% 5.0%
Other 5.5% 2.9%
Age
18–24 10.1% 2.8%
25–34 14.6% 3.0%
35–44 17.2% 3.7%
45–54 20.5% 4.0%
55–64 17.6% 3.8%
65–74 13.5% 4.6%
75+ 6.5% 3.0%
Highest level of education
Grade school 1.8% 1.7%
Some high school 1.0% 0.4%
High school graduate 18.2% 2.2%
Some college 24.2% 2.8%
College graduate 29.9% 5.6%
Graduate school 24.9% 9.2%
Family income
Less than $20K 10.4% 2.3%
$20K to $50K 21.7% 2.4%
$50K to $75K 22.7% 4.2%
$75K to $100K 13.2% 3.9%
$100K to $150K 18.2% 5.3%
$150K and over 13.8% 6.1%
Gray shaded box indicates that the estimate is significantly different from the overall 2012 estimate at the .05 level

75 • chapter 5. reading and film attendance
Figure 5-6 displays the reading frequency of U.S. adults for all books (not just literature) in 2002, 2008, and 2012. Among people who read, the largest group read one to five books a year. In 2012, only 8 percent of readers, and 5 percent of all adults, read 50 books or more.
Reading has decreased over the past decade in all reading frequency categories except among “moderate” readers (those who read 6 to 11 books per year); the number of moderate readers increased from 2002 to 2012.
Readers read an average of 14.3 books in 2012, an increase over the 2008 average (12.8 books), but fewer books than the 18.5 in 2002.
Figure 5-6. Percentage of U.S. adults who read during the past 12 months, by frequency (number of books read): 2002, 2008, and 2012
Number of books read per year
2002 2008 2012
All adults
Light (1–5 books) 29.4% 26.1% 23.4%
Moderate (6–11 books)
7.4% 10.9% 10.4%
Frequent (12–49 books)
15.7% 13.7% 13.2%
Avid (50 books or more)
4.1% 4.6% 4.6%
All book-readers
Light (1–5 books) 51.9% 48.1% 48.3%
Moderate (6–11 books)
13.0% 20.0% 19.1%
Frequent (12–49 books)
27.8% 25.2% 24.2%
Avid (50 books or more)
7.3% 6.7% 8.4%
Gray shaded box indicates that the estimate is significantly different from the 2012 estimate at the .05 level

2012 survey of public participation in the arts • 76
Movie-Going
Fifty-nine percent of American adults attended a movie in 2012 (Figure 5-7). This share is the same as in 2002 but significantly higher than the percentage who attended four years earlier. Figure 5-8 shows the demographic characteristics of movie-goers in 2012. The last column shows that movie attendance is inversely related to age and that the likelihood of attending a movie increases with educational level and family income. Chart 5-3 illustrates how movie attendance increases as education and income go up, but decreases with age. Over half of adults from each racial and/or ethnic group attended a movie in 2012, and non-white Hispanics attended at the highest rate. Over three-fourths of the youngest adults (aged 18 to 24) attended a movie in 2012. Despite the high proportion, it represents a decline from 2002 rates for this age group (Figure 5-9).
Figure 5-7. Percentage of U.S. adults who went to a movie: 2002, 2008, and 2012.
2002 2008 2012
60.0% 53.3% 59.4%
Gray shaded box indicates that the estimate is significantly different from the 2012 estimate at the .05 level
Figure 5-8. Percentage of U.S. adults who went to a movie, by demographic characteristics: 2012
U.S. Adult Population Demo-graphic
distribution of
attendees
Percent who
attendedMillions Percent
all adults 235.0 100.0% 100.0% 59.4%
Gender
Male 113.1 48.1% 47.2% 58.2%
Female 121.9 51.9% 42.8% 60.4%
Race/ethnicity
Hispanic 35.0 14.9% 12.8% 54.8%
White 155.7 66.3% 69.9% 61.6%
African American 26.8 11.4% 10.7% 53.3%
Other 17.5 7.4% 6.6% 57.5%
Age
18–24 30.4 13.0% 16.5% 75.7%
25–34 41.0 17.4% 20.0% 68.5%
35–44 39.6 16.9% 19.1% 68.3%
45–54 43.7 18.6% 18.6% 59.9%
55–64 38.3 16.3% 14.1% 50.6%
65–74 23.8 10.1% 7.8% 44.1%
75+ 18.1 7.7% 4.0% 30.6%
Highest level of education
Grade school 9.9 4.2% 1.4% 21.6%
Some high school 19.0 8.1% 5.0% 36.7%
High school graduate 70.9 30.2% 24.0% 48.6%
Some college 68.7 29.2% 33.2% 64.9%
College graduate 43.0 18.3% 24.0% 75.3%
Graduate school 23.5 10.0% 12.5% 76.8%
Family income
Less than $20K 40.9 17.4% 10.8% 39.4%
$20K to $50K 76.0 32.3% 27.2% 50.3%
$50K to $75K 43.9 18.7% 21.2% 65.3%
$75K to $100K 27.6 11.7% 15.0% 74.8%
$100K to $150K 27.1 11.5% 15.2% 73.0%
$150K and over 19.6 8.3% 10.5% 77.9%
Gray shaded box indicates that the estimate is significantly different from the 2012 estimate at the .05 level

77 • chapter 5. reading and film attendance
Chart 5-3. Relationship between movie attendance and age, education, and family income
0%
10%
20%
30%
40%
50%
60%
70%
80%
90%
More/older Less/younger
68.4%
59.9% 50.6%
AgeIncome Education
44.1%
30.6%
21.6%
36.7%48.6%
64.9%
75.3%
76.8%
77.9%
73.0%
74.8%
65.3%
50.3%
39.4%
75.7%
While the rate of movie-going among all adults is the same in 2012 as in 2002, the rate among older adults has increased over the past decade (Figure 5-8). In particular, adults 75 years of age and older attended movies in 2012 at 1.5 times their 2002 rate. Movie-going among all racial and ethnic subgroups declined from 2002 to 2008 but rose to 2002 levels in 2012. In fact, movie-going among African Americans is higher in 2012 than it was ten years ago.
Figure 5-9. Percentage of U.S. adults who attended a movie, by demographic characteristics: 2002, 2008, and 2012
2002 2008 2012
all adults 60.0% 53.3% 59.4%
Gender
Male 59.5% 52.7% 58.2%
Female 60.5% 54.0% 60.4%
Race and/or ethnicity
Hispanic 52.5% 48.1% 54.8%
White 63.0% 55.7% 61.6%
African American 49.2% 47.4% 53.3%
Other 58.1% 49.3% 57.5%
Age
18–24 82.8% 74.2% 75.7%
25–34 73.3% 64.5% 68.5%
35–44 68.0% 59.5% 68.3%
45–54 60.4% 52.6% 59.9%
55–64 46.6% 46.2% 50.6%
65–74 32.2% 31.7% 44.1%
75+ 19.5% 18.9% 30.6%
Highest level of education
Grade school 19.5% 15.9% 21.6%
Some high school 39.4% 37.9% 36.7%
High school graduate 51.7% 42.5% 48.6%
Some college 68.7% 60.8% 64.9%
College graduate 77.1% 68.8% 75.3%
Graduate school 77.5% 71.6% 76.8%
Gray shaded box indicates that the estimate is significantly different from the 2012 estimate for the same sub-group at the .05 level

2012 survey of public participation in the arts • 78
The 2012 SPPA added a question about attendance at film festivals. Two percent of adults attended a film festival in 2012, with men and women attending at equal rates (Figure 5-10). Similar to movie-going, attendance at film festivals is inversely related to age and positively related to education and family income. African Americans are slightly less likely than adults from other racial or ethnic backgrounds to attend a film festival, and Americans other than white, black, or Hispanic are the most likely to attend.
Figure 5-10. Percentage of adults who attended a film festival: 2012
Demographic distribution of attendees
Percent who attended
all adults 100.0% 2.4%
Gender
Male 47.2% 2.4%
Female 52.8% 2.5%
Race/ethnicity
Hispanic 13.4% 2.2%
White 69.8% 2.6%
African American 7.7% 1.6%
Other 9.1% 3.1%
Age
18–24 15.6% 3.0%
25–34 21.4% 3.0%
35–44 14.9% 2.2%
45–54 19.7% 2.6%
55–64 16.3% 2.4%
65–74 8.2% 2.0%
75+ 3.9% 1.2%
Highest level of education
Grade school 1.5% 1.0%
Some high school 1.3% 0.4%
High school graduate 11.4% 0.9%
Some college 31.1% 2.6%
College graduate 30.7% 3.9%
Graduate school 23.9% 6.0%
Family income
Less than $20K 11.3% 1.7%
$20K to $50K 24.1% 1.8%
$50K to $75K 24.8% 3.1%
$75K to $100K 15.0% 3.1%
$100K to $150K 12.4% 2.4%
$150K and over 12.5% 3.7%
Gray shaded box indicates that the estimate is significantly different from the overall 2012 estimate at the .05 level

Wheat-paste work by Jetsonorama. Turecek Family Farm, Byers Colorado. From M12 photo archive
Chapter 6. Regional Differences in Arts Participation

2012 survey of public participation in the arts • 80
Sample Findings
• For all U.S. census regions except New England, a decline in “benchmark” arts attendance was observed from 2002 to 2008, continuing in 2012. Still, the New England, Pacific, and Mountain regions show consistently higher attendance rates for benchmark arts events than do other regions.
• West South Central is the only U.S. region that saw an increase in arts attendance since 2008, although its 2012 rates were still lower than ten years earlier.
• West North Central and South Atlantic residents were more likely to have attended a visual or performing arts event in a church or other religious institution than were U.S. adults in general. New England residents were the least likely.
• East North Central residents attended visual or performing arts events at elementary or high schools, or at parks or outdoor facilities, at comparatively higher rates. They also reported high rates of attendance at outdoor performing arts festivals, as did Pacific area residents.
• Pacific area residents had among the highest rates of media consumption for nearly every art form referenced in the 2012 SPPA. For example, they were more likely than residents from most other parts of the country to listen to or view recorded or broadcast jazz, classical music, Latin music, opera, and musical plays.
• In general, Pacific residents appear to prefer different types of music more than do residents from any other region of the country. East South Central residents appear to enjoy different genres the least.
• Rates of reading literature are highest in the Mountain and New England regions, while reading rates are lowest in the East and West South Central regions.
• Mountain, New England, and West North Central region residents are more likely than U.S. adults in general to have created, performed, shared, or edited or remixed artworks. (Roughly 50 percent of adults from those regions did so, compared with 43 percent of all adults.)
• Residents of the New England, Mountain, and Pacific regions are more likely than adults living in other parts of the country to have taken arts lessons or classes—whether in the past 12 months, as a child, or anytime during their lives. The Pacific region leads all others in rates of participation in arts learning activities.
• Adults living in the Pacific or Mountain region were the most likely to go out to see a movie, while those in the East South Central were the least likely. Attending film festivals occurred more often in the Pacific and Middle Atlantic regions and least often in the East and West South Central regions.
• New England had the highest share of adults subscribing or donating to an arts or cultural organization (9 percent). They also played sports and participated in community meetings at higher levels than the national rate.
• Adults living in metro areas were much more likely than non-metro area residents to attend live arts performances. There is one notable exception, however: art/craft fairs or festivals were attended at higher rates by non-metro residents.

81 • chapter 6. regional differences in arts participation
The SPPA sample size is not large enough to provide statistically meaningful breakouts for most states. This chapter, therefore, examines geographic differences in arts participation (as well as arts education and music listening preferences) by U.S. census region. Some of the regional differences in arts attendance can be attributed to relative access and opportunity as resources, venues, and income vary broadly by region.
Results are tabulated by the home address of the respondent. For example, a resident from New Mexico may have attended a ballet in New York City, but that attendance would be counted in the Mountain region. In this chapter, SPPA data are parsed by the following census regions:
• New England. Maine, New Hampshire, Vermont, Massachusetts, Rhode Island, and Connecticut
• Pacific region. California, Oregon, Washington, Alaska, and Hawaii
• Middle Atlantic region. New York, New Jersey, and Pennsylvania
• Mountain region. Montana, Idaho, Nevada, Utah, Wyoming, Colorado, Arizona, and New Mexico
• West North Central region. North Dakota, South Dakota, Minnesota, Nebraska, Iowa, Kansas, and Missouri
• East North Central region. Wisconsin, Illinois, Indiana, Michigan, and Ohio
• South Atlantic region. Maryland, Washington, DC, Delaware, Virginia, West Virginia, North Carolina, South Carolina, Georgia, and Florida
• West South Central region. Texas, Oklahoma, Arkansas, and Louisiana
• East South Central region. Kentucky, Tennessee, Alabama, and Mississippi
Attendance at Benchmark Arts Events
As explained in Chapter 2, the SPPA has been tracking attendance at certain types of arts events, known as “benchmark” arts activities, since 1982. These activities include attendance at jazz performances, classical music performances, operas, musical or non-musical plays, ballet performances, or visits to art museums or galleries. Figure 6-1 compares participation in benchmark activities across regions from 2002 to 2012.
Across the board, regional rates in arts attendance were much lower in 2012 than in 2002. For all regions except New England, a decline was observed from 2002 to 2008, though a decline from 2008 to 2012 was experienced only in the following regions: New England, East North Central, and West South Central.
West South Central is the only U.S. region that saw an increase in arts attendance since 2008, although 2012 rates are still lower than ten years ago. Arts attendance in the Mountain region dropped dramatically from 2002 to 2008 but stabilized in 2012.
New England, Pacific, and Mountain region residents had consistently higher arts attendance rates than did residents from other regions. About 38 percent of New England residents and 39 percent of Mountain and Pacific region residents reported going to see jazz, classical music, opera, a musical or non-musical play, ballet, or visiting an art museum or gallery in the 12-month period of the 2012 SPPA. Attendance at benchmark arts activities by East South Central, West South Central, and South Atlantic residents have generally been lower than for other parts of the country. Nevertheless, as noted, the West South Central region saw an increase over its 2008 participation rates.
Figure 6-1. Percentage of U.S. adults who attended a benchmark arts activity at least once in the past 12 months, by census region: 2002, 2008, and 2012
2002 2008 2012
New England 42.7 42.2 38.0
Middle Atlantic 41.9 36.5 34.7
East North Central 39.3 35.4 31.9
West North Central 40.4 35.4 36.9
South Atlantic 35.8 31.3 29.1
East South Central 30.4 24.9 23.5
West South Central 33.0 26.8 30.3
Mountain 46.8 36.4 39.1
Pacific 45.0 41.8 39.1
Gray Shaded Box indicates that the estimate is significantly different from the overall 2012 estimate at the .05 level

2012 survey of public participation in the arts • 82
Figure 6-2 shows 2012 participation rates for each benchmark arts activity (attending a jazz, classical music, opera, musical or non-musical play, or ballet performance, or visiting an art museum/gallery).
New England residents are more likely than residents of other regions to attend jazz performances; people living in the East South Central region are the least likely to attend. A greater share of adults in the Mountain region attend classical music than any other U.S. region; classical music, meanwhile, has the lowest rate of attendance among East South Central residents.
Nationwide, 2 percent of American adults attended live opera in 2012. Pacific residents exceeded this rate, whereas East South Central residents fell below it. Americans living in the Pacific, Mountain, or New England regions were more likely than other Americans to have visited an art museum or gallery in 2012, and residents in the southern U.S. (East South Central, South Atlantic, or West South Central regions) were the least likely.
Figure 6-2. Percentage of U.S. adults who attended benchmark arts events at least once in the past 12 months, by census region and type of event: 2012
All adults New England
Middle Atlantic
East North Central
West North Central
South Atlantic
East South Central
West South Central
Mountain Pacific
Benchmark (any of the following)
33.4% 38.0% 34.7% 31.9% 36.9% 29.1% 23.5% 30.3% 39.1% 39.1%
Jazz 8.1% 10.4% 7.7% 7.8% 9.7% 8.1% 4.6% 7.9% 7.6% 9.1%
Classical music 8.8% 10.2% 8.3% 9.6% 8.6% 7.0% 6.6% 8.5% 13.0% 9.4%
Opera 2.1% 1.6% 2.8% 1.9% 2.4% 1.5% 1.1% 1.7% 2.5% 3.0%
Musical plays 15.2% 16.6% 17.5% 15.0% 19.5% 12.7% 9.8% 13.1% 17.4% 16.8%
Non-musical plays 8.3% 8.3% 9.2% 7.7% 9.7% 7.1% 6.2% 5.6% 10.5% 10.5%
Ballet 2.7% 2.8% 2.9% 3.1% 2.2% 2.3% 2.2% 2.7% 2.6% 3.4%
Art museum or gallery
21.0% 23.9% 21.4% 19.8% 22.9% 17.6% 11.2% 17.5% 25.9% 28.3%
Gray Shaded Box indicates that the estimate is significantly different from the overall 2012 estimate at the .05 level
Other Kinds of Arts Attendance
In 2012, 51 percent of adults attended arts activities other than the benchmark activities that SPPA has been tracking since 1982, when the survey was established (Figure 6-3). (These “other” activities consist of Latin music events, dance performances other than ballet, craft fairs or visual arts festivals, outdoor performing arts festivals, tours of sites for historic or design purposes, and any other music, theatre, or dance other than what was already reported through the survey).
Nearly a quarter of American adults visited an historic park or monument. Residents of the New England, West North Central, or Mountain region were more likely than adults living elsewhere to visit, while residents of the West South Central or East South Central region were the least likely.
More than one-fifth of adults went to an art or craft festival in 2012. This activity has the highest rates of attendance in the Mountain and Pacific regions of the United States and the lowest in the West South Central, East South Central, or South Atlantic region. Twenty-one percent of Americans attended an outdoor performing arts festival in 2012. Residents of the Pacific or East North Central region were the most likely to attend; residents of a southern region (South Atlantic, East South Central, or West South Central) or the Middle Atlantic were the least likely.
Nationwide, 5 percent of Americans went to a Latin music event in 2012. Eight percent of Pacific residents attended, making their region most likely to attend, and 2 percent of East South Central residents attended, making theirs the least likely.

83 • chapter 6. regional differences in arts participation
Figure 6-3. Attendance at other arts activities, shown by census region: 2012
All adults New England
Middle Atlantic
East North Central
West North Central
South Atlantic
East South Central
West South Central
Mountain Pacific
Arts attendee (any of the following)
51.0% 58.0% 51.9% 51.9% 55.5% 45.5% 43.9% 45.5% 56.3% 56.5%
Latin music 5.1% 4.9% 5.5% 3.5% 3.5% 4.6% 1.6% 5.4% 5.0% 8.3%
Dance (other than ballet)
5.6% 6.0% 5.5% 5.8% 6.6% 5.0% 5.1% 5.2% 5.4% 6.5%
Visual arts festivals or craft fairs
22.4% 23.9% 20.5% 24.2% 24.6% 20.2% 19.5% 18.0% 26.4% 26.2%
Any other music, theater, or dance9
11.6% 16.6% 11.2% 13.6% 14.4% 9.2% 8.6% 8.5% 11.7% 13.8%
Outdoor performing arts festivals
20.8% 20.8% 18.0% 24.3% 21.6% 18.5% 18.3% 17.0% 21.4% 25.6%
Places visited for historic or design value
23.9% 28.1% 23.0% 23.6% 29.0% 22.5% 20.0% 19.4% 28.0% 26.2%
Gray Shaded Box indicates that the estimate is significantly different from the overall 2012 estimate at the .05 level
Venues Where Americans Enjoy Visual Art, Music, Theater, and Dance
In 2012, Americans who viewed an art exhibit or attended a music, theater, or dance performance were most likely to have done so at a park or open-air facility (15 percent of adults) (see Figure 6-4). This was especially true for people living in the Pacific and East North Central regions. Nearly 12 percent of adults went to an art or
music event at a restaurant, bar, nightclub, or coffee shop in 2012, and 12 percent attended or viewed an event at a theater, concert hall, or auditorium.
The findings about arts venues also reveal that East North Central and West North Central residents are generally more likely than people from other U.S. regions to have seen performances or exhibits in school and church settings.
Figure 6-4. Percentage of U.S. adults who viewed an art exhibit or attended a music, theater, or dance performance at least once in the past 12 months, by venue type and census region: 2012
All adults New England
Middle Atlantic
East North Central
West North Central
South Atlantic
East South Central
West South Central
Mountain Pacific
College/university 7.3% 9.7% 7.9% 5.9% 8.7% 7.2% 4.5% 5.9% 9.6% 8.0%
Grade school/ high school
10.0% 9.0% 10.3% 12.0% 13.5% 9.7% 4.9% 10.5% 9.4% 9.2%
Church or other religious venue
8.9% 4.7% 9.3% 8.8% 11.9% 10.2% 9.9% 8.1% 8.6% 7.4%
Theater, concert hall, auditorium
12.5% 11.5% 13.0% 12.2% 13.9% 12.6% 6.3% 11.3% 14.6% 14.4%
Restaurant, bar, nightclub, coffee shop
11.7% 12.9% 13.1% 10.5% 12.4% 11.0% 7.2% 10.5% 11.8% 14.1%
Art museum or gallery 9.1% 9.7% 9.1% 8.5% 10.2% 7.4% 4.3% 6.2% 11.6% 13.8%
Park or open-air facility 15.3% 13.3% 15.3% 19.4% 16.5% 13.5% 7.6% 10.9% 16.7% 19.1%
Community center 4.5% 5.1% 5.1% 4.4% 3.4% 4.3% 3.2% 3.2% 5.9% 5.8%
Gray Shaded Box indicates that the estimate is significantly different from the overall 2012 estimate at the .05 level
9 “Any other music, theater, or dance” refers to a question that followed the SPPA’s
traditional questions about music, theater, or dance. The purpose was to capture
events that had not already been reported. Examples might be attendance at a
rock or folk concert or a hip-hop performance.

2012 survey of public participation in the arts • 84
Music Listening Preferences
Figure 6-5 shows the types of music enjoyed by our nation’s adults. Americans listen to classic rock or oldies (49 percent) more than to any other musical genre, followed by country music (41 percent). Far fewer proportions of adults listen to Asian, African, or Middle Eastern music (8 percent) or opera (9 percent).
The same figure reports the U.S. region where each type of music is most or least popular. For instance, classical
music is most popular in the Pacific region (34 percent of residents listen to it) and least popular in the East South Central (18 percent listen). In general, Pacific residents enjoy different types of music more than do residents from any other region of the country, and East South Central residents appear to enjoy different genres the least. East South Central region were more likely than all other regions to listen to hymns, gospel, or choir music.
Figure 6-5. Percentage of U.S. adults who like individual types of music, by census region and degree of preference: 2012
Music preferences All adults New England
Middle Atlantic
East North Central
West North Central
South Atlantic
East South Central
West South Central
Mountain Pacific
Classical music 26.3% 27.8% 28.1% 24.5% 27.3% 24.3% 17.8% 20.7% 28.1% 34.2%
Opera 8.8% 11.2% 10.1% 6.7% 8.8% 7.7% 4.5% 8.1% 9.6% 12.1%
Broadway musicals or show tunes
20.1% 23.1% 24.7% 21.0% 23.3% 19.2% 12.7% 13.0% 21.1% 21.9%
Jazz 26.6% 27.4% 28.1% 26.7% 27.8% 27.5% 21.4% 21.8% 25.1% 29.3%
Classic rock or oldies 48.9% 53.3% 49.6% 53.6% 58.1% 45.6% 42.4% 39.4% 51.4% 50.9%
Alternative or indie rock
19.4% 25.8% 20.2% 20.9% 22.4% 16.2% 10.1% 14.7% 22.3% 23.7%
Pop 36.7% 43.6% 38.1% 38.2% 38.5% 34.4% 29.6% 29.5% 37.9% 41.2%
Country music 40.5% 40.2% 33.9% 44.1% 52.8% 40.3% 49.3% 42.2% 41.7% 33.0%
Dance, techno, or electronica
15.9% 15.8% 17.7% 14.7% 14.3% 14.3% 9.7% 16.7% 16.6% 19.2%
Rap or hip-hop 20.0% 18.8% 19.1% 18.9% 19.4% 20.7% 16.1% 19.5% 17.4% 24.5%
Reggae 15.5% 19.2% 15.1% 13.6% 12.8% 16.3% 8.9% 11.7% 16.6% 21.4%
Blues, rhythm and blues, soul music
29.3% 29.0% 26.9% 30.3% 31.4% 30.4% 27.4% 26.1% 28.7% 31.7%
Latin, Spanish, or salsa 19.0% 14.9% 18.9% 14.6% 13.3% 16.6% 6.1% 22.2% 25.7% 29.1%
Asian, African, or Middle Eastern music
8.3% 9.3% 9.6% 7.3% 8.7% 6.7% 2.6% 5.9% 9.0% 12.9%
Bluegrass 16.3% 17.1% 12.5% 18.1% 20.6% 17.1% 16.3% 12.1% 18.1% 17.1%
Folk music 16.0% 18.9% 14.1% 16.5% 22.1% 14.9% 10.8% 11.6% 16.8% 19.7%
Hymns, gospel, or choir music
25.7% 14.4% 21.7% 24.7% 27.9% 31.7% 37.3% 27.8% 22.1% 21.0%
n Highest % who say they like
n Lowest % who say they like
Movie-Going, Literary Reading, and Participating in Other Leisure Activities
Movie-GoingMore than 59 percent of American adults went to a movie in 2012 (Figure 6-6). People living in the Pacific or Mountain region were the most likely to have gone, and those in the East South Central were the least likely. Attending film festivals occurred more often in the Pacific and Middle Atlantic region and least often in the East and West South Central regions.
Reading LiteratureThe rate of reading literature was highest in the Mountain and New England regions and lowest in the East and West South Central regions. The share of adults who participated in a book club or reading group was relatively consistent from region to region. Additionally, Figure 6-6 shows that about 47 percent of all U.S. adults read literature.

85 • chapter 6. regional differences in arts participation
Exercise, Sports, and Outdoor ActivitiesAbout 46 percent of Americans exercised or participated in a sport activity in 2012. (Please see the appendix to this report for detailed findings about sports and exercise participation.) New England residents were more likely than others to have exercised or played sports, and people living in the West South Central were the least likely. In 2012, about 39 percent of American adults said they gardened, an activity that did not depend very much on regional climate: 49 percent of New Englanders gardened, compared with 34 percent of South Atlantic residents. Residents in the West North Central states are among the most likely to have gone hiking, camping, canoeing, or hunting or fishing.
Other Forms of Social and Civic EngagementThe New England region had the highest percentage of adults participating in community activities (34 percent), the highest percentage subscribing to an arts or cultural event (9 percent), and the highest percentage donating to arts or cultural organizations (17 percent). The mountain region had the highest percentage of adults who volunteer for charity work (38 percent).
Figure 6-6. Percentage of U.S. adults who did selected leisure activities at least once in the past 12 months, by census region and type of activity: 2012
All adults New England
Middle Atlantic
East North Central
West North Central
South Atlantic
East South Central
West South Central
Mountain Pacific
Movies
Went to a movie 59.4% 59.2% 60.3% 58.3% 57.3% 58.9% 49.5% 57.5% 64.0% 64.2%
Attended a film festival
2.4% 3.0% 3.2% 1.6% 1.7% 2.5% 1.1% 1.2% 2.5% 4.0%
Reading
Read literature (plays, poetry, novels)
47.0% 51.9% 49.1% 47.5% 48.4% 46.7% 38.7% 42.8% 51.8% 46.9%
Participated in a book club or reading group
3.6% 3.7% 2.2% 3.9% 3.4% 3.5% 3.5% 3.7% 5.1% 3.6%
Outdoor activities
Attended a sporting event
30.4% 30.1% 30.4% 34.1% 34.8% 27.4% 23.1% 28.0% 31.0% 32.7%
Exercised or participated in a sports activity
45.7% 54.5% 47.9% 46.4% 50.3% 41.3% 42.2% 37.0% 49.4% 50.0%
Did hunting or fishing 17.1% 15.2% 11.9% 19.5% 26.2% 14.3% 22.5% 21.6% 19.3% 13.3%
Went camping, hiking, or canoeing
28.3% 32.0% 26.3% 29.2% 37.1% 19.3% 25.8% 18.9% 44.1% 35.9%
Did gardening 38.7% 48.7% 39.2% 43.1% 44.5% 33.9% 34.2% 34.6% 43.0% 38.0%
Civic engagement activities
Participated in a community activities, meetings, or events.
24.8% 33.9% 24.3% 26.2% 28.0% 24.5% 23.4% 20.5% 24.5% 24.5%
Do any volunteer or charity work
30.3% 36.1% 26.8% 31.7% 36.8% 27.3% 27.4% 26.8% 38.4% 31.2%
Member of or Subscribe to an arts or cultural organization
6.8% 8.7% 6.7% 6.6% 7.2% 5.9% 5.0% 6.6% 7.0% 8.0%
Donate any money, goods, or services to an arts or cultural organization
11.1% 16.5% 12.6% 9.9% 10.2% 9.2% 8.8% 9.8% 13.1% 13.2%
Gray Shaded Box indicates that the estimate is significantly different from the overall 2012 estimate at the .05 level

2012 survey of public participation in the arts • 86
Arts Consumption through Electronic Media
Pacific area residents had among the highest rates of media consumption for nearly every form of art studied in the 2012 SPPA. For example, they were more likely than others to view or listen to recorded or broadcast jazz, classical music, Latin music, opera, and theater productions. Pacific residents also had high media participation rates for programs about the visual arts
and programs about books and authors. Similarly, they reported higher usage of handheld or mobile electronic devices and were more likely to access art through these devices.
East South Central residents reported relatively low rates of media participation (below the national average) for most art forms. Figure 6-7 provides a detailed overview of arts/media participation rates for all regions.
Figure 6-7. Percentage of U.S. adults who consumed arts through broadcast or recorded media at least once during the past 12 months, by census region: 2012
All adults New England
Middle Atlantic
East North Central
West North Central
South Atlantic
East South Central
West South Central
Mountain Pacific
Watched or listened to a broadcast or recording (by TV, radio or Internet)
Jazz 11.8% 12.3% 12.2% 12.2% 10.8% 11.4% 8.6% 9.0% 11.5% 15.0%
Latin, Spanish, or salsa music
12.6% 10.9% 13.3% 8.1% 7.8% 9.9% 5.0% 18.1% 16.0% 19.5%
Classical music 13.6% 16.5% 11.9% 13.3% 12.1% 12.9% 7.2% 11.5% 17.2% 18.2%
Opera 4.3% 5.1% 5.4% 3.5% 3.4% 3.6% 2.1% 3.9% 4.7% 6.0%
Other music, rock, pop, country, folk, rap
46.9% 45.3% 44.5% 50.5% 50.5% 42.6% 48.1% 42.2% 52.7% 50.0%
Theater productions 7.1% 8.3% 7.1% 6.3% 5.6% 7.6% 4.5% 6.9% 8.4% 8.3%
Ballet, modern, or contemporary dance
4.5% 4.3% 4.5% 3.5% 4.6% 5.0% 2.7% 3.9% 3.3% 6.5%
Other dance programs or shows
9.2% 12.4% 8.2% 8.0% 8.7% 9.1% 5.6% 8.8% 9.5% 11.9%
Programs or information about the visual arts
9.4% 11.7% 9.3% 6.9% 10.2% 8.2% 7.7% 7.8% 11.4% 12.9%
Programs or information about books or writers
10.0% 10.7% 9.4% 7.9% 10.5% 8.9% 7.2% 8.4% 11.6% 14.8%
Other Books, short stories, or poetry read aloud
7.1% 8.6% 5.9% 6.2% 7.0% 4.4% 6.9% 6.6% 9.5% 10.9%
Used a handheld or mobile device to access art
Used handheld or mobile devices for any reason
53.2% 51.9% 53.7% 54.0% 49.4% 50.2% 46.8% 53.4% 55.1% 59.3%
Used device to read, listen or download novels, short stories, poetry, or plays
16.0% 18.5% 15.3% 16.2% 14.2% 12.5% 15.3% 16.2% 20.4% 19.0%
Used device to download, watch or listen to any music
34.2% 34.8% 33.0% 36.2% 31.9% 29.8% 39.1% 33.4% 37.0% 40.7%
Used device to watch, listen to, or download any theater or dance performances
3.4% 4.9% 3.5% 3.2% 2.0% 2.9% 3.6% 3.8% 3.4% 3.8%
Used device to download or view visual arts (paintings, sculpture, graphic design, photographs)
7.9% 10.0% 6.1% 7.0% 6.5% 6.6% 7.2% 8.4% 10.1% 10.7%
Gray Shaded Box indicates that the estimate is significantly different from the overall 2012 estimate at the .05 level

87 • chapter 6. regional differences in arts participation
Creating, Performing, or Sharing Art
The most common way Americans created art in 2012 was by weaving, crocheting, quilting, needlepoint, knitting, or sewing (13 percent of adults). Residents of the Mountain, West North Central, and New England regions were the most likely to do this activity, and residents of the South Atlantic region were the least likely.
Twelve percent of Americans took artistic photographs in the 12-month SPPA period, making this activity the second most common way of creating art in 2012. People living in New England or the Pacific region were the most likely to take photographs, while residents of the East South Central or West South Central region were below the national average for photography.
Figure 6-8. Percentage of U.S. adults who created or performed arts at least once, by census region and type of activity: 2012
All adults New England
Middle Atlantic
East North Central
West North Central
South Atlantic
East South Central
West South Central
Mountain Pacific
Created or performed any music
5.0% 5.5% 3.1% 4.3% 5.7% 4.7% 3.3% 5.5% 5.6% 7.2%
Create or performed any dance
1.3% 1.6% 0.9% 1.0% 1.7% 1.1% 1.2% 1.1% 0.8% 2.0%
Created any artistic films or videos
2.8% 3.8% 2.5% 2.9% 2.8% 2.7% 1.5% 1.5% 2.4% 4.5%
Took any artistic photographs
12.4% 16.4% 12.3% 11.0% 12.8% 10.2% 8.8% 9.4% 15.7% 16.9%
Created any visual art 5.7% 5.5% 5.5% 4.6% 6.9% 4.9% 4.8% 4.5% 6.9% 8.2%
Did any scrapbooking 6.5% 6.7% 5.4% 6.4% 8.2% 6.4% 5.9% 6.1% 7.7% 6.8%
Did any creative writing
5.9% 6.4% 5.8% 5.7% 6.6% 4.9% 3.3% 6.0% 7.8% 7.0%
Did pottery, ceramics, or jewelry-making
4.5% 4.1% 3.0% 4.3% 4.6% 3.6% 3.5% 5.1% 6.7% 6.2%
Did leatherwork, metalwork, or wood work
8.2% 10.5% 6.7% 7.3% 11.2% 5.7% 10.5% 8.4% 10.0% 9.4%
Did weaving, crocheting, quilting, needlepoint, knitting, or sewing
13.2% 16.0% 12.4% 13.4% 16.7% 9.5% 12.2% 11.9% 17.0% 15.4%
Gray Shaded Box indicates that the estimate is significantly different from the overall 2012 estimate at the .05 level
For the first time in the survey’s history, the 2012 SPPA included questions on how art is shared, edited, and preserved. The survey also included new questions on use of a computer, a handheld or mobile device, or the Internet to share, create, perform, edit, or remix art. Overall, about 43 percent of American adults, or 102 million people, reported they had created, performed,
shared, or edited or remixed works in one or more of the art forms shown in Figure 6-2. Chart 6-1 illustrates how this distribution varies by region. The regions with a red bar were below the national average in the proportion of residents creating, performing, or sharing art. The regions with the gray bar were above the national average.

2012 survey of public participation in the arts • 88
Chart 6-1. Percentage of Americans who created, performed, shared, or edited or remixed art, by census region and degree of participation: 2012
0% 20% 40% 60%
Mountain
West North Central
New England
East North Central
Pacific
U.S. Average
West South Central
Middle Atlantic
East South Central
South Atlantic
37.1%
39.8%
40.8%
41.7%
43.3%
43.6%
46.2%
51.0%
51.9%
53.1%
Participating in Arts Learning Activities
Nearly 50 percent of American adults have taken classes or lessons in visual art, music, dance, acting, writing, photography, or filmmaking at some point in their lives (Figure 6-9). As reported in Chapter 4, the 2012 SPPA asked about learning both in and outside school and about formal and informal instruction.
Whether in or out of school, or whether through classes, lessons, or by learning through some other means, Pacific area residents had the highest rates of arts learning, and West South Central residents had the lowest.
Regarding formal instruction (taking art classes or lessons), the most common art form studied was music; over one-third of Americans have studied music either in or out of school. The second most common formal learning pertained to visual arts. Acting and theater was the least common form of formal learning, reported by 7 percent of adults.
Figure 6-9. Percentage of U.S. adults who have taken arts lessons or classes at some point in their lives, by census region and art form: 2012
Arts learning All adults New England
Middle Atlantic
East North Central
West North Central
South Atlantic
East South Central
West South Central
Mountain Pacific
Any art form (any of the following)
49.8% 52.2% 53.1% 50.1% 54.3% 43.8% 40.6% 43.2% 55.5% 56.9%
Music 35.6% 38.3% 34.2% 37.3% 43.0% 30.1% 28.8% 29.3% 40.8% 42.3%
Visual arts 19.3% 18.1% 18.9% 20.0% 18.8% 16.8% 15.5% 14.0% 20.9% 26.7%
Acting or theater 7.1% 5.4% 6.2% 6.4% 8.0% 5.7% 7.8% 7.3% 8.7% 9.2%
Photography or filmmaking
9.4% 11.2% 6.8% 9.7% 9.2% 7.0% 6.0% 7.0% 11.7% 15.3%
Dance 16.7% 18.7% 19.4% 13.8% 14.7% 14.5% 10.9% 13.0% 20.4% 23.0%
Creative writing 15.4% 15.1% 14.2% 17.2% 18.1% 12.4% 12.9% 11.9% 17.2% 19.6%
Art appreciation or art history
17.6% 15.4% 14.5% 17.4% 17.6% 16.8% 18.1% 11.7% 20.5% 24.8%
Music appreciation 13.8% 12.5% 12.4% 12.3% 15.1% 13.0% 16.0% 11.6% 14.6% 17.5%
Gray Shaded Box indicates that the estimate is significantly different from the overall 2012 estimate at the .05 level

89 • chapter 6. regional differences in arts participation
Charts 6-2 and 6-3 illustrate that residents of New England, Mountain, and the Pacific regions were more likely than adults in other areas of the country to have taken art lessons or classes—whether in the past 12 months, as a child, or anytime during their lives. The Pacific region leads all U.S. regions in arts learning.
Chart 6-2. Percentage of U.S. adults who took any arts classes or lessons in the last 12 months, by census region: 2012
0% 5% 10% 15%
Pacific
Mountain
New England
U.S. Average
Middle Atlantic
East North Central
East South Central
South Atlantic
West South Central
West North Central 5.5%
6.1%
6.3%
6.4%
7.1%
7.3%
7.4%
8.0%
8.7%
10.1%
Chart 6-3. Percentage of U.S. adults who took arts classes or lessons as a child or adult by census region: 2012
0% 20% 40% 60%
Pacific
Mountain
New England
West North Central
Middle Atlantic
U.S. Average
East North Central
South Atlantic
East South Central
West South Central
53.0%41.2%
52.1%39.4%
47.1%36.5%
50.1%35.5%
48.1%32.9%
45.8%32.8%
46.2%31.2%
40.1%29.1%
38.0%27.1%
38.7%25.0%
As a child As an adult Linear (as an adult)

2012 survey of public participation in the arts • 90
Arts Participation by Metro or Non-Metro Area
The SPPA data file includes a variable from the Current Population Survey that indicates whether the SPPA respondent lives in a metro or non-metro area. A metropolitan area is a large population nucleus that has a high degree of economic and social integration within that nucleus. About 80 percent of 2012 SPPA respondents reside in a metropolitan area, and about 20 percent live in a non-metro area. Figures 6-10 and 6-11 look at various differences in the SPPA results between adults living in metro versus non-metro areas of the country.
Adults living in metro areas were much more likely to attend live arts performances than people outside cities. Metro residents had higher rates of attendance at all types of events except for craft fairs or visual arts festivals, which often take place in non-metropolitan areas. Much of the metro-versus-non-metro differences in arts attendance can be attributed to relative access and opportunity. People living in metropolitan areas have greater access to live arts performances.
In the SPPA, this assertion is bolstered by data on venues where people participate in the arts. SPPA respondents living outside cities attended art events at schools, churches, and community centers at about the same rates as did metropolitan respondents. However, they attended at lower rates than did metro area residents when the venues were theaters, concert halls, museums, restaurants, and nightclubs.
Metro area residents were more likely than non-metro residents to go to sports events or movies, while non-metro residents reported higher levels of outdoor activities such as hunting and fishing. Metro adults were much more likely than non-metro adults to watch or listen to broadcasts of jazz, Latin, and/or classical music and to watch or listen to programs about visual arts. Non-metropolitan adults were more likely to watch or listen to broadcasts or recordings of other music such as rock, pop, country, folk, rap, or hip-hop.
Compared with adults living in non-metro areas, metro respondents were more likely to use mobile or handheld devices to access the arts. This finding should be tracked over time since wireless capacity in non-metro areas is increasing.
Regarding arts creation, there are few differences between metropolitan and non-metropolitan adults. Metro residents were more likely to create visual arts, while non-metro residents had higher rates of doing leatherwork, metalwork, woodwork, knitting, and sewing.
Metro area residents were more likely in their lifetimes to have taken lessons or classes in all art genres, although the overall difference in having taken any art lessons or classes was only about five percentage points (51 percent versus 46 percent).

91 • chapter 6. regional differences in arts participation
Figure 6-10. Percentage of U.S. adults who did selected arts and non-arts activities at least once in the past 12 months, by metro or non-metro residency: 2012
All adults Metro Non-metro
Attended arts events or activities
Any arts event or activity listed below 50.1% 51.7% 41.0%
Any benchmark arts event 33.2% 35.2% 22.1%
Jazz 8.1% 8.8% 4.3%
Classical music 8.8% 9.3% 6.0%
Opera 2.1% 2.4% 0.9%
Musical plays 15.2% 16.2% 9.7%
Non-musical plays 8.3% 8.8% 5.2%
Ballet 2.7% 2.9% 1.6%
Art museum or art gallery 21.0% 22.5% 12.8%
Latin music 5.0% 5.5% 2.3%
Dance other than ballet 5.6% 5.9% 4.0%
Craft fairs or visual arts festivals 22.4% 22.5% 21.9%
Any other music, theater, or dance events 11.6% 12.0% 9.3%
Outdoor performing arts festivals 20.8% 21.4% 16.9%
Places visited for historic or design purposes 23.8% 24.5% 19.9%
Attended art exhibits or music, theater, or dance performances, by venue
College or university 7.3% 7.6% 5.5%
Grade school or high school 10.0% 9.9% 10.9%
Church or other religious venue 8.9% 8.9% 8.8%
Theater, concert hall, or auditorium 13.5% 13.4% 8.1%
Restaurant, bar, nightclub, or coffee shop 11.7% 12.5% 7.3%
Art museum or gallery 9.1% 10.0% 4.8%
Park or open-air facility 15.3% 16.0% 11.8%
Community center 4.6% 4.7% 4.1%
Attended other types of events and/or participated in other activities
Movie-going 59.3% 61.9% 45.8%
Attended a film festival 2.4% 2.7% 1.0%
Participated in a book club or reading group 3.6% 3.7% 2.8%
Attended a sports event 30.4% 32.1% 21.6%
Participated in a sports activity 45.6% 47.0% 38.3%
Did hunting or fishing 16.9% 15.1% 26.3%
Did camping, hiking, or canoeing 28.1% 27.7% 30.4%
Did gardening 38.6% 38.1% 41.5%
Participated in a community activities, meetings, or events. 24.8% 24.5% 26.2%
Do any volunteer or charity work 30.2% 30.3% 29.7%
Member of or Subscribe to an arts or cultural organization 6.8% 7.3% 3.9%
Donate any money, goods, or services to an arts or cultural organization 11.1% 11.5% 9.0%
Gray Shaded Box indicates that the estimate is significantly different from the overall 2012 estimate at the .05 level

2012 survey of public participation in the arts • 92
Figure 6-11. Percentage of U.S. adults who did various arts activities at least once in the past 12 months, by metro or non-metro residency: 2012
All Adults Metro Non-metro
Watched or listened to a broadcast or recording (TV, radio, or the Internet)
Jazz 11.9% 12.6% 7.4%
Latin, Spanish, or salsa music 12.6% 13.6% 7.0%
Classical music 13.7% 14.3% 9.9%
Opera 4.3% 4.5% 3.1%
Other music, rock, pop, country, folk, rap 46.9% 46.7% 48.3%
Theater productions 7.2% 7.5% 5.1%
Ballet, modern, or contemporary dance 4.5% 4.8% 3.0%
Other dance programs or shows 9.2% 9.6% 6.9%
Programs or information about the visual arts 9.4% 9.9% 6.8%
Programs or information about books or writers 10.0% 10.3% 8.3%
Other books, short stories, or poetry read aloud 7.1% 7.2% 6.5%
Used a handheld or mobile device to access art
Used device for any purpose 53.4% 54.7% 45.9%
Used device to read, listen or download novels, short stories, poetry, or plays 16.0% 16.7% 12.2%
Used device to download, watch, or listen to any music 34.3% 35.8% 25.4%
Used device to watch, listen to, or download any theater or dance performances 3.3% 3.5% 2.2%
Used device to download or view visual arts (paintings, sculpture, graphic design, photographs)
7.9% 8.3% 5.6%
Created or performed art
Created or performed music 5.1% 5.1% 4.1%
Created or performed any dance 1.3% 1.3% 0.9%
Created artistic films or videos 2.8% 3.0% 1.8%
Took artistic photographs 12.4% 12.7% 10.6%
Created visual art 5.7% 6.2% 3.2%
Did scrapbooking 6.5% 6.5% 6.4%
Did creative writing 5.9% 6.1% 5.2%
Did pottery, ceramics, or jewelry 4.5% 4.7% 3.9%
Did leatherwork, metalwork, or woodwork 8.2% 7.8% 10.3%
Did weaving, crocheting, quilting, needlepoint, knitting, or sewing 13.2% 12.8% 15.2%
Arts learning activities—classes or lessons taken anytime during person’s lifetime
Any art form (any of the following) 49.9% 50.6% 46.0%
Music 35.6% 35.9% 34.2%
Visual arts 19.3% 19.5% 18.1%
Acting or theater 7.1% 7.4% 5.4%
Photography or filmmaking 9.4% 9.7% 7.6%
Dance 16.7% 17.3% 13.3%
Creative writing 15.4% 15.7% 14.0%
Art appreciation or art history 17.7% 18.5% 13.0%
Music appreciation 13.9% 14.2% 11.8%
Gray Shaded Box indicates that the estimate is significantly different from the overall 2012 estimate at the .05 level

93 • survey and research methodology
Survey and Research Methodology
The SPPA has collected arts and leisure participation data from U.S. adults since 1982. Subsequent iterations were conducted in 1985, 1992, 1997, 2002, 2008, and 2012. Until 1997, the SPPA was a supplement attached to the U.S. Census Bureau’s National Crime Survey. In 1997, the SPPA was a stand-alone study conducted by a private contractor. In 2002, the SPPA became a periodic supplement to the Census Bureau’s Current Population Survey (CPS).
The 2012 SPPA was administered as a supplement to the July 2012 CPS. The CPS is commissioned by the U.S. Bureau of Labor Statistics for the purpose of producing a monthly report on the national employment situation. The report provides estimates of the number of employed and unemployed people in the United States.
Approximately 60,000 households are eligible for the CPS each month. Sample households are selected by a multistage, stratified, statistical sampling scheme. A household is interviewed for four successive months, then not interviewed for eight months, then returned to the sample for four additional months.
The 2012 SPPA supplement was administered to one-half of the eligible CPS households, those that were in the exit round of the CPS sample rotation. The SPPA survey allows proxy responses for spouses or partners, and in larger households a second supplemental interview was often conducted. After taking nonresponse into account, a total of 20,847 households provided at least one completed SPPA interview. The final distribution of 2012 SPPA interviews consisted of an initial 20,847 randomly selected adults, plus an additional 3,506 interviews of adults residing in larger households. In addition, 11,382 spouse or partner proxy interviews were conducted. In total, data on 35,735 adults were collected, and the average number of completed adult interviews per household was 1.7.

2012 survey of public participation in the arts • 94
The CPS is one of the nation’s most respected surveys and maintains a high response rate. Although the SPPA is conducted with only a portion of the overall CPS sample, it is a random portion and is representative of the non-institutionalized U.S. adult population. Because the SPPA questions are asked after the monthly CPS questions, the 2012 SPPA response rate is lower than the overall CPS response rate—but quite high nonetheless, 71.5 percent10. For the sections of the survey that included spouse/partner questions, the 2012 response rate is 73.4 percent11. This is lower than for the 2008 SPPA study (81.6 percent), perhaps because the 2012 SPPA was fielded in July, a common vacation month.
To see the SPPA 2012 questionnaire and other research resources, go to http://arts.gov/sites/default/files/sppa-questionnaire-2012.pdf.
Throughout this report, standard errors of the survey estimates are used to determine whether a subgroup estimate or prior-year estimate differs significantly from the overall 2012 estimates. Standard errors are commonly used to conduct hypothesis tests or tests of statistical significance. A clear presentation of estimates from a survey should include measures of uncertainty associated with using a sample for inference, as opposed to using the entire population.
Given the SPPA’s complex survey and sample design, the standard errors for each estimate have been adjusted accordingly. This is done by multiplying the usual standard error formula by the square root of the estimated design effect. Thus, the formula used in this report for computing the 95 percent confidence interval around a percentage is:
where p̂ is the sample estimate, n is the unweighted number of sample cases in the group being considered, and deft is the square root of the survey design effect.
10 In 2012, 24,353 out of the 34,039 CPS respondents randomly selected to
complete the supplement.
11 When spouse and partner responses are included, survey data were obtained
from 35,735 people out of the 48,372 people who were sampled.
Finally, for the analyses discussed on page 22, the model used was logistical regression with the dependent variables being whether or not the person attended a benchmark activity. The independent variables (predictors) were gender, race/ethnicity, age, education, income, region, metro status, immigration status, marital status, and presence of children in the household. Each independent variable was dichotomized so that there were a total of 37 predictors used in the model. For example, for race/ethnicity there were four predictors used (i.e. Hispanic (Y/N), White (Y/N), African American (Y/N); and Other Race (Y/N).

95 • appendix: sports and exercise
Appendix: Sports and Exercise
The SPPA traditionally captures estimates of adult participation in various leisure activities that are generally not considered arts-related. In this section, we look at sports and exercise in particular.
Attending an Amateur or Professional Sports EventRoughly 30 percent of American adults attended an amateur or professional sports event in 2012, the same as in 2008 but lower than in 2002 (Figure A-1).
Figure A-1. Percentage of adults attending an amateur or professional sports event during the last 12 months: 2002, 2008, and 2012.
2002 2008 2012
35.0% 30.6% 30.4%
Gray shaded box indicates that the estimate is significantly different than the 2012 estimate at the .05 level
Sports attendance is more common in men than women; however, the gender disparity that existed in 2002 was smaller in 2008 and 2012. In 2002, a 12-percentage point difference existed between male and female levels of activity (41 percent of men, compared with 29 percent of women). In 2008 and 2012, the percentage of men who attended sports events dropped to 35 percent, narrowing the gender gap (Figure A-2). About 26 percent of women attended a sports event in 2008 and 2012.

2012 survey of public participation in the arts • 96
Figure A-2. Demographic characteristics of adults who attended an amateur or professional sports event: 2002, 2008, and 2012
Demographic distribution of 2012 attendees
2002 % who attended
2008 % who attended
2012 % who attended
all adults 100.0% 35.0% 30.6% 30.34%
Gender
Male 54.9% 41.4% 34.9% 34.7%
Female 45.1% 29.2% 26.6% 26.4%
Race/ethnicity
Hispanic 11.0% 26.4% 22.1% 24.3%
White 75.6% 38.4% 34.0% 34.0%
African American 8.6% 27.0% 24.5% 21.9%
Other 4.8% 22.3% 21.8% 21.4%
Age
18–24 17.2% 46.0% 37.4% 40.7%
25–34 20.6% 41.8% 37.3% 36.2%
35–44 19.2% 42.2% 36.7% 35.2%
45–54 19.5% 35.8% 31.3% 32.2%
55–64 13.5% 25.5% 25.9% 24.5%
65–74 7.2% 19.7% 18.2% 20.8%
75+ 2.9% 11.1% 10.3% 11.2%
Highest level of education
Grade school 1.0% 9.4% 6.6% 7.8%
Some high school 3.6% 17.4% 17.8% 13.6%
High school graduate 21.2% 28.3% 22.8% 22.0%
Some college 33.1% 39.9% 33.7% 33.1%
College graduate 27.7% 51.0% 44.9% 44.4%
Graduate school 13.4% 48.3% 44.2% 42.2%
Family income
Less than $20K 7.8% 14.5%
$20K to $50K 23.7% 32.9%
$50K to $75K 20.9% 33.0%
$75K to $100K 16.6% 42.4%
$100K to $150K 17.8% 43.9%
$150K and over 13.2% 49.9%
Gray shaded box indicates that the estimate is significantly different than the 2012 estimate at the .05 level

97 • appendix: sports and exercise
Exercise or Participate in a Sports ActivityForty-six percent of Americans exercised or participated in a sports activity at least once in 2012 (Figure A-3). A comparable question was not asked in prior years. Men are more likely than women to exercise or participate in sports (47 percent of men, 44 percent of women). The likelihood of physical activity is inversely related to age: 59 percent of 18- to 24-year olds engaged in exercise or sports in 2012, but among adults 75 and older, the share was 24 percent. The likelihood of physical activity increased significantly with educational level and family income.
Figure A-3. Percentage of U.S. adults who exercised or participated in a sports activity: 2012
Demographic distribution
% who participated
all adults 100.0% 45.7%
Gender
Male 50.1% 47.5%
Female 47.4% 44.0%
Race/ethnicity
Hispanic 13.0% 38.5%
White 70.9% 49.3%
African American 9.0% 37.7%
Other 7.2% 40.8%
Age
18–24 16.3% 58.5%
25–34 20.1% 52.8%
35–44 18.4% 49.3%
45–54 18.4% 44.9%
55–64 14.6% 40.8%
65–74 8.2% 37.2%
75+ 4.1% 24.1%
Highest level of education
Grade school 1.1% 12.2%
Some high school 4.5% 24.1%
High school graduate 23.4% 35.0%
Some college 30.5% 49.2%
College graduate 25.9% 62.6%
Graduate school 14.7% 68.8%
Family income
Less than $20K 12.0% 31.3%
$20K to $50K 24.9% 35.4%
$50K to $75K 20.4% 48.9%
$75K to $100K 14.1% 56.1%
$100K to $150K 16.3% 63.3%
$150K and over 12.4% 69.4%
Gray shaded box indicates that the estimate is significantly different than the 2012 estimate at the .05 level

2012 survey of public participation in the arts • 98
Chart A-1 illustrates how education, age, and income influence a person’s likelihood of being active in sports. As seen in the chart, exercise or active participation in a sports activity decreased with age and increased with educational level and income.
Chart A-1. Percentage of U.S. adults who exercise or participated in a sports activity in the last 12 months, by age, education, and income: 2012
0%
10%
20%
30%
40%
50%
60%
70%
80%
More/older Less/younger
58.5%
51.0%
44.9%40.8%
AgeIncome Education
37.2%
24.1%
12.2%
24.1%35.0%
49.2%
62.6%
68.8%
69.4%
63.3%
56.1%
48.9%
35.4%31.3%


Back cover photo: Young folklorico dancers perform in Ajo, Arizona, to celebrate the Smithsonian’s Between Fences traveling exhibit. Photo by Jewel Clearwater
