a de novo transcriptome of the asian tiger mosquito, aedes
TRANSCRIPT

RESEARCH ARTICLE Open Access
A de novo transcriptome of the Asian tigermosquito, Aedes albopictus, to identify candidatetranscripts for diapause preparationMonica F Poelchau1*, Julie A Reynolds2, David L Denlinger2, Christine G Elsik1 and Peter A Armbruster1
Abstract
Background: Many temperate insects survive the harsh conditions of winter by undergoing photoperiodicdiapause, a pre-programmed developmental arrest initiated by short day lengths. Despite the well-establishedecological significance of photoperiodic diapause, the molecular basis of this crucial adaptation remains largelyunresolved. The Asian tiger mosquito, Aedes albopictus (Skuse), represents an outstanding emerging model toinvestigate the molecular basis of photoperiodic diapause in a well-defined ecological and evolutionary context. Ae.albopictus is a medically significant vector and is currently considered the most invasive mosquito in the world.Traits related to diapause appear to be important factors contributing to the rapid spread of this mosquito. Togenerate novel sequence information for this species, as well as to discover transcripts involved in diapausepreparation, we sequenced the transcriptome of Ae. albopictus oocytes destined to become diapausing or non-diapausing pharate larvae.
Results: 454 GS-FLX transcriptome sequencing yielded >1.1 million quality-filtered reads, which we assembled into69,474 contigs (N50 = 1,009 bp). Our contig filtering approach, where we took advantage of strong sequencesimilarity to the fully sequenced genome of Aedes aegypti, as well as other reference organisms, resulted in 11,561high-quality, conservative ESTs. Differential expression estimates based on normalized read counts revealed 57genes with higher expression, and 257 with lower expression under diapause-inducing conditions. Analysis ofexpression by qPCR for 47 of these genes indicated a high correlation of expression levels between 454 sequencedata and qPCR, but congruence of statistically significant differential expression was low. Seven genes identified asdifferentially expressed based on qPCR have putative functions that are consistent with the insect diapausesyndrome; three genes have unknown function and represent novel candidates for the transcriptional basis ofdiapause.
Conclusions: Our transcriptome database provides a rich resource for the comparative genomics and functionalgenetics of Ae. albopictus, an invasive and medically important mosquito. Additionally, the identification ofdifferentially expressed transcripts related to diapause enriches the limited knowledge base for the molecular basisof insect diapause, in particular for the preparatory stage. Finally, our analysis illustrates a useful approach thatdraws from a closely related reference genome to generate high-confidence ESTs in a non-model organism.
BackgroundThe annual arrival of winter in temperate habitats repre-sents a fundamental challenge to the survival and repro-duction of a wide variety of insects. Many temperateinsects surmount the harsh conditions of winter by
undergoing photoperiodic diapause, a process in whichday length (photoperiod) provides a token cue that initi-ates a pre-programmed and hormonally controlleddevelopmental arrest in advance of the onset of unfavor-able conditions [reviewed in [1]]. Photoperiodic diapauseis thus a crucial ecological adaptation enabling tempe-rate insects to coordinate growth, development, repro-duction and dormancy in a seasonal environment.Processes related to regulation of development,
* Correspondence: [email protected] of Biology, Georgetown University, 37th and O Streets NW,Washington, DC, USAFull list of author information is available at the end of the article
Poelchau et al. BMC Genomics 2011, 12:619http://www.biomedcentral.com/1471-2164/12/619
© 2011 Poelchau et al; licensee BioMed Central Ltd. This is an Open Access article distributed under the terms of the CreativeCommons Attribution License (http://creativecommons.org/licenses/by/2.0), which permits unrestricted use, distribution, andreproduction in any medium, provided the original work is properly cited.

metabolic depression, stress tolerance and nutrient sto-rage appear to be particularly important physiologicalcomponents of the diapause response [2-8].While many aspects of the physiological and ecologi-
cal controls of diapause are known, research on themolecular bases of diapause has been hampered by thelack of genetic information from a suitable model organ-ism [9]. Drosophila melanogaster has a weak diapauseresponse that is highly temperature-dependent [10], andthus can give only limited insight into the mechanisticbasis of photoperiodic diapause [11]. Bombyx mori pro-vides a rich source of information on gene expressionduring diapause. However, diapause entry in B. mori iscontrolled by diapause hormone, which is poorly con-served throughout insects [12], and is thus of limiteduse for comparative analyses. Recently, the advent ofhigh-throughput sequencing methods has facilitatedgenetic and genomic analyses of life-history traits innon-model systems [5,13,14]. These new technologiesallow for de novo characterization of genome-wideexpression in non-model organisms, and have alreadyled to exciting recent progress on the transcriptionalbases of diapause in several insect taxa [3,5,15-17].An additional factor that has limited progress on
understanding the molecular bases of diapause is thewide diversity of diapause syndromes among differentinsect species. The diapause program is characterized bythree eco-physiological phases: pre-diapause, diapause,and post-diapause [18]. During the pre-diapause phasethe individual is sensitive to token environmental cue(s)and in response to appropriate stimuli will initiate pre-paration for entry into diapause. During the diapausephase metabolism is reduced and direct development isarrested. Finally, during the post-diapause phase, theindividual emerges from diapause and post-diapausedirect development is resumed. All three eco-physiologi-cal phases can occur in every stage of the insect lifecycle, but an individual species is usually constrained tothe diapause phase (developmental arrest) during a sin-gle stage of the life-cycle [1]. The diversity of life-cycletiming of eco-physiological phases among insectsimplies a corresponding diversity of molecular and phy-siological pathways underlying diapause regulation indifferent insect species. Most studies on the transcrip-tional bases of diapause have focused on gene expres-sion during the phase of actual developmental arrest(diapause). However, the pre-diapause phase can revealimportant insights into the regulation and physiologicaltrajectory of diapausing animals [19-21].The Asian tiger mosquito, Aedes albopictus, is an out-
standing emerging model organism for the study of dia-pause within a well-defined ecological and evolutionarycontext. Currently considered the most invasive mos-quito species in the world [22], in the last 30 years, Ae.
albopictus has rapidly spread from its native Asianrange across the world and is currently found in at least28 countries on every continent except Antarctica[22,23]. Temperate populations of Ae. albopictusundergo a maternally controlled egg diapause in whichexposure of the maternal pupa and adult to short daylengths initiates diapause of the offspring as a pharatelarvae inside the chorion of the egg [24,25]. Increasedegg desiccation resistance during diapause [20,26] andrapid evolution of both diapause incidence [[27]; Louni-bos et al., in press; Urbanski et al., submitted] and dia-pause timing [Urbanski et al., submitted] during therange expansion of Ae. albopictus in the US imply thatthe diapause response has facilitated the rapid globalspread of this invasive mosquito. Furthermore, becauseAe. albopictus is a vector of dengue and Chikungunyaviruses, identifying the genetic basis of diapause couldpotentially provide a platform for developing novel vec-tor control methods [28]. Finally, the complete genomesequence has been determined for Aedes aegypti [29], aclosely related mosquito in the same subgenus (Stego-myia) as Ae. albopictus. The Ae. aegypti genomesequence thus provides a valuable “reference genome”that can be used to annotate Ae. albopictus transcrip-tome sequences.Here, we use a GS-FLX 454 platform to sequence and
assemble the transcriptome of Ae. albopictus oocytesfrom females reared under diapause-inducing (DI) andnon-diapause-inducing (NDI) photoperiods. Our goalswere to 1) generate a transcriptome database for thestudy of Ae. albopictus functional genetics because lim-ited genetic information is currently available for thisspecies; and 2) to identify and verify candidate tran-scripts involved in the transcriptional bases of diapausepreparation. We leverage the close evolutionary relation-ship of Ae. albopictus to Ae. aegypti for the annotationof the assembly. We use differential expression, basedon normalized read counts from the DI and NDI tran-scriptomes, to identify a series of candidate genes fordiapause preparation, and verify these candidates usingquantitative PCR (qPCR). We then discuss the putativefunctional significance of verified differentially expressedgenes relative to the molecular physiology of pre-dia-pause and diapause in other insects. Our transcriptomedata enrich the limited sequence information for Ae.albopictus, contribute to our knowledge of gene expres-sion during the pre-diapause phase, and set the stage forcomparative analyses both amongst other taxa and rela-tive to other diapause phases of Ae. albopictus.
Results and DiscussionSequencing, read cleaning and de novo assembly454 GS-FLX sequencing was performed on cDNAlibraries from mature (stage V) oocytes of Ae. albopictus
Poelchau et al. BMC Genomics 2011, 12:619http://www.biomedcentral.com/1471-2164/12/619
Page 2 of 19

females reared under diapause-inducing (DI) or non-dia-pause-inducing (NDI) photoperiods (see Methods). Wemerged reads from both libraries for assembly andannotation. Our quality filtering procedure (Figure 1)removed ~14% of the raw sequenced reads, leaving1,111,941 reads remaining for further analysis. The aver-age read length was 418 bp, with an N50 of 482 bp (Fig-ure 2, Table 1, Table 2). These lengths are broadlycomparable with other 454 transcriptome sequencingstudies [30-33]. Raw reads and quality scores arearchived at NCBI Sequence Read Archive (SRA) underAccession SRP007714.Our de novo assembly using MIRA 3.2.0 [34] yielded
69,474 contigs, with an N50 of 1,009 bp (Figure 2, Table2). These contigs are accessible at NCBI’’s transcriptshotgun archive (TSA) under accession numbersJO845359-JO913491. Contig length is one of the manybenchmarks that can be used to assess assembly quality,and our assembly shows a comparable mode of contiglength relative to similar studies [30-33]. Annotatedtranscripts from the Ae. aegypti genome, the most suita-ble reference genome for Ae. albopictus, have an N50 of1,980 bp (Figure 2). This result suggests that many of
the contigs in our assembly are shorter than the actualtranscripts from which they are derived. This disparityin contig length distributions between de novo transcrip-tome assemblies and annotated transcripts from genomeassemblies is expected, because transcript predictionsfrom the genome assembly are based on both extensivecomputational (automated and manual gene modeling)and empirical (ESTs, cDNA sequences) evidence [29],whereas the Ae. albopictus transcriptome is currentlylimited to data from a single source.De novo assemblies can seldom merge all reads into con-
tigs [35-37], especially when the abundance of some tran-scripts is too low for representative reads to be assembled.However, the “singleton” reads still represent usefulsequence information on low-coverage transcripts, and canbe included in subsequent analyses of the transcriptome. Inour assembly, 8% of the quality-filtered reads were notassembled [similar to [31,38]], and these singletons weremerged with the contig set into a preliminary EST set.
Functional annotationTo functionally annotate the preliminary EST set, weperformed a series of BLAST searches [39] to several
Read cleaning • quality and length thresholds • poly-A trimming • rRNA/contaminant removal
De novo assembly of reads into contigs
Functional annotation
• blast ESTs (contigs and singletons) against reference databases
Discard EST
No match meets final filtering criteria
• Assign functional annotation/homolog to EST based on best match • multiple ESTs can be assigned to the same homolog
Homology-based EST filtering and trimming (‘final
ESTs’) • For each homolog, find best EST – homolog match from BLAST output • Trim each EST to its BLAST alignment
Differential expression (DE) analysis – 454
sequence data • Map individual reads from DI and NDI libraries to final EST set • determine significantly DE genes from each library
One or more matches meet filtering criteria
Verification of DE ESTs
• use qPCR to confirm a subset of differentially expressed genes
Discard all other ESTs
Figure 1 Flowchart of the main analysis steps outlined in this paper.
Poelchau et al. BMC Genomics 2011, 12:619http://www.biomedcentral.com/1471-2164/12/619
Page 3 of 19

reference organisms (Table 3). Our functional annota-tions drew heavily from two culicid genomes, Ae.aegypti and Culex quinquefasciatus, due to their closephylogenetic relationship with Ae. albopictus. MostESTs (66%) matched to Ae. aegypti transcripts and pep-tides (Table 4; Figure 3). Percent identities are fre-quently used as a measure of BLAST quality [35,40].Here, percent identities between the ESTs and theirputative homologs declined with phylogenetic related-ness, with the highest percent identities found to puta-tive homologs in Aedes spp., and the lowest to C.elegans (Figure 3). 28% of ESTs (4% contigs, 24% single-tons) had no significant similarity to any of the
databases that we searched, likely due to the conserva-tive e-value cutoffs we used when assigning homology(Table 3).
Homology-based EST filtering and trimmingThe MIRA assembler tends to assemble contigs withhigh redundancy [32,35,40], and our dataset is no excep-tion: on average, more than eight ESTs matched thesame gene (min = 1; median = 4; mean = 8.86; max =5,613; See additional file 1: Distribution of the numberof ESTs assigned to a reference gene). There are bothbiological and technical reasons for this high redun-dancy. For example, alternatively spliced isoforms, or
Figure 2 Distribution of read and contig lengths from Ae. albopictus and Ae. aegypti. Reads lengths from the Ae. albopictus transcriptomeare show in red (N = 1,111,941), Ae. albopictus contig lengths in blue (N = 69,474), and Ae. aegypti transcript lengths (v1.2, http://www.vectorbase.org) in green (N = 18,760).
Table 1 Summary statistics for reads from 454 GS-FLX sequencing
Total # ofreads
% readsremoved
# of reads remainingafter filtering
Average filteredread length
Averagefiltered %GC
% of reads mappedto contig set
% of mapped,discarded reads
DI 668,269 13.59 570,807 404.11 50.76 61.19 2.62
NDI 656,977 14.91 541,134 432.62 50.75 62.38 3.01
Combined 1,325,246 14.25 1,111,941 417.98 50.76 61.77 2.81
Summary statistics of reads from two cDNA libraries derived from oocytes from DI (diapause inducing) and NDI (non-diapause inducing) photoperiod treatmentsare shown.
Poelchau et al. BMC Genomics 2011, 12:619http://www.biomedcentral.com/1471-2164/12/619
Page 4 of 19

alleles of the same gene, could assemble into separatecontigs. Additionally, sequencing errors, incompletetranscript coverage during sequencing, chimeric reads orcontigs, or paralogous genes from recently diverged genefamilies could also contribute to the redundancy. Biolo-gically valid transcript variants are difficult to distinguishfrom sequencing and assembly errors, particularly in theabsence of a reference genome. To systematically reduceour EST set to a non-redundant transcriptome, we tookadvantage of the homology of the Ae. albopictus ESTsto the closely related Ae. aegypti genome, as well ashomology to other, more distantly related genomes. Foreach group of ESTs that matched a putative homolog,we identified one ‘’representative’’ EST, and trimmedthis EST to its overlap with the putative homolog (seeMethods). This resulted in 11,561 non-redundant, ‘’con-servative’’ ESTs with annotations to known genes. In thesubsequent text, we refer to this non-redundant,trimmed EST set as the ‘’final’’ EST set. The N50 of thefinal EST set improved over that of the redundant ESTs(Table 2). While this conservative approach certainlyremoved perfectly legitimate sequence data, it systemati-cally avoided chimeric contigs that could occur due tocontig mis-assembly, thereby yielding a higher-confi-dence EST set. The advantage of this approach is that iteliminated redundant ESTs, as well as annotations withlittle support from other organisms. The disadvantagesare that genes novel to Ae. albopictus are eliminated,and that some valid sequence information from ESTs
with homology information was discarded. A similarapproach was used by Crawford et al. [41] for a non-model mosquito species (Anopheles funestus). Here, theauthors utilized significant homology of their ESTs toother reference genomes to validate contigs and elimi-nate redundancy, reflecting the fact that EST redun-dancy and uncertainty are common problems intranscriptome assembly of organisms without a genomesequence, and that unique, taxon-specific approacheswill often be necessary.Trimmed ESTs covered an average of 43% of their
putative homologs (See additional file 2: Box plot of thepercent length of each reference gene matched by itsAe. albopictus EST putative homolog), which indicatesthat the majority of the final ESTs do not represent fulltranscripts. This result is expected, given the incompletenature of de novo transcriptome assembly of non-modelorganisms, as well as our rigorous trimming procedure.Other de novo transcriptome assemblies of mosquitospecies have also documented incomplete transcriptcoverage based on comparisons to a closely relatedreference genome [41,42]. Of the ESTs that remained inthe final contig set, 93% were annotated to Aedes spp.(Table 4), with high percent identities (mean: 86.4%; Seeadditional file 3: Box-plot of percent identities fromBLAST alignments of final ESTs to each referenceorganism). Not surprisingly, percent identities of BLASTmatches to other, less closely related organisms weremuch lower (mean: 59.4%, See additional file 3: Box-plot
Table 2 N50 values, and mean and median lengths, for reads and EST sets
N50 Mean read length Median read length
Trimmed reads 482 417.98 467
redundant EST set Contigs only 1009 898.25 692
redundant EST set Contigs and singletons 641 601.75 493
trimmed EST set Contigs only 1120 801.25 647
trimmed EST set Contigs and singletons 974 688.48 508
Table 3 Databases used for BLAST homology searches with relevant details for each search
Referenceorganism
Sequencetype
BLASTalgorithm
Minimum e-value
Version Source Minimum % identityused in final EST set
selection
Ae. albopictus mRNA BLASTN 1.00E-10 N/A http://www.ncbi.nlm.nih.gov 85
Ae. aegypti transcripts BLASTN 1.00E-10 AaegL1.2 http://www.vectorbase.org 85
Ae. aegypti genomic BLASTN 1.00E-10 AaegL1 http://www.vectorbase.org 85
Ae. aegypti peptides BLASTX 1.00E-10 AaegL1.2 http://www.vectorbase.org 70
Cx. quinquefasciatus peptides BLASTX 1.00E-05 CpipJ1.2 http://www.vectorbase.org 0
An. gambiae peptides BLASTX 1.00E-05 AgamP3.6 http://www.vectorbase.org 0
D. melanogaster translation BLASTX 1.00E-05 r5.29 http://www.flybase.org 0
Ca. elegans peptides BLASTX 1.00E-04 WS218 http://www.wormbase.org 0
Swiss-Prot proteins BLASTX 1.00E-03 2010_6 http://www.uniprot.org 0
The minimum e-value used for the initial EST set, and the minimum % identity used for the final EST set, varied based on phylogenetic distance of the organism/database and Ae. albopictus.
Poelchau et al. BMC Genomics 2011, 12:619http://www.biomedcentral.com/1471-2164/12/619
Page 5 of 19

of percent identities from BLAST alignments of finalESTs to each reference organism). We provide fasta filesof the trimmed ESTs, as well as an Excel spreadsheetwith relevant annotation information at http://Albopic-tusExpression.org.To evaluate whether our sequencing efforts maximized
the number of transcripts captured, we generated abootstrapped gene accumulation curve [31], based onBLASTN matches of individual reads to the Ae. aegyptitranscriptome. After an initial steep increase in thenumber of Ae. aegypti transcripts discovered withincreasing read number, the slope of the curve rapidlyasymptotes, which implies that our sequencing depthcaptured most of the Ae. aegypti transcript homologsfound in our cDNA libraries (See additional file 4: Geneaccumulation curve of Ae. albopictus ESTs). Paired withother results indicating that our coverage of putativehomologs is incomplete (See additional file 2: Box plotof the percent length of each reference gene matched byits Ae. albopictus EST putative homolog), we concludethat our assembly maximized the number of putativehomologs found in our libraries, but that the ESTsrepresenting these homologs are incomplete. Because ofthis, our measures of expression under DI and NDI con-ditions will underestimate actual expression, althoughwe do not expect a bias in this estimate between DI andNDI libraries. However, differentially expressed geneswith inherently low expression are more likely to goundetected than genes with high expression, in particu-lar when sequencing coverage is low [43].
Differential expression (DE) analysis- 454 sequence dataWe estimated expression levels for each EST under DIand NDI treatments by mapping reads from each
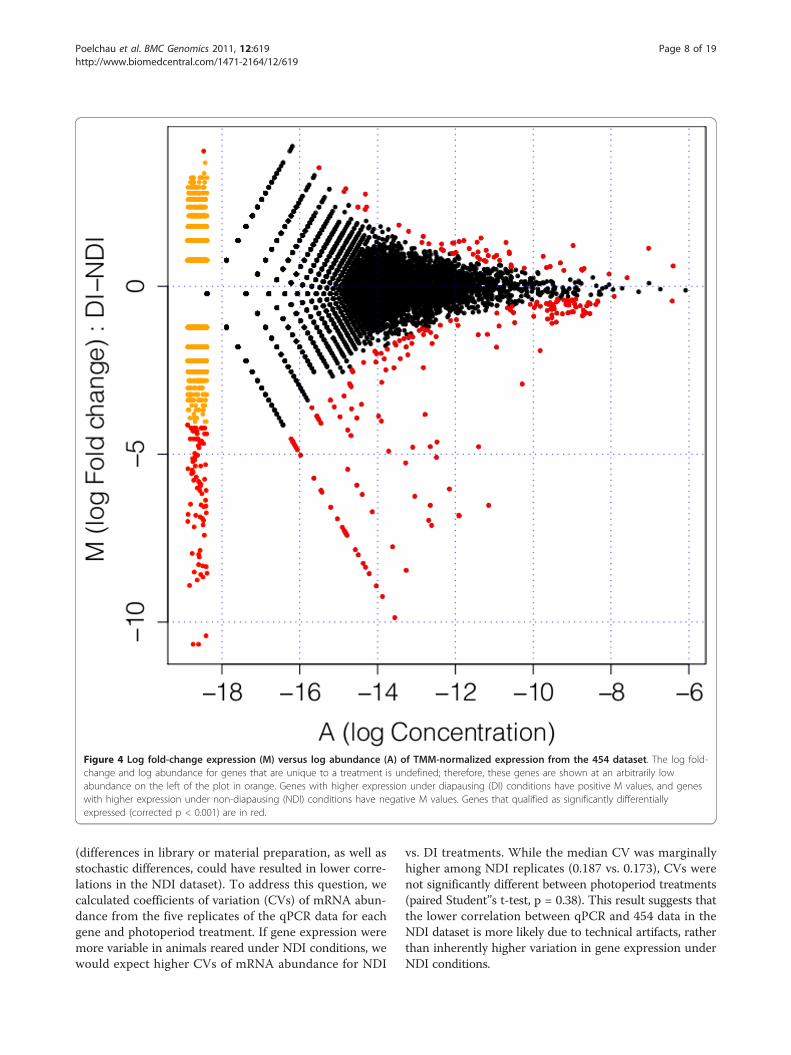
treatment to the final EST set. 62% and 61% of readsfrom the NDI and DI libraries, respectively, uniquelymapped to the final EST set (Table 1). 2.8% of all readswere discarded because they did not map uniquely.Almost all remaining unmapped reads corresponded tothe untrimmed EST set (data not shown); those that didnot had low complexity regions over the majority of theread length, and thus were not assembled. Some viraland bacterial genes (55) were discovered during theannotation process. These genes were retained for readmapping, but the genes were removed before measuringdifferential expression, as measuring viral loads was out-side the scope of this study. Using TMM-normalizedread counts [Trimmed Mean of M values, [44]] to initi-ally determine differential expression of ESTs betweenphotoperiod treatments (see Methods), 257 ESTs hadsignificantly higher expression under NDI conditions,and 57 ESTs were over-expressed under DI conditions(Figure 4; See additional file 5: Characteristics of all dif-ferentially expressed genes from the 454 dataset). Addi-tionally, the range of log fold-change tended to behigher under NDI relative to DI conditions (Figure 4).
Verification of DE ESTs by qPCRWe evaluated differential expression of 48 candidategenes using qPCR to validate expression patterns in the454 dataset. Of these, 21 were predicted over-expressedunder NDI conditions, 10 under DI conditions, and 17were of a priori interest. We first asked whether expres-sion levels from the 454 dataset and qPCR experimentswere correlated, and whether the normalization methodof the 454 dataset affected these correlations. In additionto the TMM method that we used to identify candidategenes [44], we calculated RPKM (Reads Per Kilobase per
Table 4 Number of ESTs assigned to each genomic database
Reference organism Number of matches, initial EST set Number of matches, final EST set
Ae. albopictus 1,011 52
Ae. aegypti transcripts 91,461 10,005
Ae. aegypti genome, annotated 1,422 142
Ae. aegypti genome, unannotated 10,736 N/A
Ae. aegypti peptides 2,993 556
Cx. quinquefasciatus. 1,167 550
An. gambiae 103 79
D. melanogaster 21 16
C. elegans 25 19
Swiss-Prot 4,331 86
total number of matches 113,270 11,505
no hit (contigs) 6,775 N/A
no hit (singletons) 37,077 N/A
total number of contigs 69,474 N/A
total number of singletons 87,648 N/A
Both the preliminary EST set and final, trimmed EST set are listed (see Methods).
Poelchau et al. BMC Genomics 2011, 12:619http://www.biomedcentral.com/1471-2164/12/619
Page 6 of 19

Million, [45]), and asked whether these two measurescorrelated with mean mRNA abundance from the qPCRexperiments for NDI and DI treatments. We removedone gene with much higher qPCR than 454 expressionbecause it is extremely likely that paralogs were co-amplified by qPCR but were undetected by the qPCRmelt-curve analysis. This gene, a histone 2A homolog(Ae. aegypti ID AAEL000494), has 19 near-identicalparalogs in Ae. aegypti, of which eight are 100% identi-cal at the peptide level (http://www.vectorbase.org). Sub-sequently, correlation coefficients of differentialexpression for the remaining 47 candidate genesassessed by 454 sequencing and qPCR were high andresembled those found in previous comparisons of
qPCR and RNA-Seq data (Figure 5; Table 5; compari-sons in [46]: r2 = 0.711-0.807). Correspondence between454 and qPCR expression levels was notably higherwhen 454 expression was measured as RPKM, suggest-ing that RPKM is a more accurate measure of geneexpression for our dataset.While correlation coefficients between 454 expression
and mRNA abundance calculated within each photoperiodtreatment were very high for expression measures in theDI treatment, correlation coefficients were lower forexpression measures from the NDI treatment for all ana-lyses (Figure 5; Table 5). This raises the question whetherthis difference is biological (genes are inherently morevariable under longer photoperiods) or technical
Figure 3 Box-plot of percent identities from EST BLAST alignments to each reference organism. The solid horizontal line represents themedian, the box encompasses the lower and upper quartiles, and the boxplot whiskers encompasses the data extremes.
Poelchau et al. BMC Genomics 2011, 12:619http://www.biomedcentral.com/1471-2164/12/619
Page 7 of 19
(differences in library or material preparation, as well asstochastic differences, could have resulted in lower corre-lations in the NDI dataset). To address this question, wecalculated coefficients of variation (CVs) of mRNA abun-dance from the five replicates of the qPCR data for eachgene and photoperiod treatment. If gene expression weremore variable in animals reared under NDI conditions, wewould expect higher CVs of mRNA abundance for NDI
vs. DI treatments. While the median CV was marginallyhigher among NDI replicates (0.187 vs. 0.173), CVs werenot significantly different between photoperiod treatments(paired Student’’s t-test, p = 0.38). This result suggests thatthe lower correlation between qPCR and 454 data in theNDI dataset is more likely due to technical artifacts, ratherthan inherently higher variation in gene expression underNDI conditions.
Figure 4 Log fold-change expression (M) versus log abundance (A) of TMM-normalized expression from the 454 dataset. The log fold-change and log abundance for genes that are unique to a treatment is undefined; therefore, these genes are shown at an arbitrarily lowabundance on the left of the plot in orange. Genes with higher expression under diapausing (DI) conditions have positive M values, and geneswith higher expression under non-diapausing (NDI) conditions have negative M values. Genes that qualified as significantly differentiallyexpressed (corrected p < 0.001) are in red.
Poelchau et al. BMC Genomics 2011, 12:619http://www.biomedcentral.com/1471-2164/12/619
Page 8 of 19

Verification of DE ESTs - Significance comparisonsPerfect congruence between the levels of significancedetected using qPCR and 454 sequencing is not to beexpected, because 1) the 454 results were based only onone biological replicate, thus increasing the possibility ofboth type I and type II error, and 2) the datasets wereacquired using fundamentally different approaches,necessitating alternative analyses to determine
Figure 5 RPKM values (454 sequence data) versus mean qPCR mRNA abundance for NDI and DI treatments. NDI treatments are shownin red, DI in blue. Lines from the linear regressions for each photoperiod treatment, after removal of the outlier histone2A, are plotted as solidlines (r2(NDI)= 0.70; r2(DI)= 0.90).
Table 5 Correlation coefficients (r2) between qPCR mRNAabundance and 454 gene expression
normalization method NDI DI
RPKM 0.722 0.911
TMM 0.548 0.727
Correlation coefficients are derived from linear regressions between qPCRmRNA abundance and both TMM and RPKM gene expression measures from454 read counts for each gene verified by qPCR.
Poelchau et al. BMC Genomics 2011, 12:619http://www.biomedcentral.com/1471-2164/12/619
Page 9 of 19

significance of DE. While qPCR has some methodologicalcaveats [47], it is generally considered a benchmark forgene expression analyses. To determine whether signifi-cant differential expression in the 454 dataset correspondsto significant DE in the qPCR data, we calculated sensitiv-ity (true positive rate) and specificity (true negative rate)statistics of the 454 dataset. Because our correlation ana-lyses between 454 and qPCR expression levels suggest thatRPKM performs better at predicting mRNA abundancethan the TMM normalization, we compared both expres-sion measures’’ performance for predicting qPCR signifi-cance. Despite the better predictive ability of RPKM onmRNA abundance, both expression measures of the 454data were poor predictors of qPCR significance (Table 6).This is perhaps not surprising, given the dramatically dif-ferent methods used to determine significance between454 and qPCR noted above. Despite lack of congruencebetween 454 and qPCR results regarding genes predictedas significantly DE, 10 of 10 genes from the DI categoryhad higher average expression under DI conditions basedon qPCR results, and as such were directionally consistentbetween both methods (See additional file 6: Results ofqPCR validation). As expected based on the lower correla-tions in the NDI data noted above, directional consistencywas lower for NDI genes (9 of 21). These results indicatethat 454 sequencing as applied in this study can be usefulguide to de novo identification of transcriptional differ-ences underlying complex phenotypes, but that replica-tion, either by verification with qPCR, or by sequencingreplicated libraries, is essential for verification. Below, werestrict our discussion of transcriptional elements of dia-pause response in Ae. albopictus to ESTs verified as DE byqPCR.
Verification of DE ESTs - Functional categories of verifiedgenesSeveral themes in the insect diapause program haveemerged from comparative analyses of diapause-mediated developmental arrest, including DNA
replication and transcription, endocrine signaling, meta-bolism, and response to stress [3-5,8,9,21]. These pro-cesses can be important during diapause preparation,but other pathways leading to preparatory functions,such as growth regulation in advance of developmentalarrest, accumulation of metabolic reserves, and beha-vioral or morphological changes to protect against thephysiological stresses of the harsh environment [1], maydominate the transcriptional profile during the prepara-tory phase. In Ae. albopictus, maternally provisionedtranscripts from females reared under short day lengthsdictate the development of diapause-destined oocytes; itis not known in Ae. albopictus, nor in most other pre-diapause insects, which of these processes should betranscriptionally dominant. From qPCR experiments, wefound differential expression of ESTs belonging to themain categories of developmental arrest during diapause,and identified additional ESTs from pathways that havenot yet received attention in previous studies on themolecular bases of diapause (Table 7).Developmental arrest is the definitive diapause pheno-
type. Studies of pre-diapause gene expression in otherinsects suggest that precursors of developmental arrestare initiated during the preparatory phase [17,21]. Inour study, two ESTs with homologs involved in DNAreplication and transcription were more abundant in DIoocytes: inhibitor of growth protein (ing1, AAEL003650)and bhlhzip transcription factor bigmax (AAEL011202)(Table 7). In various systems, ING1 has shown involve-ment in oncogenesis, apoptosis, DNA repair and nega-tive cell cycle regulation [reviewed in [48]]. In D.melanogaster, ING1 is thought to interact with p53,which is a transcription factor that can respond to stressby affecting cell-cycle arrest, DNA repair, apoptosis, orsenescence [49]. Cell-cycle arrest is one of the unifyingthemes of diapause [9], thus genes that may affect thisarrest are good candidates as developmental regulators.Among its various functions, the transcription factorBhlhzip bigmax appears to be a target of FOXO and isinvolved in regulating metabolism and energy sensing[50,51]. The importance of FOXO in the diapause ofCulex pipiens, another mosquito [52], and the criticalrole of energy sensing during diapause [8] suggests pos-sible roles for these two ESTs in the preparatory phaseof diapause in Ae. albopictus.The endocrine system plays a central role in regulat-
ing diapause [53]. Although our understanding of theendocrine regulation of embryonic diapause is restrictedto just a few species, high levels of ecdysteroids are criti-cal for the induction and maintenance of embryonic dia-pause in the gypsy moth, Lymantria dispar [54]. In pre-diapause Ae. albopictus oocytes, two homologs of genespotentially involved in ecdysone signaling were differen-tially expressed. The first, rack1, encodes a receptor for
Table 6 Sensitivity and specificity information calculatedfrom 48 candidate genes
Normalization method
RPKM TMM
TP (true positives) 4 6
TN (true negatives) 19 12
FP (false positives) 19 26
FN (false negatives) 5 3
TPR (sensitivity) 0.44 0.67
TNR (specificity) 0.50 0.32
Values for both RPKM and TMM expression measures from the 454 data areshown. Sensitivity is calculated as the number of true positives over thenumber of all positives; Specificity is the number of true negatives divided byall negatives.
Poelchau et al. BMC Genomics 2011, 12:619http://www.biomedcentral.com/1471-2164/12/619
Page 10 of 19

activated protein kinase C, and was more abundantunder DI conditions. RACK1 is known to bind to sev-eral different signaling molecules [55], including a molt-associated transcription factor that is linked to theaction of 20-hydroxyecdysone [56]. It is highly expressedin ovary tissue and is thought to be required for oogen-esis in D. melanogaster; female D. melanogaster homo-zygous for RACK1 null alleles show reduced ovary size[55]. rack1 has also been implicated in diapause in otherinsects. For example, in a study of gene expression inpre-diapause and diapause cricket embryos (Allonemo-bius socius), rack1 expression was higher in pre-diapauseembryos, but subsequently decreased during diapause[21]. Intriguingly, it has recently been shown thatRACK1 affects circadian rhythm function in mouse [57].A classic hypothesis proposes that circadian rhythmunderlies the expression of photoperiodic diapause [58],although evidence supporting this hypothesis is limited[59,60] and highly debated [e.g. [61]]. However, thesefindings suggest a possibly complex role for RACK1 indiapause preparation. The second differentiallyexpressed transcript potentially related to endocrine sig-naling is ecdysone inducible protein L2 (eip), which wasless abundant in DI oocytes. The D. melanogasterhomolog of eip, imp-l2, has been implicated in ectodermand neural development [62], is essential for starvationresistance [63], and may have a role in the regulation ofgrowth [64]. Loss-of-function alleles of imp-l2 in D. mel-anogaster result in female size increase, which appears
to be primarily driven by enlarged ovaries [63]. Interest-ingly, both rack1 and eip have phenotypes related toovary size in D. melanogaster [55,63]. Eggs from Ae.albopictus reared under DI conditions are larger andcontain more lipids than eggs from females rearedunder NDI conditions (PAA, unpublished data); wespeculate that decreased pre-diapause expression of theAe. albopictus imp-l2 homolog, and/or increased expres-sion of the rack1 homolog, could affect ovary and subse-quent egg size. Ongoing studies of the expression levelsof these genes during embryological development anddevelopmental arrest in pharate Ae. albopictus larvaewill provide further insight into the diapause-relatedfunction of these transcripts, as well as important com-parative results regarding the ecdysone signalingpathway.Diapause is often accompanied by a decrease in meta-
bolism. One gene involved in metabolism was moreabundant in DI oocytes: phosphoenolpyruvate carboxy-kinase (pepck). PEPCK is part of the gluconeogenesispathway, and has higher expression levels during dia-pause in Sarcophaga crassipalpis [5]. Diapausing insectsappear to enhance gluconeogenic pathways, in part dueto a shift towards anaerobic metabolism [8]. Wehypothesize that the over-expression of this transcriptduring the pre-diapause phase in Ae. albopictus oocytesmay either represent a maternally provisioned regulatorycue, or initiation of the gluconeogenic pathway inadvance of the onset of developmental arrest. The
Table 7 Genes verified as DE from qPCR analyses
Ae. albopictus ID Putative homolog 454category
Fold-change
corrected p-value
Functional category
Aalb_oocyte_rep_c42113_trimmed phosphoenolpyruvate carboxykinase(pepck)
DI 0.82 0.004 metabolism
Aalb_oocyte_rep_c2808_trimmed Ecdysone inducible protein L2,putative (eip)
NDI -0.85 0.005 endocrine signaling
Aalb_oocyte_rep_c41764_trimmed Inhibitor of growth protein (ing1) a priori 1.05 0.002 DNA replication/transcription
Aalb_oocyte_rep_c38864_trimmed Conserved hypothetical protein(AAEL004873)
NDI 0.48 0.004 unknown
Aalb_oocyte_rep_c36433_trimmed Conserved hypothetical protein(AAEL008645)
DI 1.33 0.000 unknown
Aalb_oocyte_GH79BIP01BENVH_trimmed Bhlhzip transcription factor bigmax DI 0.87 0.010 DNA replication/transcription
Aalb_oocyte_rep_c3449_trimmed GPCR Methuselah Family a priori 0.88 0.004 stress response
Aalb_oocyte_rep_c40438_trimmed Receptor for activated C kinase,putative (rack1)
DI 0.86 0.003 endocrine signaling
Aalb_oocyte_rep_c18194_trimmed Conserved hypothetical protein(AAEL012019)
DI 0.92 0.010 unknown
Aalb_oocyte_rep_c431_trimmed phosphatidylethanolamine-bindingprotein (pebp)
a priori 0.88 0.000 morphogenesis
Information on each gene verified as differentially expressed is shown. Putative homologs were derived from BLAST searches (see Methods). “454 category” refersto the differential expression status assigned to the EST based on read counts: DI or NDI, significantly over-expressed under DI or NDI conditions, respectively;and a priori, not DE based on 454 read counts, but of a priori interest based on previous diapause research. Fold-change calculations are based on qPCR results,and were calculated as log2(DI-NDI), where DI and NDI are the average mRNA abundance for DI and NDI treatments, respectively (see Methods). The corrected p-value is derived from Student’’s t-test of mRNA abundances derived from qPCR reactions.
Poelchau et al. BMC Genomics 2011, 12:619http://www.biomedcentral.com/1471-2164/12/619
Page 11 of 19

transcription factor Bhlhzip bigmax, discussed above,could also contribute to the down-regulation of metabo-lism [50,51] associated with diapause.Increased longevity and stress resistance are also
important features of the diapause program. Potentiallyrelevant to these phenotypes, a gene encoding a G-pro-tein coupled receptor (GPCR) from the Methuselahfamily was more abundant in pre-diapause oocytes. InD. melanogaster, the methuselah (mth) gene is asso-ciated with longevity and stress resistance [65]. Mthhaplotype distributions vary latitudinally in D. melano-gaster [66], and studies of allelic variation in mth sug-gest that the gene contributes to differences in lifespanamong populations [67]. While down-regulation of mth,rather than over-expression, should result in greaterstress resistance based on results from D. melanogaster,other GPCRs are potentially up-regulated in response todiapause-related stimuli in other organisms. SomeGPCRs in C. elegans show strong responses to dauerformation [68], which is analogous to insect diapause. InBombyx, a GPCR shows high affinity to diapause hor-mone [69], suggesting it could be important in mediat-ing developmental arrest.Three other genes that did not fall into established
functional categories related to diapause had higherexpression in pre-diapause oocytes. The putative Ae.aegypti homologs of all three genes are annotated as“conserved hypothetical proteins”. These genes may beparticularly intriguing, as they could relate specifically todiapause preparation in Ae. albopictus or other insects.However, because their annotations are uncertain, thegenes’’ functions are highly speculative. We providebrief descriptions of the genes’’ domains and gene ontol-ogy categories, if available, recognizing that much morework is necessary to understand the function of thesegenes in the context of Ae. albopictus diapause.AAEL008645’’s gene ontology association is ‘’proteinbinding’’. It contains evidence for a B30.2/SPRY domain,a LisH motif, and a CRA domain. AAEL004873’’s geneontology associations are protein binding and cell adhe-sion. It contains a GILT motif (gamma-interferon-indu-cible lysosomal thiol reductase), which is thought to beassociated with disulphide bond reduction. While it waspredicted to be over-expressed in non-diapause destinedoocytes based on RPKM, qPCR experiments show thatit is actually more abundant in pre-diapause oocytes.AAEL012019 has several motifs; a galactose-binding-domain-like motif (sub-motif: coagulation factor 5/8type, c-terminal; Muskelin, n-terminal; Kelch1); and aLisH dimerization motif.Previously, we investigated the expression patterns of
a putative phosphatidylethanolamine-binding protein(pebp) in diapause and non-diapause oocytes in multiplepopulations of Ae. albopictus [19]. While our present
data show significant up-regulation of pebp in a singletemperate population under DI conditions, the previousstudy suggested a regional effect on pebp expression inthese populations, rather than a simple over-expressionof pebp under DI conditions. These results are notnecessarily contradictory, as the studies differ in theirexperimental design and replication: while the previousstudy utilized more populations, our analysis includesmore replicates per photoperiod treatment, and thusmay have more statistical power to capture subtle differ-ences in expression levels. This could indicate that thedifferential expression of pebp under different photoper-iods is population-specific. There is little informationabout the role of pebp in insects, but studies from plantshave documented differential expression of a pebp genefamily member FT (Flowering locus T) in response tophotoperiod [70], which shows differential expression tophotoperiod treatments in latitudinally disparate popula-tions in Picea abies [71]. These results raise the intri-guing possibility that genes from the pebp family mayhave similar roles or be involved in photoperiodicallymediated life history transitions across both plant andanimal kingdoms.Three additional genes (fatty acyl coA elongase, gi|
239997749|; heat shock protein 67B2, gi|254728755|;and epithelial membrane protein, gi|270037306|) impli-cated in the diapause response of Ae. albopictus basedon differential abundance in oocyte tissue [19,20] exhib-ited non-significant up-regulation under DI conditionsin the current study. Because the experimental design ofthe previous studies differed from the current experi-ments, exact comparison of results is not possible.Nevertheless, the direction of differential expression isthe same, indicating that our current results are qualita-tively consistent with these previous studies.
ConclusionsOur goals for this study were: 1) to generate a compre-hensive oocyte transcriptome for Ae. albopictus, anemerging model system for studying the evolutionaryand ecological genomics of diapause, and 2) to identifycandidate genes for diapause preparation in this species.Our assembly of a high-quality, conservative transcrip-tome for Ae. albopictus oocytes highlights usefulapproaches to utilizing a closely related reference gen-ome to generating high-confidence ESTs in a non-model organism. Additionally, the assembly enabled usto identify several candidate genes for diapause prepara-tion that are consistent with established themes of theinsect diapause program as well as additional candidatesthat are potentially unique to Ae. albopictus. In additionto the potential relevance to diapause, many of theseESTs are related to fundamental biological processessuch as metabolism, stress tolerance, and the endocrine
Poelchau et al. BMC Genomics 2011, 12:619http://www.biomedcentral.com/1471-2164/12/619
Page 12 of 19

control of development and thus may ultimately provideuseful targets for developing novel forms of vector con-trol in this medically significant vector of human dis-ease. Finally, the comprehensive oocyte EST databaseshould provide a useful resource for comparative geno-mics and vector molecular physiology.
MethodsTissue generation for 454 sequencing from Ae. albopictusoocytesWe collected over 400 Ae. albopictus larvae and pupaefrom approximately 20 tires located at a used tire yardin Manassas, VA, in 2008. This strain was reared in thelaboratory on a non-diapause inducing (NDI) long-dayphotoperiod (16 h light, 8 h dark) at 21°C and ca. 80%relative humidity for five generations as described inArmbruster and Hutchinson [72] and Armbruster andConn [73]. To produce tissue for transcriptome sequen-cing, in the laboratory F6 generation approximately 200female pupae were placed into each of two cages, one ofwhich was maintained under an NDI photoperiod (16 hlight, 8 h dark) and the other of which was maintainedunder a diapause-inducing (DI) unambiguous short-dayphotoperiod (8 h light, 16 h dark). Both cages weremaintained at 21°C and ca. 80% relative humidity.Females were bloodfed to repletion 7-18 days after eclo-sion on a human host. Although we included femalesfrom an 11-day range of chronological age, this variationis unlikely to have a large effect on the abundance ofmature oocyte transcripts since ovarian development ismore strongly influenced by time since blood meal thanchronological age [74]. Five days after bloodfeeding,females were anaesthetized with CO2 and frozen at -80°C. Mature (stage V) oocytes were identified based on avisible exochorion pattern and dissected into RNAla-terTM (Sigma Aldrich, St. Louis, MO). 60 - 80 frozenmosquitoes per photoperiod treatment were used.
Tissue generation for qPCRTissue for qPCR reactions was generated for 5 biologicalreplicates under each of NDI and DI photoperiod treat-ments using the same methods described above, butfrom F7 (2 replicates) and F8 (3 replicates) laboratorygenerations. Briefly, ca. 50 female pupae for each biolo-gical replicate were placed in separate adult cages underNDI and DI photoperiod treatments as described above.Oocytes from 12 to 27 females were used for each bio-logical replicate from each photoperiod treatment.
Diapause incidence measurementsWe confirmed the diapause response for each genera-tion and replicate of laboratory rearing. Adult cageswere established under DI and NDI photoperiod treat-ments as described above with ca. 50 male and 50
female mosquitoes per cage. Females were blood fed torepletion on a human host and a small black jar half-filled with ca. 20 ml of dI water and lined with anunbleached paper towel was placed into each cage. Wecollected the towels with oviposited eggs every Monday,Wednesday, and Friday. Two days after collection thetowels were slowly dried and stored at ca. 80% relativehumidity. The diapause response was measured by sti-mulating 10-20 day old eggs to hatch following Novakand Shroyer [75]. Egg towels were re-dried and hatcheda second and third time after 1 and 2 weeks, respec-tively, to ensure hatching of all non-diapausing eggs.Embryonated, unhatched pharate larvae (in diapause)were identified by submerging eggs in a bleach solutionfor 48-72 h [76] and percent diapause incidence was cal-culated as the number of embryonated but unhatchedlarvae divided by the total number of viable pharate lar-vae in the sample (embryonated unhatched and hatchedlarvae) [27,77].
RNA preparation and sequencingWe extracted total RNA using TRI® Reagent (SigmaAldrich, St. Louis, MO) followed by an isopropanol pre-cipitation, according to manufacturer’’s instructions.DNA was removed from each sample with Turbo-DNA-free (Applied Biosystems/Ambion, Austin, TX) andRNA integrity assessment was performed for each sam-ple on an RNA chip (Bioanalyzer 2100, Agilent Technol-ogies, Santa Clara, CA). For RNA used in 454sequencing, we enriched for mRNA with Dynabeadsoligo(dT) probes (Dynal Biotech, Oslo, Norway). mRNAwas then sent to the University of Maryland Institutefor Genome Sciences for 454 GS-FLX Titanium sequen-cing using standard protocols (Roche, Inc.). Briefly,mRNA was fragmented with a zinc chloride solution.cDNA was synthesized from the fragmented mRNAusing random hexamer primers, and separate adaptorswere ligated to cDNA fragments from each cDNAlibrary (DI and NDI). Fragments were then sequencedwith GS FLX chemistry. Raw reads and quality scoresare archived at NCBI Sequence Read Archive (SRA)under Accession SRP007714; trimmed EST sequencesare accessible at NCBI’’s transcript shotgun archive(TSA) under accession numbers JO845359-JO913491.We also provide the raw reads, trimmed ESTs,untrimmed contigs, and an Excel spreadsheet with rele-vant annotation information at the Aedes albopictusexpression database [http://AlbopictusExpression.org].
De novo transcriptome assembly and annotation - readcleaningA flow chart describing our data analysis workflow ispresented in Figure 1. Reads were trimmed according topre-defined Roche settings prior to assembly. As
Poelchau et al. BMC Genomics 2011, 12:619http://www.biomedcentral.com/1471-2164/12/619
Page 13 of 19

additional quality filters, we eliminated 1) reads thatcontained at least one ambiguous base [78]; 2) duplicatereads, which are known to occur as an artifact of 454sequencing [79]; 3) reads with an average quality scorelower than 25 [following 78, as well as our own observa-tions of read quality]; and 4) reads with significantBLAST matches (e-value > 1e-25) to Ae. albopictusrRNA and to Wolbachia (See additional file 7: Gene IDsof Ae. albopictus rRNA and Wolbachia spp. used topre-screen reads). We used the program SnoWhite 1.1.4[[80], unpublished] to trim poly-A/T tails and to removeall reads shorter than 50 bp, and ssaha2 [81] to matchadaptor sequences to reads, which were then masked inthe assembly program MIRA [34].
De novo transcriptome assembly and annotation - Denovo assemblyWe used MIRA 3.2.0 [34] to assemble pooled readsfrom both libraries into a single contig set. Defaultassembly parameters for ESTs generated by 454 sequen-cing technology were used with minor modifications topermit the assembly of contigs with SNPs (See addi-tional file 8: MIRA command line used for transcrip-tome assembly). These modifications were requiredbecause we sequenced an outbred population of labora-tory-reared mosquitoes, rather than an inbred line.MIRA has recently been shown to be one of the morereliable programs for de novo 454 transcriptome assem-bly [35]. To assess whether the amount of sequenceused affected contig length, we performed a test assem-bly in MIRA with one half of the 454 dataset. Addition-ally, we performed exploratory assemblies with Newbler2.3 [82], which yielded qualitatively similar results (dataavailable on request from MFP). However, because moregene models were captured with the MIRA assembly, asassessed by BLAST matches, we used the MIRA assem-bly for further analyses.
De novo transcriptome assembly and annotation -functional annotationWe performed a series of BLAST searches to establishhomology between contigs or singletons (both referredto hereafter as “ESTs”) from Ae. albopictus and anno-tated genes from other organisms. Because of the lim-ited EST information available on NCBI for Ae.albopictus, we relied mainly on annotations andsequence information from Ae. aegypti, a closely relatedmosquito in the same sub-genus (Stegomyia). We per-formed BLASTN and BLASTX searches of our ESTdataset to several reference databases with increasing e-value cutoffs as taxonomic distance increased (Table 3).The match with the lowest e-value was retained. If mul-tiple matches with the same e-value were present, thenthe match with the highest bitscore was retained. Our
search against C. elegans proteins was inspired by Rag-land et al. [5], who found limited evolutionary conserva-tion in dormancy expression patterns betweenSarcophaga crassipalpis and the well characterized larvaldauer stage of C. elegans [68].To evaluate whether we had recovered close to the
maximum number of genes contained in our sequencinglibraries, or whether greater sequencing depth of theselibraries would have led the recovery of more uniquegenes, we generated a bootstrapped gene accumulationcurve [e.g. [31]]. We used BLASTN to determinehomology between individual reads and Ae. aegypti tran-scripts, using a minimum required e-value of 1e-10. Werandomized the BLAST output order 1,000 times, andthen calculated the mean number of Ae. aegypti tran-scripts captured by each additional read. We thenplotted the mean cumulative number of new Ae. aegyptitranscripts discovered with each new read; if sequencingdepth was sufficient, then this curve should reach anasymptote with an increasing number of sampled reads.
De novo transcriptome assembly and annotation -homology-based EST filtering and trimmingOur BLAST searches revealed high redundancy in theESTs, such that multiple ESTs had the closest similarityto the same putative homolog, and often to the sameregion of that homolog (mean/median number of ESTsper gene: 8.6/4; See additional file 1: Distribution of thenumber of ESTs assigned to a reference gene). Thisredundancy is often observed with the MIRA program[83], and could reflect biological variation among tran-scripts originating from a single gene, for example alter-native splicing or allelic variation. However, this resultcould also be due to sequencing errors, or spuriouslyassembled sequence. Many of the redundant contigsassigned to a reference gene were highly diverged intheir 5’’ and 3’’ ends. To determine whether these vari-able ends represent alternative isoforms of a gene or aredue to sequencing or assembly errors, we amplifiedthese alternative ends using qPCR. This confirmed thepresence of some alternative isoforms (amplified productsize was consistent with predicted product size fromcontigs in 18 out of 22 cases, data not shown). However,due to the high frequency of redundant ESTs, whichmakes it impossible to confirm all isoforms comprehen-sively, we opted take a conservative approach and onlyuse the region of one, “representative” EST that alignedwith its homolog for further analyses (Figure 1). Thismethod will remove redundancy and uncertain annota-tions, but will also remove valid sequence (see below),and sequences unique to Ae. albopictus.To identify representative ESTs, for each group of
ESTs assigned to the same gene, we found the EST withthe best tradeoff between length and % identity. To do
Poelchau et al. BMC Genomics 2011, 12:619http://www.biomedcentral.com/1471-2164/12/619
Page 14 of 19

this, we selected ESTs with a % identity above a setvalue (Table 3; % identity cutoffs were chosen based onvisual inspection of the distribution of % identity valuesfrom matches to each genome database). Within thissubset, we chose the EST with the longest BLASTmatch. When the % identity of all ESTs assigned to agene was lower than the cutoff, the match with thehighest % identity was used. For EST groups withmatches in all other databases, the match with the high-est % identity was used (Table 3), as % identity was gen-erally lower in these groups; length was not included asa selection criterion, other than a minimum lengthrequirement of 50 bp. Matches to the Ae. aegypti gen-ome were only used in further analyses if the majority(>50%) of the EST was contained within an annotatedmRNA (gff3 AaegL1.2). Once the best match for a refer-ence gene was determined, we trimmed the aligned ESTto its start and stop coordinates from the BLAST out-put, to eliminate variable 5’’ and 3’’ ends that couldrepresent either alternative isoforms, or sequencing andassembly error. On average, 464 bp were trimmed fromeach EST (min: 1bp, max: 10,810 bp).
Differential expression (DE) analysis - 454 sequence dataTo identify candidate DE genes from our 454 dataset,we estimated expression for each EST based on countsof mapped reads to the trimmed ESTs. We mappedreads from each cDNA library (DI and NDI) to the fil-tered and trimmed EST set using the program ssaha2[81] with 454 default settings, with the additionalrequirement of a minimum of 95% identity. Reads thatmapped to multiple ESTs or locations (2.8%) werediscarded.We used two different measures of differential expres-
sion (DE). First, we performed the TMM normalizationmethod (trimmed-mean of M values) as implemented inthe edgeR package [[44], http://www.bioconductor.org/].This method calculates a normalization constant toaccount for differences in library size. Additionally, itcorrects for biases in read count data that arise whenthe total number of expressed genes are skewed towardsone library, a phenomenon that we had observed in ourread counts. We used this normalization method toguide our choice of candidate genes for qPCR validation(see below).Factors in addition to library size and skew can influ-
ence read counts in RNA-Seq data. For example, tran-script length is also known to affect read abundance[45,84]. As a second evaluation of expression, we calcu-lated RPKM [the number of reads per kilobase of exonmodel per million mapped reads, [45]]. We usedtrimmed EST length as transcript length.To calculate the significance of differences in normal-
ized read counts, we used the sage.test function from
the statmod package in R (http://www.r-project.org),which implements an exact binomial test to test for dif-ferential expression in individual genes. For the TMMmethod, we used the normalization constant to adjustlibrary sizes in the sage.test function. We scaled RPKMvalues for each gene and library by a constant, such thatthe sum of all RPKM values equaled the original readtotal from both libraries. This scaling was necessary tocompare significance values between the two read countmethods, as the magnitude of the binomial test statisticis influenced by sample size. P-values from each methodwere then subjected to Benjamini-Hochberg correctionfor multiple testing [85] using the p.adjust functionfrom the same package. We scored candidate genes witha corrected p-value < 0.001as DE.Genes that are unique to a photoperiod treatment
have an undefined log fold-change and log abundance,but these genes may be of particular biological impor-tance. To include these genes in our calculations offold-change, we added a value of 0.1 to the read countof all genes in each library. Fold-change values were cal-culated as log2(DI/N(DI)) - log2(NDI/N(NDI)), where N(DI) and N(NDI) are the normalized library sizes of theDI and NDI libraries, respectively.
Verification of DE ESTs by qPCRWe used quantitative RT-PCR to verify the expressionof candidate genes from two general categories: genesclassified as over-expressed in the NDI and DI treat-ments from the TMM-normalized 454 analysis, andgenes that were of a priori interest based on their rolein the diapause response in other insects (See additionalfile 6: Results of qPCR validation). Previous studies onthe physiological and molecular changes during diapausehave revealed common themes of the diapause programacross insects such as DNA replication and transcrip-tion, endocrine signaling, metabolism, and response tostress [5,8,9,21]. We used these categories to guide ourchoice of genes to test for DE using qPCR, because wewere interested in determining whether diapause induc-tion in Ae. albopictus showed commonalities of geneexpression in genes putatively involved in these cate-gories. We selected several genes from these categories,regardless whether they were significantly differentiallyexpressed in the 454 dataset (See additional file 6:Results of qPCR validation).Total RNA for qPCR was isolated from oocytes as
described above. RNA pellets were stored at -70°C in75% ethanol until they were used for cDNA synthesis.The concentration of resuspended RNA was measuredusing a Nano Drop spectrophotometer (Thermo Scienti-fic, Wilmington DE USA). cDNA was synthesized usingthe iScript™ cDNA synthesis kit (Bio-Rad Laboratories,Inc. Hercules CA USA) according to the manufacturer’’s
Poelchau et al. BMC Genomics 2011, 12:619http://www.biomedcentral.com/1471-2164/12/619
Page 15 of 19

instructions. One microgram of RNA was used in eachsynthesis reaction. To reduce variation caused by differ-ences in the efficiency of the reverse transcription reac-tion, duplicate reactions were performed for eachbiological replicate and the products of the duplicatereactions were pooled then diluted before being used inqPCR reactions.Relative mRNA abundance of selected genes of inter-
est was measured using an iQ5™ Multicolor Real-TimePCR Detection System (Bio-Rad) and iQ™ SYBR GreenSupermix (Bio-Rad). Each 20 μl reaction included 300 -900 nM of the appropriate forward and reverse primersand 2 μl of cDNA template. PrimerQuest software (IDTDNA, Coralville, IA, USA) was used to design primersequences which conform to MIQE standards (primersequences available on request from JAR). Cycling para-meters were 95°C for 3 min followed by 40-50 cycles of95° for 10 s, 58° C for 30 s and 72° C for 30 s. Meltcurve analysis and 1% agarose gel electrophoresis ofPCR products verified that only one product was ampli-fied in each reaction.mRNA abundance was evaluated in 5 biological repli-
cates for each group with three technical replicates foreach primer pair. A modified 2-ΔΔCt method [86] wasused to calculate mRNA abundance for each gene ofinterest. Briefly, after averaging the threshold cycles (Ct
) of the technical replicates for each biological replicate,the geometric mean Ct for three reference genes,RpL34, Histone H3, and Nucleosome Assembly Protein(NAP), was subtracted from the mean Ct for each geneof interest (ΔCt). This value was then transformed togive relative mRNA abundance (2-ΔCt). Fold-change wascalculated by dividing the mean relative abundance ofDI replicates by the mean relative abundance of NDIreplicates, and then taking the logarithm (log2) of thisratio. Student’’s t-test was used to test for significant dif-ferences in relative mRNA abundance between groups,with a false discovery rate analysis [85] applied toreduce the probability of type I errors due to multiplecomparison testing.
Verification of DE ESTs - Significance comparisonsTo determine whether expression levels from the 454dataset and qPCR experiments were correlated, andwhether the normalization method of the 454 datasetaffected these correlations, we analyzed correlations inexpression levels between both the TMM and RPKMnormalization methods (454 EST set) and averagemRNA abundance (qPCR data, 2-ΔCt) using the lm func-tion in the package stats in R (http://www.r-project.org).To address why correlation coefficients between 454
expression and mRNA abundance differed by photoper-iod treatment, we calculated coefficients of variation(CVs) of mRNA abundance (2-ΔCt) from the five
replicates of the qPCR data for each gene and photoper-iod treatment. We then used a paired Student’’s t-test todetermine whether CVs were significantly differentbetween photoperiod treatments.We evaluated the correspondence of significant
expression of each normalization method with signifi-cant expression of the qPCR data. First, for each nor-malization method, genes that were DE based on 454expression levels were deemed “positive”, and those thatwere not DE “negative”. True positives occurred whenthe qPCR analysis confirmed significant over-expressionin the same direction, and false positives were calledwhen the qPCR result for a “positive” gene was not sig-nificant, or significant in the opposite direction. Truenegatives were non-significant in both the 454 andqPCR analysis, whereas false negatives actually demon-strated differential expression in the qPCR analysis. Wethen calculated the sensitivity and specificity of eachmethod, where sensitivity is the number of true positivesdivided by all positive calls, and specificity is the numberof true negatives divided by all negative calls.
Additional material
Additional file 1: Distribution of the number of ESTs assigned to areference gene. The x-axis is truncated at 100 EST matches per gene; 29genes with 100-5,613 ESTs assigned to them are not included on thegraph.
Additional file 2: Box plot of the percent length of each putativehomolog matched by its Ae. albopictus EST. Only ESTs from the “final”EST set are included. Reference length coverage values, which arecalculated as the alignment length from the BLAST match, divided bythe transcript length of the putative homolog. are displayed for eachreference organism. Ae. aegypti genomic matches are not shown, as theyencompass large stretches of non-coding sequence, and therefore thepercent of the reference matched is unclear. Box plot symbols as inFigure 3.
Additional file 3: Box-plot of percent identities from BLASTalignments of final ESTs to each reference organism. Box plotsymbols as in Figure 3.
Additional file 4: Gene accumulation curve of Ae. albopictus ESTs.The average cumulative number of recovered Ae. aegypti transcripts,plotted against the number of reads needed to obtain that number. Allreads were searched against Ae. aegypti transcripts via blastn. The BLASToutput order was randomized 1,000 times, and the average number oftranscripts discovered with each additional read was calculated.
Additional file 5: Characteristics of all differentially expressed genesfrom the 454 dataset. Gene ontology assignment, BLAST alignment,and expression statistics for the putative homolog of each differentiallyexpressed EST.
Additional file 6: Results of qPCR validation. Experimental details andresults of qPCR for genes chosen for qPCR validation based on 454differential expression or a priori expectation from previous diapausestudies. Both putative functional information from the gene’s homolog,as well as reaction conditions from the qPCR experiments, are shown.Fold-change values for qPCR experiments are given as log2(DI-NDI),where positive values indicate higher expression under DI conditions,and negative values indicate higher expression under NDI conditions.
Additional file 7: Gene IDs of Ae. albopictus rRNA and Wolbachiaspp. used to pre-screen reads.
Poelchau et al. BMC Genomics 2011, 12:619http://www.biomedcentral.com/1471-2164/12/619
Page 16 of 19

Additional file 8: MIRA command line used for transcriptomeassembly. MIRA commands used to perform de novo transcriptomeassembly on Ae. albopictus oocyte cDNA libraries generated underdiapause-inducing and non-diapause-inducing photoperiods.
AcknowledgementsWe would like to thank the Armbruster, Elsik, and Denlinger labs, and R.Scott Cornman, for helpful comments and suggestions on this work.Christopher Childers was instrumental in setting up the website http://AlbopictusExpression.org. Jessica Wooten performed lab work to confirm Ae.albopictus isoforms. This research was funded by NIH grant number5R21AI081041-02.
Author details1Department of Biology, Georgetown University, 37th and O Streets NW,Washington, DC, USA. 2Department of Entomology, Ohio State University,318 W 12th Ave., Columbus, Ohio, USA.
Authors’ contributionsMFP prepared insect tissues, generated the mRNA for sequencing librariesand qPCR experiments, performed transcriptome assembly and sequenceanalysis, and drafted the manuscript. JAR designed and performed all qPCRexperiments and helped to draft the manuscript. DLD participated in thedesign and coordination of the study and helped to draft the manuscript.CGE participated in the design and analysis of the study, contributedcomputational resources, and helped to draft the manuscript. PAAconceived of the study, participated in its design and coordination, andhelped to draft the manuscript. All authors read and approved the finalmanuscript.
Received: 13 August 2011 Accepted: 20 December 2011Published: 20 December 2011
References1. Tauber MJ, Tauber CA, Masaki S: Seasonal adaptations of insects New York:
Oxford University Press; 1986.2. Benoit J, Denlinger D: Suppression of water loss during adult diapause in
the northern house mosquito, Culex pipiens. Journal of ExperimentalBiology 2007, 210:217-226.
3. Hahn D, Denlinger D: Meeting the energetic demands of insect diapause:Nutrient storage and utilization. Journal of Insect Physiology 2007, 760-773.
4. Hahn D, Ragland G, Shoemaker D, Denlinger D: Gene discovery usingmassively parallel pyrosequencing to develop ESTs for the flesh flySarcophaga crassipalpis. BMC Genomics 2009, 10:234.
5. Ragland G, Denlinger D, Hahn D: Mechanisms of suspended animationare revealed by transcript profiling of diapause in the flesh fly.Proceedings of the National Academy of Sciences of the United States ofAmerica 2010, 14909-14914.
6. Rinehart J, Li A, Yocum G, Robich R, Hayward S, Denlinger D: Up-regulationof heat shock proteins is essentail for cold survival during insectdiapause. Proceedings of the National Academy of Sciences of the UnitedStates of America 2007, 104:11130-11137.
7. Yoder J, Denlinger D: Water-balance in flesh fly pupae and water-vaporabsorption associated with diapause. Journal of Experimental Biology 1991,157:273-286.
8. Hahn D, Denlinger D: Energetics of Insect Diapause. Annual Review ofEntomology 2011, 56:103-121.
9. Denlinger DL: Regulation of diapause. Annual Review of Entomology 2002,93-122.
10. Emerson K, Uyemura A, McDaniel K, Schmidt P, Bradshaw W, Holzapfel C:Environmental control of ovarian dormancy in natural populations ofDrosophila melanogaster. Journal of Comparative Physiology A 2009,195:825-829.
11. MacRae TH: Gene expression, metabolic regulation and stress toleranceduring diapause. Cellular and Molecular Life Sciences 2010, 67:2405-2424.
12. Xu WH, Sato Y, Ikeda M, Yamashita O: Molecular characterization of thegene encoding the precursor protein of diapause hormone andpheromone biosynthesis activating neuropeptide (DH-PBAN) of the
silkworm, Bombyx mori and its distribution in some insects. BiochimicaBiophysica Acta 1995, 1261:83-89.
13. Ekblom R, Galindo J: Applications of next generation sequencing inmolecular ecology of non-model organisms. Heredity 2011, 107:1-15.
14. Wheat CW, Fescemyer HW, Kvist J, Tas E, Vera JC, Frilander MJ, Hanski I,Marden JH: Functional genomics of life history variation in a butterflymetapopulation. Molecular Ecology 2011, 20:1813-1828.
15. Emerson K, Bradshaw W, Holzapfel C: Microarrays Reveal EarlyTranscriptional Events during the Termination of Larval Diapause inNatural Populations of the Mosquito, Wyeomyia smithii. PLoS One 2010, 5:e9574.
16. Schwarz D, Robertson HM, Feder JL, Varala K, Hudson ME, Ragland GJ,Hahn DA, Berlocher SH: Sympatric ecological speciation meetspyrosequencing: sampling the transcriptome of the apple maggotRhagoletis pomonella. BMC Genomics 2009, 10:633.
17. Bao B, Xu W: Identification of gene expression changes associated withthe initiation of diapause in the brain of the cotton bollworm,Helicoverpa armigera. BMC Genomics 2011, 12:224.
18. Kostal V: Eco-physiological phases of insect diapause. Journal of InsectPhysiology 2006, 52:113-127.
19. Urbanski J, Aruda A, Armbruster P: A transcriptional element of thediapause program in the Asian tiger mosquito, Aedes albopictus,identified by suppressive subtractive hybridization. Journal of InsectPhysiology 2010, 56:1147-1154.
20. Urbanski J, Benoit J, Michaud M, Denlinger D, Armbruster P: The molecularphysiology of increased egg desiccation resistance during diapause inthe invasive mosquito, Aedes albopictus. Proceedings of the Royal Society B-Biological Sciences 2010, 277:2683-2692.
21. Reynolds J, Hand S: Embryonic diapause highlighted by differentialexpression of mRNAs for ecdysteroidogenesis, transcription and lipidsparing in the cricket Allonemobius socius. Journal of Experimental Biology2009, 212:2074-2083.
22. Benedict M, Levine R, Hawley W, Lounibos L: Spread of the tiger: Globalrisk of invasion by the mosquito Aedes albopictus. Vector-Borne andZoonotic Diseases 2007, 76-85.
23. Lounibos L: Invasions by insect vectors of human disease. Annual Reviewof Entomology 2002, 233-266.
24. Mori A, Oda T, Wada Y: Studies on the egg diapause and overwinteringof Aedes albopictus in Nagasaki. Tropical Medicine 1981, 23:79-90.
25. Wang RL: Observations on the influence of photoperiod on eggdiapause in Aedes albopictus Skuse. Acta Entomologica Sinica 1966,15:75-77.
26. Mogi M, Okazawa T, Sota T: Geographical pattern in autogeny and winglength in (Diptera: Culicidae). Mosquito Systematics 1995, 27:155-166.
27. Lounibos L, Escher R, Lourenco-de-Oliveria R: Asymmetric evolution ofphotoperiodic diapause in temperate and tropical invasive populationsof Aedes albopictus (Diptera: Culicidae). Annals of the Entomological Societyof America 2003, 96:512-518.
28. Denlinger DL: Why study diapause? Entomological Research 2008, 38:1-9.29. Nene V, Wortman JR, Lawson D, Haas B, Kodira C, Tu Z, Loftus B, Xi Z,
Megy K, Grabherr M, et al: Genome Sequence of Aedes aegypti, a MajorArbovirus Vector. Science 2007, 316:1718-1723.
30. Bettencourt R, Pinheiro M, Egas C, Gomes P, Afonso M, Shank T, Santos R:High-throughput sequencing and analysis of the gill tissuetranscriptome from the deep-sea hydrothermal vent musselBathymodiolus azoricus. BMC Genomics 2010, 11:559.
31. Der J, Barker M, Wickett N, dePamphilis C, Wolf P: De novocharacterization of the gametophyte transcriptome in bracken fern,Pteridium aquilinum. BMC Genomics 2011, 12:99.
32. Coppe A, Pujolar J, Maes G, Larsen P, Hansen M, Bernatchez L, Zane L,Bortoluzzi S: Sequencing, de novo annotation and analysis of the firstAnguilla anguilla transcriptome: EeelBase opens new perspectives forthe study of the critically endangered european eel. BMC Genomics 2010,11:635.
33. Zagrobelny M, Scheibye-Alsing K, Jensen N, Moller B, Gorodkin J, Bak S: 454pyrosequencing based transcriptome analysis of Zygaena filipendulaewith focus on genes involved in biosynthesis of cyanogenic glucosides.BMC Genomics 2009, 10:574.
34. Chevreux B, Pfisterer T, Drescher B, Driesel A, Muller W, Wetter T, Suhai S:Using the miraEST assembler for reliable and automated mRNA
Poelchau et al. BMC Genomics 2011, 12:619http://www.biomedcentral.com/1471-2164/12/619
Page 17 of 19

transcript assembly and SNP detection in sequenced ESTs. GenomeResearch 2004, 14:1147-1159.
35. Kumar S, Blaxter M: Comparing de novo assemblers for 454 transcriptomedata. BMC Genomics 2010, 11:571.
36. Choi J, Kijimoto T, Snell-Rood E, Tae H, Yang Y, Moczek A, Andrews J: Genediscovery in the horned beetle Onthophagus taurus. BMC Genomics 2010,11:703.
37. Parchman T, Geist K, Grahnen J, Benkman C, Buerkle C: Transcriptomesequencing in an ecologically important tree species: assembly,annotation, and marker discovery. BMC Genomics 2010, 11:180.
38. Ferguson L, Lee S, Chamberlain N, Nadeau N, Joron M, Baxter S,Wilkinson P, Papanicolaou A, Kumar S, Kee T, et al: Characterization of ahotspot for mimicry: assembly of a butterfly wing transcriptome togenomic sequence at the HmYb/Sb locus. Molecular Ecology 2010,19:240-254.
39. Altschul SF, Gish W, Miller W, Myers EW, Lipman DJ: Basic local alignmentsearch tool. Journal of Molecular Biology 1990, 215:403-410.
40. Papanicolaou A, Stierli R, Ffrench-Constant R, Heckel D: Next generationtranscriptomes for next generation genomes using est2assembly. BMCBioinformatics 2009, 10:447.
41. Crawford J, Guelbeogo W, Sanou A, Traore A, Vernick K, Sagnon N,Lazzaro B: De Novo Transcriptome Sequencing in Anopheles funestusUsing Illumina RNA-Seq Technology. PLoS ONE 2010, 5:e14202.
42. Gregory R, Darby A, Irving H, Coulibaly M, Hughes M, Koekemoer L,Coetzee M, Ranson H, Hemingway J, Hall N, Wondji C: A De NovoExpression Profiling of Anopheles funestus, Malaria Vector in Africa, Using454 Pyrosequencing. PLoS ONE 2011, 6:e17418.
43. McIntyre L, Lopiano K, Morse A, Amin V, Oberg A, Young L, Nuzhdin S:RNA-seq: technical variability and sampling. BMC Genomics 2011, 12:293.
44. Robinson M, Oshlack A: A scaling normalization method for differentialexpression analysis of RNA-seq data. Genome Biology 2010, 11:R25.
45. Mortazavi A, Williams BA, McCue K, Schaeffer L, Wold B: Mapping andquantifying mammalian transcriptomes by RNA-Seq. Nature Methods2008, 5:621-628.
46. Roberts A, Trapnell C, Donaghey J, Rinn JL, Pachter L: Improving RNA-Seqexpression estimates by correcting for fragment bias. Genome Biology2011, 12.
47. Fleige S, Pfaffl M: RNA integrity and the effect on the real time qRT-PCRperformance. Molecular Aspects of Medicine 2006, 27:126-139.
48. Feng X, Hara Y, Riabowol K: Different HATS of the ING1 gene family.Trends in Cell Biology 2002, 12:532-538.
49. Lunardia A, Di Minina G, Proveroc P, Dal Ferroa M, Carottia M, Del Sala G,Collavina L: A genome-scale protein interaction profile of Drosophila p53uncovers additional nodes of the human p53 network. Proceedings of theNational Academy of Sciences of the United States of America 2010,107:6322-6327.
50. Alic N, Hoddinott MP, Vinti G, Partridge L: Lifespan extension by increasedexpression of the Drosophila homologue of the IGFBP7 tumoursuppressor. Aging Cell 2011, 10:137-147.
51. Sans C, Satterwhite D, Stoltzman C, Breen K, Ayer D: MondoA-Mlxheterodimers are candidate sensors of cellular energy status:Mitochondrial localization and direct regulation of glycolysis. Molecularand Cellular Biology 2006, 26:4863-4871.
52. Sim C, Denlinger DL: Insulin signaling and FOXO regulate theoverwintering diapause of the mosquito Culex pipiens. Proceedings of theNational Academy of Sciences of the United States of America 2008,105:6777-6781.
53. Denlinger DL, Yocum GD, Rinehart JP: Hormonal control of diapause. InInsect Endocrinology. Edited by: Gilbert LI. London, UK: Academic Press;2012:430-463.
54. Lee K, Denlinger D: A role for ecdysteroids in the induction andmaintenance of the pharate first instar diapause of the gypsy moth,Lymantria dispar. Journal of Insect Physiology 1997, 43:289-296.
55. Kadrmas JL, Smith MA, Pronovost SM, Beckerle MC: Characterization ofRACK1 function in Drosophila development. Developmental Dynamics2007, 236:2207-2215.
56. Quan G, Krell P, Arif B, Feng Q: Receptor of activated C kinase 1 (RACK1)is necessary for the 20-hydroxyecdysone-induced expression of thetranscription factor CHR3 in the spruce budworm Choristoneurafumiferana. Insect Molecular Biology 2006, 15:79-87.
57. Robles M, Boyault C, Knutti D, Padmanabhan K, Weitz C: Identification ofRACK1 and Protein Kinase C alpha as Integral Components of theMammalian Circadian Clock. Science 2010, 327:463-466.
58. Bunning E: Die endonome Tagesrhythmik als Grundlage derphotoperiodischen Reaktion. Bericht Deutscher Botanischen Gesellschaft1936, 54:590-607.
59. Ikeno T, Tanaka SI, Numata H, Goto SG: Photoperiodic diapause under thecontrol of circadian clock genes in an insect. BMC Biology 2010, 8:116.
60. Tauber E, Zordan M, Sandrelli F, Pegoraro M, Osterwalder N, Breda C,Daga A, Selmin A, Monger K, Benna C, et al: Natural selection favors anewly derived timeless allele in Drosophila melanogaster. Science 2007,316:1895-1898.
61. Bradshaw WE, Holzapfel CM: Circadian clock genes, ovarian developmentand diapause. BMC Biology 2010, 8:115.
62. Garbe JC, Yang E, Fristrom JW: IMP-L2: an essential secretedimmunoglobulin family member implicated in neural and ectodermaldevelopment in Drosophila. Development 1993, 119:1237-1250.
63. Honegger B, Galic M, Köhler K, Wittwer F, Brogiolo W, Hafen E, Stocker H:Imp-L2, a putative homolog of vertebrate IGF-binding protein 7,counteracts insulin signaling in Drosophila and is essential for starvationresistance. Journal of Biology 2008, 7:10.
64. Tennessen J, Thummel C: Coordinating Growth and Maturation - Insightsfrom Drosophila. Current Biology 2011, 21:R750-R757.
65. Lin Y-J, Seroude L, Benzer S: Extended Life-Span and Stress Resistance inthe Drosophila Mutant methuselah. Science 1998, 282:943-946.
66. Schmidt PS, Duvernell DD, Eanes WF: Adaptive evolution of a candidategene for aging in Drosophila. Proceedings of the National Academy ofSciences of the United States of America 2000, 97:10861-10865.
67. Paaby AB, Schmidt PS: Functional Significance of Allelic Variation atmethuselah, an Aging Gene in Drosophila. PLoS ONE 2008, 3:e1987.
68. Fielenbach N, Antebi A: C. elegans dauer formation and the molecularbasis of plasticity. Genes & Development 2008, 22:2149-2165.
69. Homma T, Watanabe K, Tsurumaru S, Kataoka H, Imai K, Kamba M, Niimi T,Yamashita O, Yaginuma T: G protein-coupled receptor for diapausehormone, an inducer of Bombyx embryonic diapause. Biochemical andBiophysical Research Communications 2006, 344:386-393.
70. Kikuchi R, Kawahigashi H, Ando T, Tonooka T, Handa H: Molecular andFunctional Characterization of PEBP Genes in Barley Reveal theDiversification of Their Roles in Flowering. Plant Physiology 2009,149:1341-1353.
71. Gyllenstrand N, Clapham D, Källman T, Lagercrantz U: A Norway SpruceFLOWERING LOCUS T Homolog Is Implicated in Control of GrowthRhythm in Conifers. Plant Physiology 2007, 144:248-257.
72. Armbruster P, Hutchinson R: Pupal mass and wing length as indicators offecundity in Aedes albopictus and Aedes geniculatus (Diptera: Culicidae).Journal of Medical Entomology 2002, 699-704.
73. Armbruster P, Conn J: Geographic variation of larval growth in NorthAmerican Aedes albopictus (Diptera: Culicidae). Annals of theEntomological Society of America 2006, 1234-1243.
74. Clements AN: The Biology of Mosquitoes: Development, Nutrition andReproduction London, UK: Chapman and Hall; 1992.
75. Novak JN, Shroyer DA: Eggs of Aedes triseriatus and Aedes hendersoni: Amethod to simulate optimal hatch. Mosquito News 1978, 38:515-521.
76. Trpis M: A new bleaching and decalcifying method for general use inzoology. Canadian Journal of Zoology 1970, 48:892-893.
77. Hawley W, Pumpuni C, Brady R, Craig G: Overwintering survival of Aedesalbopictus (Diptera, Culicidae) eggs in Indiana. Journal of MedicalEntomology 1989, 26:122-129.
78. Huse SM, Huber JA, Morrison HG, Sogin ML, Welch DM: Accuracy andquality of massively parallel DNA pyrosequencing. Genome Biology 2007,8:R143.
79. Gomez-Alvarez V, Teal T, Schmidt T: Systematic artifacts in metagenomesfrom complex microbial communities. Isme Journal 2009, 1314-1317.
80. Dlugosch KM, Rieseberg LH: SnoWhite: A pipeline for aggressive cleaningof next-generation sequence reads [http://www.evopipes.net]..
81. Ning Z, Cox A, Mullikin J: SSAHA: A fast search method for large DNAdatabases. Genome Research 2001, 1725-1729.
82. Margulies M, Egholm M, Altman WE, Attiya S, Bader JS, Bemben LA, Berka J,Braverman MS, Chen YJ, Chen Z, et al: Genome sequencing inmicrofabricated high-density picolitre reactors. Nature 2005, 437:376-380.
Poelchau et al. BMC Genomics 2011, 12:619http://www.biomedcentral.com/1471-2164/12/619
Page 18 of 19

83. Vera J, Wheat C, Fescemyer H, Frilander M, Crawford D, Hanski I, Marden J:Rapid transcriptome characterization for a nonmodel organism using454 pyrosequencing. Molecular Ecology 2008, 1636-1647.
84. Marioni JC, Mason CE, Mane SM, Stephens M, Gilad Y: RNA-seq: Anassessment of technical reproducibility and comparison with geneexpression arrays. Genome Research 2008, 18:1509-1517.
85. Benjamini Y, Hochberg Y: Controlling the false discovery rate: a practicaland powerful approach to multiple testing. Journal of the Royal StatisticalSociety Series B (Methodological) 1995, 57:289-300.
86. Livak KJ, Schmittgen TD: Analysis of relative gene expression data usingreal-time quantitative PCR and the 2(-Delta Delta C(T)) Method. InMethods. Volume 25. United States: 2001 Elsevier Science (USA);2001:402-408.
doi:10.1186/1471-2164-12-619Cite this article as: Poelchau et al.: A de novo transcriptome of the Asiantiger mosquito, Aedes albopictus, to identify candidate transcripts fordiapause preparation. BMC Genomics 2011 12:619.
Submit your next manuscript to BioMed Centraland take full advantage of:
• Convenient online submission
• Thorough peer review
• No space constraints or color figure charges
• Immediate publication on acceptance
• Inclusion in PubMed, CAS, Scopus and Google Scholar
• Research which is freely available for redistribution
Submit your manuscript at www.biomedcentral.com/submit
Poelchau et al. BMC Genomics 2011, 12:619http://www.biomedcentral.com/1471-2164/12/619
Page 19 of 19