a cradle-to-gate life cycle assessment of ready-mixed ... lca pr… · a cradle-to-gate life cycle...
TRANSCRIPT

A Cradle-to-Gate Life Cycle Assessment of Ready-Mixed Concrete Manufacture
by NRMCA Members This project report and its results are used to support the development of an industry wide or sector average Environmental Product Declaration for the production of 48 concrete mix designs
Comissioner: National Ready Mixed Concrete
Association (NRMCA) EPD Program Operator: NSF International
Prepared by: Dr. Lindita Bushi, Grant Finlayson & Jamie Meil The Athena Sustainable Materials Institute
September 2014

Athena Sustainable Materials Institute
NRMCA Industry Wide LCA Project Report ii
Glossary of Terms
Based on ISO 14040/44:2006 – Terms and Definition Section [1].
Allocation: Partitioning the input or output flows of a process or a product system between the product system under study and one or more other product systems. Life Cycle: Consecutive and interlinked stages of a product system, from raw material acquisition or generation from natural resources to final disposal. Life Cycle Assessment (LCA): Compilation and evaluation of the inputs, outputs and the potential environmental impacts of a product system throughout its life cycle. Life Cycle Impact Assessment (LCIA): Phase of life cycle assessment aimed at understanding and evaluating the magnitude and significance of the potential environmental impacts for a product system throughout the life cycle of the product. Life Cycle Interpretation: Phase of life cycle assessment in which the findings of either the inventory analysis or the impact assessment, or both, are evaluated in relation to the defined goal and scope in order to reach conclusions and recommendations. Life Cycle Inventory (LCI): Phase of Life Cycle Assessment involving the compilation and quantification of inputs and outputs for a product throughout its life cycle. Product system: Collection of unit processes with elementary and product flows, performing one or more defined functions, and which models the life cycle of a product. System boundary: Set of criteria specifying which unit processes are part of a product system. Note: the term system boundary is not used in this International Standard in relation to LCIA. System expansion: Expanding the product system to include the additional functions related to the co-products, taking into account the requirements of 4.2.3.3. Based on ISO 14021:1999(E)- Clause 7.8 Recycled content
Pre-consumer material: Material diverted from the waste stream during a manufacturing process. Excluded is reutilization of materials such as rework, regrind or scrap generated in a process and capable of being reclaimed within the same process that generated it. Post-consumer material: Material generated by households or by commercial, industrial and institutional facilities in their role as end-users of the product that can no longer be used for its intended purpose. This includes returns of material from the distribution chain.
Athena Sustainable Materials Institute
NRMCA Industry Wide LCA Project Report iii
Based on ISO 14025:2006- Clause 3 Terms and definitions Type III Environmental Product Declaration (EPD): providing quantified environmental data using predetermined parameters and, where relevant, additional environmental information Note 1 the predetermined parameters are based on the ISO 14040 series of standards. Note 2 the additional environmental information may be quantitative or qualitative. Product Category Rules (PCR): set of specific rules, requirements and guidelines for developing Type III environmental declarations for one or more product categories. Based on ISO 21930:2007- Clause 3 Terms and definitions Building product: goods or services used during the life cycle of a building or other construction works. Declared unit: quantity of a building product for use as a reference unit in an EPD, based on LCA, for the expression of environmental information needed in information modules. Information module: compilation of data to be used as a basis for a type III environmental declaration, covering a unit process or a combination of unit processes that are part of the life cycle of a product. Reference service life: service life of a building product that is known or expected under a particular set, i.e., a reference set, of in-use conditions and that may form the basis of estimating the service life under other in-use conditions.

Athena Sustainable Materials Institute
NRMCA Industry Wide LCA Project Report iv
Table of Contents Glossary of Terms ................................................................................................................................. ii
Table of Contents .................................................................................................................................. iv
Acronyms and Abbreviations ............................................................................................................ v
1 General Study Aspects .................................................................................................................. 6
2 Study Goal ......................................................................................................................................... 7 2.1 Intended Applications .......................................................................................................................... 7
2.2 Intended Audience ................................................................................................................................. 7
2.3 Comparative Assertions ....................................................................................................................... 7
3 Study Scope ....................................................................................................................................... 8 3.1 Product Standard ................................................................................................................................... 8
3.2 System Boundary ................................................................................................................................... 8
3.3 Declared Unit ........................................................................................................................................... 9
3.4 Cutoff Criteria ...................................................................................................................................... 12
4 Life Cycle Inventory Analysis ................................................................................................... 12 4.1 Primary Data Sources ........................................................................................................................ 12
4.2 Secondary Data Sources .................................................................................................................... 14
4.3 Calculation Method ............................................................................................................................. 19
4.4 Allocation ............................................................................................................................................... 19
4.5 Data Quality ........................................................................................................................................... 20
5 Life Cycle Impact ........................................................................................................................... 22 5.1 Life Cycle Impact Assessment Results ......................................................................................... 24
6 Interpretation ................................................................................................................................ 31 6.1 Study Limitations ................................................................................................................................ 32
7 References ...................................................................................................................................... 32
Appendix A: Mix design specifications and raw material quantitites
Appendix B: NRMCA weighted average LCI data and technosphere flows per cubic yard
of product

Athena Sustainable Materials Institute
NRMCA Industry Wide LCA Project Report v
Acronyms and Abbreviations ACI American Concrete Institute Btu British thermal units C2G Cradle-to-Gate CED Cumulative Energy Demand CF Characterization Factor CFCs Chlorofluorocarbons CFC-11 Trichlorofluoromethane CLF Carbon Leadership Forum CO2 Carbon Dioxide EPDs Environmental Product Declarations eq Equivalent G2G Gate-to-Gate GWP Global Warming Potential HHV Higher Heating Value IC Impact Categories IPCC International Panel on Climate Change ISO International Organization for Standardization kg Kilogram kJ Kilojoules km Kilometer kWh kilowatt hours lbs pounds LCA Life Cycle Assessment LCI Life Cycle Inventory LCIA Life Cycle Impact Assessment MJ Mega joule m3 cubic meter N Nitrogen NRMCA National Ready Mixed Concrete Association NOx Nitrogen Oxides O3 Ozone PCR Product Category Rules PM2.5 Particulate Matter less than or equal to 2.5 micrometers in diameter PM10 Particulate Matter less than or equal to 10 micrometers in diameter RMC Ready-mixed concrete SO2 Sulfur dioxide TRACI Tool for the Reduction and Assessment of Chemical and Other Environmental Impacts US EPA United States Environmental Protection Agency VOCs Volatile Organic Compounds yd3 cubic yard

Athena Sustainable Materials Institute
NRMCA Industry Wide LCA Project Report 6
1 General Study Aspects
Commissioner of the LCA project report
and EPD
External LCA Practioner
Date/version September 29, 2014 version 1.0b
This study has been conducted in accordance with the requirements of the Carbon Leadership Forum (CLF) Product Category Rules (PCR) for ISO 14025 TYPE III Environmental Product Declarations (EPDs) for Concrete v1.1 (December 2013). Further this project report takes into consideration a clarification note issued by the CLF on April 10, 2014. This study was also conducted in accordance with ISO 14040:2006, 14044:2006, 21930:2007 This study also follows the Program Operator Instructions of the NSF International from August 20th, 20141.
This project report has been commissioned with the intent to support a sector or industry wide
Environmental Product Declaration (EPD) for ready-mixed concrete as produced by
participating National Ready Mixed Concrete Association (NRMCA) members in accordance
with ISO 14025 and the governing PCR.
This LCA project report was critically reviewed as per ISO 14040/44:2006 and the reference
PCR requirements by J. Renée Morin, PRé. The critical review report and responses to review
comments is available from the NRMCA upon request.
This life cycle assessment was independently verified in accordance with ISO 14044 and the reference PCR by:
Name and contact information for representative J. Renée Morin, PRé North America
202-460-0280
1 http://www.nsf.org/newsroom_pdf/NSF_Program_Operator_Instructions-news.pdf

Athena Sustainable Materials Institute
NRMCA Industry Wide LCA Project Report 7
2 Study Goal This is a sector-driven initiative by NRMCA and its members to develop an industry wide EPD according to ISO 14025:2006 and specifically, the Carbon Leadership Forum PCR for ISO 14025 TYPE III EPDs for Concrete v1.1. The goal of this study is to provide information to support the development of an EPD for 48 ready-mixed concrete product ranges covering a significant portion of NRMCA member production.
2.1 Intended Applications The EPD developed from this study is intended for use in Business to Business (B-to-B)
communication.
2.2 Intended Audience The intended audience for this LCA project report is NRMCA, its members and the verifier of the
subsequent EPD. The intended audience for the EPD, for which this LCA project report serves
as the reference document, include NRMCA member companies, their suppliers, architectural,
engineering, and specifying professionals, LCA practitioners and tool developers, academia,
governmental organizations, policy makers and other interested value chain parties who require
reliable information on a range of ready-mixed concrete products.
Note: For purposes of USGBC LEEDv4 rating system EPD compliance only NRMCA member
companies having participated in this industry average LCA and subsequent EPD may claim
compliance with the rating system EPD contribution requirements. A list of NRMCA members
and facilities participating in the development of this study is available from NRMCA and is
attached to the EPD.
2.3 Comparative Assertions This LCA project report does not include comparative assertions; however, it and the
subsequent EPD may lead to future comparative studies intended to be disclosed to the public.
LCAs and EPDs not covering all life cycle stages or based on a different PCR are examples of
studies and EPDs offering limited comparability.

Athena Sustainable Materials Institute
NRMCA Industry Wide LCA Project Report 8
3 Study Scope
3.1 Product Standard Products covered by this report satisfy general purpose concrete as used in residential,
commercial and public works applications in the US and Canada. This EPD project report
assesses the impacts for a range of ready-mixed concrete products in accordance with ASTM
C94: Standard Specification for Ready-Mixed Concrete, ACI 318, Buidling Code Requirements
for Structural Concrete, A23.1-09/A23.2-09 (R2014) - Concrete materials and methods of
concrete construction/Test methods and standard practices for concrete, UNSPSC Code
30111500 Ready Mix and ACI 211.1: Standard Practice for Selecting Proportions for Normal,
Heavyweight, and Mass Concrete.
3.2 System Boundary The system boundary for this study is limited to a cradle-to-gate focus. The following three life
cycle stages as per the governing PCR are included in the study scope (see Figure1):
A1- Raw material supply (upstream processes): extraction, handling, and processing of the
raw materials and intermediate component products as well as fuels used in the production of
concrete.
A2- Transportation: transportation of all input materials and fuels from the supplier to the gate
of the concrete plant.
A3- Manufacturing (core process): the energy used to store, move, batch and mix the concrete
and operate the concrete plant as well as the transportation and processing of wastes from
these core processes.
Note: a significant portion of N. American concrete plants are truck-mixing (sometimes called
transit mix) plants where the concrete mixing occurs within truck mixers after they are loaded
and at the project site; for these operations a portion of the delivery truck’s energy use that
would typically be captured under “Construction and Process Stage” A4-Transportation (to
site) is allocated to the mixing of concrete for truck-mixing plants and is captured in information
module A3. This system boundary refinement addresses the difference between truck-mixing
and central mix concrete plants where the latter plant type fully mixes the concrete in a
stationary plant mixer prior to loading the concrete delivery trucks. See the allocation section for
more details.
Except as noted above, all other life cycle stages as described in Figure 1 are excluded from the
LCA study and EPD (modules A4-A5 for central mix plants and the delivery portion of A4 for
truck-mixing plants, B1-7, and C1-4). In conformance with the PCR, the following life cycle
processes are excluded from the study:
Production, manufacturer and construction of buildings’ capital goods and infrastructure.

Athena Sustainable Materials Institute
NRMCA Industry Wide LCA Project Report 9
Production and manufacture of concrete production equipment, concrete delivery vehicles, earthmoving equipment, and laboratory equipment.
Personnel- related activities (travel, furniture, office supplies)
Energy and water use related to company management and sales activities, which may be located either within the factory site or at another location.
Water use in upstream manufacturing processes and in placement and curing of concrete. Better data and methodology is required to track and report these numbers.
Building Life Cycle Information Modules
Product stage
Construction
Process
stage
Use stage End‐of‐life stage
Raw
Material supply
Transport
Manufacturing
Transport
Construction/Installation
Use
Maintenance
Rep
air
Rep
lacemen
t
Refurbishmen
t
Operational Energy Use
Operational W
ater Use
De‐Construction/ Dem
olition
Transport
Waste processing
Disposal
A1 A2 A3 A4 A5 B1 B2 B3 B4 B5 B6 B7 C1 C2 C3 C4
Figure 1. Life cycle stage schematic – alpha-numeric designations as per CLF PCR (adapted from CEN 15978:2011)
3.3 Declared Unit The declared unit is 1 cubic meter and 1 cubic yard of ready mixed concrete. Environmental impacts are provided for 48 ready mixed concrete (RMC) products (mix designs). There are 100s if not 1,000s of possible RMC products (sometimes called mix designs, mixes, mixture compositions or mixtures), which ultimately balance the cost and performance of concrete for a wide variety of applications. For purposes of the NRMCA member industrywide LCA and EPD, a conservative approach was taken to arrive at a workable list of 48 RMC products that could pragmatically represent a high proportion of the RMC produced by NRMCA members identified in the EPD. The typical process for developing mix designs is 1) a design professional or purchaser of concrete states a specified compressive strength and other performance criteria for the concrete, and 2) the concrete producer develops a mix design, or proportions, to meet the specified compressive strength and other performance criteria using an accepted mixture proportioning methodology such as the ACI recommended practice 211.1, the
Athena Sustainable Materials Institute
NRMCA Industry Wide LCA Project Report 10
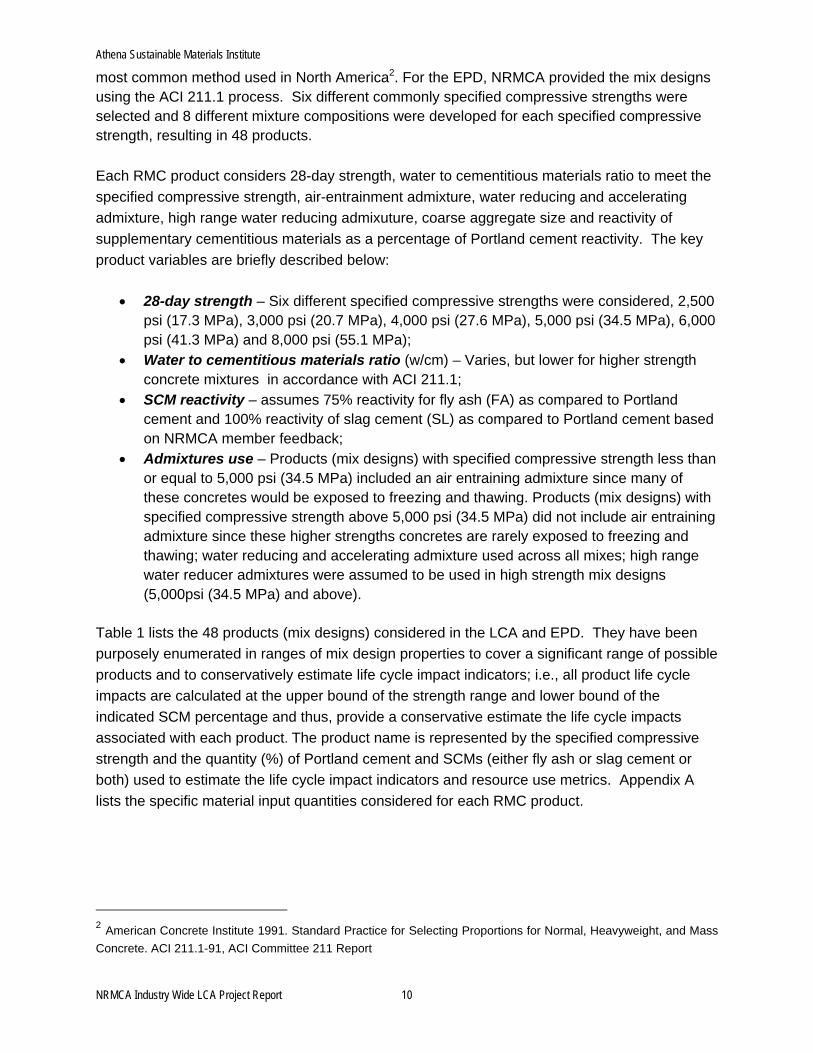
most common method used in North America2. For the EPD, NRMCA provided the mix designs using the ACI 211.1 process. Six different commonly specified compressive strengths were selected and 8 different mixture compositions were developed for each specified compressive strength, resulting in 48 products.
Each RMC product considers 28-day strength, water to cementitious materials ratio to meet the
specified compressive strength, air-entrainment admixture, water reducing and accelerating
admixture, high range water reducing admixuture, coarse aggregate size and reactivity of
supplementary cementitious materials as a percentage of Portland cement reactivity. The key
product variables are briefly described below:
28-day strength – Six different specified compressive strengths were considered, 2,500 psi (17.3 MPa), 3,000 psi (20.7 MPa), 4,000 psi (27.6 MPa), 5,000 psi (34.5 MPa), 6,000 psi (41.3 MPa) and 8,000 psi (55.1 MPa);
Water to cementitious materials ratio (w/cm) – Varies, but lower for higher strength concrete mixtures in accordance with ACI 211.1;
SCM reactivity – assumes 75% reactivity for fly ash (FA) as compared to Portland cement and 100% reactivity of slag cement (SL) as compared to Portland cement based on NRMCA member feedback;
Admixtures use – Products (mix designs) with specified compressive strength less than or equal to 5,000 psi (34.5 MPa) included an air entraining admixture since many of these concretes would be exposed to freezing and thawing. Products (mix designs) with specified compressive strength above 5,000 psi (34.5 MPa) did not include air entraining admixture since these higher strengths concretes are rarely exposed to freezing and thawing; water reducing and accelerating admixture used across all mixes; high range water reducer admixtures were assumed to be used in high strength mix designs (5,000psi (34.5 MPa) and above).
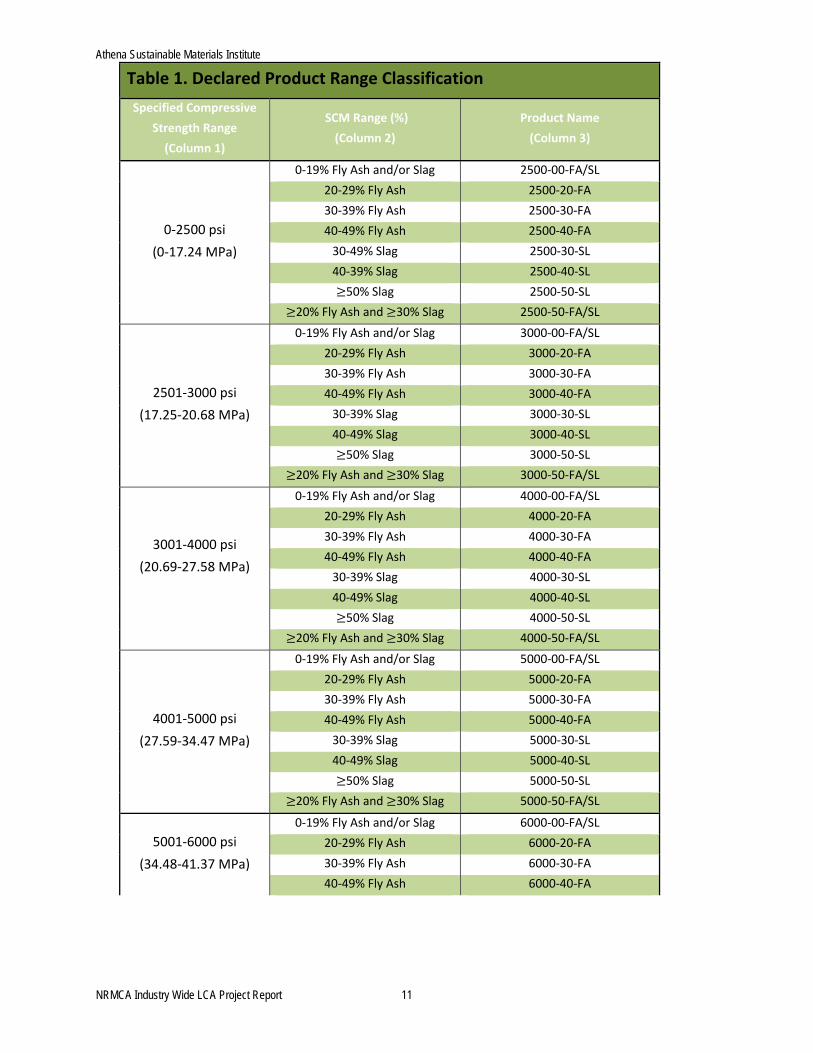
Table 1 lists the 48 products (mix designs) considered in the LCA and EPD. They have been
purposely enumerated in ranges of mix design properties to cover a significant range of possible
products and to conservatively estimate life cycle impact indicators; i.e., all product life cycle
impacts are calculated at the upper bound of the strength range and lower bound of the
indicated SCM percentage and thus, provide a conservative estimate the life cycle impacts
associated with each product. The product name is represented by the specified compressive
strength and the quantity (%) of Portland cement and SCMs (either fly ash or slag cement or
both) used to estimate the life cycle impact indicators and resource use metrics. Appendix A
lists the specific material input quantities considered for each RMC product.
2 American Concrete Institute 1991. Standard Practice for Selecting Proportions for Normal, Heavyweight, and Mass
Concrete. ACI 211.1-91, ACI Committee 211 Report
Athena Sustainable Materials Institute
NRMCA Industry Wide LCA Project Report 11
Table 1. Declared Product Range Classification
Specified Compressive
Strength Range
(Column 1)
SCM Range (%)
(Column 2)
Product Name
(Column 3)
0‐2500 psi
(0‐17.24 MPa)
0‐19% Fly Ash and/or Slag 2500‐00‐FA/SL
20‐29% Fly Ash 2500‐20‐FA
30‐39% Fly Ash 2500‐30‐FA
40‐49% Fly Ash 2500‐40‐FA
30‐49% Slag 2500‐30‐SL
40‐39% Slag 2500‐40‐SL
50% Slag 2500‐50‐SL
20% Fly Ash and 30% Slag 2500‐50‐FA/SL
2501‐3000 psi
(17.25‐20.68 MPa)
0‐19% Fly Ash and/or Slag 3000‐00‐FA/SL
20‐29% Fly Ash 3000‐20‐FA
30‐39% Fly Ash 3000‐30‐FA
40‐49% Fly Ash 3000‐40‐FA
30‐39% Slag 3000‐30‐SL
40‐49% Slag 3000‐40‐SL
50% Slag 3000‐50‐SL
20% Fly Ash and 30% Slag 3000‐50‐FA/SL
3001‐4000 psi
(20.69‐27.58 MPa)
0‐19% Fly Ash and/or Slag 4000‐00‐FA/SL
20‐29% Fly Ash 4000‐20‐FA
30‐39% Fly Ash 4000‐30‐FA
40‐49% Fly Ash 4000‐40‐FA
30‐39% Slag 4000‐30‐SL
40‐49% Slag 4000‐40‐SL
50% Slag 4000‐50‐SL
20% Fly Ash and 30% Slag 4000‐50‐FA/SL
4001‐5000 psi
(27.59‐34.47 MPa)
0‐19% Fly Ash and/or Slag 5000‐00‐FA/SL
20‐29% Fly Ash 5000‐20‐FA
30‐39% Fly Ash 5000‐30‐FA
40‐49% Fly Ash 5000‐40‐FA
30‐39% Slag 5000‐30‐SL
40‐49% Slag 5000‐40‐SL
50% Slag 5000‐50‐SL
20% Fly Ash and 30% Slag 5000‐50‐FA/SL
5001‐6000 psi
(34.48‐41.37 MPa)
0‐19% Fly Ash and/or Slag 6000‐00‐FA/SL
20‐29% Fly Ash 6000‐20‐FA
30‐39% Fly Ash 6000‐30‐FA
40‐49% Fly Ash 6000‐40‐FA
Athena Sustainable Materials Institute
NRMCA Industry Wide LCA Project Report 12
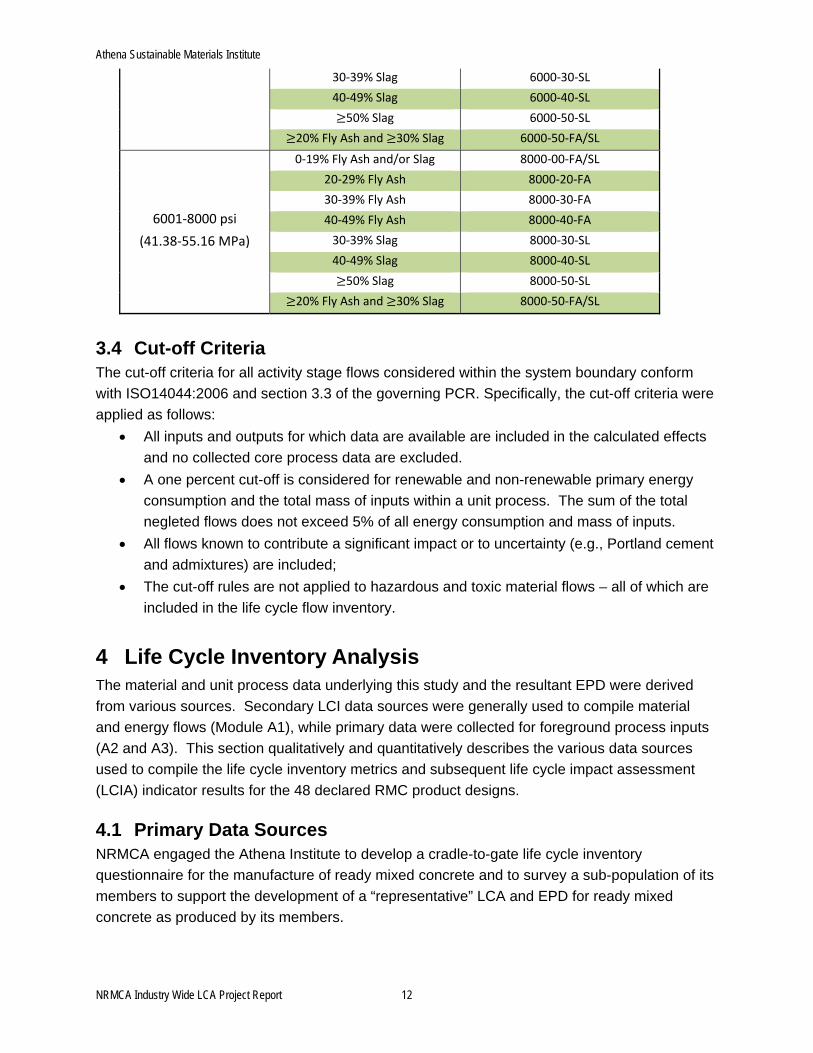
3.4 Cut-off Criteria The cut-off criteria for all activity stage flows considered within the system boundary conform
with ISO14044:2006 and section 3.3 of the governing PCR. Specifically, the cut-off criteria were
applied as follows:
All inputs and outputs for which data are available are included in the calculated effects
and no collected core process data are excluded.
A one percent cut-off is considered for renewable and non-renewable primary energy
consumption and the total mass of inputs within a unit process. The sum of the total
negleted flows does not exceed 5% of all energy consumption and mass of inputs.
All flows known to contribute a significant impact or to uncertainty (e.g., Portland cement
and admixtures) are included;
The cut-off rules are not applied to hazardous and toxic material flows – all of which are
included in the life cycle flow inventory.
4 Life Cycle Inventory Analysis The material and unit process data underlying this study and the resultant EPD were derived
from various sources. Secondary LCI data sources were generally used to compile material
and energy flows (Module A1), while primary data were collected for foreground process inputs
(A2 and A3). This section qualitatively and quantitatively describes the various data sources
used to compile the life cycle inventory metrics and subsequent life cycle impact assessment
(LCIA) indicator results for the 48 declared RMC product designs.
4.1 Primary Data Sources NRMCA engaged the Athena Institute to develop a cradle-to-gate life cycle inventory
questionnaire for the manufacture of ready mixed concrete and to survey a sub-population of its
members to support the development of a “representative” LCA and EPD for ready mixed
concrete as produced by its members.
30‐39% Slag 6000‐30‐SL
40‐49% Slag 6000‐40‐SL
50% Slag 6000‐50‐SL
20% Fly Ash and 30% Slag 6000‐50‐FA/SL
6001‐8000 psi
(41.38‐55.16 MPa)
0‐19% Fly Ash and/or Slag 8000‐00‐FA/SL
20‐29% Fly Ash 8000‐20‐FA
30‐39% Fly Ash 8000‐30‐FA
40‐49% Fly Ash 8000‐40‐FA
30‐39% Slag 8000‐30‐SL
40‐49% Slag 8000‐40‐SL
50% Slag 8000‐50‐SL
20% Fly Ash and 30% Slag 8000‐50‐FA/SL
Athena Sustainable Materials Institute
NRMCA Industry Wide LCA Project Report 13
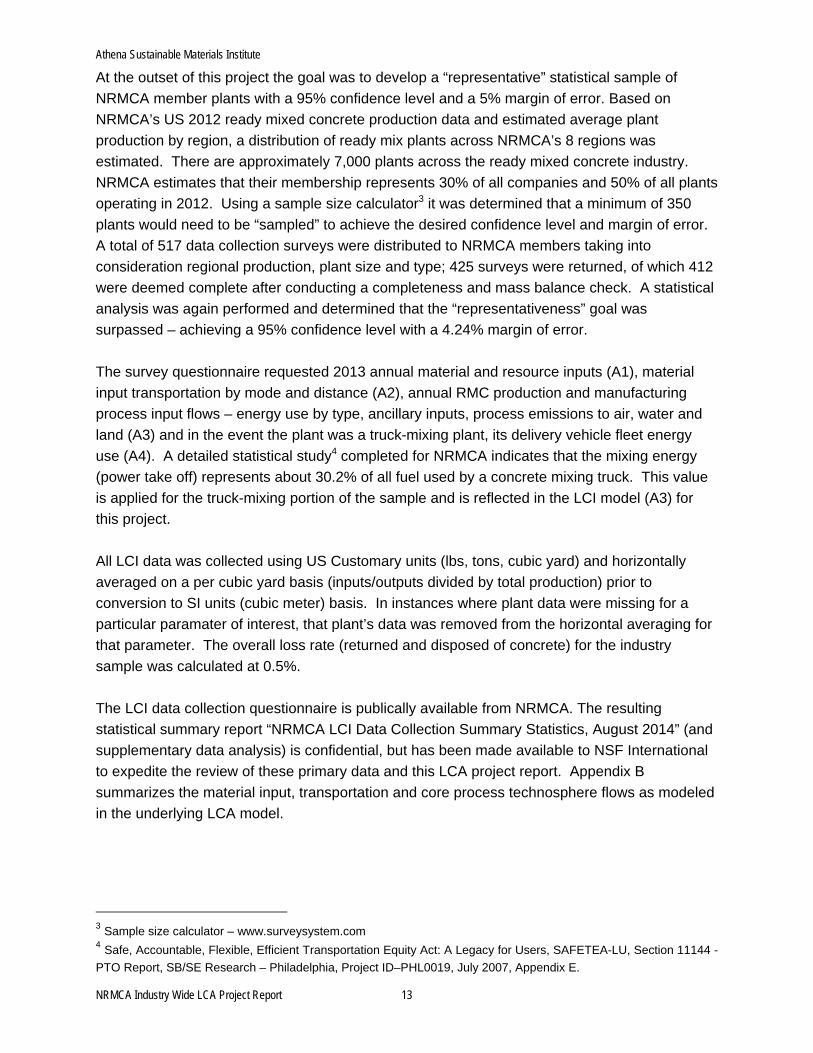
At the outset of this project the goal was to develop a “representative” statistical sample of
NRMCA member plants with a 95% confidence level and a 5% margin of error. Based on
NRMCA’s US 2012 ready mixed concrete production data and estimated average plant
production by region, a distribution of ready mix plants across NRMCA’s 8 regions was
estimated. There are approximately 7,000 plants across the ready mixed concrete industry.
NRMCA estimates that their membership represents 30% of all companies and 50% of all plants
operating in 2012. Using a sample size calculator3 it was determined that a minimum of 350
plants would need to be “sampled” to achieve the desired confidence level and margin of error.
A total of 517 data collection surveys were distributed to NRMCA members taking into
consideration regional production, plant size and type; 425 surveys were returned, of which 412
were deemed complete after conducting a completeness and mass balance check. A statistical
analysis was again performed and determined that the “representativeness” goal was
surpassed – achieving a 95% confidence level with a 4.24% margin of error.
The survey questionnaire requested 2013 annual material and resource inputs (A1), material
input transportation by mode and distance (A2), annual RMC production and manufacturing
process input flows – energy use by type, ancillary inputs, process emissions to air, water and
land (A3) and in the event the plant was a truck-mixing plant, its delivery vehicle fleet energy
use (A4). A detailed statistical study4 completed for NRMCA indicates that the mixing energy
(power take off) represents about 30.2% of all fuel used by a concrete mixing truck. This value
is applied for the truck-mixing portion of the sample and is reflected in the LCI model (A3) for
this project.
All LCI data was collected using US Customary units (lbs, tons, cubic yard) and horizontally
averaged on a per cubic yard basis (inputs/outputs divided by total production) prior to
conversion to SI units (cubic meter) basis. In instances where plant data were missing for a
particular paramater of interest, that plant’s data was removed from the horizontal averaging for
that parameter. The overall loss rate (returned and disposed of concrete) for the industry
sample was calculated at 0.5%.
The LCI data collection questionnaire is publically available from NRMCA. The resulting
statistical summary report “NRMCA LCI Data Collection Summary Statistics, August 2014” (and
supplementary data analysis) is confidential, but has been made available to NSF International
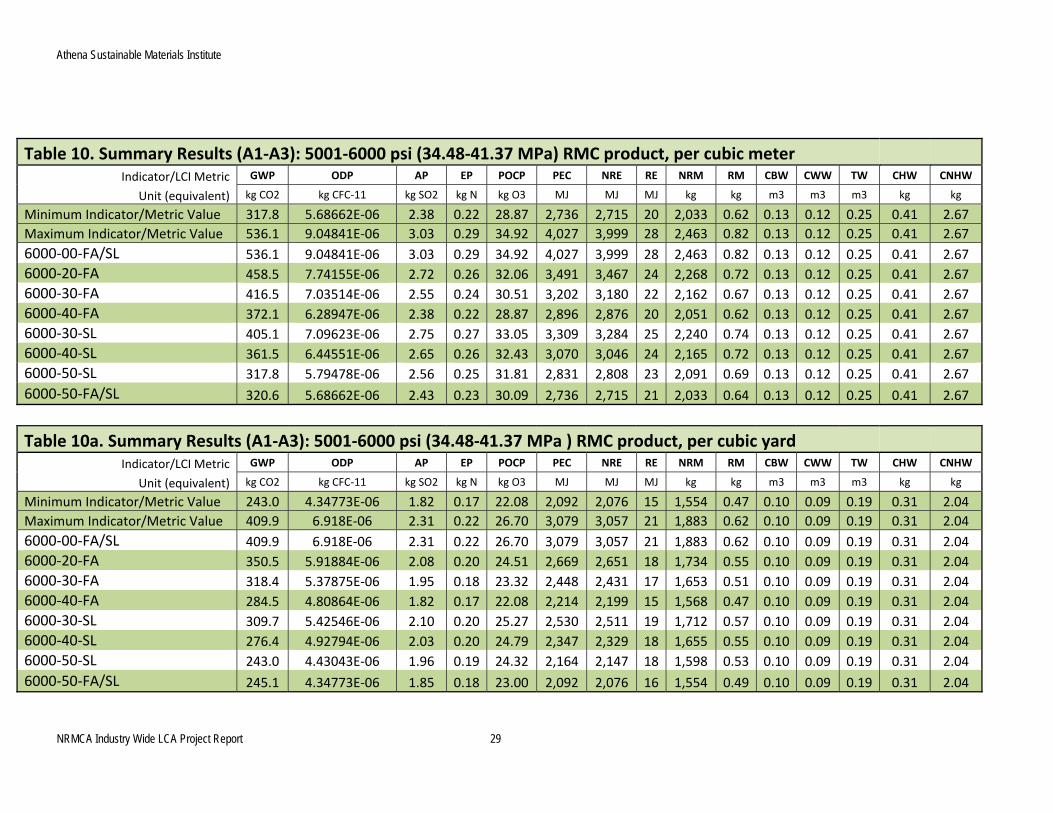
to expedite the review of these primary data and this LCA project report. Appendix B
summarizes the material input, transportation and core process technosphere flows as modeled
in the underlying LCA model.
3 Sample size calculator – www.surveysystem.com 4 Safe, Accountable, Flexible, Efficient Transportation Equity Act: A Legacy for Users, SAFETEA-LU, Section 11144 -
PTO Report, SB/SE Research – Philadelphia, Project ID–PHL0019, July 2007, Appendix E.
Athena Sustainable Materials Institute
NRMCA Industry Wide LCA Project Report 14
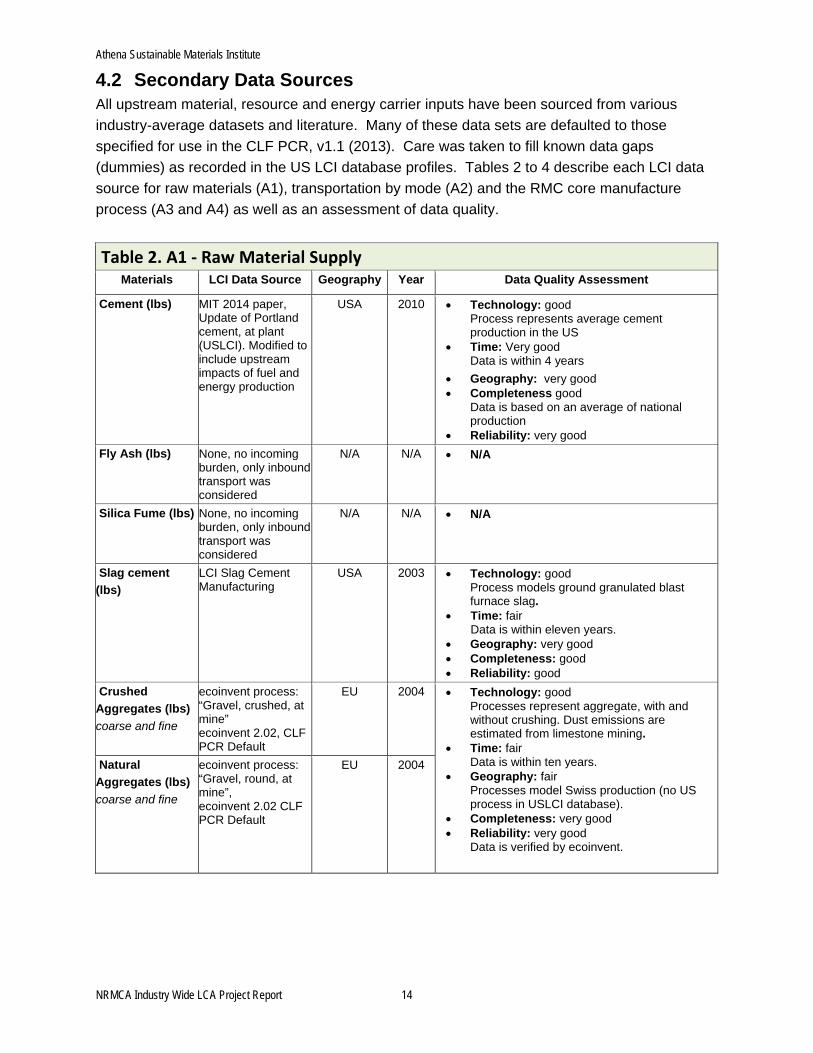
4.2 Secondary Data Sources All upstream material, resource and energy carrier inputs have been sourced from various
industry-average datasets and literature. Many of these data sets are defaulted to those
specified for use in the CLF PCR, v1.1 (2013). Care was taken to fill known data gaps
(dummies) as recorded in the US LCI database profiles. Tables 2 to 4 describe each LCI data
source for raw materials (A1), transportation by mode (A2) and the RMC core manufacture
process (A3 and A4) as well as an assessment of data quality.
Table 2. A1 ‐ Raw Material Supply Materials LCI Data Source Geography Year Data Quality Assessment
Cement (lbs) MIT 2014 paper, Update of Portland cement, at plant (USLCI). Modified to include upstream impacts of fuel and energy production
USA 2010 Technology: good Process represents average cement
production in the US Time: Very good Data is within 4 years
Geography: very good Completeness good Data is based on an average of national
production Reliability: very good
Fly Ash (lbs) None, no incoming burden, only inbound transport was considered
N/A N/A N/A
Silica Fume (lbs) None, no incoming burden, only inbound transport was considered
N/A N/A N/A
Slag cement
(lbs)
LCI Slag Cement Manufacturing
USA 2003 Technology: good Process models ground granulated blast furnace slag.
Time: fair Data is within eleven years.
Geography: very good Completeness: good Reliability: good
Crushed
Aggregates (lbs)
coarse and fine
ecoinvent process: “Gravel, crushed, at mine” ecoinvent 2.02, CLF PCR Default
EU 2004 Technology: good Processes represent aggregate, with and without crushing. Dust emissions are estimated from limestone mining.
Time: fair Data is within ten years.
Geography: fair Processes model Swiss production (no US process in USLCI database).
Completeness: very good Reliability: very good
Data is verified by ecoinvent.
Natural
Aggregates (lbs)
coarse and fine
ecoinvent process: “Gravel, round, at mine”, ecoinvent 2.02 CLF PCR Default
EU 2004

Athena Sustainable Materials Institute
NRMCA Industry Wide LCA Project Report 15
Table 2. A1 ‐ Raw Material Supply Materials LCI Data Source Geography Year Data Quality Assessment
Admixtures (lbs)
Accelerator
Air Entrainer
Retarding
Waterproofing
Plasticizer
Superplasticizer
EFCA EcoProfiles
(300, 301, 302, 303,
324 and 325)
http://www.efca.info/
publications.html
EU 2005 -
2006 Technology: very good Processes represents admixture production
for use in concrete Time: fair Data is within ten years
Geography: fair Completeness: good Data from a federation of European admixture
producers Reliability: good
Profiles have undergone an independent review process. Compliance with ISO standards (unknown)
Concrete Batch
and Wash Water
(gallons)
Primary
USA 2013 Technology: very good Data represents fresh batch water, recycled wash water used as batch water and wash water inputs
Time: very good Data is within two years
Geography: very good Completeness: very good Primary data from core processes survey
Reliability: very good Data based on specified use
Crushed Returned Concrete (lbs)
Primary (Pre-consumer, burden of crushing is reported and included in module A3)
USA 2013 Technology: very good Primary data collected via industry survey
Time: very good Data is within two years
Geography: very good Completeness: very good Primary data from core processes survey
Reliability: very good Data based on specified use
Crushed Demolition Concrete (lbs)
LCI Slag Cement Manufacturing (crushing data used as proxy)
USA 2003 Technology: good Process models crushing of blast furnace slag.
Time: fair Data is within eleven years.
Geography: very good Completeness: fair Reliability: fair
Road Dust Control Chemicals (lbs)
ecoinvent 3.01, Calcium chloride used to control dust on gravel roadways CaCl2, 35‐38 wt. percent calcium chloride solution to the roadway
Europe 2008 Technology: good Process models the manufacture of dust control chemical.
Time: good Data is within two years.
Geography: fair Processes model Swiss production
Completeness: very good Reliability: very good
Data is verified by ecoinvent.

Athena Sustainable Materials Institute
NRMCA Industry Wide LCA Project Report 16
Table 2. A1 ‐ Raw Material Supply Materials LCI Data Source Geography Year Data Quality Assessment
Oil, Lubricants and Greases (lbs)
ecoinvent 3.01, Lubricating oil {US}| production | Alloc Def, U
US 2008 Technology: good Process models the manufacture of lubricants
Time: good Data is within two years.
Geography: good Processes model US production
Completeness: very good Reliability: very good
Data is verified by ecoinvent.
Cleaning Chemicals (lbs)
ecoinvent 3.01, 50% "RustAway" modeled as 0.844 lb/gal of "Phosphoric acid, industrial grade, without water, in 85% solution state {GLO}| market for | Alloc Def, U" and ecoinvent 3.01, 50% "FoamAway" modeled as 0.4 lb/gal of "Citric acid {GLO}| market for | Alloc Def, U
Global 2008 Technology: good Processes model the manufacture of primary cleaning active ingredients
Time: good Data is within two years.
Geography: fair Global process model
Completeness: very good Reliability: very good
Data is verified by ecoinvent.
Table 3. A2 ‐ Transportation Process LCI Data Source Geography Year Data Quality Assessment
Truck, rail, ocean
freighter and
barge (lbs*miles)
USLCI – single unit truck transport, diesel powered; rail transport, diesel powered; ocean freighter, average fuel mix; barge, average fuel mix
USA 2008 Technology: very good Processes represents U.S average
transportation profiles
Time: fair Data is within ten years
Geography: fair Completeness: good (all data place
holders filled) Data is representative of US conditions
Reliability: good Data is from USLCI database

Athena Sustainable Materials Institute
NRMCA Industry Wide LCA Project Report 17
Table 4. A3 ‐ Manufacturing Process LCI Data Source Geography Year Data Quality Assessment
Electricity
(kWh)
NRMCA purchased electricity grid mix- Electricity, medium voltage, at grid, US (ecoinvent v3.01)
US 2008 Technology: very good Process represents production of
electricity in the appropriate NERC regions. An average NRMCA electricity grid was developed based on total purchased electricity by surveyed plants weighted by RMC production in various NERC regions. (See % contribution by NERC grid region below)
Time: fair Data is within ten years
Geography: very good Completeness: good Data is representative of US production
Reliability: good ecoinvent has verified the data
Natural Gas
(cu.ft.)
USLCI US 2008 Technology: very good Process represents combustion of natural
gas in an industrial boiler.
Time: fair Data is within ten years
Geography: fair Completeness: good Data is representative of US conditions
Reliability: good Data is from USLCI database
Fuel Oil
(other than
diesel),
(gallon)
USLCI US 2008 Technology: very good Process represents combustion of RFO in
an industrial boiler.
Time: fair Data is within ten years
Geography: fair Completeness: good Data is representative of US conditions
Reliability: good Data is from USLCI database
Diesel
(gallon)
US LCI US 2008 Technology: very good Process represents combustion of diesel
in industrial equipment.
Time: fair Data is within ten years
Geography: fair Completeness: good Data is representative of US conditions
Reliability: good Data is from USLCI database

Athena Sustainable Materials Institute
NRMCA Industry Wide LCA Project Report 18
Table 4. A3 ‐ Manufacturing Process LCI Data Source Geography Year Data Quality Assessment
Gasoline
(gallon)
US LCI US 2008 Technology: very good Process represents combustion of
gasoline in equipment.
Time: fair Data is within ten years
Geography: fair Completeness: good Data is representative of US conditions
Reliability: good Data is from USLCI database
Liquefied
Propane Gas
(gallon)
US LCI US 2008 Technology: very good Process represents combustion of LPG in
industrial boiler.
Time: fair Data is within ten years
Geography: fair Completeness: good Data is representative of US conditions
Reliability: good Data is from USLCI database
Secondary Fuels,
Liquid (waste
solvents, etc.),
(lbs)
Ecoinvent 3.01
EU 2008 Technology: good combustion emissions only
Time: fair Data is within ten years.
Geography: fair Processes model Swiss production (no US process in USLCI database).
Completeness: very good Reliability: very good
Data is verified by Ecoinvent.
Secondary Fuels,
Solid (tires, etc.),
(ton-short)
Ecoinvent 3.01
EU 2008 Technology: good combustion emissions only
Time: fair Data is within ten years.
Geography: fair Processes model Swiss production (no US process in USLCI database).
Completeness: very good Reliability: very good
Data is verified by Ecoinvent.
Hazardous Solid
Waste,
(lbs)
Ecoinvent 3.01
Adjusted for US
electricity grid
EU 2008 Technology: good Time: fair
Data is within ten years. Geography: fair
Processes model Swiss production (no US process in USLCI database).
Completeness: very good Reliability: very good
Data is verified by Ecoinvent.
Athena Sustainable Materials Institute
NRMCA Industry Wide LCA Project Report 19
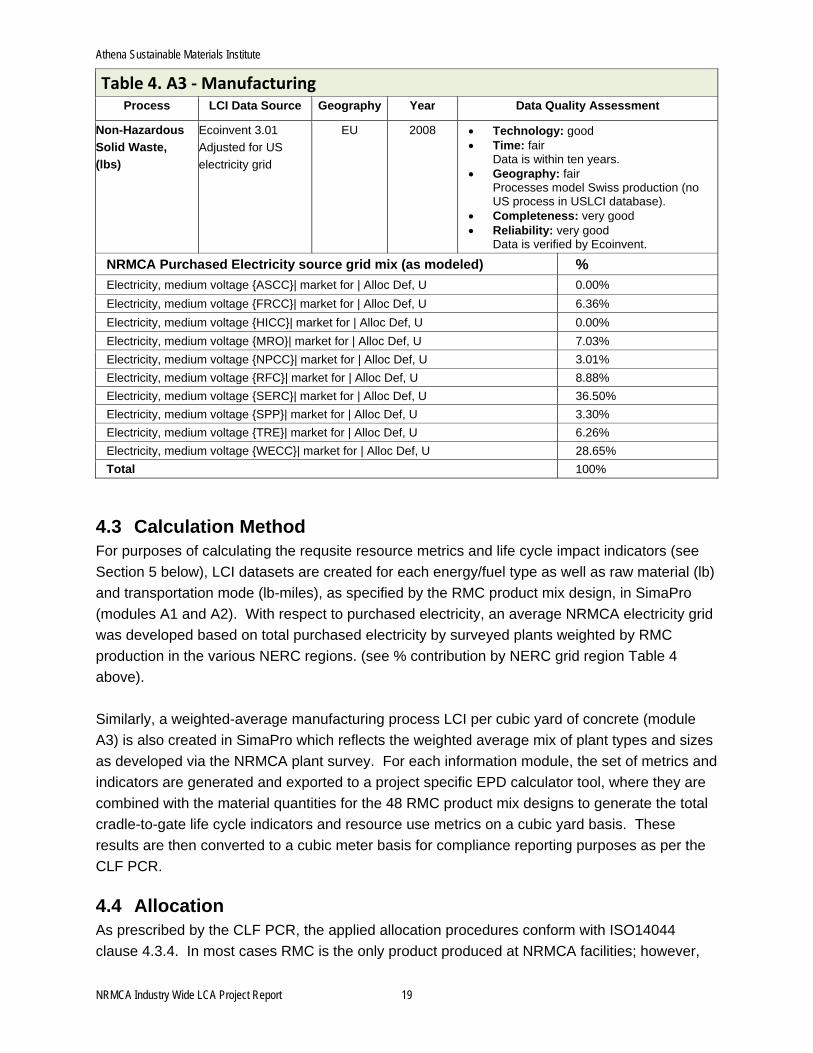
Table 4. A3 ‐ Manufacturing Process LCI Data Source Geography Year Data Quality Assessment
Non-Hazardous
Solid Waste,
(lbs)
Ecoinvent 3.01
Adjusted for US
electricity grid
EU 2008 Technology: good Time: fair
Data is within ten years. Geography: fair
Processes model Swiss production (no US process in USLCI database).
Completeness: very good Reliability: very good
Data is verified by Ecoinvent.
NRMCA Purchased Electricity source grid mix (as modeled) %
Electricity, medium voltage {ASCC}| market for | Alloc Def, U 0.00%
Electricity, medium voltage {FRCC}| market for | Alloc Def, U 6.36%
Electricity, medium voltage {HICC}| market for | Alloc Def, U 0.00%
Electricity, medium voltage {MRO}| market for | Alloc Def, U 7.03%
Electricity, medium voltage {NPCC}| market for | Alloc Def, U 3.01%
Electricity, medium voltage {RFC}| market for | Alloc Def, U 8.88%
Electricity, medium voltage {SERC}| market for | Alloc Def, U 36.50%
Electricity, medium voltage {SPP}| market for | Alloc Def, U 3.30%
Electricity, medium voltage {TRE}| market for | Alloc Def, U 6.26%
Electricity, medium voltage {WECC}| market for | Alloc Def, U 28.65%
Total 100%
4.3 Calculation Method For purposes of calculating the requsite resource metrics and life cycle impact indicators (see
Section 5 below), LCI datasets are created for each energy/fuel type as well as raw material (lb)
and transportation mode (lb-miles), as specified by the RMC product mix design, in SimaPro
(modules A1 and A2). With respect to purchased electricity, an average NRMCA electricity grid
was developed based on total purchased electricity by surveyed plants weighted by RMC
production in the various NERC regions. (see % contribution by NERC grid region Table 4
above).
Similarly, a weighted-average manufacturing process LCI per cubic yard of concrete (module
A3) is also created in SimaPro which reflects the weighted average mix of plant types and sizes
as developed via the NRMCA plant survey. For each information module, the set of metrics and
indicators are generated and exported to a project specific EPD calculator tool, where they are
combined with the material quantities for the 48 RMC product mix designs to generate the total
cradle-to-gate life cycle indicators and resource use metrics on a cubic yard basis. These
results are then converted to a cubic meter basis for compliance reporting purposes as per the
CLF PCR.
4.4 Allocation As prescribed by the CLF PCR, the applied allocation procedures conform with ISO14044
clause 4.3.4. In most cases RMC is the only product produced at NRMCA facilities; however,

Athena Sustainable Materials Institute
NRMCA Industry Wide LCA Project Report 20
for instances where co-products were encountered LCI flows were allocated on a mass basis
across the RMC and the co-product of concern. For truck-mixing plants a portion (30.2%) of the
reported fleet energy use was allocated to the mixing facility based on a previous power take-off
study conducted on behalf of the NRMCA (see section 4.1 above).
4.5 Data Quality Data quality requirements, as specified in the CLF PCR: 2013, sections 3.5 and 3.6, are applied
and reported in Tables 2 to 4. This section also describes the achieved data quality relative to
the ISO 14044:2006 requirements. This LCA and resulting EPD was created using industry
average data for upstream materials. Data variation can result from differences in supplier
locations, manufacturing processes, manufacturing efficiency and fuel types used. Data quality
is judged on the basis of its representativeness (technological, temporal, and geographical),
completeness (e.g., unreported emissions), consistency and reliability.
All LCI data (Tables 2 to 4) are assessed on the basis of the five data quality indicators listed
below. Each indicator is interpreted with respect to its context and key determining data
parameters are discussed to provide clarity as to how the overall quality of each indicator is
assessed and stated.
Technical representativeness: The degree to which the data reflects the actual technology(ies) used. Core manufacturing process technology is derived from very recent annual data covering a large number of plant sizes and types. These data are deemed to be reflective of typical or average technologies used within the US and Canada in the production of ready-mixed concrete. Some background material and process data iare European but deemed to be similar to technologies used in the US and Canada and are often cited as preferred “default data” in the governing CLF PCR.
Overall quality - Good to very good
Temporal representativeness: The degree to which the data reflects the actual time (e.g. year) or age of the activity. Core manufacturing process data is very recent (2013). Noted upstream material data exception is the slag cement LCI profile which is 11 years old. All other LCI data sources are less than 10 years old.
Overall quality - Fair to very good
Geographical representativeness: The degree to which the data reflects the actual geographic location of the activity (e.g. country or site). Geographical coverage of core manufacturing processes is specific to the US and Canada. All energy profiles reflect US and Canadian conditions. Some material (aggregates and admixtures) and process data are based on European sources. These data have been previously verified or listed in the governing PCR for defaul use.
Overall quality - Fair to very good
Completeness: The degree to which the data are statistically representative of the relevant activity. Completeness includes the percentage of locations for which data is available and used out of the total number that relate to a specific activity. Core manufacturing processes are very complete and were derived from a statistical sample with a 95% confidence interval and less than 5% error. These data reflect annual operations inclusive of seasonal and other normal annual fluctuations in operations. All relevant, specific processes, including inputs (raw materials, energy and ancillary

Athena Sustainable Materials Institute
NRMCA Industry Wide LCA Project Report 21
materials) and outputs (emissions and production volume) were considered and modeled to represent the specified and declared RMC products. The relevant background materials and processes were taken from the US LCI Database (adjusted for known data placeholders); US system boundary adjusted ecoinvent v 2.2 and v3.0 LCI databases and modeled in SimaPro software v.8.0.1, 2014. Efforts were made to ensure that all data used was as complete as reasonably possible.
Overall quality - Good to very good
Reliability: The degree to which the sources, data collection methods and verification procedures used to obtain the data are dependable. For core manufacturing processes the reliability of the information and data is deemed to be very good as these were derived from a large, statistically significant, survey of ready-mixed concrete producers and subsequently reviewed by the NRMCA for plausability. Similarly, the LCI data for Portland cement, at plant, reflects an update to the older PCR default database whereby missing upstream impacts associated with fuel and energy production have been filled. All missing process data (dummies) associated with the US LCI data have been consistently filled. All other LCI data have been incorporated in accordance with the default PCR requirements or derived from ecoinvent databases, which have been verified by ecoinvent.
Overall quality - Fair to very good
Furthermore, the data quality is evaluated on the basis the precision, consistency and reproducibility. Precision: The NRMCA participating member companies through measurement and calculation collected primary data on their annual production of RMC products. For accuracy the LCA team validated these plant gate-to-gate input and output data. A statistical analysis was completed and documented in a separate report – see Primary Data Sources section. Consistency: To ensure consistency, the LCI modeling of the production weighted input and output LCI data for the declared products used the same modeling structure across the respective product systems, which consisted of input raw and ancillary material, energy flows, water resource inputs, product and co-products outputs, returned and recovered concrete materials, emissions to air, water and soil, and waste recycling and treatment. The same background LCI datasets from the NRMCA SimaPro LCI database were used across all RMC product systems LCI modeling. Crosschecks concerning the plausibility of mass and energy flows were continuously conducted. The LCA team conducted mass and energy balances at the plant and selected process level to maintain a high level of consistency. Reproducibility: Internal reproducibility is possible since the data and the models are stored
and available in a database (NRMCA SimaPro LCI database, 2014). A considerable level of
transparency is provided throughout the report as the specifications and material quantity make-
up for the declared RMC products are presented and key primary and secondary LCI data
sources are summarized in Tables 2, 3 and 4. The provision of more detailed data to allow full
external reproducibility was not possible due to reasons of confidentiality.
Athena Sustainable Materials Institute
NRMCA Industry Wide LCA Project Report 22
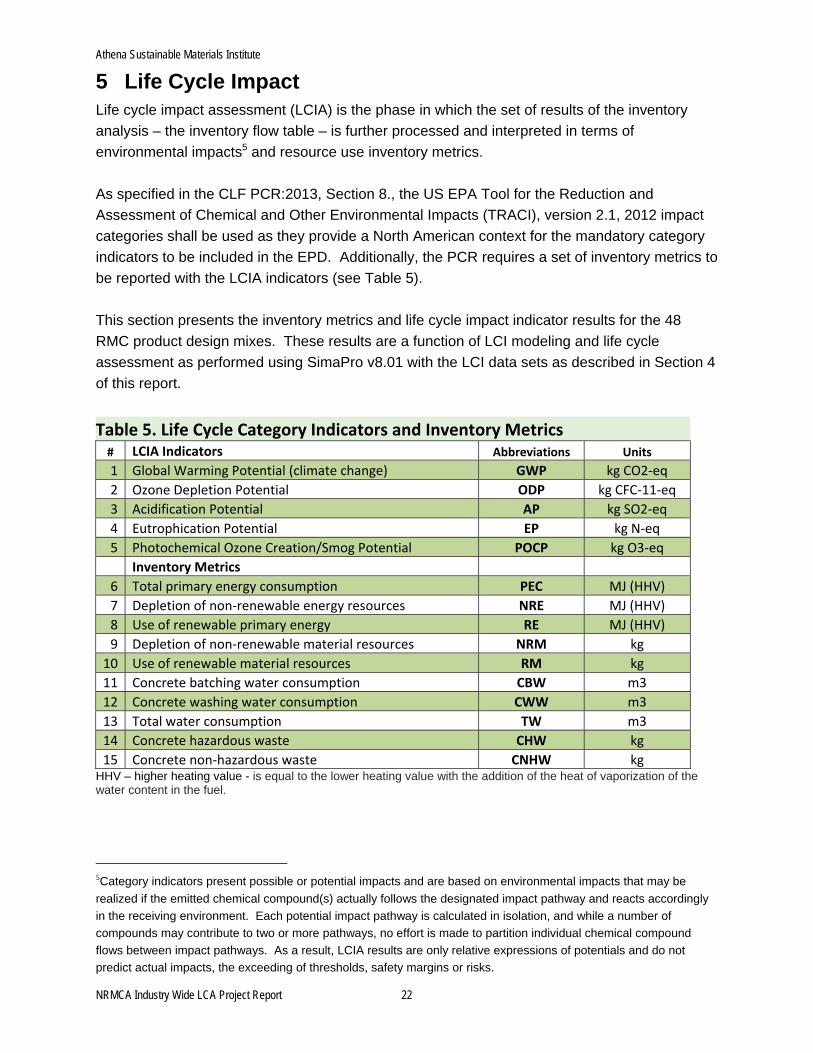
5 Life Cycle Impact Life cycle impact assessment (LCIA) is the phase in which the set of results of the inventory
analysis – the inventory flow table – is further processed and interpreted in terms of
environmental impacts5 and resource use inventory metrics.
As specified in the CLF PCR:2013, Section 8., the US EPA Tool for the Reduction and
Assessment of Chemical and Other Environmental Impacts (TRACI), version 2.1, 2012 impact
categories shall be used as they provide a North American context for the mandatory category
indicators to be included in the EPD. Additionally, the PCR requires a set of inventory metrics to
be reported with the LCIA indicators (see Table 5).
This section presents the inventory metrics and life cycle impact indicator results for the 48
RMC product design mixes. These results are a function of LCI modeling and life cycle
assessment as performed using SimaPro v8.01 with the LCI data sets as described in Section 4
of this report.
Table 5. Life Cycle Category Indicators and Inventory Metrics # LCIA Indicators Abbreviations Units
1 Global Warming Potential (climate change) GWP kg CO2‐eq
2 Ozone Depletion Potential ODP kg CFC‐11‐eq
3 Acidification Potential AP kg SO2‐eq
4 Eutrophication Potential EP kg N‐eq
5 Photochemical Ozone Creation/Smog Potential POCP kg O3‐eq
Inventory Metrics
6 Total primary energy consumption PEC MJ (HHV)
7 Depletion of non‐renewable energy resources NRE MJ (HHV)
8 Use of renewable primary energy RE MJ (HHV)
9 Depletion of non‐renewable material resources NRM kg
10 Use of renewable material resources RM kg
11 Concrete batching water consumption CBW m3
12 Concrete washing water consumption CWW m3
13 Total water consumption TW m3
14 Concrete hazardous waste CHW kg
15 Concrete non‐hazardous waste CNHW kg HHV – higher heating value - is equal to the lower heating value with the addition of the heat of vaporization of the water content in the fuel.
5Category indicators present possible or potential impacts and are based on environmental impacts that may be
realized if the emitted chemical compound(s) actually follows the designated impact pathway and reacts accordingly
in the receiving environment. Each potential impact pathway is calculated in isolation, and while a number of
compounds may contribute to two or more pathways, no effort is made to partition individual chemical compound
flows between impact pathways. As a result, LCIA results are only relative expressions of potentials and do not
predict actual impacts, the exceeding of thresholds, safety margins or risks.

Athena Sustainable Materials Institute
NRMCA Industry Wide LCA Project Report 23
A short description of TRACI 2.1 impact categories (IC) and characterization factors (CF) is
provided below. A characterization factor is a factor derived from a characterization model,
which is applied to convert an assigned life cycle inventory analysis result to the common unit
for the category indicator. The common unit allows calculation of the category indicator result.
Global warming (IC) – TRACI calculates global warming potential (GWP), a midpoint CF metric proposed by the International Panel on Climate Change (IPCC), for the calculation of the potency of greenhouse gases relative to carbon dioxide (CO2). The 100-year time horizons recommended by the IPCC and used by the US for policy making and reporting are adopted within TRACI. The methodology and science behind the global warming potential calculation is considered one of the most accepted LCIA categories. Within TRACI 2.1, the most current GWPs published by IPCC (2013) were used for each substance. GWP100 is expressed on equivalency basis relative to CO2, that is, equivalent CO2 mass basis.
Ozone depletion (IC) – Stratospheric ozone depletion (ODP) is the reduction of the protective ozone within the stratosphere caused by emissions of ozone-depleting substances. International consensus exists on the use of ozone depletion potentials-ODPs (CF), a metric proposed by the World Meteorological Organization (WMO) for calculating the relative importance of chlorofluorocarbons (CFCs), hydrochlorofluorocarbons (HFCs), and halons expected to contribute significantly to the breakdown of the ozone layer. Within TRACI 2.1, the most recent sources of ODPs (WMO 2003) were used for each substance, where chemicals are characterized relative to trichlorofluoromethane (CFC-11).
Acidification (IC) – According to TRACI 2.1, acidification (AP) comprises processes that
increase the acidity (hydrogen ion concentration, [H+]) within a local environment. This can be the result of the addition of acids (e.g., nitric acid and sulfuric acid) into the environment, or by the addition of other substances (e.g., ammonia) which increase the acidity of the environment due to various chemical reactions and/or biological activity, or by natural circumstances such as the change in soil concentrations because of the growth of local plant species [7]. Acidification is a more regional rather than global impact affecting water and soil. Consistent with the focus on providing midpoint assessments, TRACI 2.1 uses an acidification model which incorporates the increasing hydrogen ion potential within the environment without incorporation of site-specific characteristics such as the ability for certain environments to provide buffering capability. Acidification is expressed in kg SO2 equivalent.
Eutrophication (IC) – In TRACI 2.1, eutrophication (EP) is defined as the fertilization of surface waters by nutrients that were previously scarce. This measure encompasses the release of mineral salts and their nutrient enrichment effects on waters – typically made up of nitrogen (N) and phosphorous (P) compounds and organic matter flowing into waterways. The result is expressed on an equivalent mass of nitrogen basis. The characterization factors estimate the eutrophication potential of a release of chemicals containing N or P to air or water, per kilogram of chemical released, relative to 1 kg N discharged directly to surface freshwater.
Athena Sustainable Materials Institute
NRMCA Industry Wide LCA Project Report 24
Photochemical ozone creation/smog (IC) – Photochemical ozone formation potential (CF) – Under certain climatic conditions, air emissions from industry and transportation can be trapped at ground level where, in the presence of sunlight, they produce photochemical smog, a symptom of photochemical ozone creation potential (POCP). While ozone is not emitted directly, it is a product of interactions of volatile organic compounds (VOCs) and nitrogen oxides (NOx). The “smog” (POCP) indicator is expressed on a mass of equivalent ozone (O3) basis.
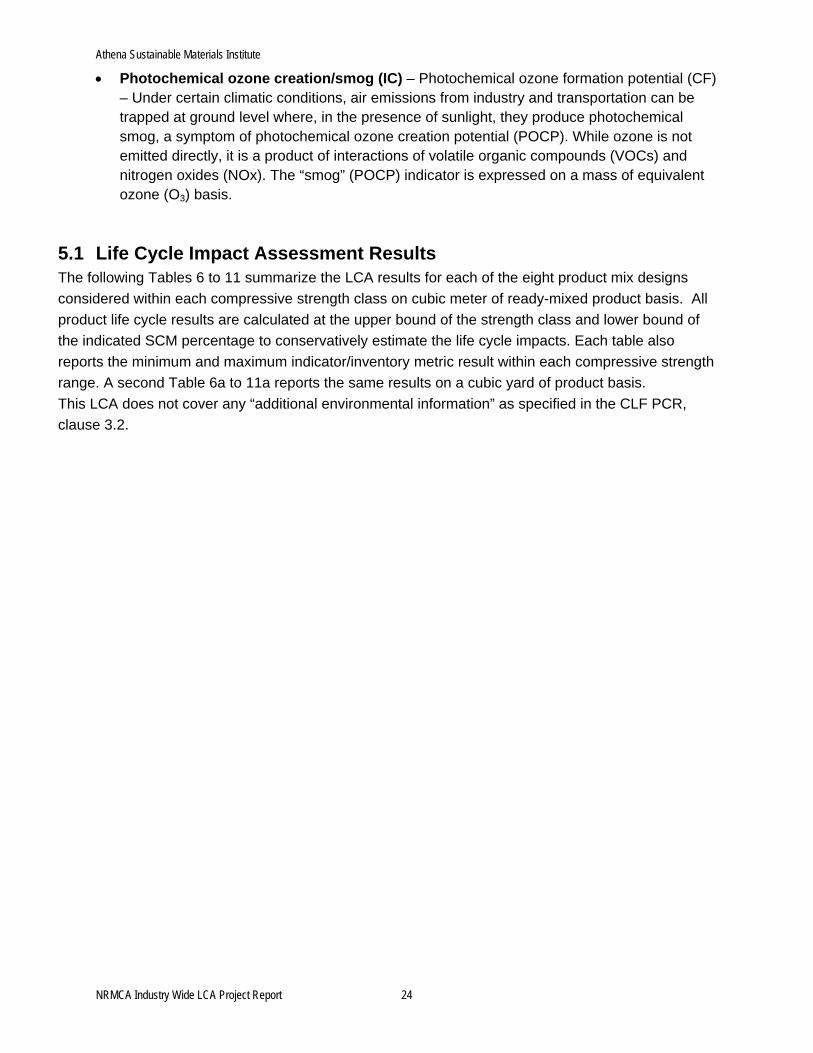
5.1 Life Cycle Impact Assessment Results The following Tables 6 to 11 summarize the LCA results for each of the eight product mix designs
considered within each compressive strength class on cubic meter of ready-mixed product basis. All
product life cycle results are calculated at the upper bound of the strength class and lower bound of
the indicated SCM percentage to conservatively estimate the life cycle impacts. Each table also
reports the minimum and maximum indicator/inventory metric result within each compressive strength
range. A second Table 6a to 11a reports the same results on a cubic yard of product basis.
This LCA does not cover any “additional environmental information” as specified in the CLF PCR,
clause 3.2.

Athena Sustainable Materials Institute
NRMCA Industry Wide LCA Project Report 25
Table 6. Summary Results (A1‐A3): 0‐2500 psi (0‐17.24 MPa) RMC product, per cubic meter Indicator/LCI Metric GWP ODP AP EP POCP PEC NRE RE NRM RM CBW CWW TW CHW CNHW
Unit (equivalent) kg CO2 kg CFC‐11 kg SO2 kg N kg O3 MJ MJ MJ kg kg m3 m3 m3 kg kg
Minimum Indicator/Metric Value 186.9 3.48419E‐06 1.02 0.12 14.47 1,721 1,707 13 2,051 0.46 0.13 0.12 0.25 0.41 2.67
Maximum Indicator/Metric Value 302.3 5.26233E‐06 1.36 0.15 17.66 2,402 2,384 17 2,279 0.57 0.13 0.12 0.25 0.41 2.67
2500‐00‐FA/SL 302.3 5.26233E‐06 1.36 0.15 17.66 2,402 2,384 17 2,279 0.57 0.13 0.12 0.25 0.41 2.67
2500‐20‐FA 261.2 4.571E‐06 1.20 0.14 16.14 2,118 2,103 15 2,176 0.52 0.13 0.12 0.25 0.41 2.67
2500‐30‐FA 239.0 4.19737E‐06 1.11 0.13 15.33 1,966 1,951 14 2,120 0.49 0.13 0.12 0.25 0.41 2.67
2500‐40‐FA 215.6 3.80306E‐06 1.02 0.12 14.47 1,805 1,792 13 2,061 0.46 0.13 0.12 0.25 0.41 2.67
2500‐30‐SL 233.0 4.22968E‐06 1.21 0.14 16.67 2,022 2,007 16 2,161 0.53 0.13 0.12 0.25 0.41 2.67
2500‐40‐SL 210.0 3.88559E‐06 1.16 0.14 16.35 1,897 1,882 15 2,121 0.52 0.13 0.12 0.25 0.41 2.67
2500‐50‐SL 186.9 3.54141E‐06 1.11 0.13 16.02 1,771 1,756 15 2,082 0.50 0.13 0.12 0.25 0.41 2.67
2500‐50‐FA/SL 188.4 3.48419E‐06 1.04 0.12 15.11 1,721 1,707 14 2,051 0.48 0.13 0.12 0.25 0.41 2.67
Table 6a. Summary Results (A1‐A3): 0‐2500 psi (0‐17.24 MPa) RMC product, per cubic yard Indicator/LCI Metric GWP ODP AP EP POCP PEC NRE RE NRM RM CBW CWW TW CHW CNHW
Unit (equivalent) kg CO2 kg CFC‐11 kg SO2 kg N kg O3 MJ MJ MJ kg kg m3 m3 m3 kg kg
Minimum Indicator/Metric Value 142.9 2.66385E‐06 0.78 0.09 11.06 1,316 1,305 10 1,568 0.35 0.10 0.09 0.19 0.31 2.04
Maximum Indicator/Metric Value 231.1 4.02334E‐06 1.04 0.12 13.50 1,836 1,823 13 1,742 0.44 0.10 0.09 0.19 0.31 2.04
2500‐00‐FA/SL 231.1 4.02334E‐06 1.04 0.12 13.50 1,836 1,823 13 1,742 0.44 0.10 0.09 0.19 0.31 2.04
2500‐20‐FA 199.7 3.49478E‐06 0.91 0.10 12.34 1,619 1,608 12 1,663 0.40 0.10 0.09 0.19 0.31 2.04
2500‐30‐FA 182.7 3.20912E‐06 0.85 0.10 11.72 1,503 1,492 11 1,621 0.38 0.10 0.09 0.19 0.31 2.04
2500‐40‐FA 164.9 2.90765E‐06 0.78 0.09 11.06 1,380 1,370 10 1,576 0.35 0.10 0.09 0.19 0.31 2.04
2500‐30‐SL 178.1 3.23382E‐06 0.93 0.11 12.75 1,546 1,534 12 1,652 0.40 0.10 0.09 0.19 0.31 2.04
2500‐40‐SL 160.5 2.97075E‐06 0.89 0.10 12.50 1,451 1,439 12 1,622 0.39 0.10 0.09 0.19 0.31 2.04
2500‐50‐SL 142.9 2.7076E‐06 0.85 0.10 12.25 1,354 1,343 11 1,592 0.38 0.10 0.09 0.19 0.31 2.04
2500‐50‐FA/SL 144.0 2.66385E‐06 0.80 0.09 11.55 1,316 1,305 11 1,568 0.36 0.10 0.09 0.19 0.31 2.04

Athena Sustainable Materials Institute
NRMCA Industry Wide LCA Project Report 26
Table 7. Summary Results (A1‐A3): 2501‐3000 psi (17.25‐20.68 MPa) RMC product, per cubic meter Indicator/LCI Metric GWP ODP AP EP POCP PEC NRE RE NRM RM CBW CWW TW CHW CNHW
Unit (equivalent) kg CO2 kg CFC‐11 kg SO2 kg N kg O3 MJ MJ MJ kg kg m3 m3 m3 kg kg
Minimum Indicator/Metric Value 206.3 3.81348E‐06 1.11 0.13 15.40 1,871 1,856 14 2,042 0.49 0.13 0.12 0.25 0.41 2.67
Maximum Indicator/Metric Value 337.1 5.82846E‐06 1.50 0.16 19.02 2,643 2,624 19 2,300 0.61 0.13 0.12 0.25 0.41 2.67
3000‐00‐FA/SL 337.1 5.82846E‐06 1.50 0.16 19.02 2,643 2,624 19 2,300 0.61 0.13 0.12 0.25 0.41 2.67
3000‐20‐FA 290.5 5.04506E‐06 1.31 0.15 17.31 2,321 2,305 17 2,183 0.55 0.13 0.12 0.25 0.41 2.67
3000‐30‐FA 265.3 4.62156E‐06 1.21 0.14 16.38 2,147 2,132 15 2,120 0.52 0.13 0.12 0.25 0.41 2.67
3000‐40‐FA 238.9 4.17472E‐06 1.11 0.13 15.40 1,965 1,951 14 2,053 0.49 0.13 0.12 0.25 0.41 2.67
3000‐30‐SL 258.5 4.65817E‐06 1.33 0.15 17.90 2,212 2,194 17 2,166 0.56 0.13 0.12 0.25 0.41 2.67
3000‐40‐SL 232.4 4.26824E‐06 1.28 0.15 17.53 2,070 2,053 17 2,121 0.55 0.13 0.12 0.25 0.41 2.67
3000‐50‐SL 206.3 3.87832E‐06 1.22 0.14 17.16 1,927 1,912 16 2,076 0.53 0.13 0.12 0.25 0.41 2.67
3000‐50‐FA/SL 208.0 3.81348E‐06 1.14 0.13 16.13 1,871 1,856 15 2,042 0.50 0.13 0.12 0.25 0.41 2.67
Table 7a. Summary Results (A1‐A3): 2501‐3000 psi (17.25‐20.68 MPa) RMC product, per cubic yard Indicator/LCI Metric GWP ODP AP EP POCP PEC NRE RE NRM RM CBW CWW TW CHW CNHW
Unit (equivalent) kg CO2 kg CFC‐11 kg SO2 kg N kg O3 MJ MJ MJ kg kg m3 m3 m3 kg kg
Minimum Indicator/Metric Value 157.8 2.91561E‐06 0.85 0.10 11.78 1,430 1,419 11 1,561 0.37 0.10 0.09 0.19 0.31 2.04
Maximum Indicator/Metric Value 257.7 4.45618E‐06 1.15 0.13 14.54 2,020 2,006 14 1,758 0.46 0.10 0.09 0.19 0.31 2.04
3000‐00‐FA/SL 257.7 4.45618E‐06 1.15 0.13 14.54 2,020 2,006 14 1,758 0.46 0.10 0.09 0.19 0.31 2.04
3000‐20‐FA 222.1 3.85722E‐06 1.00 0.11 13.23 1,775 1,762 13 1,669 0.42 0.10 0.09 0.19 0.31 2.04
3000‐30‐FA 202.9 3.53343E‐06 0.93 0.10 12.52 1,642 1,630 12 1,620 0.40 0.10 0.09 0.19 0.31 2.04
3000‐40‐FA 182.6 3.1918E‐06 0.85 0.10 11.78 1,503 1,492 11 1,569 0.37 0.10 0.09 0.19 0.31 2.04
3000‐30‐SL 197.7 3.56142E‐06 1.02 0.12 13.69 1,691 1,678 13 1,656 0.43 0.10 0.09 0.19 0.31 2.04
3000‐40‐SL 177.7 3.2633E‐06 0.97 0.11 13.40 1,582 1,570 13 1,622 0.42 0.10 0.09 0.19 0.31 2.04
3000‐50‐SL 157.8 2.96519E‐06 0.93 0.11 13.12 1,474 1,461 12 1,588 0.41 0.10 0.09 0.19 0.31 2.04
3000‐50‐FA/SL 159.0 2.91561E‐06 0.87 0.10 12.34 1,430 1,419 11 1,561 0.38 0.10 0.09 0.19 0.31 2.04

Athena Sustainable Materials Institute
NRMCA Industry Wide LCA Project Report 27
Table 8. Summary Results (A1‐A3): 3001‐4000 psi (20.69‐27.58 MPa) RMC product, per cubic meter Indicator/LCI Metric GWP ODP AP EP POCP PEC NRE RE NRM RM CBW CWW TW CHW CNHW
Unit (equivalent) kg CO2 kg CFC‐11 kg SO2 kg N kg O3 MJ MJ MJ kg kg m3 m3 m3 kg kg
Minimum Indicator/Metric Value 250.4 4.5593E‐06 1.32 0.15 17.53 2,210 2,193 17 2,020 0.54 0.13 0.12 0.25 0.41 2.67
Maximum Indicator/Metric Value 416.1 7.1108E‐06 1.81 0.19 22.12 3,190 3,167 22 2,347 0.69 0.13 0.12 0.25 0.41 2.67
4000‐00‐FA/SL 416.1 7.1108E‐06 1.81 0.19 22.12 3,190 3,167 22 2,347 0.69 0.13 0.12 0.25 0.41 2.67
4000‐20‐FA 357.1 6.11887E‐06 1.58 0.17 19.95 2,783 2,763 20 2,199 0.62 0.13 0.12 0.25 0.41 2.67
4000‐30‐FA 325.2 5.58265E‐06 1.45 0.16 18.77 2,562 2,544 18 2,119 0.58 0.13 0.12 0.25 0.41 2.67
4000‐40‐FA 291.6 5.01684E‐06 1.32 0.15 17.53 2,331 2,315 17 2,034 0.54 0.13 0.12 0.25 0.41 2.67
4000‐30‐SL 316.6 5.62901E‐06 1.60 0.18 20.70 2,644 2,623 20 2,177 0.63 0.13 0.12 0.25 0.41 2.67
4000‐40‐SL 283.5 5.13526E‐06 1.53 0.17 20.23 2,463 2,444 20 2,121 0.61 0.13 0.12 0.25 0.41 2.67
4000‐50‐SL 250.4 4.6414E‐06 1.46 0.17 19.76 2,282 2,263 19 2,064 0.60 0.13 0.12 0.25 0.41 2.67
4000‐50‐FA/SL 252.5 4.5593E‐06 1.36 0.16 18.46 2,210 2,193 17 2,020 0.56 0.13 0.12 0.25 0.41 2.67
Table 8a. Summary Results (A1‐A3): 3001‐4000 psi (20.69‐27.58 MPa) RMC product, per cubic yard Indicator/LCI Metric GWP ODP AP EP POCP PEC NRE RE NRM RM CBW CWW TW CHW CNHW
Unit (equivalent) kg CO2 kg CFC‐11 kg SO2 kg N kg O3 MJ MJ MJ kg kg m3 m3 m3 kg kg
Minimum Indicator/Metric Value 191.4 3.48584E‐06 1.01 0.11 13.40 1,690 1,676 13 1,545 0.41 0.10 0.09 0.19 0.31 2.04
Maximum Indicator/Metric Value 318.1 5.43659E‐06 1.39 0.15 16.91 2,439 2,421 17 1,795 0.53 0.10 0.09 0.19 0.31 2.04
4000‐00‐FA/SL 318.1 5.43659E‐06 1.39 0.15 16.91 2,439 2,421 17 1,795 0.53 0.10 0.09 0.19 0.31 2.04
4000‐20‐FA 273.0 4.67821E‐06 1.21 0.13 15.25 2,127 2,112 15 1,681 0.47 0.10 0.09 0.19 0.31 2.04
4000‐30‐FA 248.6 4.26824E‐06 1.11 0.12 14.35 1,959 1,945 14 1,620 0.44 0.10 0.09 0.19 0.31 2.04
4000‐40‐FA 223.0 3.83565E‐06 1.01 0.11 13.40 1,783 1,770 13 1,555 0.41 0.10 0.09 0.19 0.31 2.04
4000‐30‐SL 242.1 4.30369E‐06 1.22 0.14 15.83 2,021 2,006 15 1,665 0.48 0.10 0.09 0.19 0.31 2.04
4000‐40‐SL 216.8 3.92619E‐06 1.17 0.13 15.47 1,883 1,868 15 1,622 0.47 0.10 0.09 0.19 0.31 2.04
4000‐50‐SL 191.4 3.5486E‐06 1.12 0.13 15.11 1,745 1,730 14 1,578 0.46 0.10 0.09 0.19 0.31 2.04
4000‐50‐FA/SL 193.0 3.48584E‐06 1.04 0.12 14.11 1,690 1,676 13 1,545 0.43 0.10 0.09 0.19 0.31 2.04

Athena Sustainable Materials Institute
NRMCA Industry Wide LCA Project Report 28
Table 9. Summary Results (A1‐A3): 4001‐5000 psi (27.59‐34.47 MPa) RMC product, per cubic meter Indicator/LCI Metric GWP ODP AP EP POCP PEC NRE RE NRM RM CBW CWW TW CHW CNHW
Unit (equivalent) kg CO2 kg CFC‐11 kg SO2 kg N kg O3 MJ MJ MJ kg kg m3 m3 m3 kg kg
Minimum Indicator/Metric Value 302.4 5.42564E‐06 2.30 0.21 28.06 2,612 2,592 19 1,995 0.59 0.13 0.12 0.25 0.41 2.67
Maximum Indicator/Metric Value 509.1 8.60821E‐06 2.92 0.28 33.78 3,835 3,809 27 2,402 0.79 0.13 0.12 0.25 0.41 2.67
5000‐00‐FA/SL 509.1 8.60821E‐06 2.92 0.28 33.78 3,835 3,809 27 2,402 0.79 0.13 0.12 0.25 0.41 2.67
5000‐20‐FA 435.6 7.37107E‐06 2.63 0.25 31.07 3,328 3,305 23 2,218 0.69 0.13 0.12 0.25 0.41 2.67
5000‐30‐FA 395.9 6.70234E‐06 2.47 0.23 29.61 3,054 3,033 21 2,118 0.65 0.13 0.12 0.25 0.41 2.67
5000‐40‐FA 353.9 5.99645E‐06 2.30 0.21 28.06 2,765 2,746 19 2,012 0.59 0.13 0.12 0.25 0.41 2.67
5000‐30‐SL 385.1 6.76017E‐06 2.65 0.26 32.01 3,156 3,132 24 2,191 0.71 0.13 0.12 0.25 0.41 2.67
5000‐40‐SL 343.8 6.14416E‐06 2.56 0.25 31.43 2,930 2,907 23 2,120 0.69 0.13 0.12 0.25 0.41 2.67
5000‐50‐SL 302.4 5.52804E‐06 2.48 0.24 30.83 2,702 2,680 22 2,050 0.67 0.13 0.12 0.25 0.41 2.67
5000‐50‐FA/SL 305.0 5.42564E‐06 2.35 0.23 29.21 2,612 2,592 20 1,995 0.62 0.13 0.12 0.25 0.41 2.67
Table 9a. Summary Results (A1‐A3): 4001‐5000 psi (27.59‐34.47 MPa) RMC product, per cubic yard Indicator/LCI Metric GWP ODP AP EP POCP PEC NRE RE NRM RM CBW CWW TW CHW CNHW
Unit (equivalent) kg CO2 kg CFC‐11 kg SO2 kg N kg O3 MJ MJ MJ kg kg m3 m3 m3 kg kg
Minimum Indicator/Metric Value 231.2 4.1482E‐06 1.76 0.16 21.45 1,997 1,982 15 1,525 0.45 0.10 0.09 0.19 0.31 2.04
Maximum Indicator/Metric Value 389.2 6.58145E‐06 2.23 0.21 25.83 2,932 2,912 20 1,837 0.60 0.10 0.09 0.19 0.31 2.04
5000‐00‐FA/SL 389.2 6.58145E‐06 2.23 0.21 25.83 2,932 2,912 20 1,837 0.60 0.10 0.09 0.19 0.31 2.04
5000‐20‐FA 333.0 5.63558E‐06 2.01 0.19 23.76 2,545 2,527 18 1,695 0.53 0.10 0.09 0.19 0.31 2.04
5000‐30‐FA 302.7 5.12431E‐06 1.89 0.18 22.64 2,335 2,319 16 1,619 0.49 0.10 0.09 0.19 0.31 2.04
5000‐40‐FA 270.6 4.58461E‐06 1.76 0.16 21.45 2,114 2,099 15 1,538 0.45 0.10 0.09 0.19 0.31 2.04
5000‐30‐SL 294.4 5.16852E‐06 2.03 0.20 24.48 2,413 2,395 18 1,675 0.55 0.10 0.09 0.19 0.31 2.04
5000‐40‐SL 262.8 4.69754E‐06 1.96 0.19 24.03 2,240 2,222 18 1,621 0.53 0.10 0.09 0.19 0.31 2.04
5000‐50‐SL 231.2 4.22649E‐06 1.89 0.19 23.57 2,066 2,049 17 1,567 0.51 0.10 0.09 0.19 0.31 2.04
5000‐50‐FA/SL 233.2 4.1482E‐06 1.80 0.17 22.33 1,997 1,982 15 1,525 0.47 0.10 0.09 0.19 0.31 2.04
Athena Sustainable Materials Institute
NRMCA Industry Wide LCA Project Report 29
Table 10. Summary Results (A1‐A3): 5001‐6000 psi (34.48‐41.37 MPa) RMC product, per cubic meter Indicator/LCI Metric GWP ODP AP EP POCP PEC NRE RE NRM RM CBW CWW TW CHW CNHW
Unit (equivalent) kg CO2 kg CFC‐11 kg SO2 kg N kg O3 MJ MJ MJ kg kg m3 m3 m3 kg kg
Minimum Indicator/Metric Value 317.8 5.68662E‐06 2.38 0.22 28.87 2,736 2,715 20 2,033 0.62 0.13 0.12 0.25 0.41 2.67
Maximum Indicator/Metric Value 536.1 9.04841E‐06 3.03 0.29 34.92 4,027 3,999 28 2,463 0.82 0.13 0.12 0.25 0.41 2.67
6000‐00‐FA/SL 536.1 9.04841E‐06 3.03 0.29 34.92 4,027 3,999 28 2,463 0.82 0.13 0.12 0.25 0.41 2.67
6000‐20‐FA 458.5 7.74155E‐06 2.72 0.26 32.06 3,491 3,467 24 2,268 0.72 0.13 0.12 0.25 0.41 2.67
6000‐30‐FA 416.5 7.03514E‐06 2.55 0.24 30.51 3,202 3,180 22 2,162 0.67 0.13 0.12 0.25 0.41 2.67
6000‐40‐FA 372.1 6.28947E‐06 2.38 0.22 28.87 2,896 2,876 20 2,051 0.62 0.13 0.12 0.25 0.41 2.67
6000‐30‐SL 405.1 7.09623E‐06 2.75 0.27 33.05 3,309 3,284 25 2,240 0.74 0.13 0.12 0.25 0.41 2.67
6000‐40‐SL 361.5 6.44551E‐06 2.65 0.26 32.43 3,070 3,046 24 2,165 0.72 0.13 0.12 0.25 0.41 2.67
6000‐50‐SL 317.8 5.79478E‐06 2.56 0.25 31.81 2,831 2,808 23 2,091 0.69 0.13 0.12 0.25 0.41 2.67
6000‐50‐FA/SL 320.6 5.68662E‐06 2.43 0.23 30.09 2,736 2,715 21 2,033 0.64 0.13 0.12 0.25 0.41 2.67
Table 10a. Summary Results (A1‐A3): 5001‐6000 psi (34.48‐41.37 MPa ) RMC product, per cubic yard Indicator/LCI Metric GWP ODP AP EP POCP PEC NRE RE NRM RM CBW CWW TW CHW CNHW
Unit (equivalent) kg CO2 kg CFC‐11 kg SO2 kg N kg O3 MJ MJ MJ kg kg m3 m3 m3 kg kg
Minimum Indicator/Metric Value 243.0 4.34773E‐06 1.82 0.17 22.08 2,092 2,076 15 1,554 0.47 0.10 0.09 0.19 0.31 2.04
Maximum Indicator/Metric Value 409.9 6.918E‐06 2.31 0.22 26.70 3,079 3,057 21 1,883 0.62 0.10 0.09 0.19 0.31 2.04
6000‐00‐FA/SL 409.9 6.918E‐06 2.31 0.22 26.70 3,079 3,057 21 1,883 0.62 0.10 0.09 0.19 0.31 2.04
6000‐20‐FA 350.5 5.91884E‐06 2.08 0.20 24.51 2,669 2,651 18 1,734 0.55 0.10 0.09 0.19 0.31 2.04
6000‐30‐FA 318.4 5.37875E‐06 1.95 0.18 23.32 2,448 2,431 17 1,653 0.51 0.10 0.09 0.19 0.31 2.04
6000‐40‐FA 284.5 4.80864E‐06 1.82 0.17 22.08 2,214 2,199 15 1,568 0.47 0.10 0.09 0.19 0.31 2.04
6000‐30‐SL 309.7 5.42546E‐06 2.10 0.20 25.27 2,530 2,511 19 1,712 0.57 0.10 0.09 0.19 0.31 2.04
6000‐40‐SL 276.4 4.92794E‐06 2.03 0.20 24.79 2,347 2,329 18 1,655 0.55 0.10 0.09 0.19 0.31 2.04
6000‐50‐SL 243.0 4.43043E‐06 1.96 0.19 24.32 2,164 2,147 18 1,598 0.53 0.10 0.09 0.19 0.31 2.04
6000‐50‐FA/SL 245.1 4.34773E‐06 1.85 0.18 23.00 2,092 2,076 16 1,554 0.49 0.10 0.09 0.19 0.31 2.04

Athena Sustainable Materials Institute
NRMCA Industry Wide LCA Project Report 30
Table 11. Summary Results (A1‐A3): 6001‐8000 psi (41.38‐55.16 MPa) RMC product, per cubic meter Indicator/LCI Metric GWP ODP AP EP POCP PEC NRE RE NRM RM CBW CWW TW CHW CNHW
Unit (equivalent) kg CO2 kg CFC‐11 kg SO2 kg N kg O3 MJ MJ MJ kg kg m3 m3 m3 kg kg
Minimum Indicator/Metric Value 366.9 6.5168E‐06 2.61 0.24 31.24 3,115 3,091 23 2,009 0.67 0.13 0.12 0.25 0.41 2.67
Maximum Indicator/Metric Value 624.1 1.04757E‐05 3.38 0.32 38.37 4,637 4,605 32 2,516 0.91 0.13 0.12 0.25 0.41 2.67
8000‐00‐FA/SL 624.1 1.04757E‐05 3.38 0.32 38.37 4,637 4,605 32 2,516 0.91 0.13 0.12 0.25 0.41 2.67
8000‐20‐FA 532.6 8.93675E‐06 3.02 0.28 34.99 4,006 3,978 27 2,286 0.80 0.13 0.12 0.25 0.41 2.67
8000‐30‐FA 483.2 8.10489E‐06 2.82 0.26 33.17 3,665 3,640 25 2,162 0.74 0.13 0.12 0.25 0.41 2.67
8000‐40‐FA 430.9 7.22671E‐06 2.61 0.24 31.24 3,304 3,281 23 2,031 0.67 0.13 0.12 0.25 0.41 2.67
8000‐30‐SL 469.8 8.17684E‐06 3.05 0.29 36.17 3,791 3,763 28 2,253 0.82 0.13 0.12 0.25 0.41 2.67
8000‐40‐SL 418.3 7.41045E‐06 2.94 0.29 35.43 3,508 3,481 27 2,165 0.79 0.13 0.12 0.25 0.41 2.67
8000‐50‐SL 366.9 6.64417E‐06 2.83 0.28 34.70 3,226 3,200 26 2,077 0.76 0.13 0.12 0.25 0.41 2.67
8000‐50‐FA/SL 370.1 6.5168E‐06 2.67 0.26 32.68 3,115 3,091 24 2,009 0.70 0.13 0.12 0.25 0.41 2.67
Table 11a. Summary Results (A1‐A3): 6001‐8000 psi (41.38‐55.16 MPa) RMC product, per cubic yard Indicator/LCI Metric GWP ODP AP EP POCP PEC NRE RE NRM RM CBW CWW TW CHW CNHW
Unit (equivalent) kg CO2 kg CFC‐11 kg SO2 kg N kg O3 MJ MJ MJ kg kg m3 m3 m3 kg kg
Minimum Indicator/Metric Value 280.5 4.98245E‐06 2.00 0.19 23.89 2,381 2,363 17 1,536 0.51 0.10 0.09 0.19 0.31 2.04
Maximum Indicator/Metric Value 477.2 8.00923E‐06 2.58 0.24 29.33 3,545 3,521 24 1,924 0.70 0.10 0.09 0.19 0.31 2.04
8000‐00‐FA/SL 477.2 8.00923E‐06 2.58 0.24 29.33 3,545 3,521 24 1,924 0.70 0.10 0.09 0.19 0.31 2.04
8000‐20‐FA 407.2 6.83264E‐06 2.31 0.22 26.76 3,063 3,042 21 1,748 0.61 0.10 0.09 0.19 0.31 2.04
8000‐30‐FA 369.4 6.19663E‐06 2.16 0.20 25.36 2,802 2,783 19 1,653 0.56 0.10 0.09 0.19 0.31 2.04
8000‐40‐FA 329.5 5.52521E‐06 2.00 0.19 23.89 2,526 2,509 17 1,552 0.51 0.10 0.09 0.19 0.31 2.04
8000‐30‐SL 359.2 6.25164E‐06 2.33 0.23 27.65 2,899 2,877 22 1,722 0.63 0.10 0.09 0.19 0.31 2.04
8000‐40‐SL 319.8 5.6657E‐06 2.25 0.22 27.09 2,682 2,661 21 1,655 0.61 0.10 0.09 0.19 0.31 2.04
8000‐50‐SL 280.5 5.07983E‐06 2.16 0.21 26.53 2,467 2,447 20 1,588 0.58 0.10 0.09 0.19 0.31 2.04
8000‐50‐FA/SL 283.0 4.98245E‐06 2.04 0.20 24.98 2,381 2,363 18 1,536 0.54 0.10 0.09 0.19 0.31 2.04

Athena Sustainable Materials Institute
NRMCA Industry Wide LCA Project Report 31
6 Interpretation Contribution analysis is an analytical method used to support the interpretation of LCA results and to facilitate the comprehension and the reader's understanding of the environmental profile of the declared products. Table 12 summarizes the results of a cradle-to-gate percent contribution analysis (for the minimum and maximum product mix design) for each compressive strength class by information module. The Table shows the percent contribution of the raw materials production (A1), transportation (A2) and RMC manufacturing core processes (A3) for the global warming potential (GWP) impact indicator and total primary energy consumption (PEC) inventory metric. Overall, upstream materials production (A1) accounts for the largest proportion of the GWP (84% to 93%) and primary energy consumption (75% to 87%) associated with the production of ready-mixed concrete. Materials transportation (A2) contributes the next highest proportion of GWP (5% to 11%) and PEC (9% to 16%) with RMC manufacturing (A3) accounting for the remaining and smallest portion of the overall GWP and energy consumption across all compressive strengths. As one moves from the minimum to the maximum impact mix design in a compressive strength class, it is evident that upstream materials production account for a larger share of the GWP impact and consumed energy. This is due to the fact that the highest impact mix design is the 100% Portland cement mix design as the manufacture of Portland cement has the highest GWP and energy consumption of any of the material inputs used in the production of ready-mixed concrete.
Table 12. Percent Contribution by Information Module for GWP and PEC
Specified Compressive Strength
Minimum & Maximum
Global Warming Potential (GWP) percent contribution by module
Total Primary Energy Consumption (PEC) ‐ percent
contribution by module
A1 A2 A3 A1 A2 A3
2500 psi 17.24 MPa
Min. 82.9% 10.8% 6.2% 74.8% 15.7% 9.5%
Max. 88.7% 7.5% 3.8% 80.1% 12.9% 7.0%
3000 psi 20.68 MPa
Min. 84.3% 10.0% 5.6% 76.5% 14.7% 8.8%
Max. 89.6% 6.9% 3.5% 81.5% 12.1% 6.4%
4000 psi 27.58 MPa
Min. 86.7% 8.7% 4.6% 79.5% 13.0% 7.4%
Max. 91.2% 6.0% 2.8% 83.9% 10.8% 5.3%
5000 psi 34.47 MPa
Min. 88.5% 7.7% 3.8% 82.0% 11.7% 6.3%
Max. 92.4% 5.4% 2.3% 85.8% 9.8% 4.4%
6000 psi 41.37 MPa
Min. 88.8% 7.5% 3.7% 82.5% 11.6% 6.0%
Max. 92.6% 5.3% 2.2% 86.2% 9.6% 4.2%
8000 psi 55.16 MPa
Min. 90.0% 6.8% 3.2% 84.1% 10.6% 5.2%
Max. 93.3% 4.8% 1.9% 87.4% 8.9% 3.6%

Athena Sustainable Materials Institute
NRMCA Industry Wide LCA Project Report 32
6.1 Study Limitations This study does not report all of the environmental impacts due to manufacturing of RMC. During the LCI data collection stage a number of RMC manufacturers reported other emissions (e.g., particulate matter) that are not reflected in the impact indicators or inventory metrics as prescribed by the CLF PCR. These reported emissions might impact human and/or ecosystem health. In order to assess the local impacts of product manufacturing on human health, land use and local ecology, additional analysis is required.
This project reports the results of an industry wide ‘cradle-to-gate’ LCA of RMC in order to benchmark the manufacture of RMC only. No environmental claim regarding the superiority or equivalence of RMC relative to a competing product that performs the same function is implied. An EPD does not make any statements that the product covered by the EPD is better or worse than any other product. LCIA results are only relative expressions of potentials and do not predict actual impacts, the exceeding of thresholds, safety margins or risks,
7 References 1. Athena Sustainable Materials Institute (2014) NRMCA LCI Data Collection Statistical
Summary, Prepared for National Ready Mixed Concrete Association.
2. Carbon Leadership Forum. (2013). “Product Category Rules (PCR) for ISO 14025 Type III
Environmental Product Declarations (EPDs) of Concrete v1.1”.
3. EN 15804:2012 Sustainability of construction works – Environmental product declarations –
Core rules for the product category of construction products.
4. European Federation of Concrete Admixture Associations (2006). EFCA Environmental
Declarations for Admixtures. <http://www.efca.info/publications.html>
5. ISO 21930: 2007 Building construction – Sustainability in building construction –
Environmental declaration of building products.
6. ISO 14025: 2006 Environmental labeling and declarations - Type III environmental
declarations - Principles and procedures.
7. ISO 14044: 2006 Environmental management - Life cycle assessment - Requirements and
guidelines.
8. ISO 14040: 2006 Environmental management - Life cycle assessment - Principles and
framework.
9. NSF Program Operator Rules, NSF International –National Center for Sustainability
Standards, April 10, 2014
http://www.nsf.org/newsroom_pdf/NSF_Program_Operator_Instructions-news.pdf
10. National Renewable Energy Laboratory 2014. U.S. Life Cycle Inventory Database.
https://www.lcacommons.gov/nrel/search.
11. ACI 211.1: Standard Practice for Selecting Proportions for Normal, Heavyweight, and Mass
Concrete
12. ACI 318: 2008 Building Code Requirements for Structural Concrete.
13. ASTM C94: Standard Specification for Ready-Mixed Concrete.

Athena Sustainable Materials Institute
NRMCA Industry Wide LCA Project Report 33
14. A23.1-09/A23.2-09 (R2014) - Concrete materials and methods of concrete construction/Test
methods and standard practices for concrete.
15. Carbon Leadership Forum (2014) “Clarification #1 (April 10, 2014) to: Product Category
Rules (PCR) for ISO 14025 Type III Environmental Product Declarations (EPDs) of Concrete
v1.1.

Athena Sustainable Materials Institute
NRMCA Industry Wide LCA Project Report 34
Appendix A: Mix design specifications and raw material quantitites
Product Name Mix Parameters Mix Proportions, lb Admixture Use (oz.)
Comp. Strength (psi)
w/cm FA % SL %
Air Ent (Y/N) Cement
Fly Ash Slag
Batch Water
Coarse Agg
Fine Agg
Air Ent WR HRWR ACC
2500‐00‐FA/SL 2500 0.61 0% 0% Y 429 0 0 261 1677 1408 1.0 3.0 0.0 20
2500‐20‐FA 2500 0.61 20% 0% Y 361 90 0 261 1677 1336 1.0 3.0 0.0 25
2500‐30‐FA 2500 0.61 30% 0% Y 325 139 0 261 1677 1298 1.5 3.0 0.0 30
2500‐40‐FA 2500 0.61 40% 0% Y 286 191 0 261 1677 1257 1.5 3.0 0.0 40
2500‐30‐SL 2500 0.61 0% 30% Y 300 0 129 261 1677 1398 1.0 3.0 0.0 30
2500‐40‐SL 2500 0.61 0% 40% Y 257 0 172 261 1677 1395 1.0 3.0 0.0 40
2500‐50‐SL 2500 0.61 0% 50% Y 215 0 215 261 1677 1392 1.0 3.0 0.0 45
2500‐50‐FA/SL 2500 0.61 20% 30% Y 226 90 135 261 1677 1327 1.0 3.0 0.0 45
3000‐00‐FA/SL 3000 0.54 0% 0% Y 486 0 0 261 1677 1360 1.0 3.0 0.0 15
3000‐20‐FA 3000 0.54 20% 0% Y 409 102 0 261 1677 1280 1.0 3.0 0.0 20
3000‐30‐FA 3000 0.54 30% 0% Y 368 158 0 261 1677 1236 1.5 3.0 0.0 20
3000‐40‐FA 3000 0.54 40% 0% Y 324 216 0 261 1677 1190 1.5 3.0 0.0 30
3000‐30‐SL 3000 0.54 0% 30% Y 340 0 146 261 1677 1350 1.0 3.0 0.0 20
3000‐40‐SL 3000 0.54 0% 40% Y 292 0 194 261 1677 1347 1.0 3.0 0.0 30
3000‐50‐SL 3000 0.54 0% 50% Y 243 0 243 261 1677 1343 1.0 3.0 0.0 40
3000‐50‐FA/SL 3000 0.54 20% 30% Y 256 102 154 261 1677 1269 1.0 3.0 0.0 40
4000‐00‐FA/SL 4000 0.42 0% 0% Y 616 0 0 261 1677 1254 1.0 3.0 0.0 10
4000‐20‐FA 4000 0.42 20% 0% Y 518 130 0 261 1677 1151 1.0 3.0 0.0 15
4000‐30‐FA 4000 0.42 30% 0% Y 466 200 0 261 1677 1096 1.5 3.0 0.0 15
4000‐40‐FA 4000 0.42 40% 0% Y 410 274 0 261 1677 1038 1.5 3.0 0.0 25
4000‐30‐SL 4000 0.42 0% 30% Y 431 0 185 261 1677 1240 1.0 3.0 0.0 15
4000‐40‐SL 4000 0.42 0% 40% Y 369 0 246 261 1677 1236 1.0 3.0 0.0 25
4000‐50‐SL 4000 0.42 0% 50% Y 308 0 308 261 1677 1232 1.0 3.0 0.0 30
4000‐50‐FA/SL 4000 0.42 20% 30% Y 324 130 194 261 1677 1138 1.0 3.0 0.0 30
5000‐00‐FA/SL 5000 0.35 0% 0% Y 768 0 0 270 1539 1265 1.0 3.0 4.0 0

Athena Sustainable Materials Institute
NRMCA Industry Wide LCA Project Report 35
5000‐20‐FA 5000 0.35 20% 0% Y 647 162 0 270 1539 1137 1.0 3.0 4.0 10
5000‐30‐FA 5000 0.35 30% 0% Y 581 249 0 270 1539 1068 1.5 3.0 4.0 15
5000‐40‐FA 5000 0.35 40% 0% Y 512 341 0 270 1539 996 1.5 3.0 4.0 20
5000‐30‐SL 5000 0.35 0% 30% Y 537 0 230 270 1539 1248 1.0 3.0 4.0 15
5000‐40‐SL 5000 0.35 0% 40% Y 461 0 307 270 1539 1243 1.0 3.0 4.0 20
5000‐50‐SL 5000 0.35 0% 50% Y 384 0 384 270 1539 1238 1.0 3.0 4.0 20
5000‐50‐FA/SL 5000 0.35 20% 30% Y 404 162 242 270 1539 1120 1.0 3.0 4.0 20
6000‐00‐FA/SL 6000 0.36 0% 0% N 811 0 0 293 1539 1302 0.0 3.0 4.0 0
6000‐20‐FA 6000 0.36 20% 0% N 683 171 0 293 1539 1167 0.0 3.0 4.0 10
6000‐30‐FA 6000 0.36 30% 0% N 614 263 0 293 1539 1094 0.0 3.0 4.0 15
6000‐40‐FA 6000 0.36 40% 0% N 541 360 0 293 1539 1018 0.0 3.0 4.0 20
6000‐30‐SL 6000 0.36 0% 30% N 568 0 243 293 1539 1285 0.0 3.0 4.0 15
6000‐40‐SL 6000 0.36 0% 40% N 487 0 324 293 1539 1279 0.0 3.0 4.0 20
6000‐50‐SL 6000 0.36 0% 50% N 406 0 406 293 1539 1273 0.0 3.0 4.0 25
6000‐50‐FA/SL 6000 0.36 20% 30% N 427 171 256 293 1539 1149 0.0 3.0 4.0 25
8000‐00‐FA/SL 8000 0.31 0% 0% N 955 0 0 293 1539 1183 0.0 3.0 4.0 0
8000‐20‐FA 8000 0.31 20% 0% N 804 201 0 293 1539 1025 0.0 3.0 4.0 10
8000‐30‐FA 8000 0.31 30% 0% N 723 310 0 293 1539 939 0.0 3.0 4.0 15
8000‐40‐FA 8000 0.31 40% 0% N 637 424 0 293 1539 848 0.0 3.0 4.0 15
8000‐30‐SL 8000 0.31 0% 30% N 669 0 287 293 1539 1163 0.0 3.0 4.0 15
8000‐40‐SL 8000 0.31 0% 40% N 573 0 382 293 1539 1156 0.0 3.0 4.0 15
8000‐50‐SL 8000 0.31 0% 50% N 478 0 478 293 1539 1149 0.0 3.0 4.0 20
8000‐50‐FA/SL 8000 0.31 20% 30% N 503 201 302 293 1539 1003 0.0 3.0 4.0 20
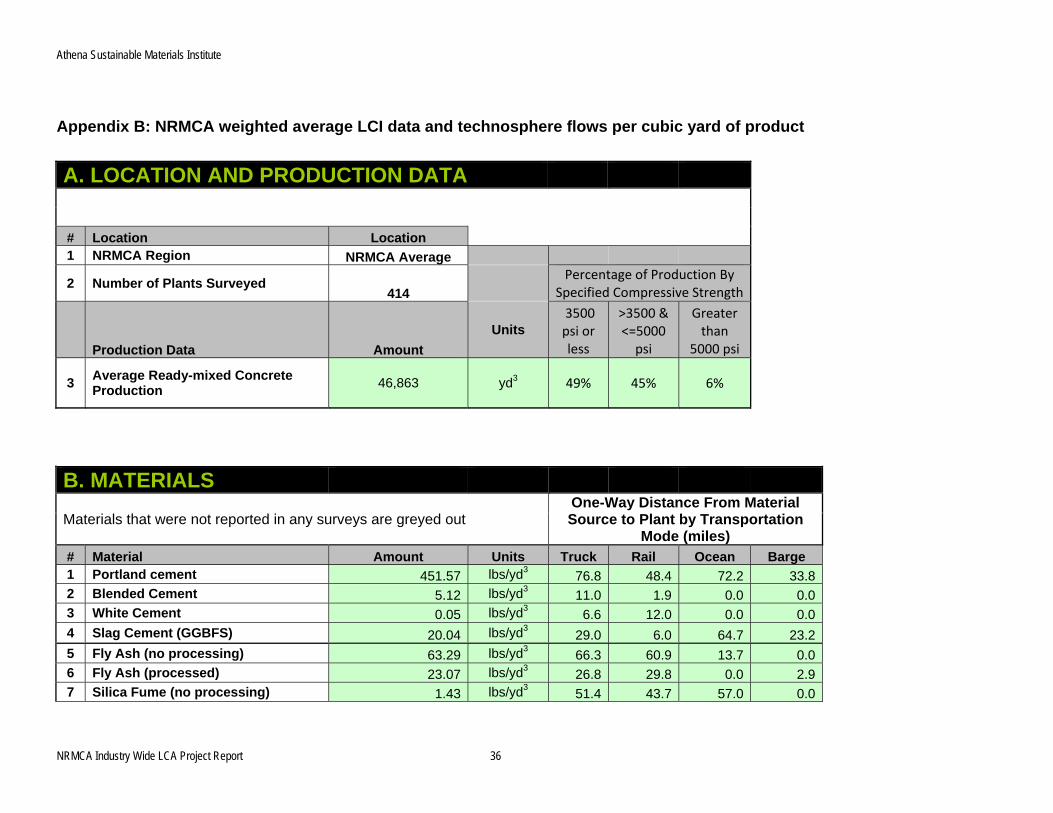
Athena Sustainable Materials Institute
NRMCA Industry Wide LCA Project Report 36
Appendix B: NRMCA weighted average LCI data and technosphere flows per cubic yard of product
A. LOCATION AND PRODUCTION DATA
# Location Location
1 NRMCA Region NRMCA Average
2 Number of Plants Surveyed 414
Percentage of Production By
Specified Compressive Strength
Production Data Amount
Units 3500 psi or less
>3500 & <=5000 psi
Greater than
5000 psi
3 Average Ready-mixed Concrete Production
46,863 yd3 49% 45% 6%
B. MATERIALS
Materials that were not reported in any surveys are greyed out
One-Way Distance From Material Source to Plant by Transportation
Mode (miles) # Material Amount Units Truck Rail Ocean Barge 1 Portland cement 451.57 lbs/yd3 76.8 48.4 72.2 33.82 Blended Cement 5.12 lbs/yd3 11.0 1.9 0.0 0.03 White Cement 0.05 lbs/yd3 6.6 12.0 0.0 0.04 Slag Cement (GGBFS) 20.04 lbs/yd3 29.0 6.0 64.7 23.25 Fly Ash (no processing) 63.29 lbs/yd3 66.3 60.9 13.7 0.06 Fly Ash (processed) 23.07 lbs/yd3 26.8 29.8 0.0 2.97 Silica Fume (no processing) 1.43 lbs/yd3 51.4 43.7 57.0 0.0
Athena Sustainable Materials Institute
NRMCA Industry Wide LCA Project Report 37
8 Other Cement/SCM 0.02 lbs/yd3 2.6 0.0 0.0 0.49 Crushed Coarse Aggregate 1,125.39 lbs/yd3 19.0 20.0 7.2 1.910 Natural Coarse Aggregate 524.30 lbs/yd3 17.8 6.2 8.3 1.911 Crushed Fine Aggregate 166.05 lbs/yd3 4.5 0.6 0.0 0.012 Natural Fine Aggregate 1,247.52 lbs/yd3 31.8 0.7 7.4 5.413 Crushed Returned Concrete 13.19 lbs/yd3 0.8 0.0 0.0 0.0
14 Crushed Demolition Concrete 0.50
lbs/yd3 0.1 0.0 0.0 0.0
15 Air Cooled Slag 0.00 lbs/yd3 0.0 0.0 0.0 0.016 Other Crushed Concrete 0.00 lbs/yd3 0.0 0.0 0.0 0.0
17 Manufactured Lightweight Aggregate 5.75
lbs/yd3 66.1 38.4 0.0 23.0
18 Mineral Fillers 1.54 lbs/yd3 0.4 0.0 0.0 0.019 Other Aggregate 1.21 lbs/yd3 3.3 3.3 0.0 0.0
20 Accelerating Admixture-Chlorides 0.06
gallons/yd3 107.7 0.0 0.0 0.0
21 Accelerating Admixture-Non Chlorides 0.05
gallons/yd3 164.5 0.0 0.0 0.0
22 Air Entraining Admixture 0.03
gallons/yd3 177.
2 0.0 0.0 0.0
23 Water Reducing Retarding Admixture 0.07
gallons/yd3 159.2 23.9 0.0 0.0
24 Waterproofing Admixture 0.003
gallons/yd3 123.
4 0.0 0.0 0.0
25 Water Reducing Admixture (plasticizer) 0.08
gallons/yd3 152.8 0.0 0.0 0.0
26 High Range Water Reducing Admixture (superplasticizer) 0.05
gallons/yd3 147.6 0.0 0.0 0.0
27 Shrinkage Reducing Admixture 0.002
gallons/yd3 34.7 0.0 0.0 0.0
28 Corrosion Inhibiting Admixture 0.01
gallons/yd3 28.9 0.0 0.0 0.0
29 Other Admixture 1 0.01 gallons/yd3 93.1 0.0 0.0 0.030 Other Admixture 2 0.005 gallons/yd3 49.4 0.0 0.0 0.0
31 Synthetic Fibers 0.11
lbs/yd3 257.
9 0.0 0.0 0.0

Athena Sustainable Materials Institute
NRMCA Industry Wide LCA Project Report 38
32 Steel Fibers 0.02 lbs/yd3 48.1 0.7 0.0 0.0
33 Road Dust Control Chemicals (e.g., chlorides) 0.002
gallons/yd3 2.9 0.0 0.0 0.0
34 Oil and Lubricants 0.006 gallons/yd3 44.9 0.0 0.0 0.035 Grease 0.001 gallons/yd3 51.4 0.0 0.0 0.036 Other Onsite Chemicals 0.003 gallons/yd3 18.7 0.0 0.0 0.4
37 Total Water Use 49.97 gallons/yd3
38 Fresh Batch Water Use 22.66 gallons/yd3
39 Recycled Batch Water Use 3.40 gallons/yd3
40 Wash Water Use 23.92 gallons/yd3
AVERAGE OPERATING ENERGY CONSUMPTION
# Energy Type Amount Units / yd3 1 Purchased Electricity 3.86 kWh
7 Natural Gas-Used at Plant 9.07 ft3
8 Secondary Fuels - Liquid (waste solvents, etc.)
0.001 gallon
9 Secondary Fuels - Solid (tires, etc.) 0.06 lbs
10 Fuel Oil (other than diesel) 0.003 gallon
11 Diesel 0.371 gallon
12 Gasoline 0.002 gallon
13 LPG (Liquified Propane Gas) 0.012 gallon
14 Other 0.00011 gallon

Athena Sustainable Materials Institute
NRMCA Industry Wide LCA Project Report 39
E.EMISSIONS REPORTING
# Air Emissions Amount Units / yd3
1 Particulates, PM-2.5 0.31454 ounces
2 Particulates, PM-10 0.78205 ounces
3 Particulates, total 1.27782 ounces
4 Lead 0.01435 ounces
5 Hg 0.00015 ounces
6 CO 0.02320 ounces
7 Nox 0.04959 ounces
8 Sox 0.08991 ounces
9 VOC 0.00133 ounces
# Water Emissions Amount Units / yd3
1 Total Suspended Solids 0.09913 ounces
2 Total Dissolved Solids 0.21797 ounces
3 Biological Oxygen Demand (BOD) 0.03703 ounces
4 Chemical Oxygen Demand (COD) 0.07527 ounces
F. SOLID WASTE REPORTING
# Waste Type Amount Units / yd3 1 Hazardous Solid Waste 0.69 lbs 2 Non-HazardousSolid Waste 4.50 lbs