a continuing program for estimating ground … · a continuing program for estimating ground-water...
TRANSCRIPT
UNITED STATES DEPARTMENT OF THE INTERIOR
GEOLOGICAL SURVEY Water Resources Division
A CONTINUING PROGRAM FOR ESTIMATING GROUND-WATER
PUMPAGE IN CALIFORNIA--METHODS
Prepared in cooperation with the California Department of Water Resources
OPEN-FITF REPORT
Menlo Park California 1970
( 200)
UNITED STATES DEPARTMENT OF THE INTERIOR
GEOLOGICAL SURVEY Water Resources Division
A CONTINUING PROGRAM FOR ESTIMATING GROUND-WATER
PUMPAGE IN CALIFORNIA--METHODS
By
William Ogilbee and Hugh T Mitten
Prepared in cooperation with the California Department of Water Resources
OPEN-FILE REPORT
Menlo Park California May 19 1970
CONTENTS
Page
Abstract 11
Introduction 13
Purpose and scope 14
Acknowledgments 14
Municipal pumpage 15
Agricultural pumpage 16
Data collection 16
Description of estimation methods 17
Estimates from electrical power 17
Estimates from internal-combustion engines using gas 19
Data processing 111
Estimates from electrical power 111
Estimates from gas consumption 116
Reliability of estimation methods 117
Quality control 117
Accuracy of results 118
Selected references 122
ILLUSTRATION
Page
Figure 1 Data cards 13
TABLE
Page
Table 1 Comparison of computed and metered pumpage Santa
Clara County 1966 120
A CONTINUING PROGRAM FOR ESTIMATING GROUND-WATER PUMPAGE
IN CALIFORNIA--METHODS
By William Ogilbee and Hugh T Mitten
ABSTRACT
Municipal and agricultural ground-water pumpage is being estimated
for the principal ground-water basins in California Because of its
anticipated use in analog or digital hydrologic models agricultural
pumpage is estimated for unit areas
Estimated municipal pumpage is based on census figures and population
projections and on pumpage reported by organizations in the San Joaquin
Valley supplying water to communities On the average 025 to 040 acre-
foot of water is used annually per capita depending upon the population
and number of industries in the community The product of population by
appropriate per capita use factor gives an estimated annual pumpage for
a municipality
1
For agricultural ground-water pumpage estimates basic data from
plant-efficiency tests and annual electric power and gas consumption
totals furnished by the major utility companies are punched onto cards
A computer sorts and averages or totals the annual data and computes
annual ground-water pumpage for units of a quarter of a township To
obtain annual pumpage for larger areal units such as townships pumpages
for quarter of a township units are summed Results are cited for areas
of 36 square miles
Several checks are made throughout the program to verify the
reliability of the data and computations Among the checks there is an
average discharge per well per unit area computed from power data
By comparing the average discharge per well to known discharges from
pump-efficiency tests anomalies can be spotted
Statistical studies indicate that efficiency tests of individual
wells probably are representative of wells in a surrounding area
Further the tests are spaced throughout the pumping season Although
testing may be localized in any one year over a 5-year period areal
distribution is random
Under optimum conditions the difference between metered and computed
pumpages is less than 10 percent for areas of a quarter of a township
(9 square miles) and for one township (36 square miles) However
pumpage computed for areas of a section (1 square mile) ranged from
37 percent less to 83 percent more per section than metered pumpage
2
INTRODUCTION
Increased use of ground water since 1940 has resulted in a notable
decline in water levels in many areas of California Various procedures
including water-conservation methods and surface-water imports have
been undertaken to help alleviate the depletion of ground-water resources
Quantitative estimates of ground-water pumpage from the principal groundshy
water basins in California are necessary for future appraisal studies
for constructing hydrologic models and for systematic planning of water
use and conservation
This report was prepared by the Geological Survey Water Resources
Division in cooperation with the California Department of Water Resources
as part of a statewide program of water-resources studies The work was
done under the general supervision of R Stanley Lord district chief in
charge of water-resources investigations in California and under the
immediate supervision of Williard W Dean chief of the Sacramento
subdistrict office
3
Purpose and Scope
The purpose of this report is to outline a systematic procedure for
making estimates of ground-water pumpage and to describe computer
techniques for processing pumpage data in California Because of an
anticipated need in model studies pumpage is determinedon a nodal
density usable in analog or digital computer models
This report describes (1) The collection of basic data
(2) procedures for processing data (3) techniques used for areas where
data coverage is not adequate and (4) the reliability and representative
nature of the data and accuracy of computed pumpage
Acknowledgments
Appreciation is expressed to the Pacific Gas and Electric Co
Southern California Edison Co Southern California Gas Co and Kern
County Land Co and to their engineers who supplied information on
pumpage pumping-plant efficiency tests agricultural power and agrishy
cultural power usage The writers are grateful for the cooperation and
assistance received from city and county officials and other federal
and state agencies
MUNICIPAL PUMPAGE
Data on the volume of ground water pumped for municipal use were
obtained from 27 communities ranging in population from about 1000 to
145000 The reported volume of water used by each community was
divided by its population to determine a per capita use factor the
factors are shown in the following table
Number of1Annual per capita use factor in acre-feetPopulation 1samples Low1High1Average
Less than 3000 6 014 033 025
3000 - 1000o 11 17 44 30
More than 10000 10 28 46 38
For two communities of more than 10000 population in northern San Joaquin
Valley (not included in the table above) per capita use averaged only
025 acre-foot however the communities were served by a private water
company and the average use figure did not include pumpage from numerous
large industrial wells
The data indicate that for small communities supplying little or no
water to industry the annual per capita use factor averages about
025 acre-foot For communities supplying water to industry the average
factor ranges from 030 to 040 acre-foot depending upon size of the
community and number of industries Thus the volume of ground water
pumped for municipal use can be estimated by multiplying the population
of a community by the appropriate annual per capita use factor
5
AGRICULTURAL PUMPAGE
Data Collection
Total annual consumption of electricity and natural gas for pumping
ground water and data from pumping-plant efficiency tests are acquired
from the major utility companies in central California
In the San Joaquin Valley data on total annual electric power
consumption used for agricultural pumping of ground water are acquired
from the Pacific Gas and Electric Co and the Southern California
Edison Co total annual consumption of natural gas used for pumping
ground water is obtained from the Southern California Gas Co Data on
use prior to 1966 were acquired where available from company archives
Gas-consumption records prior to 1965 are not available Individual
accounts of electrical power or natural gas consumption for agricultural
use are summed for total energy consumed in unit areas
Utility companies in California make pumping-plant efficiency tests
as a service to customers These tests provide much of the information
required for computing ground-water pumpage such as the number of
kilowatt-hours required to pump 1 acre-foot of water
6
Description of Estimation Methods
Agricultural ground-water pumpages are computed on an annual basis
per unit area The unit area selected for the San Joaquin Valley is a
quarter of a township for larger areas pumpages from the unit areas
are summed
Estimates from Electrical Power
Two techniques can be used for estimating ground-water pumpage from
electrical power consumption one uses the efficiency-lift method and
the other uses the coefficient of power method To compute pumpage on
an areal basis the coefficient of power method was used in preference
to the efficiency-lift method because more data are available for the
coefficient of power method
7
Using the equation based on a coefficient of power consumption annual
pumpage is computed as follows
kwhryr QY1P
c
5430 Pi=P1c
where
annual pumpage in acre-feet
P = coefficient of power consumption in kilowatt-hours per acre-footc from pump-efficiency tests
P = input to motor in kilowatts from pump-efficiency tests
discharge in gpm (gallons per minute) from pump-efficiency tests
1kwhr1 kw
acre-ft bull minhr x ft3gal x acre-1ftft31galmin
11 kw x1bull60 x 1748 x 1435601galmin
bull 5430 kw galmin
Using this technique data required for calculating areal pumpage include
(1) Total kilowatt-hours of power used per unit area per year from power
data and (2) average coefficient of power consumption per unit area
per year Thus in each unit area
Ekwhryr gy EP c
nP c
where nP = number of coefficient of power-consumption testsc
8
Estimates From Internal-Combustion Engines Using Gas
Most ground water used for agriculture in California is pumped
electrically However in areas where electricity is not readily availshy
able or where there is a ready source of natural gas pumps may be driven
by internal-combustion engines To lift 1 acre-foot of water 1 foot at
100 percent efficiency requires 137 brake hp-hr (horsepower-hours)
Therefore the volume of gas to lift 1 acre-foot of water 1 foot for a
single well is
137 hp-hr1 100cubic feet of gas1V xQ acre-ftft1hp-hr
where
VQ = volume of gas in cubic feet required to lift 1 acre-foot of
water 1 foot
= efficiency in percentage
In Kern County about 11 cubic feet of gas are required to produce
1 brake horsepower-hour and on the average the engines operate at
60 percent efficiency Placing these figures in the equation the volume
of gas used is 31137 hp-hr 11 ft 100
Vacre-ftft160Q1 hp-hr1
251 cubic feet of gas per acre-foot per foot
9
Utility companies often bill for gas used in units of 1000 cubic
feet (MCF) The equation used to compute pumpage of water in acre-feet
is as follows
MCF x 1000 V H
and by substitution
MCF x 10001398 MCF gy =1251 H
where
H = total lift in feet
MCF = gas consumption in units of 1000 cubic feet reported by
utility company Annual pumpage per unit area is computed as follows
398E MCF Qy -1H
a
where
EMCF = total gas used per unit area
H = estimated average total lift in feet per unit areaa
10
Data Processing
Estimates From Electrical Power
The data that are used for computing pumpage from power data are
taken from the plant-efficiency tests and records of annual electrical
power consumption Data are punched onto two separate sets of cards of
identical format The mutual data card (fig 1) consists of 14 fields
A description of the 14 fields follows
(Fields 1 through 4 are used for both sets of cards)
Field 1 REFERENCE NUMBER The company account number used to
identify the original data
Field 2 LOCATION The location of each pumping plant in reference
to the California land grid system Locations are determined to the
nearest section
Field 3 DATE MEASURED The date of the test or the year of the
annual kilowatt-hour totals
Field 4 H P Horsepower of the pump motor
(Fields 5 through 13 are used for plant-efficiency test cards only)
Field 5 SWL BELOW LSD (FELT) Static water level below land-
surface datum in feet
Field 6 SWL BELOW 0 PUMP (FELT) Static water level below the
center of the discharge of the pump head in feet
Field 7 DRAWDOWN (iihET) The decline in water level in feet
resulting from pumping
11
Field 8 PWL BELOW 0 PUMP (FEET) Pumping water level below
the center of the discharge of the pump head in feet
Field 9 DISCH L ABOVE 0 PUMP (FEET) Discharge level above the
center of the discharge of the pump head or total discharge pressure
head in feet
Field 10 YIELD OF WELL (GPM) Discharge of the well in gallons
per minute
Field 11 TEMP (degF) Temperature of the water from the well in
degrees Fahrenheit
Field 12 KWHR PER ACRE-FT Number of kilowatt-hours used to
pump 1 acre-foot of water--the coefficient of power consumption
Field 13 EFF The percentage efficiency for the wire to water
relation of power output to power input X 100
(Field 14 is used on electric power consumption cards only)
Field 14 ACCUMULATED KWHR The annual total kilowatt-hours of
electric power used
Entries in field 12 and field 13 are edited on the basis of inspecshy
tion before punching to delete some data that are notably different
than other tests in a given area Plant-efficiency tests where the
efficiencies are very low compared to other tests (less than 40 percent
for example) or where the discharge levels above the pumps are very
high (more than 30 feet for example due to sprinklers or other reasons)
the listed coefficients of power consumption probably are too high
12
SWL SWL P W L COCA L ORAN TIELOOF 144$ HRREFERE1RCE DATE BELOW BELOW BELOW ABOVE TEMP EFF ACCUMULATEDLOCATION H P DOWN WELL PE11UMOE R MEASURED LSD 4 PUMP 4 PUMP 4 POMP 1bull11 W 440
(FEET) I0 w) ACRE-FT (FEET) (FEET) (FEET) )FEET)
Raj 0 Lf R
0 1 1 0 0 0 0 0 0 0 T ils011 10 0 0 0 00 0 0 0 00 000To 000 010 oak oo o olo oo oio oI o oio osi000000000 0000O 11 0 0 0 0 0 0 0 0 012 3 4 5 1 71 17177 I7M1604 I0 223 24 5242112)0934)3I31t334351137 40 4114142444$4444 4141 5051 52 53 54 510467 W 11uu NN viscosionnnmmm 771MW
11 1 1 1 1 1 11 1 1 1 1 1 1 1 11 111111 1 1 111 1 1 1 11 1 1 1 111 1 1 1 1 11111 1 11 1 111111111 1 1 1 111 1 11111111111 1 1 11
2 2 2 2 2 2 2 1 2 2 2 2 2 2 2 2 12 2 2 2 2 2 2 2 2 212 2 2 2 212 2 2 2 212 2 2 21 2 12 21 2 2 2 22 2222122222 2 2 2 212 2 212 2 2 2 1 2 12 2 1122 1 1
3 3 3 3 3 3 3 3 3 3 3 3 3 3 3 3 3 3 3 3 3 3 3 3 3 3 313 3 3 3 313 3 3 3 313 3 3 313 3 3 3 33 3 3 33 3333133333 3 3 3 31 3 3 31 3 3 3 3 3 3 3 3 3 3 3 3 3
4 4 4 4 4 4 4 4 4 4 4 4 4 4 4 4 4 4 4 4 4 4 4 4 4 4 41 4 4 4 4 4 1 4 4 4 4 4 11 4 4 4 44 4 4 4 44 4 4 44 44441 44444 4 4 4 41 4 4 44 4 4 4 4 4 4 4 4 4 4 4 4
1 5 5 5 5 5 5 5 5 5 5 5 5 5 5 5 5 5 5 5 5 5 5 5 5 5 5 55 5 5 5 51 5 5 5 5 55 5 5 515 5 5 5 515 5 5 55 555515556 555515 5 515 5 5 5 5 5 5 5 5 5 5 5 5
1 1 66 6 6 6 6 6 6 6 6 6 6 6 6 6 6 6 6 6 6 6 6 6 6 6 66 6 6 6 61 6 6 6 6 66 6 6 66 6 6 6 616 6 6 64 666646664 6 6 6 61 6 6 616 6 6 6 6 6 6 6 6 6 6 6 6
1 7 7 7 7 7 7 7 7 7 7 7 7 7 77 7 7 7 7 7 7 7 7 77 71 7 77 77 7 7 7 7 717 7 7 77 7 7 7 77 7 7 7 7 77771777717 7 7 7 7 1 7 7 717 7 7 7 7 7 7 7 7 7 7 7 7
8 I 8 I I 1 8 I I 118 818118 118 8 81 8 1 111 I I 81 8 8 1111 8111 88814 1111411T 18114 1 1 1 1 1 1 1 1 8 I 8 1 8 8 11 1
9 9 9 9 9 9 9 9 319 9 9 9 9 9 9 9 9 9 9 9 9 9 9 9 9 919 9 9 9 99 9 9 9 99 9996 99991194 199919991999919 5 1 9 9 9 9 99 9 9 9 9 9 9 9 3 4 5 4 7 I1 14 11 11 13 1475 16 17Al ismr12232 25 26 314 21 31 11 343v 316 371174 bdquo474 41447 4344 45 NH 441 5111404 5 51 54 5515667 54 Sela 61 43 1114 4 170041 71 77 11 P4 75 14 17 isoe
14104 1874615
A--Used for electric-pour data and efficiency tests
REFERENCE LICA T I ON DATE LIFT ACCUMULATED NAOMI (YEARNFEET) VCF
11111110000111110M11111111 11111 S111111111111111110111111111111111111111111111 12541171liona0wissnmo11diams717e11en annul mnanomeamotasairesememmisownssememmossweismnitumunmes
1111111111111111111111111111111111101111111111111111111111111111111111111111111I
222222227222222222722222222222222 2222222222222222222222222222222222222222222222
333333333333333333333333333333333133333333333333333333333333333333333333333333333
44444444444444444444444444444444404444444444444444444444444444444444444444444444
5555555555555555555555555555555551 55555555555555555555555555555555555555555555$ 1
6666666616666666661666166666666666666666666666666S6666666F6666566$6111116$6$166$
771777777777777777717777777777777177717177777777777777717177777717777771171777777
111111111111111111181111111$111111101111111111111111111111111111111111111111111111 I
1119999911199999918199 P1999111919901919999991993999919991999111919999111111111111
GAME NOSTANDARD FORM 5081
B--Used for gas-consumption data
FIGURE 1--Data cards
13
1
Agricultural power (nonextractive power) not used for ground-water
pumpage is eliminated prior to punching field 14 Records available for
some areas indicate use of power for shops lift pumps wind machines
and other nonextractive purposes For other accounts the service
address and listed horsepower are clues to nonextractive use of power
Where records are not available to indicate use of power nonextractive
power is identified or estimated on the basis of discussions with
personnel of the public utility companies
Both sets of cards are sorted by year and by unit area The data
in fields 4 to 13 of both sets of cards are averaged and in field 14
of the power-consumption cards data are summed However only the
results from fields 12 and 14 (averaged coefficient of power consumption
from efficiency test cards and total kilowatt-hours from the power-
consumption cards) are used by the computer for estimating pumpage
Data in fields 4 to 11 and field 13 are averaged at the request of the
cooperator and as an aid for estimating pumpage for certain unit areas
described in the following paragraph that are not computed during the
first computer run In addition the average horsepower from field 4
of the power-consumption cards and annual pumpage per unit area are
used in a check program described later For each unit area the total
power used divided by the average coefficient of powr consumption gives
annual pumpage
14
Because the areal distribution of plant-efficiency tests is not
uniform some unit areas for which there are power totals (from the
power-consumption cards) lack values for average coefficient of power
consumption (from plant-efficiency test cards) Consequently pumpages
are not estimated for those unit areas during the first computer run
For each of those unit areas and for areas in which the ccefficient of
power values are averaged from three efficiency tests or less or where
sprinklers predominate an average coefficient of power consumption and
a value for pumpage is determined in the following manner (1) For a
given area such as power district or county a least-squares regression
relation is computed between total lift and kilowatt-hours per acre foot
using data from the listed plant-efficiency tests (2) lift for the unit
areas is determined from maps showing either static or pumping water
levels An estimated drawdown is added to static water levels in order
to get an estimated pumping level Average pmmping lift in each unit
area is considered to be the average pumping depth to water plus an
estimated head due to sprinklers--if present The head due to sprinklers
is estimated by averaging the values greater than 50 feet for discharge
level above the reference point listed in the plant-efficiency test
records (3) an estimated value for average kilowatt-hours per acre-foot
for each unit area then is determined from the least-squares relation
The coefficients of power consumption for the unit areas are punched onto
cards which are keyed to sections lying within the unit areas These
cards are combined with the efficiency-test cards and the pumpages for
all unit areas are recomputed in a second computer run
15
Estimates From Gas Consumption
Data used for computing pumpage by internal-combustion engines are
punched onto one set of cards (fig 1) having five fields as follows
Field 1 REFERENCE NUMBER The company account number used to
identify the original data
Field 2 LOCATION The location of each pumping plant in reference
to the California land grid system Locations are determined to the
nearest section
Field 3 DATE The year of annual gas-consumption totals
Field h LIFT (FEET) he total lift from the pumping water level
to the discharge level in feet
Field 5 ACCUMULATED MCF The total annual gas consumption in
thousands of cubic feet
Data taken from gas-consumption records are punched onto fields 1
2 3 and 5 Values for lift for each unit area are estimated from maps
showing static or pumping water levels and punched onto field 4 of cards
keyed to the proper year and to sections within the unit areas The
cards are combined and pumpage computed as described on page 10
16
Reliability of Fjstimation Methods
Quality Control
Before and after pumpage is computed checks are made to verify the
reliability of the data and the data decks The data decks are checked
for (1) punching errors (2) location descriptions (3) water levels and
associated drawdowns and (4) any anomalies occurring among lift
kilowatt-hours per acre-foot and kilowatt-hours per acre-foot per foot
Also random-sample computations of pumpage are made manually to verify
machine computations In addition through a subsidiary program the
average discharge per well is computed and checked against known
discharges from tested wells in the area The equation that is used to
compute average discharge per well is as follows
KQyavg =
nL 100
where1 avg = average discharge per well in gallons per minute
pumpage in acre-foot per year
325850 galacre-ft1galyr- 062
- 365 dayyr x 1440 minday1acre-ftmin
number of accounts
L1= load factor (approximate percentage of time wells operate in year)
In the above equation the load factor L is computed as follows
Ekwhr per unit areayr Ehp per unit area x 07457 kwhp x 100
8760 hryr
Ekwhr 001531 Ehp
17
Accuracy of Results
A statistical analysis of pumpage in selected areas of Kern County
by Allison (1967 p 44-61) is based on records of power used for pumping
and results of pumping-plant efficiency tests Results of that analysis
include (1) The variance in efficiency is small relative to the number
of tests available and the mean value of efficiency for any given area
can be estimated accurately (2) the primary factor in the variation of
efficiency is the variation of pumping lift (3) the tests are spaced
throughout the pumping season and are indicative of dynamic conditions
(4) measurements of lift and efficiency are integrated in the computation
of the coefficient of power consumption (5) the probable error in the
estimation of pumpage is a function of the number of tests on which the
coefficient of power consumption are made and (6) the number of tests made
is closely related to the number of pumping plants in any given area and
to the total volume of water pumped In an example for one township
(Allison 1967 p 53) where the number of tests ranged from 4 to 49 the
probable error in estimation of pumpage ranged from 125 to 40 percent
Because the major cause c)f change in the power-consumption coefficient
is the pumping lift the most precise method for estimating pumpage
probably would be one incorporating more information on pumping lift and
fewer efficiency tests However there are few areas in California where
pumping levels are measured frequently enough to define the mean pumping
lift during the irrigation season
18
In order to determine the accuracy of pumpage computations from
electric-power consumption computed pumpage was compared with metered
pumpage for selected wells in Santa Clara County (table 1) and in Fresno
County The comparison indicates that the difference between computed
and metered pumpage is less than 10 percent One- and 5-year averages
are shown because instances occur where a 1-year average in a single
township will not include enough tests to provide a reliable value for
coefficient of power consumption
Ground-water pumpage from about 200 wells in T 6 S R 1 W
Santa Clara County was computed by using average pumping-plant
efficiency and average pumping lift per township as determined from
efficiency tests and a depth to water map The water meters used to
measure pumpage were new and were calibrated at the factory to record
within a maximum error of 2 percent As shown in table 1 the computed
pumpage was about 1 percent larger than metered pumpage from the same
wells in T 6 S R 1 W and about 11 percent larger in T 6 S R1E
A further comparison of computed and metered pumpage was made for
Santa Clara County by using average coefficients of power consumption
per township Pumpage computed by using the average power-consumption
coefficient for 1966 was about 26 percent larger than metered pumpage
pumpage computed by using the average 5-year power consumption coeffishy
cient (1962-66) was 40 percent larger than metered pumpage in
T 6 S R 1 W and 92 percent larger in 6 S R 1 E
19
Table 1--Comparison of computed and metered pumpage
Santa Clara County 1966
[Using average pumping-plant efficiency and average lift per township]
Township Metered Computed Difference between metered and and 1 pumpage pumpage 1computed pumpage
range
1
1 (percent) (acre-ft)(acre-ft)
6siE 43904 48542 106
6slw 90204 90984 87
Using average coefficient of power consumption per township
Computed pumpage Difference between metered and
1
Township Metered 1bull computed pumpage and 1
(acre-ft) pumpage 1 (percent)
range 1bull(acre-ft) 1 year 15 years bull bull 1-year average 5-year average
6s1E 43904 45056 47960 126 192
6siw 190204 92643 93810 127 14o
20
A similar comparison was made in T 13 S R 20 E Fresno County
using 1960 data for selected wells of the Fresno County Waterworks
The computed pumpage was 54 percent larger than metered pumpage
In Madera County pumpage computed by use of the average coefficient
of power consumption per township for 1960 and that computed by use of
the 5-year average coefficient (1960-64) differed by only 4 percent
The small difference may indicate that where distribution of plant-
efficiency tests is limited and where changes in average lift are not
great pumpage probably can be computed by using either a 1- or 5-year
average coefficient
Regardless of the method used pumpage computed per township is
reasonably close to metered pumpage However when power consumption
is totaled by section and divided by an average coefficient of power
consumption per township computed pumpage ranges from 37 percent less
to 83 percent more than metered pumpage in the Santa Clara County
test area
21
SELECTED REFERENCES
Allison Stephen V 1967 Cost precision and value relationships of
data collection and design activities in water development
planning California Univ Berkeley Water Resources Center
cont 120 Tech rept 142 p
Evenson R E 1961 Ground-water pumpage in the Santa Ynez Valley
California US Geol Survey open-file rept 24 p
McClelland E J 1963 Methods of estimating ground-water pumpage
in California US Geol Survey open-file rept 19 p
Ogilbee William 1966 Progress report--methods for estimating groundshy
water withdrawals in Madera County California US Geol Survey
open-file rept 42 p
Ogilbee William and Rose Maxine A 1969 Ground-water pumpage in
Kern County San Joaquin Valley California 1962-66 US Geol
Survey basic-data compilation 5 p
22
r
iiiilfigliNtipptili
- Page 1
- Page 2
- Page 3
- Page 4
- Page 5
- Page 6
- Page 7
- Page 8
- Page 9
- Page 10
- Page 11
- Page 12
- Page 13
- Page 14
- Page 15
- Page 16
- Page 17
- Page 18
- Page 19
- Page 20
- Page 21
- Page 22
- Page 23
- Page 24
- Page 25
- Page 26
- Page 27
-
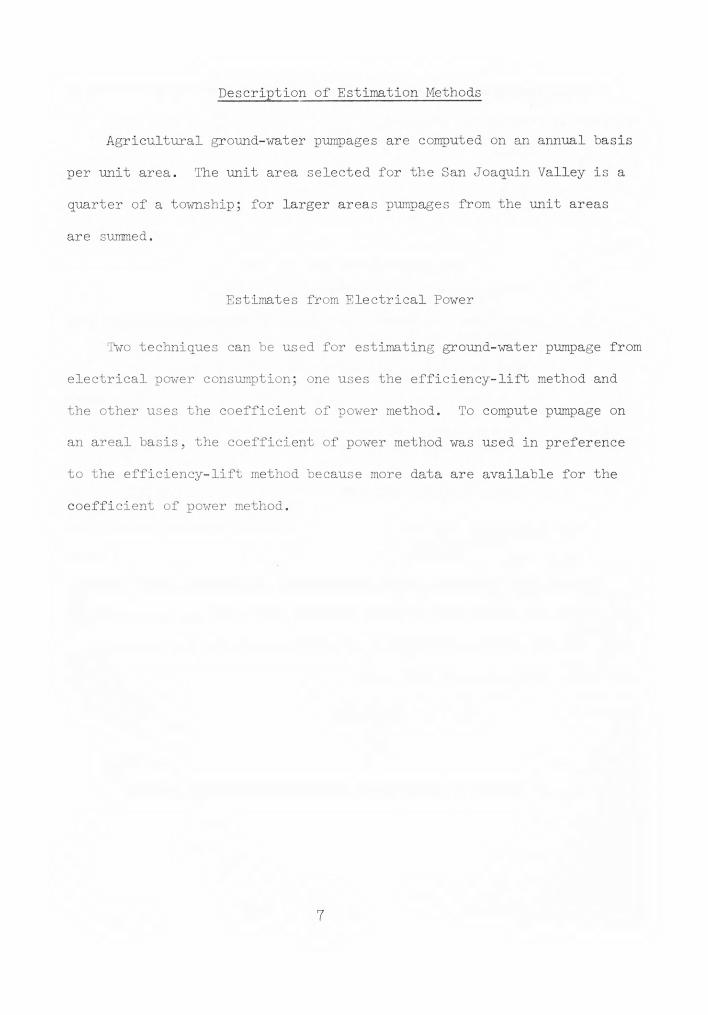
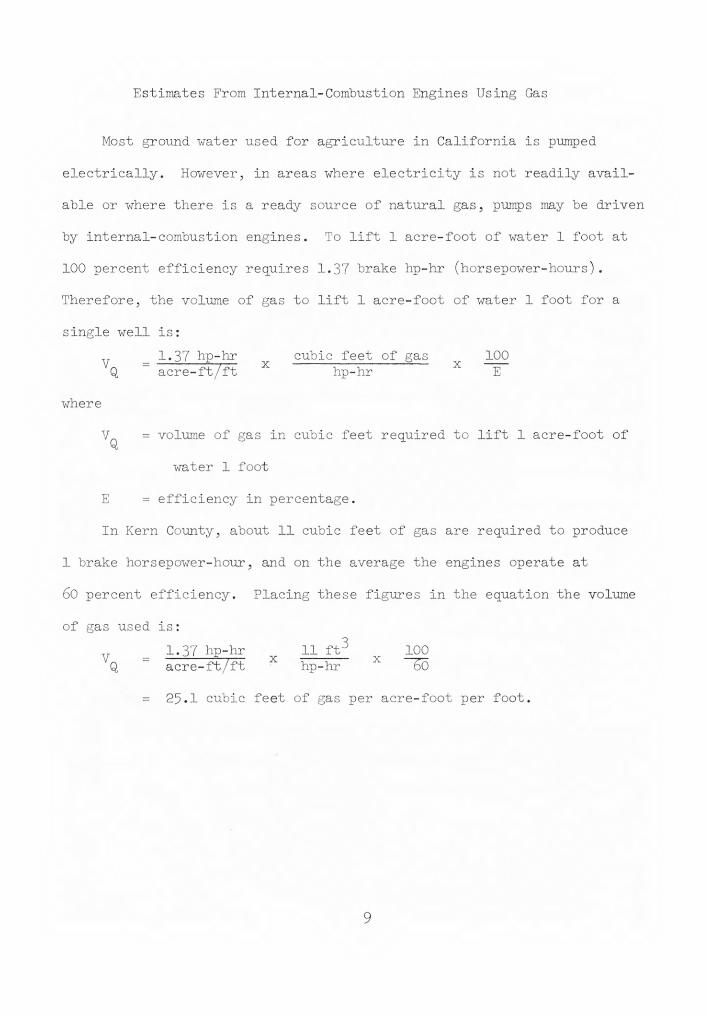
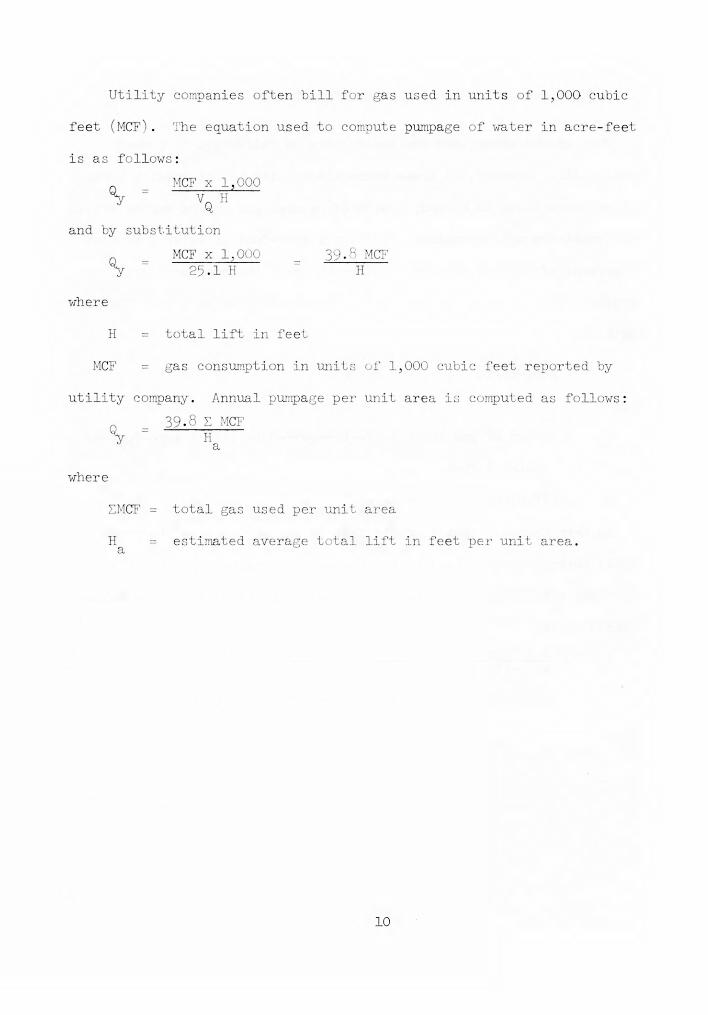

r
iiiilfigliNtipptili
- Page 1
- Page 2
- Page 3
- Page 4
- Page 5
- Page 6
- Page 7
- Page 8
- Page 9
- Page 10
- Page 11
- Page 12
- Page 13
- Page 14
- Page 15
- Page 16
- Page 17
- Page 18
- Page 19
- Page 20
- Page 21
- Page 22
- Page 23
- Page 24
- Page 25
- Page 26
- Page 27
-