estimating continuing value presented by supatcharee hengboriboonpong kittanai pongsak chapter 12
TRANSCRIPT
Estimating Continuing ValueEstimating Continuing Value
Presented byPresented by
Supatcharee Supatcharee HengboriboonpongHengboriboonpong
Kittanai PongsakKittanai Pongsak
Chapter 12
OutlineOutline• Estimating Continuing Value
• Continuing Value Formula for DCF Valuation
• Continuing Value Formula for Economic Profit Valuation
• Interpretation of Continuing Value
• Parameters for Continuing Value Variables
• Common Pitfalls
• Evaluating Other Approaches
Value =Value =
PV of CF PV of CF duringduring + PV of CF + PV of CF afterafter
Explicit forecastExplicit forecast explicit explicit forecastforecast
periodperiod periodperiod
Continuing Value =Continuing Value =
The value of the company’s The value of the company’s expected cash flow beyond expected cash flow beyond the explicit forecast period.the explicit forecast period.
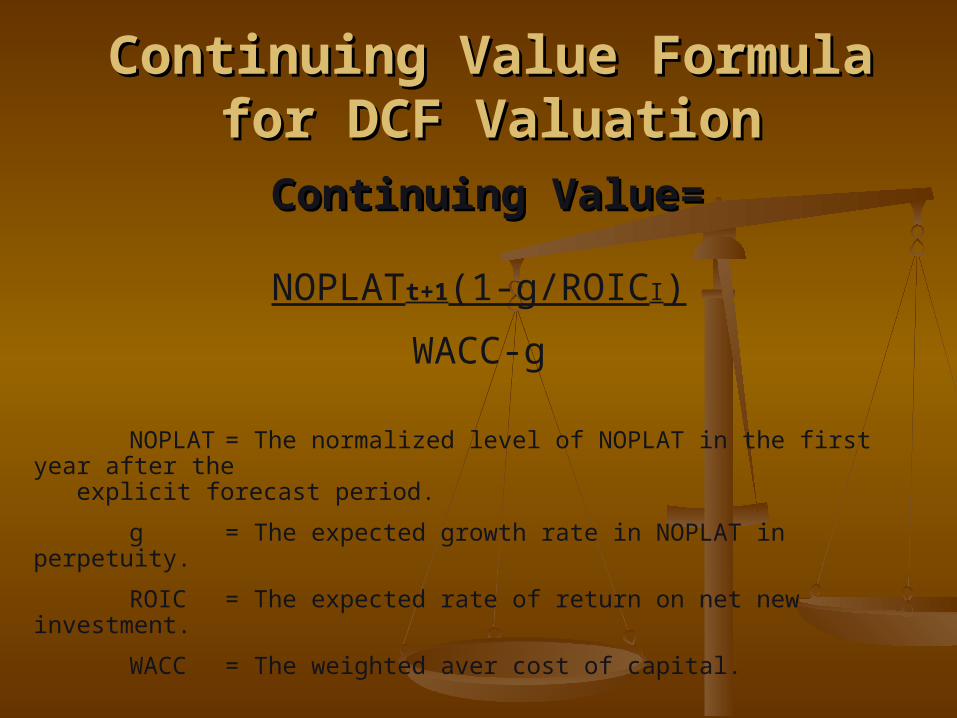
Continuing Value Formula for Continuing Value Formula for DCF ValuationDCF Valuation
Continuing Value=Continuing Value=
NOPLATt+1(1-g/ROICI)
WACC-g
NOPLAT= The normalized level of NOPLAT in the first year after the explicit forecast period.
g = The expected growth rate in NOPLAT in perpetuity.
ROIC = The expected rate of return on net new investment.
WACC = The weighted aver cost of capital.
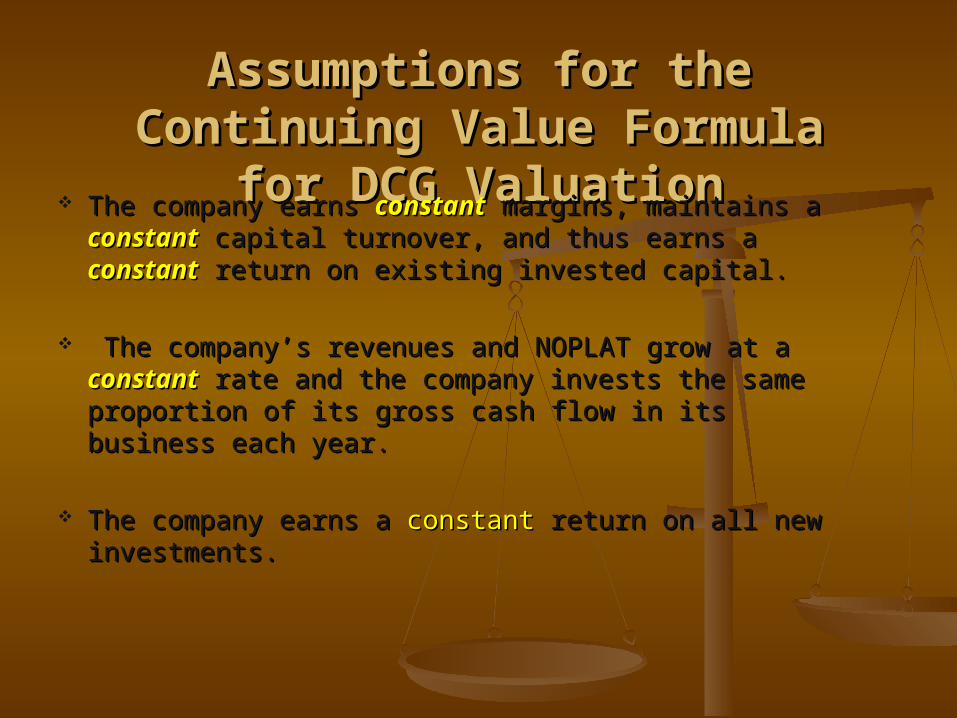
Assumptions for the Continuing Assumptions for the Continuing Value Formula for DCG ValuationValue Formula for DCG Valuation
The company earns The company earns constantconstant margins, maintains a margins, maintains a constantconstant capital turnover, and thus earns a capital turnover, and thus earns a constantconstant return on existing invested capital.return on existing invested capital.
The company’s revenues and NOPLAT grow at a The company’s revenues and NOPLAT grow at a constantconstant rate and the company invests the same rate and the company invests the same proportion of its gross cash flow in its business each proportion of its gross cash flow in its business each year.year.
The company earns a The company earns a constantconstant return on all new return on all new investments.investments.
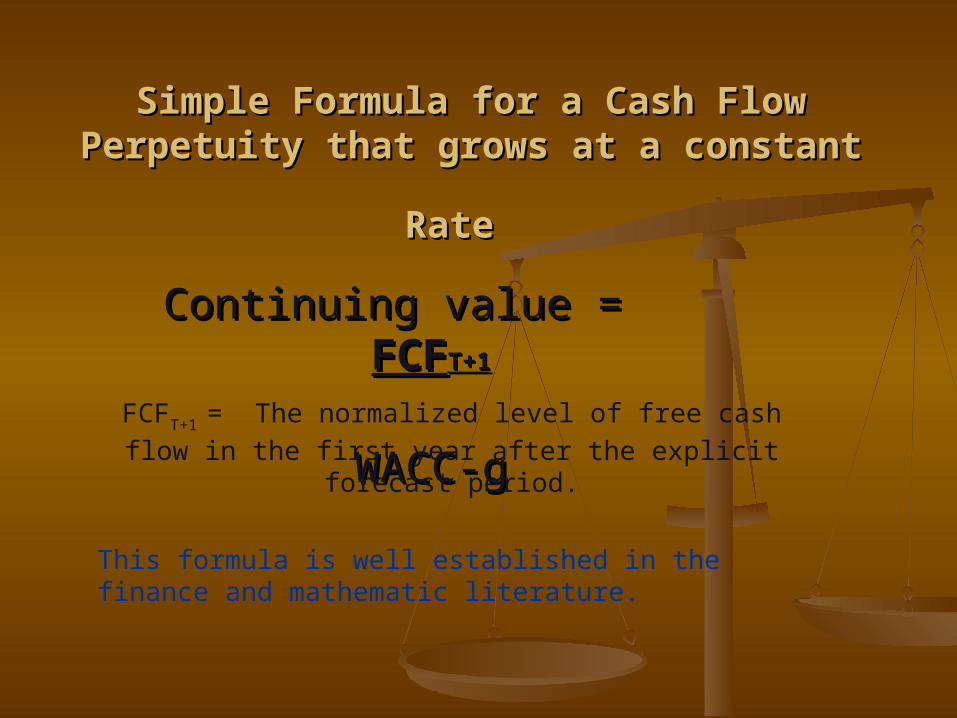
Simple Formula for a Cash Flow Perpetuity Simple Formula for a Cash Flow Perpetuity
that grows at a constant Ratethat grows at a constant Rate
Continuing value = Continuing value = FCFFCFT+1T+1
WACC-gWACC-gFCFT+1 = The normalized level of free cash flow in the first
year after the explicit forecast period.
This formula is well established in the finance and mathematic literature.
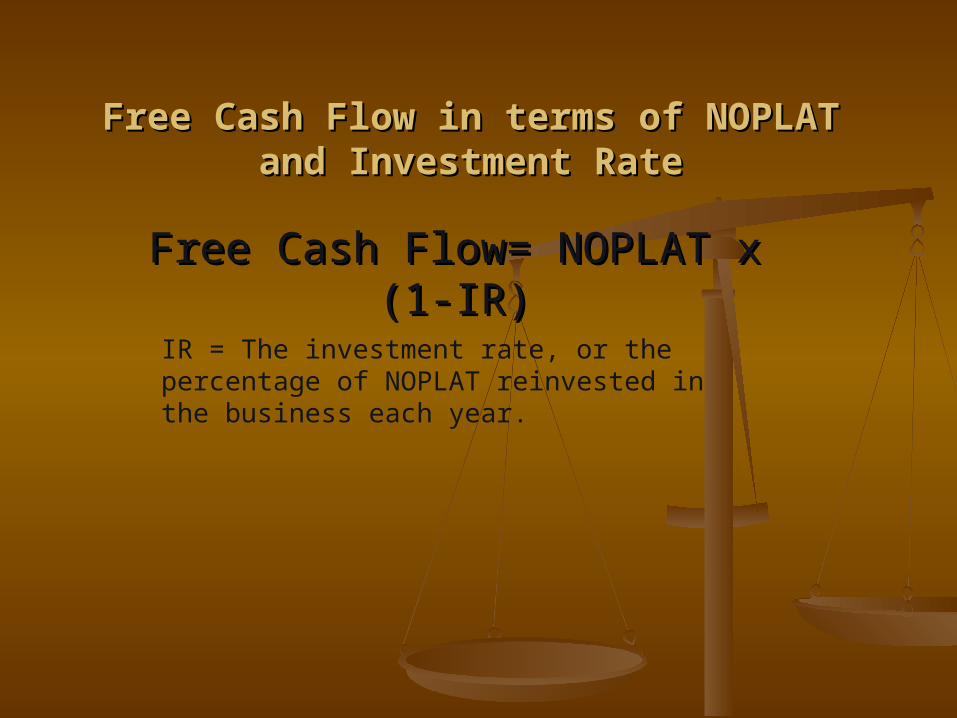
Free Cash Flow in terms of NOPLAT and Free Cash Flow in terms of NOPLAT and Investment RateInvestment Rate
Free Cash Flow= NOPLAT x (1-Free Cash Flow= NOPLAT x (1-IR)IR)
IR = The investment rate, or the percentage of NOPLAT reinvested in the business each year.

Relationship between Relationship between IRIR, , gg and and ROICROICII
gg == ROICROICII xx IRIR IR IR == gg/ ROIC/ ROICII
Now build this into the free cash flow (FCF) definitionNow build this into the free cash flow (FCF) definition
FCF = NOPLAT x 1 - FCF = NOPLAT x 1 - gg
ROICROICII
Substituting for FCF gives the value driver formulaSubstituting for FCF gives the value driver formula
Continuing value = NOPLAT (1-g/ROIC)Continuing value = NOPLAT (1-g/ROIC)
WACC-gWACC-g
Also Known AsAlso Known AsValue-Driver FormulaValue-Driver Formula
Because the input Because the input variables ofvariables of
GrowthGrowth, , ROICROIC and and WACCWACC
are the key drives of are the key drives of
ValueValue
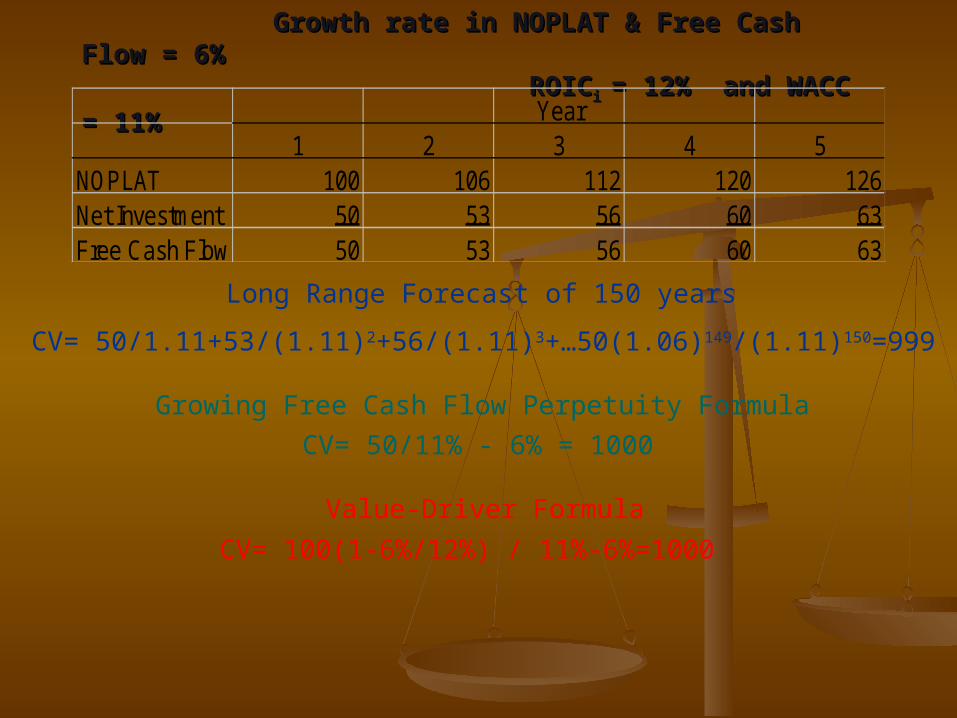
Growth rate in NOPLAT & Free Cash Flow = 6%Growth rate in NOPLAT & Free Cash Flow = 6% ROIC ROICi i = 12% and WACC = 11%= 12% and WACC = 11%
Year1 2 3 4 5
NOPLAT 100 106 112 120 126Net Investment 50 53 56 60 63Free Cash Flow 50 53 56 60 63
CV= 50/1.11+53/(1.11)2+56/(1.11)3+…50(1.06)149/(1.11)150=999
Long Range Forecast of 150 years
Growing Free Cash Flow Perpetuity Formula
CV= 50/11% - 6% = 1000
Value-Driver Formula
CV= 100(1-6%/12%) / 11%-6%=1000

Recommended Continuing Value Recommended Continuing Value Formula for Economic Profit Formula for Economic Profit
ValuationValuation
With the economic profit With the economic profit approach, the continuing value approach, the continuing value does notdoes not represent the value of represent the value of the company after the explicit the company after the explicit forecast period. forecast period.
Instead, it is the Instead, it is the incremental valueincremental value over the company’s invested over the company’s invested capital at the end of the explicit capital at the end of the explicit forecast periodforecast period

Value =Value =Invested capital at the beginning of the period Invested capital at the beginning of the period
++Present value of forecasted economic profit Present value of forecasted economic profit
duringduring explicit forecast period explicit forecast period ++
Present value of forecasted economic profit Present value of forecasted economic profit afterafter the explicit forecast period the explicit forecast period
CV formula for Economic Profit Valuation
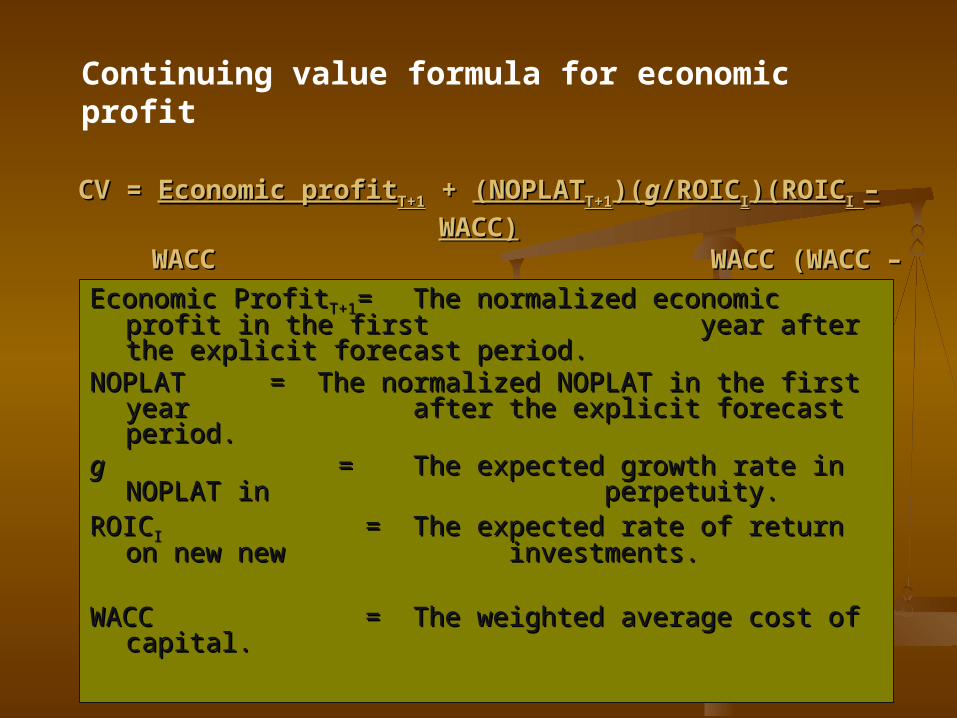
CV = CV = Economic profitEconomic profitT+1T+1 + + (NOPLAT(NOPLAT
T+1T+1)()(gg/ROIC/ROICII)(ROIC)(ROIC
I I – WACC)– WACC)
WACC WACC (WACC – WACC WACC (WACC – gg))
Economic ProfitEconomic ProfitT+1T+1== The normalized economic profit in The normalized economic profit in the first the first year after the explicit year after the explicit forecast period.forecast period.
NOPLATNOPLAT = = The normalized NOPLAT in the first year The normalized NOPLAT in the first year after the explicit forecast period.after the explicit forecast period.
gg == The expected growth rate in The expected growth rate in NOPLAT in NOPLAT in perpetuity.perpetuity.
ROICROICII = = The expected rate of return on The expected rate of return on new new new new investments.investments.
WACCWACC = = The weighted average cost of The weighted average cost of capital.capital.
Continuing value formula for economic profit

Issues in the Interpretation of Issues in the Interpretation of Continuing ValueContinuing Value
Three common misunderstandings Three common misunderstandings about continuing value:about continuing value:
The perception that the length of the forecast The perception that the length of the forecast affects the value of the companyaffects the value of the company
The confusion about the ROIC assumption in the The confusion about the ROIC assumption in the
continuing value periodcontinuing value period
All the company’s value is created after the All the company’s value is created after the explicit forecast periodexplicit forecast period
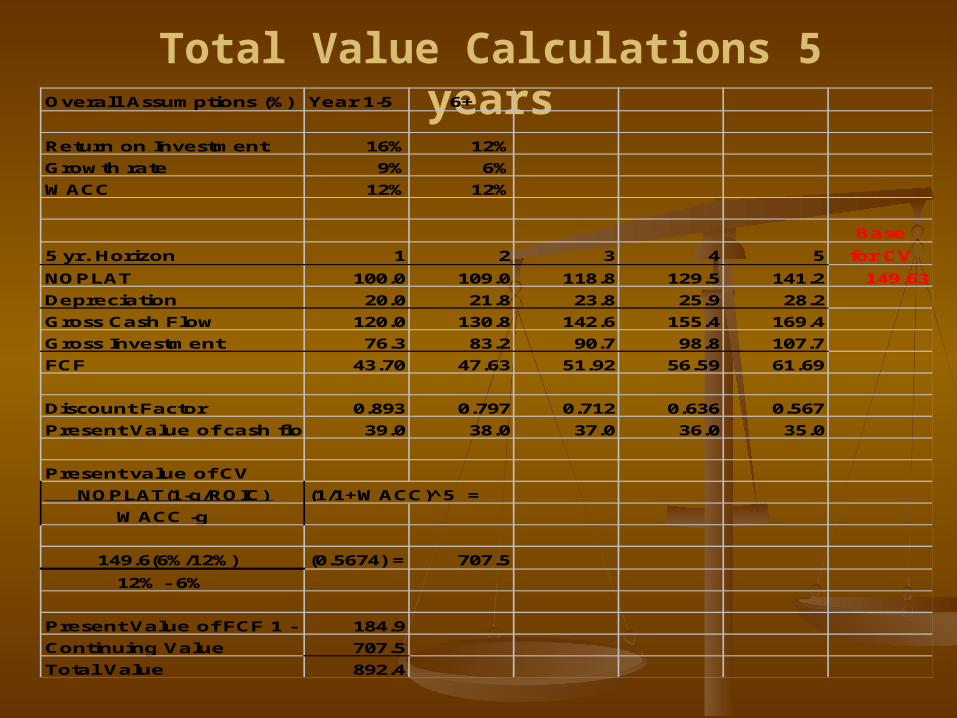
Total Value Calculations 5 yearsOverall Assumptions (%) Year 1-5 6+
Return on Investment 16% 12%
Growth rate 9% 6%
WACC 12% 12%
Base
5 yr. Horizon 1 2 3 4 5 for CV
NOPLAT 100.0 109.0 118.8 129.5 141.2 149.63
Depreciation 20.0 21.8 23.8 25.9 28.2
Gross Cash Flow 120.0 130.8 142.6 155.4 169.4
Gross Investment 76.3 83.2 90.7 98.8 107.7
FCF 43.70 47.63 51.92 56.59 61.69
Discount Factor 0.893 0.797 0.712 0.636 0.567
Present Value of cash flow 39.0 38.0 37.0 36.0 35.0
Present value of CV
NOPLAT(1-g/ROIC) (1/1+WACC)^5 =
WACC -g
149.6(6%/12%) (0.5674) = 707.5
12% - 6%
Present Value of FCF 1 - 5 184.9
Continuing Value 707.5
Total Value 892.4

Total Value Calculations 10 yearsOverall Assumptions (%) Yr 1-5 6+
Return on Investment 16% 12%Growth rate 9% 6%WACC 12% 12%
Base10 yr. Horizon 1 2 3 4 5 6 7 8 9 10 for CVNOPLAT 100.0 109.0 118.8 129.5 141.2 149.6 158.6 168.1 178.2 188.9 200.2Depreciation 20.0 21.8 23.8 25.9 28.2 29.9 31.7 33.6 35.6 37.8Gross Cash Flow 120.0 130.8 142.6 155.4 169.4 179.6 190.3 201.7 213.9 226.7Gross Investment 76.3 83.2 90.7 98.8 107.7 104.7 111.0 117.6 124.7 132.2FCF 43.70 47.63 51.92 56.59 61.69 74.85 79.37 84.13 89.18 94.53
Discount Factor 0.893 0.797 0.712 0.636 0.567 0.507 0.452 0.404 0.361 0.322Present Value of cash flow 39.0 38.0 37.0 36.0 35.0 38.0 35.9 34.0 32.2 30.4
Present value of CV NOPLAT(1-g/ROIC) (1/1+WACC)^5 = WACC -g
149.6(6%/12%) 0.322 537.3 12% - 6%
Present Value of FCF 1 - 5355.4Continuing Value 537.3Total Value 892.6
Confusion about ROICConfusion about ROIC
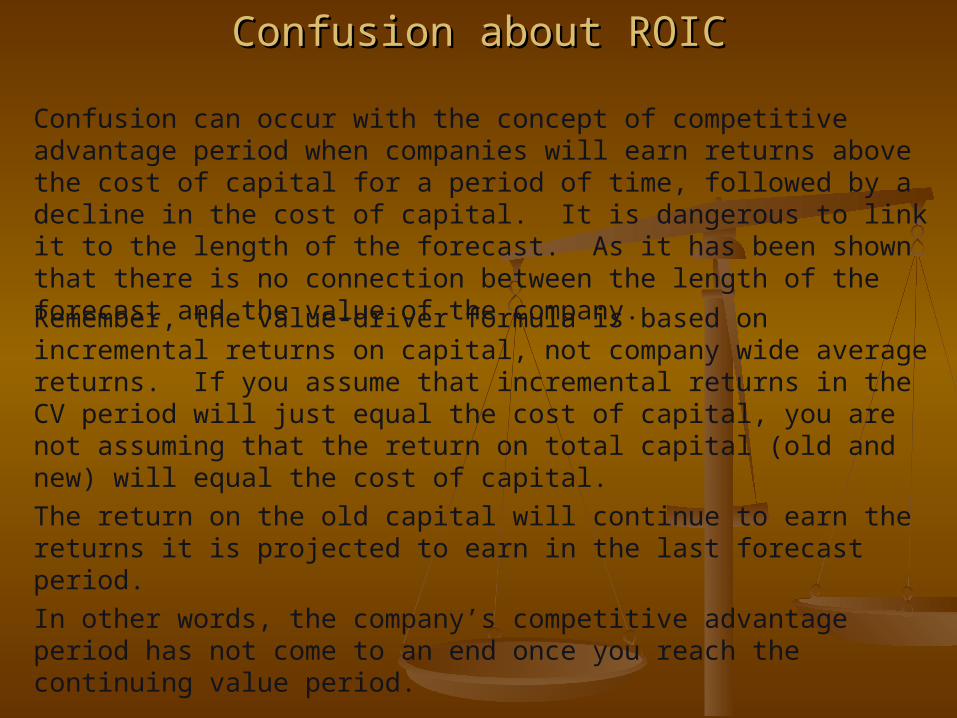
Confusion can occur with the concept of competitive advantage period when companies will earn returns above the cost of capital for a period of time, followed by a decline in the cost of capital. It is dangerous to link it to the length of the forecast. As it has been shown that there is no connection between the length of the forecast and the value of the company.
Remember, the value-driver formula is based on incremental returns on capital, not company wide average returns. If you assume that incremental returns in the CV period will just equal the cost of capital, you are not assuming that the return on total capital (old and new) will equal the cost of capital.The return on the old capital will continue to earn the returns it is projected to earn in the last forecast period.In other words, the company’s competitive advantage period has not come to an end once you reach the continuing value period.
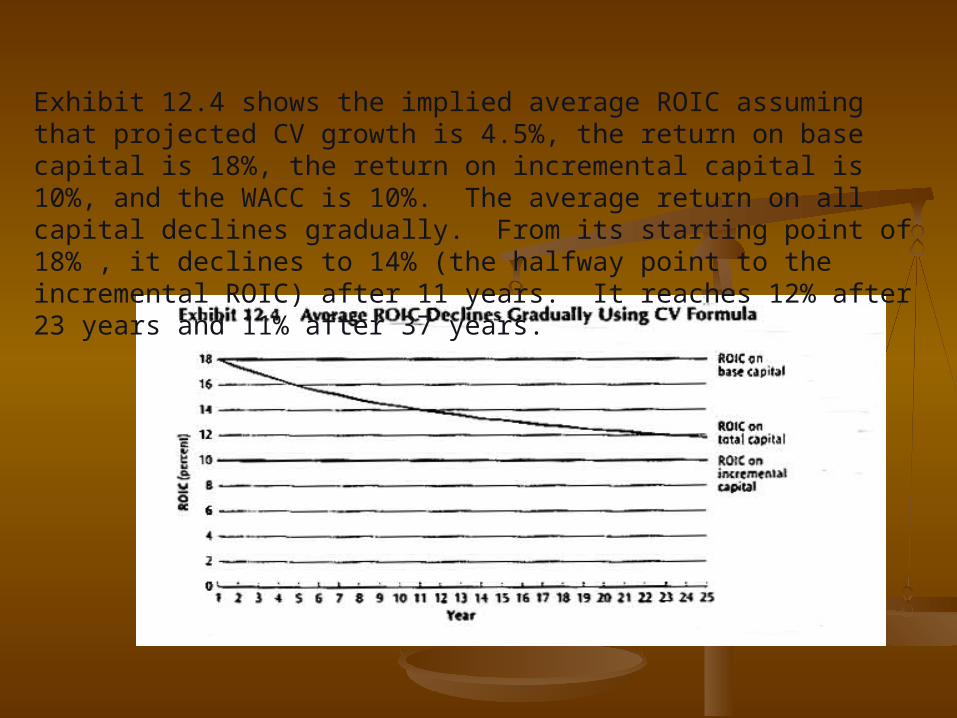
Exhibit 12.4 shows the implied average ROIC assuming that projected CV growth is 4.5%, the return on base capital is 18%, the return on incremental capital is 10%, and the WACC is 10%. The average return on all capital declines gradually. From its starting point of 18% , it declines to 14% (the halfway point to the incremental ROIC) after 11 years. It reaches 12% after 23 years and 11% after 37 years.

When is Value Created? Below, it When is Value Created? Below, it appearsappears the 85% of the the 85% of the company’s value come form the Continuing Value.company’s value come form the Continuing Value.

A Business Components ApproachA Business Components ApproachLooks at the negative cash flow when invested in a new business line Looks at the negative cash flow when invested in a new business line
and its appearance of long range value.and its appearance of long range value.
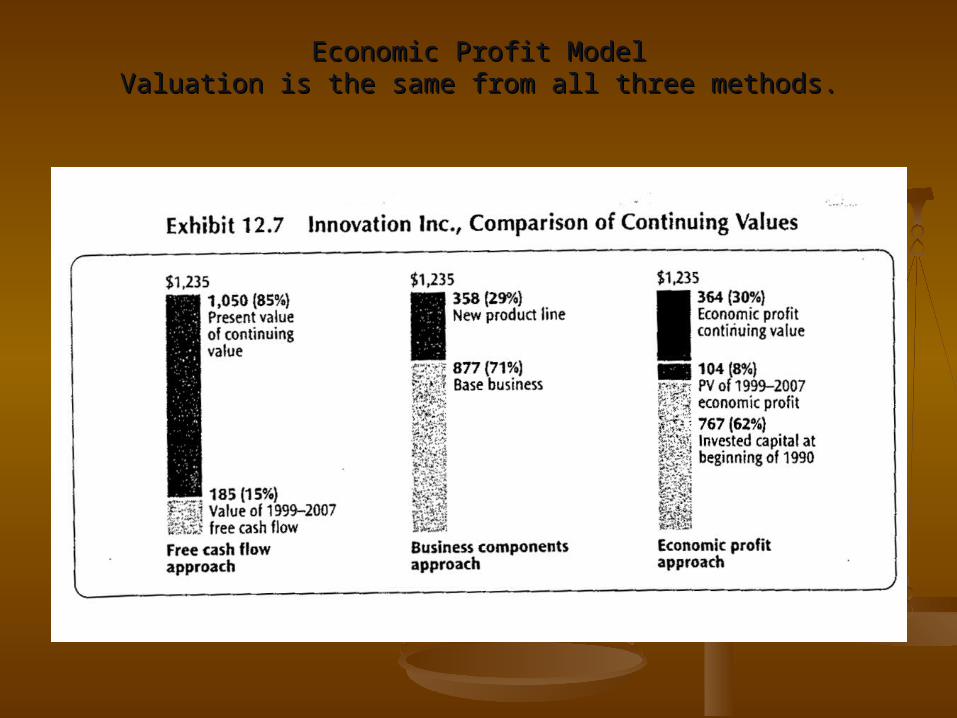
Economic Profit ModelEconomic Profit ModelValuation is the same from all three methods.Valuation is the same from all three methods.
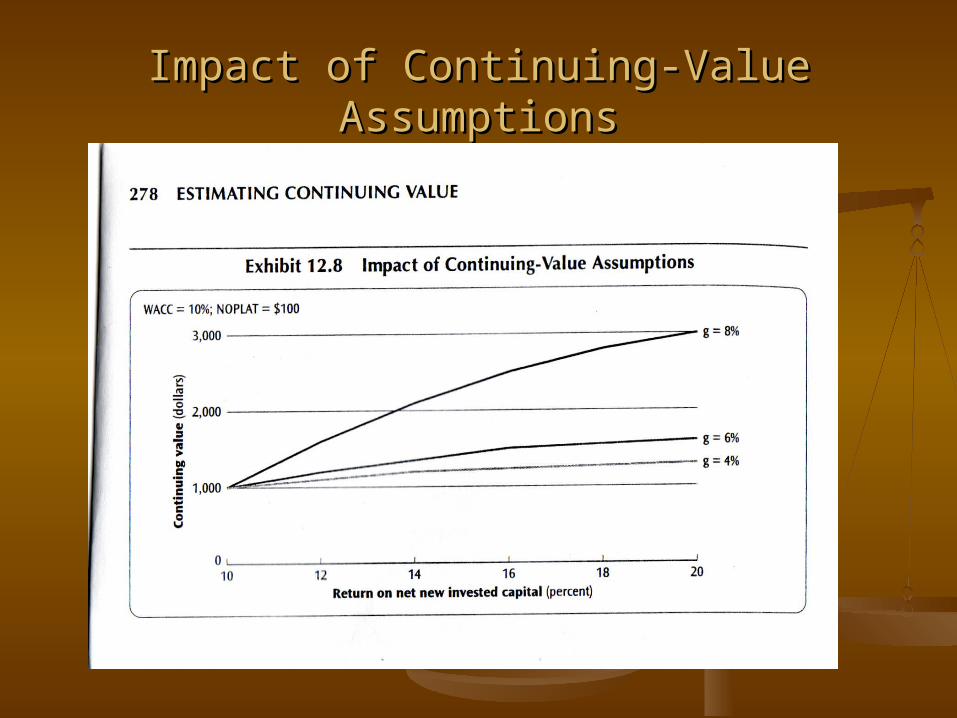
Impact of Continuing-Value AssumptionsImpact of Continuing-Value Assumptions
Estimating Parameters for Continuing Value Estimating Parameters for Continuing Value VariablesVariables
NOPLATNOPLAT The base level of NOPLAT should reflect a The base level of NOPLAT should reflect a normalized level of earnings for the company at the normalized level of earnings for the company at the midpointmidpoint of its business cycle. Revenues should of its business cycle. Revenues should generally reflect the continuation of the trends in the generally reflect the continuation of the trends in the last forecast year adjusted to the midpoint of the last forecast year adjusted to the midpoint of the business cycle. Operating costs should be based on business cycle. Operating costs should be based on sustainable margin levels, and taxes should be based on sustainable margin levels, and taxes should be based on long-term expected rates.long-term expected rates.
Free Cash FlowFree Cash Flow First, estimate the base level of NOPLAT First, estimate the base level of NOPLAT as described above. Although NOPLAT is usually based as described above. Although NOPLAT is usually based on the last forecast year’s results, the prior year’s level on the last forecast year’s results, the prior year’s level of investment is probably not a good indicator of the of investment is probably not a good indicator of the sustainable amount of investment needed for growth in sustainable amount of investment needed for growth in the continuing value period. Carefully estimate how the continuing value period. Carefully estimate how much investment will be required to sustain the much investment will be required to sustain the forecasted growth rate. Often the forecasted growth in forecasted growth rate. Often the forecasted growth in the CV Period is lower so the amount of investment the CV Period is lower so the amount of investment should be proportionately smaller amount of NOPLAT.should be proportionately smaller amount of NOPLAT.
Estimating Parameters for Continuing Value Estimating Parameters for Continuing Value VariablesVariables
Incremental ROIC Incremental ROIC The ROIC should be consistent with The ROIC should be consistent with expected competitive conditions. Economic theory suggests expected competitive conditions. Economic theory suggests that competition will eventually eliminate abnormal return, that competition will eventually eliminate abnormal return, so for many companies, set ROIC=WACC. If you expect the so for many companies, set ROIC=WACC. If you expect the company will be able to continue its growth and to maintain company will be able to continue its growth and to maintain its competitive advantage, then you might consider setting its competitive advantage, then you might consider setting ROIC equal to the return the company is forecasted to earn ROIC equal to the return the company is forecasted to earn during the explicit forecast period.during the explicit forecast period.
Growth rateGrowth rate The best estimate is probably the expected long-The best estimate is probably the expected long-term rate of consumption growth for the industry’s term rate of consumption growth for the industry’s products, plus inflation. We also suggest that sensitivity products, plus inflation. We also suggest that sensitivity analyses be done to understand how the growth rate analyses be done to understand how the growth rate affects value estimates.affects value estimates.
Estimating Parameters for Continuing Estimating Parameters for Continuing Value VariablesValue Variables
WACC WACC The weighted average cost of capital should The weighted average cost of capital should incorporate a sustainable capital structure and an incorporate a sustainable capital structure and an underlying estimate of business risk consistent with underlying estimate of business risk consistent with expected industry conditions.expected industry conditions.
Investment Rate Investment Rate The investment rate is not explicitly in The investment rate is not explicitly in the formula, but it equals ROIC divided by growth. the formula, but it equals ROIC divided by growth. Make sure that the investment rate can be explained in Make sure that the investment rate can be explained in light of industry economicslight of industry economics

Common PitfallsCommon PitfallsNaïve Base-Year Extrapolation Naïve Base-Year Extrapolation A continual increase in A continual increase in
working capital as a percentage of sales and therefore working capital as a percentage of sales and therefore significantly understating the value of the company significantly understating the value of the company (increase in working capital is too large for the increase (increase in working capital is too large for the increase in sales)in sales)

Common PitfallsCommon Pitfalls
Naïve Over-conservatism Naïve Over-conservatism Do not assume that the Do not assume that the incremental return on capital in the continuing value incremental return on capital in the continuing value period will equal the cost of capital. In doing so, one is period will equal the cost of capital. In doing so, one is apt not to forecast growth rate since growth nether apt not to forecast growth rate since growth nether adds nor destroys value. Case in point are companies adds nor destroys value. Case in point are companies with proprietary products who can command high with proprietary products who can command high returns on invested capital.returns on invested capital.
Purposeful Over-conservatism Purposeful Over-conservatism The size and The size and uncertainty of Continuing Value leads to over-uncertainty of Continuing Value leads to over-conservatism. But uncertainty is a two edged sword, it conservatism. But uncertainty is a two edged sword, it can cut both ways. Careful development of scenarios can cut both ways. Careful development of scenarios ((Venture SimsVenture SimsTMTM) are critical elements of any valuation.) are critical elements of any valuation.

Other DCF ApproachesOther DCF ApproachesConvergence Formula Convergence Formula implies zero growth. This implies zero growth. This
is not the case. It means that growth will add is not the case. It means that growth will add nothing to value, because the return associated nothing to value, because the return associated with growth just equals the cost of capital.with growth just equals the cost of capital.
Start with Value-driver Formula Start with Value-driver Formula CV=NOPLATCV=NOPLATT+1T+1(1-(1-gg/ROIC/ROICII)/WACC-)/WACC-gg
Assume ROICAssume ROICII=WACC=WACC (incremental invested capital = the cost of capital)(incremental invested capital = the cost of capital)
CV=NOPLATCV=NOPLATT+1T+1(1-(1-gg/WACC)/WACC-/WACC)/WACC-g g ==CV= NOPLATCV= NOPLATT+1 T+1 (WACC-(WACC-gg)/(WACC) /WACC-)/(WACC) /WACC-gg
Canceling the term WACC-Canceling the term WACC-g g leaves a simple leaves a simple formulaformula
CV= NOPLATCV= NOPLATT+1T+1/WACC/WACC
Other DCF ApproachesOther DCF Approaches
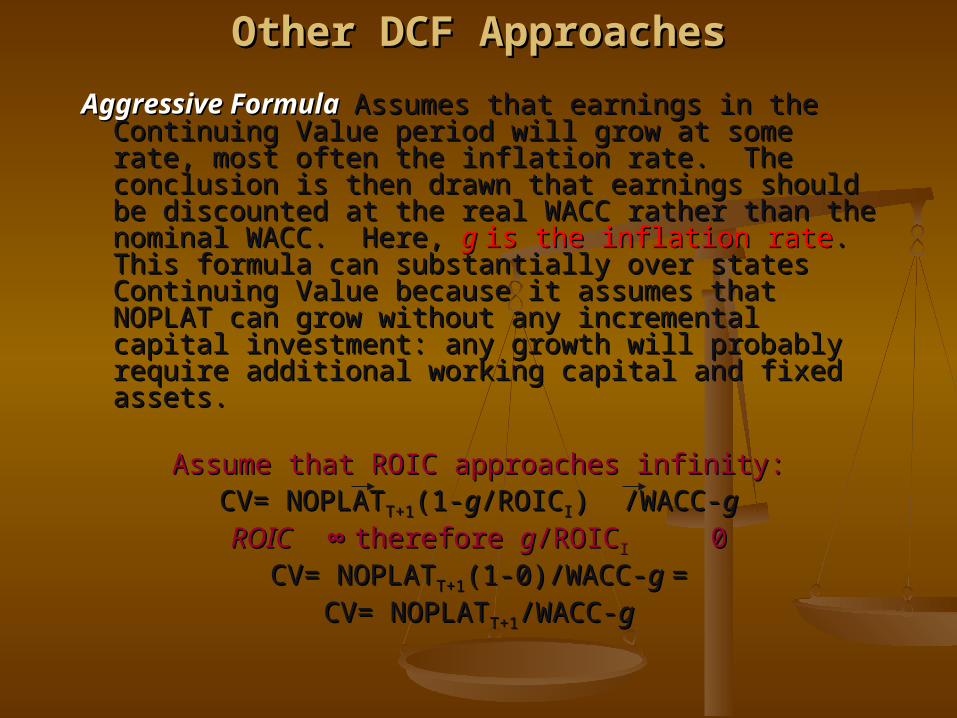
Aggressive Formula Aggressive Formula Assumes that earnings in Assumes that earnings in the Continuing Value period will grow at some the Continuing Value period will grow at some rate, most often the inflation rate. The conclusion rate, most often the inflation rate. The conclusion is then drawn that earnings should be discounted is then drawn that earnings should be discounted at the real WACC rather than the nominal WACC. at the real WACC rather than the nominal WACC. Here, Here, g g is the inflation rateis the inflation rate. This formula can . This formula can substantially over states Continuing Value substantially over states Continuing Value because it assumes that NOPLAT can grow because it assumes that NOPLAT can grow without any incremental capital investment: any without any incremental capital investment: any growth will probably require additional working growth will probably require additional working capital and fixed assets.capital and fixed assets.
Assume that ROIC approaches infinity:Assume that ROIC approaches infinity:CV= NOPLATCV= NOPLATT+1T+1(1-(1-gg/ROIC/ROICII) /WACC-) /WACC-gg
ROIC ROIC ∞∞ therefore therefore gg/ROIC/ROICI I 0 0CV= NOPLATCV= NOPLATT+1T+1(1-0)/WACC-(1-0)/WACC-g g ==
CV= NOPLATCV= NOPLATT+1T+1/WACC-/WACC-gg
Non-Cash Flow ApproachesNon-Cash Flow Approaches
Liquidation-Value Approach Liquidation-Value Approach sets the continuing value sets the continuing value equal to an estimate of the proceeds from the sale of equal to an estimate of the proceeds from the sale of the assets of the business, after paying off liabilities at the assets of the business, after paying off liabilities at the end of the explicit forecast period.the end of the explicit forecast period.
Replacement-Cost Approach Replacement-Cost Approach sets the continuing value sets the continuing value equal to the expected cost to replace the company’s equal to the expected cost to replace the company’s assets.assets.
Price-To-Earnings Ratio Approach Price-To-Earnings Ratio Approach assumes the assumes the company will be worth some multiple of its future company will be worth some multiple of its future earnings in the continuing period.earnings in the continuing period.
Market-To-Book Ratio Approach Market-To-Book Ratio Approach assumes the company assumes the company will be worth some multiple of its book value, often the will be worth some multiple of its book value, often the same as its current multiple or the multiple of same as its current multiple or the multiple of comparable companies.comparable companies.

Any Questions?Any Questions?

Thank you for your Thank you for your attention!attention!