a computational theory of executive cognitive processes
TRANSCRIPT

r
A Computational Theory of Executive Cognitive Processes and Human Multiple-Task Performance: Part 2.
Accounts of Psychological Refractory-Period Phenomena
David E. Meyer Department of Psychology
University of Michigan 525 East University, Ann Arbor, MI 48109-1109
David E. Kieras Artificial Intelligence Laboratory
Electrical Engineering & Computer Science Department University of Michigan
1101 Beal Avenue, Ann Arbor, MI 48109-2110
efe %
University of Michigan
EPIC Report No. 7 (TR-97/ONR-EPIC-07)
January 1, 1997
This research was supported by the U.S. Office of Naval Research, Cognitive Science Program, under Grant Number N00014-92-J-1173, Grant Authority Identification Number NR 4422574. Reproduction in whole or part is permitted for any purpose of the United States Government.
Approved for Public Release; Distribution Unlimited
ro

REPORT DOCUMENTATION PAGE form Approved OMB No. 0704-0188
Public reporting burden for this collection of Information is estimated to average 1 hour per response, including the time for ^fw'^jn*"J2?*5^?"n?.*x!2£2 ffiJJ^f?• oatfceimaand maintaining the data needed, and completing and reviewing the colleaion of information. Send comments regarding this buidenesthnate or any otiwr aspectof this SKcu^rthrfoVm^rii^n^i^ions foTreducmg this burden, to Washington Headquarters Services Directorate«*jnf«n«tton «^ntkirn and Repoc^ «IS Jefferson Sn«l«gmvay Suite 1204. ArtingtonrvA22202-4302. and to the Off ke of Management and Budget. Paperwork Reduction Project (0704-0188). Washington. DC 20503.
1. AGENCY USE ONLY (Leave blank) 2. REPORT DATE
January 1, 1997
3. REPORT TYPE AND DATES COVERED
Interim Jan 1, 1992-January 1, 1997
4. TITLE AND SUBTITLE
A Computational Theory of Executive Cognitive Processes and Human Multiple-Task Performance: Part 2 Accounts of Psychological Refractory-Period Phonomena
6. AUTHOR(S)
David E. Meyer & David E. Kieras
7. PERFORMING ORGANIZATION NAME(S) AND ADDRESS(ES)
University of Michigan Division of Research Development and Administration Ann Arbor, MI 48109-1274
9. SPONSORING /MONITORING AGENCY NAME(S) AND ADDRESS(ES)
Cognitive Science Program (1142 CS) Office of Naval Research 800 N. Quincy St. Arlington, VA 22217-5660
11. SUPPLEMENTARY NOTES
5. FUNDING NUMBERS
GN00014-92-J-1173 PR 44422574
8. PERFORMING ORGANIZATION REPORT NUMBER
TR-95-ONR-EPIC-7
10. SPONSORING /MONITORING AGENCY REPORT NUMBER
12a. DISTRIBUTION/AVAILABILITY STATEMENT
Approved for Public Release: Distribution Unlimited
12b. DISTRIBUTION CODE
13. ABSTRACT (Maximum 200 words)
Further simulations of multiple-task performance have been conducted with computational models that are based on the Executive-Process Interactive Control (EPIC) architecture for human information processing. These models account well for patterns of reaction times and psychological refractory-period phenomena (delays of overt responses after short stimulus onset asynchronies) in a variety of laboratory paradigms and realistic situations. This supports the claim of the present theoretical framework that multiple-task performance relies on adaptive executive control, which enables substantial amounts of temporal overlap among stimulus identification, response selection, and movement production processes for concurrent tasks. Such overlap is achieved through optimized task scheduling by flexible executive processes that satisfy prevailing instructions about task priorities and allocate limited-capacity perceptual-motor resources efficiently.
14. SUBJECT TERMS
Human Performance, Cognitive Models, Multiple-Task Performance
17. SECURITY CLASSIFICATION OF REPORT
Unclassified
18. SECURITY CLASSIFICATION OF THIS PAGE
Unclassified
19. SECURITY CLASSIFICATION OF ABSTRACT
Unclassifed
15. NUMBER OF PAGES
87 16. PRICE CODE
20. LIMITATION OF ABSTRACT
NSN 7540-01-280-5500 Standard Form 298 (Rev. 2-89) Prescribed by ANSI Std. Z39-18 298-102

A Computational Theory of Executive Cognitive Processes
and Multiple-Task Performance: Part 2.
Accounts of Psychological Refractory-Period Phenomena1
David E. Meyer and David E. Kieras
University of Michigan
© Copyright 1997 - All rights reserved
Approved for Public Release; Distribution Unlimited
Abstract
Further simulations of multiple-task performance have been conducted with computational models that are based on the Executive-Process Interactive Control (EPIC) architecture for human information processing. These models account well for patterns of reaction times and psychological refractory-period phenomena (delays of overt responses after short stimulus onset asynchromes) in a variety of laboratory paradigms and realistic situations. This supports the claim of the present theoretical framework that multiple-task performance relies on adaptive executive control, which enables substantial amounts of temporal overlap among stimulus identification, response selection, and movement production processes for concurrent tasks. Such overlap is achieved through optimized task scheduling by flexible executive processes that satisfy prevailing instructions about task priorities and allocate limited-capacity perceptual-motor resources efficiently.
1 This is a preprint of an article to appear in Psychological Review (Meyer & Kieras, 1997b). Funding for the present research has been provided through grant N00014-92-J-1173 from the United States Office of Naval Research to the University of Michigan, David E. Kieras and David E. Meyer, Principal Investigators. The authors thank Terry Allard, Susan Chipman, Harold Hawkins, and William Vaughan of the ONR for their encouragement and support. Helpful comments, suggestions, and criticisms have been provided by John Anderson, Robert Bjork, James Johnston, Steven Keele, Jeffrey Miller, Stephen Monsell, Allen Osman, Harold Pashler, Roger Remington, Richard Scbweickert, Saul Sternberg, Chris Wickens, Scott Wood, Ted Wright, Steven Yantis, and anonymous reviewers. Additional contributions by the Brain, Cognition, and Action Laboratory group (Dana Apfelblat, Cerita Jones, Jennifer Glass, Leon Gmeindl, Erick Lauber, Eric Schumacher, Travis Seymour, B. J. Woodside, and Eileen Zurbriggen) at the University of Michigan are gratefully acknowledged. Correspondence about this article should be sent to the authors at the following addresses: David E. Meyer, Cognition and Perception Program, Dept. of Psychology, University of Michigan, 525 E. University, Ann Arbor, MI, 48109-1109, USA; David E. Kieras, Advanced Technology Laboratory, Dept. of Electrical Engineering and Computer Science, University of Michigan, 1101 Beal Ave., Ann Arbor, MI, 48109-2110, USA.

Computational Theory of Human Performance: Part 2 Meyer & Kieras
Introduction
Throughout past research on human cognition and action, multiple-task performance has been a major topic of investigation (Damos, 1991; Gopher & Donchin, 1986). This topic concerns how people perform multiple tasks either simultaneously or in rapid succession when each task involves its own distinct goals and stimulus-response associations. For example, some familiar everyday cases include tending children while preparing meals, and operating cellular telephones while driving cars. Experimental psychologists and cognitive scientists have been especially interested in multiple-task performance because it places heavy demands on the human information-processing system and may, therefore, provide deep insights into how the system's components are functionally organized and implemented (Atkinson, Hernstein, Lindzey, & Luce, 1988; Meyer & Komblum, 1993; Posner, 1989). Moreover, human-factors engineers have been interested in multiple-task performance because it is required during important real-world jobs such as air-traffic control and power-plant operation, for which more user-friendly person-machine interfaces are needed (Boff, Kaufmann, & Thomas, 1986; Wickens, 1991). Yet despite this broad interest, there is still no general theory that aptly explains and accurately predicts the characteristics of multiple-task performance across a variety of contexts (Allport, 1993; Broadbent, 1993).
Background to Present Article
In light of the preceding considerations, we have begun developing a new theoretical framework with which precise veridical computational models can be constructed for various types of human multiple-task performance. The basis of our framework is an Executive-Process Interactive Control (EPIC) architecture. Using EPIC together with a production-system formalism, computational models have been constructed to simulate performance in both elementary laboratory contexts such as the psychological refractory-period procedure (Meyer & Kieras, 1992,1994,1996,1997a; Meyer, Kieras, Lauber, Schumacher, Glass, Zurbriggen, Gmeindl, & Apfelblat, 1995) and complex real- world contexts such as aircraft-cockpit operation (Kieras & Meyer, 1995,1997; Meyer & Kieras, 1996) and human-computer interaction (Kieras & Meyer, 1997; Kieras, Wood, & Meyer, 1995, 1997; Meyer & Kieras, 1996; Wood, Kieras, & Meyer, 1994). Results from these diverse simulations provide excellent fits to empirical reaction-time data and, in some cases, response accuracy as well. Our theoretical framework and models also make new testable predictions about other related aspects of multiple-task performance. Taken overall, the products of this endeavor suggest that it may have both theoretical validity and practical utility.
The present article supplements a prior one (Meyer & Kieras, 1997a) in which the EPIC architecture and a strategic response-deferment (SRD) model were applied to account quantitatively for reaction-time data from a basic multiple-task situation, the psychological refractory-period (PRP) procedure. Here we start by briefly reviewing our initial assumptions and results for this application. Next we extend the SRD model to deal with additional data from the PRP procedure and other related multiple-task situations. Then we discuss further implications that our theoretical framework has for future research on human performance in both laboratory and real-world contexts. For more extensive background to the present article, readers should consult Meyer and Kieras (1997a).
Review of EPIC Architecture
As outlined in Figure 1, EPIC consists of components that emulate various functional parts of the human information-processing system. The organization of the architecture builds on previous work by a number of theorists (e.g., Anderson, 1976,1983,1990,1993; Card, Moran, & Newell, 1983; Hunt & Lansman, 1986; Laird, Newell, & Rosenbloom, 1987; Newell, 1973,1990). Among EPIC's components are software modules devoted specifically to perceptual, cognitive, and motoric information processing. Inputs to the perceptual processors, which subserve vision, audition, and touch, come from simulated sensors (eyes, ears, and hands) that monitor external display devices (e.g., CRT screen and headphones) of a virtual task environment. After specified parametric delays,

Computational Theory of Human Performance: Part 2 Meyer & Kieras
Task Environment
Simulated Interaction
Devices
I
Long-Term Memory Cognitive
Processor >s
Production Rule Interpreter 3
Figure 1. Overview of information-processing components in the Executive-Process Interactive Control (EPIC) architecture.

Computational Theory of Human Performance: Part 2 Meyer & Kieras
the perceptual processors deposit symbolic stimulus codes in the declarative working memory of EPIC's cognitive processor. The cognitive processor maintains the contents of working memory, executes procedures for performing particular tasks, and instructs the motor processors by transmitting symbolic response codes to them. The motor processors, which subserve ocular, manual, and articulatory action, prepare and produce movements by simulated effectors (eyes, hands, and mouth) that operate transduction devices (e.g., keyboard, joystick, and voice key) in the task environment Together, EPIC and its task environment provide a basis for realistically simulating multiple-task performance in a variety of contexts.
Core assumptions. Some of the core assumptions that underlie EPIC concern the structure and function of its cognitive processor, which consists of three major subcomponents whose interactions together enable a high degree of parallel processing. These subcomponents include an on-line declarative working memory, procedural memory, and production-rule interpreter. Like known properties of human multiple-task performance, the processing capabilities provided by them are substantially greater and more flexible than those in previously proposed single-channel hypotheses (e.g., Welford, 1952,1959,1980), central "bottleneck" models (e.g., De Jong, 1993; McCann & Johnston, 1992; Pashler, 1984,1994; Welford, 1967), and unitary-resource theories (e.g., Moray, 1967; Kahneman, 1973).
Within EPIC's cognitive processor, declarative working memory has partitions that store several different types of symbolic information: (a) identities of external stimuli sent through the perceptual processors; (b) identities of selected responses waiting for transmission to the motor processors; (c) task goals; (d) sequential control flags or "step tags"; and (e) notes about the current status of other system components. Using this information, which evolves systematically over time, performance of one or more tasks may proceed efficiently from start to finish.
Such performance is achieved by applying production rules having the form "IF x THEN Y", where "x" refers to the current contents of working memory, and "Y" refers to actions that the cognitive processor executes. For example, during a primary auditory-manual choice-reaction task, the following rule might be used to instruct EPIC's manual motor processor that it should prepare and produce a keypress by the left index finger in response to an 800 Hz tone:
IF ((GOAL DO TASK 1) (STRATEGY TASK 1 IS IMMEDIATE) (AUDITORY TONE 800 ON) (STEP DO CHECK FOR TONE 800))
THEN ((SEND-TO-MOTOR (MANUAL PERFORM LEFT INDEX)) (ADD (TASK 1 RESPONSE UNDERWAY)) (ADD (STEP WAIT FOR TASK 1 RESPONSE COMPLETION) ) (DEL (STEP DO CHECK FOR TONE 800)) (DEL (AUDITORY TONE 800 ON))).
The actions of this rule, which not only instructs the manual motor processor but also adds and deletes specified items in working memory, would be executed whenever working memory contains all of the items in the rule's conditions. For each task that a person has learned to perform skillfully, there would be a set of such rules stored in EPIC's procedural memory. Also, complementing these task-rule sets, production memory may contain sets of executive-process rules that help manage the contents of working memory, and that coordinate performance depending on task instructions and perceptual-motor constraints.
Task and executive rules are applied by the production-rule interpreter of the cognitive processor, using a Parsimonious Production System (PPS; Covrigaru & Kieras, 1987). Under PPS, the interpreter operates through a series of processing cycles, whose durations vary stochastically and typically have a mean length of 50 ms. At the start of each cycle, the interpreter tests the conditions of all rules currently in procedural memory, determining which ones match the contents

Computational Theory of Human Performance: Part 2 Meyer & Kieras
of declarative working memory. At the end of each cycle, for every rule whose conditions are completely matched by the contents of working memory, all of the rule's actions are executed by the cognitive processor.
At present, we assume that there is no limit on how many production rules can have their conditions tested and actions executed during any particular processing cycle. Also, the cycle durations do not depend on the number of rules involved. It is in this sense that EPIC's cognitive processor has no decision or response-selection bottleneck per se. Through appropriate sets of task rules, the cognitive processor may simultaneously select responses and do other operations for concurrent tasks, without between-task interference at this "central" level. A principled rationale for making such assumptions instead of more traditional ones appears in Meyer and Kieras (1997a).
At a "peripheral" level, however, EPIC does have bottlenecks in the form of its motor processors, as anticipated by other theorists (e.g., Kantowitz, 1974; Keele, 1973; Keele & Neill, 1978; Reynolds, 1964). Although the ocular, manual, and vocal motor processors can all be operating simultaneously, each of them individually constitutes a single-channel mechanism that limits the rate of overt movements within a particular motor modality. We assume that upon receiving the symbolic identity of a selected response from the cognitive processor, a motor processor converts it to elementary features that the desired response movement should have. For example, a keypress by the manual motor processor might have features that specify the style, hand, and finger (e.g., PRESS , LEFT , INDEX) to be used. Consistent with some empirical results (e.g., Abrams & Jonides, 1990; Meyer & Gordon, 1985; Rosenbaum, 1980; Yaniv, Meyer, Gordon, Huff, & Sevald, 1990), the features for a response movement are prepared serially, with each feature- preparation step taking on the order of 50 ms to be completed. After all of the features for a response movement have been prepared, the movement is produced overtly through a final initiation step that likewise takes on the order of 50 ms. Thus, while symbolic response codes for concurrent tasks may be selected in parallel by EPIC's cognitive processor, the production of distinct movements by the same motor processor would have to be temporally staggered, leading to potential between-task or "structural" interference (cf. Kahneman, 1973).
An especially instructive case of this concerns manual movements. Based on studies of manual movement production (e.g., Ivry, Franz, Kingstpne, & Johnston, 1994,1996; McLeod, 1977), EPIC has only one motor processor devoted to preparing and initiating movements by the two (i.e., right and left) hands. For multiple manual tasks, substantial between-task interference is therefore possible at the peripheral motor level even when the two tasks utilize different hands. Effective coping with such interference requires judicious supervisory control.
Formulation of models. On the basis of EPIC, we formulate computational models of human multiple-task performance in terms of production-rule sets, which guide the operation of the cognitive processor. First, for each task at hand, a distinct set of production rules that perform the task with the architecture's various components must be specified. The task production rules translate intermediate stimulus codes to intermediate response codes and perform other record- keeping unique to the individual tasks. Second, a set of production rules for a supervisory executive process must be specified. The executive production rules coordinate progress on various tasks adaptively so that instructions about the tasks' relative priorities are obeyed and the tasks do not disrupt each other at peripheral levels where perceptual-motor resources are limited. Such coordination is achieved by monitoring the contents of working memory and inserting or deleting task goals and other control items at appropriate points along the way. For example, the following executive production rule might be applied to start processing for primary and secondary choice- reaction tasks while ensuring that primary-task responses have higher priority than secondary-task responses:
Computational Theory of Human Performance: Part 2 Meyer & Kieras
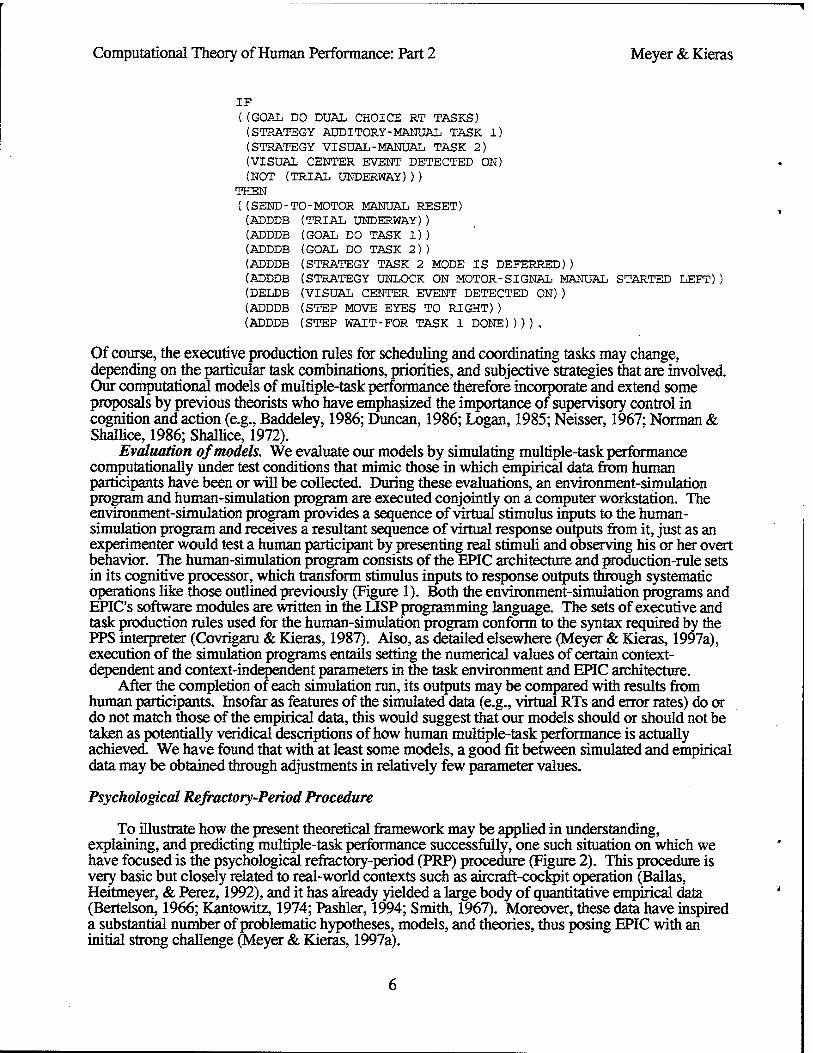
IF {(GOAL DO DUAL CHOICE RT TASKS) (STRATEGY ADDITORY-MANUAL TASK 1) (STRATEGY VISUAL-MANUAL TASK 2) (VISUAL CENTER EVENT DETECTED ON) (NOT (TRIAL UNDERWAY)))
THEN ((SEND-TO-MOTOR MANUAL RESET) (ADDDB (TRIAL UNDERWAY)) (ADDDB (GOAL DO TASK 1)) (ADDDB (GOAL DO TASK 2)) (ADDDB (STRATEGY TASK 2 MODE IS DEFERRED)) (ADDDB (STRATEGY UNLOCK ON MOTOR-SIGNAL MANUAL STARTED LEFT)) (DELDB (VISUAL CENTER EVENT DETECTED ON)) (ADDDB (STEP MOVE EYES TO RIGHT)) (ADDDB (STEP WAIT-FOR TASK 1 DONE)))).
Of course, the executive production rules for scheduling and coordinating tasks may change, depending on the particular task combinations, priorities, and subjective strategies that are involved. Our computational models of multiple-task performance therefore incorporate and extend some proposals by previous theorists who have emphasized the importance of supervisory control in cognition and action (e.g., Baddeley, 1986; Duncan, 1986; Logan, 1985; Neisser, 1967; Norman & Shallice, 1986; Shallice, 1972).
Evaluation of models. We evaluate our models by simulating multiple-task performance computationally under test conditions that mimic those in which empirical data from human participants have been or will be collected. During these evaluations, an environment-simulation program and human-simulation program are executed conjointly on a computer workstation. The environment-simulation program provides a sequence of virtual stimulus inputs to the human- simulation program and receives a resultant sequence of virtual response outputs from it, just as an experimenter would test a human participant by presenting real stimuli and observing his or her overt behavior. The human-simulation program consists of the EPIC architecture and production-rule sets in its cognitive processor, which transform stimulus inputs to response outputs through systematic operations like those outlined previously (Figure 1). Both the environment-simulation programs and EPIC's software modules are written in the LISP programming language. The sets of executive and task production rules used for the human-simulation program conform to the syntax required by the PPS interpreter (Covrigaru & Kieras, 1987). Also, as detailed elsewhere (Meyer & Kieras, 1997a), execution of the simulation programs entails setting the numerical values of certain context- dependent and context-independent parameters in the task environment and EPIC architecture.
After the completion of each simulation run, its outputs may be compared with results from human participants. Insofar as features of the simulated data (e.g., virtual RTs and error rates) do or do not match those of the empirical data, this would suggest that our models should or should not be taken as potentially veridical descriptions of how human multiple-task performance is actually achieved. We have found that with at least some models, a good fit between simulated and empirical data may be obtained through adjustments in relatively few parameter values.
Psychological Refractory-Period Procedure
To illustrate how the present theoretical framework may be applied in understanding, explaining, and predicting multiple-task performance successfully, one such situation on which we have focused is the psychological refractory-period (PRP) procedure (Figure 2). This procedure is very basic but closely related to real-world contexts such as aircraft-cockpit operation (Ballas, Heitmeyer, & Perez, 1992), and it has already yielded a large body of quantitative empirical data (Bertelson, 1966; Kantowitz, 1974; Pashler, 1994; Smith, 1967). Moreover, these data have inspired a substantial number of problematic hypotheses, models, and theories, thus posing EPIC with an initial strong challenge (Meyer & Kieras, 1997a).

Computational Theory of Human Performance: Part 2 Meyer & Kieras
Taskl Stimulus 1
Taskl Response 1
Warning Signal
Task 1 Reaction Time -* —*-
Time
SOA Stimulus Onset
Asynchrony
i Task 2 Reaction Time i *+ ►!
I Task 2
Stimulus 2 Task 2
Response 2
Figure 2. A typical trial in the PRP procedure.

Computational Theory of Human Performance: Part 2 Meyer & Kieras
As part of the PRP procedure, there are discrete test trials. On each trial, a warning signal is followed by a stimulus (e.g., visual letter or auditory tone) for the first of two tasks. In response to it, a participant must react quickly and accurately (e.g., by pressing a finger key or saying a word). Soon after the Task 1 stimulus, there is another stimulus for the second task. The perceptual modality and semantic category of the Task 2 stimulus may (or may not) differ from those of theTask 1 stimulus. The time between the two stimuli is the stimulus-onset asynchrony (SOA), which typically ranges between zero and 1 sec or so. In response to the Task 2 stimulus, the participant must again react quickly and accurately. The effector used to make the Task 2 response may (or may not) differ from that for the Task 1 response. In any case, instructions for the PRP procedure state that Task 1 should have higher priority than Task 2; they may also urge participants to make the Task 1 response first RTs are then measured to determine how much Task 1 actually interferes with the performance of Task 2. A major objective here is to model the Task 1 and Task 2 RTs as a function of the SOA and other factor effects. Specifically, Task 2 RTs may be plotted versus the SOA, yielding PRP curves that typically decline as the SOA increases. Depending on certain procedural details, the SOA effect - also called the PRP effect - can either add or interact with effects of other factors (e.g., stimulus dlscriminability, response-selection difficulty, movement complexity, and so forth). Viable models of multiple-task performance have to account for the RT magnitudes and these additive or interactive effects on them.
Adaptive Executive-Control Models
Toward the present objective, a class of adaptive executive control (ABC) models for multiple- task performance in the PRP procedure can be formulated, using the EPIC architecture (Meyer & Kieras, 1996; Meyer et al., 1995). These models incorporate executive processes that flexibly control the extent to which secondary-task processes overlap temporally with primary-task processes. Figure 3 outlines how such control is achieved.
According to this view, performance of each task progresses through a sequence of stages, including stimulus identification, response selection, and movement production, consistent with discrete stage models (Sternberg, 1969; Sanders, 1980). An executive process coordinates progress on the primary and secondary tasks by optionally postponing one or more stages of processing for Task 2 until Task 1 has finished. The supervisory functions of the executive process include (a) enabling the primary-task and secondary-task processes to begin at the start of each trial; (b) specifying a temporary Task 2 lockout point; (c) specifying a temporary Task 1 unlocking event; (d) waiting for the Task 1 unlocking event to occur; and (e) unlocking Task 2 processes so that then- responses may be completed. Together, these functions ensure that instructions associated with the PRP procedure are satisfied (i.e., Task 1 responses receive higher priority and occur before Task 2 responses) even though there is enough central-processing capacity to perform concurrent tasks with little or no between-task interference. Through the particular combination of Task 2 lockout point and Task 1 unlocking event that it imposes, the executive process can adjust exactly how much temporal priority is given to Task 1 over Task 2.
Task 2 lockout points. By definition, the Task 2 lockout point is a point during the course of Task 2 such that when it has been reached, further processing for Task 2 stops temporarily until Task 1 enters a "done" state. Under the AEC models, there are at least three alternative Task 2 lockout points (Figure 3, right-side ovals), located respectively before the onsets of stimulus identification, response selection, and movement production for Task 2. Depending on whether the executive process sets a pre-movement, pre-selection, or pre-identification lockout point, the Task 2 processes would overlap more or less with Task 1 processes after short SOAs.
Task 1 unlocking events. The amount of temporal ovelap between Task 1 and Task 2 processes also depends on the choice of a Task 1 unlocking event. By definition, this is an event during the course of Task 1 such that when it occurs, Task 1 is deemed to be "done," and the executive process permits processing for Task 2 to progress beyond the Task 2 lockout point Under the AEC models, there are several alternative Task 1 unlocking events (Figure 3, left-side ovals); Task 1 may be deemed "done" immediately after either its stimulus-identification, response-selection, or movement- production stage finishes. Again, depending on whether the executive process uses a post-

Computational Theory of Human Performance: Part 2 Meyer & Kieras
TASK 1 STIMULUS
i START
TASK 1 PROCESSES
IDENTIFY TASK 1
STIMULUS
SELECT TASK
RESPONSE
PRODUC TASK
IMOVEMJBNT
TASK 1 RESPONSE
EXECUTIVE PROCESSES
ENABLE TASK
PROCESSES
SPECIFY TASK 2 LOCKOUT POINT
SPECIFY TASK 1 UNLOCKING EVENT
I WAIT FOR
UNLOCKING EVENT
i UNLOCK TASK 2
TASK 2 STIMULUS
I START
TASK 2 PROCESSES
PRODUCE TASK 2
MOVEMENT
1 TASK 2
RESPONSE
Figure 3. Component processes for adaptive executive-control (AEC) models whereby the tasks of the PRP procedure may be flexibly scheduled. Diagonal lines with arrows that extend rightward from executive processes to secondary-task processes illustrate alternative Task 2 lockout points, which may occur immediately before the beginning of either stimulus identification, response selection, or movement production for Task 2. Diagonal lines with arrows that extend leftward from executive processes to primary-task processes illustrate alternative Task 1 unlocking events, which may occur immediately after the end of either stimulus identification, response selection, or movement production for Task 1.

Computational Theory of Human Performance: Part 2 Meyer & Kieras
identification, post-selection, or post-movement unlocking event, Task 2 processes would overlap more or less with Task 1 processes after short SO As.
Particular cases. Overall, the class of AEC models includes many particular cases. For each possible combination of Task 2 lockout point and Task 1 unlocking event, there is a specific set of executive production rules that can implement this combination, achieving a currently preferred amount of temporal overlap between the two tasks. Which executive rule set is used under what circumstances may vary with task instructions, strategic goals, perceptual-motor requirements, and prior practice. From this perspective, the choice of a lockout-point and unlocking-event combination is analogous to the choice of a decision-criterion (beta) value in signal-detection theory (Tanner & Swets, 1954), which would vary with the relative payoffs and costs assigned to one type of response outcome versus another.
For example, some models within the AEC class can mimic a response-selection bottleneck (Meyer & Kieras, 1996). Their executive processes do so by specifying a pre-selection lockout point for Task 2 and a post-selection unlocking event for Task 1, thereby precluding response selection during Task 2 until Task 1 response selection has finished. Given EPIC's framework, however, such a lockout-point and unlocking-event combination is neither obligatory nor immutable, contrary to the traditional RSB hypothesis (cf. Pashler, 1994; Welford, 1967,1980). An optional response-selection bottleneck may, but need not, be imposed when the situation strongly encourages making sure that Task 2 responses never precede Task 1 responses.
Other models within the AEC class can mimic additional types of bottleneck. For example, Keele (1973) has hypothesized that a movement-initiation bottleneck rather than a response-selection bottleneck exists in the human information-processing system. Consistent with this hypothesis, an executive process may defer Task 2 movement initiation by setting a post-selection/pre-movement lockout point for Task 2 and a post motor-initiation unlocking event for Task 1. Again, however, such combinations are neither obligatory nor immutable in EPIC. An optional movement-initiation bottleneck may, but need not, be imposed when the situation strongly encourages producing Task 2 responses as quickly as possible after Task 1 finishes.
Strategic Response-Deferment Model
Among models in the AEC class, one with which we have worked extensively is the strategic response-deferment (SRD) model. This model is interesting and apt because as each trial evolves during the PRP procedure, its executive process first uses a post-response-selection lockout point for Task 2 but later briefly imposes a pre-response-selection lockout point, depending on how far the Task 2 processes have progressed by when the prespecified Task 1 unlocking event occurs. As a result of such adaptive control, mean Task 2 RTs generated by the SRD model closely match various patterns of empirical PRP curves from previous experiments with the PRP procedure. These patterns and the model's goodness-of-fit take into account not only the effects of SOA but also the relative difficulties of primary and secondary tasks (Meyer & Kieras, 1997a; Meyer et al., 1995).
Details of executive process. Figure 4 outlines the executive process of the SRD model in more detail. At the start of each trial during the PRP procedure, the executive process puts Task 1 in an immediate response-transmission mode and Task 2 in a deferred response-transmission mode. While Task 2 is in deferred mode, the identities of Task 2 responses may be selected and sent to declarative working memory, but Task 2 response movements are not produced by EPIC's motor processors. This constraint is imposed by adding an appropriate control note to working memory, which specifies a post-selection/pre-movement lockout point for Task 2 (e.g., see production rule on p. 6). Putting Task 1 in immediate mode lets its responses be selected and sent to their motor processor as quickly as possible for movement production. This freedom is enabled by adding another control note to working memory (e.g., see production rule on p. 6). When the Task 1 unlocking event occurs subsequently (e.g., the overt Task 1 response movement is initiated), the executive process temporarily suspends Task 2 (i.e., withdraws "GOAL DO TASK 2" from working memory) and shifts it to immediate mode, after which Task 2 is resumed (i.e., "GOAL DO TASK 2" is reinserted in working memory). Following this transition, the identities of previously selected Task 2 responses may be transferred from working memory to their motor processor for movement
10

Computational Theory of Human Performance: Part 2 Meyer & Kieras
Executive Process
Trial Started
♦ Start Task 1 in immediate mode Start Task 2 in deferred mode
Enable Task 1 and Task 2
Task 2 Process
R1 Finished T \
\
Task 1 Completed x \
R2 selected? x \
S2
1 Yes \^No
s \ Perceptual Processing
Suspend Task 2 Change to ^
immediate mode v-n Cognitive
Processing
Permit R2
Resume Task 2
Response Selection
Deferred Mode
Wait for response permission
±
Immediate Mode
Trial Finished ( Motor Processing j
R2
Figure 4. Steps taken by the executive process of the SRD model to unlock Task 2 processes for the PRP procedure after Task 1 has been declared "done". Depending on whether or not the identity of the Task 2 response has been selected already, the executive process unlocks Task 2 in one of two ways: (a) permitting the preselected Task 2 response to be sent to its motor processor, or (b) suspending Task 2 temporarily, shifting it from the deferred to immediate response-transmission mode, and then resuming Task 2 in immediate mode. Breaks in the vertical time lines shown by diagonal hash marks represent variable time intervals whose durations depend on the SOA and temporal properties of prior processes.
11

Computational Theory of Human Performance: Part 2 Meyer & Kieras
production. If response selection has not yet finished for Task 2 before it is shifted to immediate mode, then subsequently the Task 2 production rules will both select and send the identities of Task 2 responses directly to their motor processor.
In some respects, the SRD model resembles the hybrid structural-bottleneck model of De Jong (1993). He proposed that both response-selection and movement-initiation bottlenecks mediate multiple-task performance, integrating the hypotheses advocated by Keele (1973), Pashler (1984, 1994), Welford (1967,1980), and others. Similarly, to coordinate progress on Tasks 1 and 2 of the PRP procedure, the executive process of the SRD model uses both post-response-selection and pre- response-selection lockout points for Task 2. However, these lockout points are optional, flexible, and adaptively controlled, whereas the bottlenecks of De Jong's (1993) hybrid model are assumed to be immutable and insensitive to changing task requirements. There is considerable evidence that multiple-task performance cannot, in general, be characterized by such immutability and insensitivity (Gopher, 1993; Meyer et al., 1995; Wickens, 1984), so the assumptions of the SRD model seem preferable for now.
Alternative paths of information processing and RT equations for Task 2. Because of how its executive process works, five alternative paths of information processing (different sequences of operations) may lead from Task 2 stimuli to Task 2 response movements in the SRD model (Meyer & Kieras, 1997a, Figures 10 through 13). Which path is taken during a particular trial of the PRP procedure depends on the SOA and the relative difficulty of Task 1 versus Task 2. Associated with each path is a distinct equation that defines the Task 2 RT in terms of the model's parameters and the SOA (Meyer & Kieras, 1997a, Table 3). Under some experimental conditions, all five paths and equations contribute to the Task 2 RTs over the interval of positive SO As. Under other experimental conditions, the Task 2 RTs stem from only a subset of these paths and equations. Consequently, the SRD model implies that the SOA and other factors (e.g., response-selection difficulty for Task 2) can affect mean Task 2 RTs either interactively or additively, depending on exactly what the experimental conditions are (Meyer & Kieras, 1997a, Figure 15).
Application to PRP Study by Hawkins et al.
Initially, we (Meyer & Kieras, 1992,1994,1997a; Meyer et al., 1995) have tested the SRD model by applying it to account for empirical RTs from a PRP study by Hawkins, Rodriguez, and Reicher (1979). As part of this study, there were four different primary tasks, which involved either auditory stimuli (tones) or visual stimuli (printed letters) and either manual responses (keypresses by left-hand fingers) or vocal responses (spoken words). Each primary task was performed together with two different secondary tasks, which involved either two or eight visual stimuli (digits) and two manual responses (keypresses by right-hand fingers). For the various combinations of primary and secondary tasks, the SOAs ranged from 0 to 1200 ms. These manipulations let Task 1 and Task 2 RTs be measured jointly as a function of SOA, Task 1 perceptual modality, Task 1 motor modality, and Task 2 response-selection difficulty. Hawkins et al.'s (1979) study therefore provides a broad range of experimental conditions under which to demonstrate the viability of the SRD model.
A summary of the obtained results appears in Figure 5 (also see Meyer & Kieras, 1997a). Here we have shown simulated and empirical mean RTs as a function of SOA for the various combinations of primary and secondary tasks. With respect to both Task 1 and Task 2, the simulated mean RTs (dashed curves) fit the empirical mean RTs (solid curves) reasonably well regardless of which perceptual and motor modalities were involved during Task 1. In the case of Task 2, the simulated mean RTs accurately approximate the interactive and additive effects of SOA and response-selection difficulty on the empirical mean RTs. This success stems from the SRD model's ability to characterize cases in which response-selection processes for Task 2 do or do not overlap temporally with those for Task 1. It is also noteworthy that the model required relatively few context-dependent parameters to achieve the reported goodness-of-fit; the number of such parameter values used here was markedly less than the number of reliable one-degree-of-freedom contrasts in the empirical mean RT data of Hawkins et al. (1979). Given this outcome, the remainder of the present article describes some further related applications of our theoretical framework.
12

Computational Theory of Human Performance: Part 2 Meyer & Kieras
120Ch
£ 1000
(A) Auditory-Vocal Task 1
Mean RT
400
1200
(B) Visual-Vocal Task 1
Mean RT
(C) Auditory-Manual Task 1
MeanRT
Taskl Task 2 Easy Task 2
-i 1 1 p-
(D) Visual-Manual Task 1
MeanRT
Taskl Task2
200 400 600 800 1000 1200 0
SOA (ms)
200 400 600 800 1000 1200
SOA (ms)
Figure 5 Results from simulations with the SRD model for the PRP study by Hawkins et al. (1979). Large symbols on solid curves represent empirical mean RTs; small symbols on dashed curves represent simulated mean RTs. Filled circles and triangles represent mean Task 2 RTs when response-selection in Task 2 was respectively easy or hard; unfilled circles and triangles represent corresponding mean Task 1 RTs. A: Simulated versus empirical mean RTs for a combination of auditory-vocal Task 1 and visual-manual Task 2. B: Simulated versus empirical mean RTs for a combination of visual-vocal Task 1 and visual-manual Task 2. C: Simulated versus empirical mean RTs for a combination of auditorv-manual Task 1 and visual-manual Task 2. D: Simulated versus empirical mean RTs for a combination of visual-manual Task 1 and visual-manual Task 2.
13

Computational Theory of Human Performance: Part 2 Meyer & Kieras
Simulation of Performance in Other PRP Studies
To test the SRD model further and to demonstrate its generality more fully, we have simulated participants' performance in other representative studies with the PRP procedure, following the same general protocol outlined in Meyer and Kieras (1997a) and used for Hawkins et al. (1979). These new simulations reveal that the SRD model provides good parsimonius quantitative fits between theory and data under additional conditions in which mere are various combinations of perceptual- motor modalities and S-R mappings. For example, the next section deals with PRP studies by Karlin and Kestenbaum (1968) and by McCann and Johnston (1992), whose RT data come from different families of PRP curves that depend on crucial details of task conditions.
PRP Study by Karlin and Kestenbaum
The study by Karlin and Kestenbaum (1968) is especially interesting because it varied the difficulty of response selection for both Tasks 1 and 2 of the PRP procedure. In Task 1, there were either two or five S-R pairs, which required manual responses (left-hand keypresses) to visual stimuli (digits). In Task 2, there were either one or two S-R pairs, which required manual responses (right-hand keypresses) to auditory stimuli (low and high pitch tones). SOAs that ranged from 0 to 1150 ms, with numerous intermediate values, separated the two tasks.
Together, these design features nicely supplement those of Hawkins et al. (1979). With respect to Karün and Kestenbaum's (1968) RT data, we may test whether the SRD model applies when a visual task precedes an auditory task and Task 1 is harder (i.e., involves more S-R pairs) whereas Task 2 is easier (i.e., involves fewer S-R pairs) than under the conditions of other PRP studies. Although the present context is new, the model should still yield a good account for mean RTs and PRP curves, if its assumptions about concurrent response selection and executive control of task scheduling are valid.
Details of simulation. For the current simulation, we applied the SRD model in the same way as before. The mean values of its context-dependent parameters are set here to be commensurate with procedural details of Karlin and Kestenbaum's (1968) PRP study. Table 1 summarizes the values that these parameters have for present purposes as a function of response-selection difficulty in Tasks 1 and 2. More discussion about how to interpret the values of these parameters may be found in Meyer and Kieras (1997a).
Some relevant differences in the present parameter values compared to those used for Hawkins et al. (1979) should be noted (cf. Meyer & Kieras, 1997a, Table 4). Because Karlin and Kestenbaum (1968) gave participants an auditory-manual Task 2, the ocular orientation time of the SRD model is now set to zero. Thus, eye movements never contribute to the simulated Task 2 RTs here. Instead, a different parameter — the auditory detection time - plays a key role with respect to Karlin and Kestenbaum's (1968) study. When Task 2 involves just one S-R pair (i.e., it is a simple-reaction task), detection of the auditory stimulus triggers the SRD model's Task 2 production rules to send the Task 2 response identity (a right-index finger keypress) either to working memory or to EPIC's manual motor processor, depending on whether Task 2 is currently progressing in deferred or immediate response-transmission mode.2
Also, in order to maximize the goodness-of-fit between simulated and empirical Task 2 RTs for Karlin and Kestenbaum (1968), the unlocking-onset latency of the SRD model's executive process needs to be shorter than it typically was during our simulations of RTs from the study by Hawkins et al. (1979). Interestingly, this requirement suggests that Karlin and Kestenbaum's (1968) participants were especially efficient at coordinating the completion of Tasks 1 and 2. Such
2 The simple-reaction case of Task 2 requires these operations because of two reasons. First, during each trial, the manual motor processor must prepare and produce a left-hand response for Task 1 before preparing and producing a right-hand response for Task 2. Second, the same manual motor processor is assumed to control both hands, so it cannot remain in a constant state of preparation for Task 2 responses under these conditions.
14

Computational Theory of Human Performance: Part 2 Meyer & Kieras
Table 1 Context-Dependent Parameters in Simulations Conducted with The SRD Model for The PRP Study
by Karlin and Kestenbaum (1968)
Taskl Task 2 Mean System Component Parameter Name Difficulty Difficulty Value
perceptual processors auditory detection time easy & hard easy & hard 60
auditory identification time easy & hard easy & hard 85
visual identification time easy & hard easy & hard 175
Task 1 process number of selection cycles easy easy & hard 1.25
hard easy & hard 4.00
preparation benefit easy & hard easy & hard 50
Task 2 process number of selection cycles easy & hard easy 1.00
easy & hard hard 1.25
preparation benefit easy & hard easy 100
easy & hard hard 50
executive process ocular orientation time easy & hard easy & hard 0
unlocking onset latency easy easy 125
easy hard 75
hard easy & hard 50
suspension waiting time easy & hard easy & hard 0
preparation waiting time easy & hard easy & hard 285
apparatus manual transduction time easy & hard easy & hard 10
Note. Time parameters are given in milliseconds. "Easy" and "hard" refer to the difficulty of response selection in Tasks 1 and 2. The easy and hard cases of Task 1 involve two and five alternative S-R pairs,
respectively; the easy and hard cases of Task 2 involve one and two S-R pairs, respectively.
15

Computational Theory of Human Performance: Part 2 Meyer & Kieras
efficiency may have stemmed from extensive practice that these participants received with the PRP procedure.3
Simulated and empirical mean RTs. In light of the preceding considerations, Figure 6A shows simulated versus empirical mean RTs for the PRP study by Karlin and Kestenbaum (1968) when Task 1 had two S-R pairs and Task 2 response selection was "easy" (i.e., involved one S-R pair) or "hard" (i.e., involved two S-R pairs). like empirical mean Task 1 RTs (solid curves), the simulated mean Task 1 RTs (dashed curves) are relatively long and do not depend much on either the SOA or Task 2 response-selection difficulty. The goodness-of-fit (root mean squared error RMSE =17 ms) achieved here with respect to mean Task 1 RTs rivals the SRD model's previous success (cf. Figure 5) for the PRP study by Hawkins et al. (1979).
Similarly, in the present case (i.e., Figure 6A), there is a good fit (R2 = .985; RMSE =11 ms) between simulated and empirical mean Task 2 RTs for Karlin and Kestenbaum's (1968) PRP study. As before (cf. Figure 5C), the Task 2 RTs again embody a marked interaction between the effects of SOA and Task 2 response-selection difficulty, replicating and extending what was found previously with the auditory-manual and visual-manual task combination of Hawkins et al. (1979). At the shortest SOA, the mean Task 2 RTs associated respectively with the easy (simple-reaction) and hard (choice-reaction) versions of Task 2 are about equally long. As the SOA increases, however, the mean Task 2 RTs decrease more precipitously when Task 2 response selection is easy. This pattern presumably stems from a commonality in how the SRD model's and people's executive processes schedule response selection and movement production during Task 2.
Complementing these results, Figure 6B also shows mean RTs for Karlin and Kestenbaum's (1968) PRP study when Task 1 response selection was "easy" (i.e., involved two S-R pairs) or "hard" (i.e., involved five S-R pairs) and Task 2 involved two S-R pairs. Here Task 1 response-selection difficulty affects both the simulated and empirical mean Task 1 RTs, but SOA does not This pattern is mimicked faithfully by the SRD model (RMSE = 16 ms). The model conforms well (R2 = .991; RMSE = 9 ms) to a new form of interaction not encountered previously as part of our simulations: At short SOAs, both simulated and empirical mean Task 2 RTs are markedly affected by the difficulty of Task 1 response selection, whereas this effect disappears at long SOAs.
Several related aspects of task scheduling presumably contribute to why the Task 1 difficulty effect on mean Task 2 RTs changes as the SOA increases. At short SOAs, both people's and the SRD model's executive processes have to postpone the production of selected Task 2 responses until after Task 1 response selection has been completed. This postponement must last longer when response selection for Task 1 is difficult, thereby differentially lengthening concommitant Task 2 RTs. In contrast, at long SOAs, both easy and difficult Task 1 response selection may finish before Task 2 even starts, so the production of selected Task 2 responses does not have to be postponed, and there is no effect of Task 1 response-selection difficulty on mean Task 2 RTs.
Theoretical implications. The success of the SRD model in accounting for the results of Karlin and Kestenbaum (1968) further documents the model's parsimony and generality. Under conditions that replicate and extend those of Hawkins et al. (1979), simulated RTs from the model again fit empirical RTs with relatively few context-dependent parameters, assuming optimized task scheduling through concurrent response-selection processes and deferred Task 2 movement production. Given that Karlin and Kestenbaum's (1968) participants were highly experienced, apparently what practice did for them was to help refine operations by their executive processes, maximizing the efficiency of coordination between tasks.
3 Before producing the empirical RTs that are considered here, Karlin and Kestenbaum's (1968) subjects participated for at least fifty prior sessions in other related studies. This gave mem much more experience than most subjects usually have with the PRP procedure. In contrast, Hawkins et al.'s (1979) subjects only participated for two sessions. Perhaps extensive practice helps people to evolve a fully optimized executive process in which the unlocking onset latency and suspension waiting time for Task 2 are as short as possible while still satisfying the PRP procedure's task instructions.
16

Computational Theory of Human Performance: Part 2 Meyer & Kieras
a» E
800
700
600 o E i- c 500 o u a 0) E
400-
| 300
200-
100
(A) Effects of Task 2 Difficulty
MeanRT Taskl Task 2
Easy Task 2 Hard Task 2
250 500 750
SOA (ms)
(B) Effects of Task 1 Difficulty
Mean RT Task 1 Task 2
Easy Taskl Hard Task 1
1000 1250 0 250 500 750
SOA (ms)
1000 1250
Figure 6. Results from simulations with the SRD model for the PRP study by Karlin and Kestenbaum (1968). Large symbols on solid curves represent empirical mean RTs; small symbols on dashed curves represent simulated mean RTs. Unfilled and filled symbols represent mean Task 1 and Task 2 RTs, respectively. A: Simulated versus empirical mean RTs when Task 1 involved two S-R pairs and Task 2 was easy (i.e., involved one S-R pair) or hard (i.e., involved two S-R pairs). B: Simulated versus empirical mean RTs when Task 1 was easy (i.e., involved two S-R pairs) or hard (i.e., involved five S-R pairs) and Task 2 involved two S-R pairs.
17

Computational Theory of Human Performance: Part 2 Meyer & Kieras
PRP Study by McCann and Johnston
Another instructive application of the SRD model focuses on a PRP study by McCann and Johnston (1992, Exp. 1). This study interests us for three reasons. First, Task 1 was relatively easy compared to Task 2. Second, at short SOAs, eye movements to the Task 2 stimulus may not have been completed until well after its onset. Third, the difficulty of response-selection in Task 2 was varied through a manipulation of S-R compatibility rather than S-R numerosity. Together, these design features provide an instructive new context in which to illustrate how parallel PRP curves can emerge from the SRD model even though Task 1 and Task 2 response-selection processes are potentially concurrent.4 The present illustration is especially pertinent because it casts strong doubt on some of the conclusions reached by McCann and Johnston (1992), who inferred that an immutable response-selection bottleneck accounts best for their results.
Like one condition of Hawkins et al. (1979), the PRP study by McCann and Johnston (1992) used a combination of auditory-vocal and visual-manual tasks. Task 1 required vocal responses (the spoken words "high" and "low") to auditory stimuli (high and low pitch tones). Task 2 required manual responses (finger keypresses) to visual stimuli (geometric objects). RTs were measured as a function of Task 2 S-R compatibility and SOA.
S-R compatibility was manipulated by presenting Task 2 stimuli whose shapes and sizes both varied across trials. On some trials, for example, either a small, medium, or large triangle that involved a compatible Task 2 S-R mapping was presented. In response to it, participants pressed a key with either the index, middle, or ring finger of one (e.g., right) hand. A simple correspondence existed between stimulus size and spatial finger position (e.g., small —> index, medium —> middle, and large —> ring) for this case. On other trials, either a small, medium, or large rectangle that involved an incompatible Task 2 S-R mapping was presented. In response to it, participants pressed a key with either the ring, middle, or index finger of their other (e.g., left) hand, but the relation between stimulus size and spatial finger position was more complex (e.g., small —> middle, medium —> ring, and large —> index). Presumably this complexity made it more difficult to select the correct Task 2 response than when the mapping was compatible.
Empirical mean RTs. Figure 7 shows the empirical mean RTs (solid curves) that McCann and Johnston (1992, Exp. 1) obtained with their PRP procedure.5 The mean Task 1 RTs are rather short and not affected much by either the SOA or Task 2 response-selection difficulty. In contrast, the mean Task 2 RTs are always on the order of 200 ms or more longer, and the SOA together with Task 2 response-selection difficulty have approximately additive effects on them, yielding nearly "parallel" (vertically equidistant) empirical PRP curves.
Details of simulation. To account for these results, we have applied the SRD model, using the parameter values in Table 2 (next-to-right column). These values are mostly similar to those used during our previous simulations.6 Nevertheless, two important points should be noted here. First, for our simulations of performance by McCann and Johnston's (1992, Exp. 1) participants, the Task 1 auditory identification and response-selection times are relatively short, consistent with the
4 As discussed more fully by Meyer and Kieras (1997a, Figure 15), the SRD model can yield four distinct families of PRP curves, whose forms depend on the SOA and relative difficulty of Task 1 versus Task 2. Within some of these families, the mean Task 2 RTs embody additive rather than interactive effects of SOA and Task 2 response-selection difficulty, thereby forming PRP curves that are "parallel" (i.e., vertically equidistant over the domain of non-negative SOAs) instead of "diverging" like those in Figure 5 (left panels) and Figure 6 (top panel).
5 We thank Robb McCann for providing previously unpublished details about these and other related data from the studies by McCann and Johnston (1992, Exps. 1 and 2).
6 For the compatible Task 2 S-R mapping, the SRD model's production rules always take a single cognitive-processor cycle to choose the Task 2 response on the basis of the Task 2 stimulus size. More cycles are taken on average when the mapping is incompatible, because for it, the Task 2 stimulus size does not have a direct ordered relation with the required finger keypress.
18

Computational Theory of Human Performance: Part 2 Meyer & Kieras
1100-,
1000-
CD E 900 0) E 800 H C o
■MM 700 o cu 0>
DC 600 c (6
500
400-
300
Mean RT
Taskl Task 2 Compatible Task 2
Incompatible Task 2
0 200 400
SOA (ms)
600 800
Figure 7. Results from simulations with the SRD model for the first PRP study by McCann and Johnston (1992, Exp. 1). Large symbols on solid curves represent empirical mean RTs; small symbols on dashed curves represent simulated mean RTs. Filled circles and triangles represent mean Task 2 RTs when Task 2 involved either a compatible or incompatible S-R mapping, respectively; unfilled circles and triangles represent corresponding mean Task 1 RTs.
19

Computational Theory of Human Performance: Part 2 Meyer & Kieras
Table 2
Context-Dependent Parameters in Simulations Conducted with The SRD Model for The PRP Studies by McCann and Johnston (1992)
System Component Parameter Name Task 2
Difficulty Mean Parameter Value
Exp. 1 Exp. 2
perceptual processors auditory identification time easy & hard 150 190 visual identification time easy & hard 385 225
Task 1 process number of selection cycles easy & hard 1.00 1.00
Task 2 process number of selection cycles easy 1.00 1.00 hard 2.33 2.13
preparation benefit easy & hard 50 50
executive process ocular orientation time easy & hard 195 0 unlocking onset latency easy & hard 175 0 suspension waiting time easy & hard 200 100 preparation waiting time easy & hard 1100 1100
apparatus manual transduction time easy & hard 10 10 vocal transduction time easy & hard 70 70
Note. Time parameters are given in milliseconds. "Easy" and "hard" refer to the difficulty of response selection in Task 2, which depend on the S-R compatibility (high vs. low).
20

Computational Theory of Human Performance: Part 2 Meyer & Kieras
short empirical mean Task 1 RTs. Second, the ocular orientation time for fixating the Task 2 stimulus location is relatively long (195 ms) compared to the shortest SOA (50 ms) that separated the onsets of the Task 1 and Task 2 stimuli.7 .
Our assumption of a relatively long ocular orientation time may be justified on the basis of McCann and Johnston's (1992, Exp. 1) experimental procedure. To help their participants perform well, McCann and Johnston gave them a diagram that outlined the required S-R mappings for Task 2. The diagram remained available throughout the experiment and was placed below the computer screen on which the Task 2 stimuli appeared. It seems likely that even after some practice, participants may have regularly taken their eyes off the screen between trials, looking instead at the diagram for a reminder about the details of the incompatible Task 2 S-R mappings. Such inspection was encouraged because different mappings were intermingled across trials; participants could not concentrate on just one mapping, either compatible or incompatible, throughout an entire trial block Thus, they may have tended to be somewhat slow at refixating the Task 2 stimulus location after the start of each new trial. Also, a long ocular orientation time is consistent with the "parallel" empirical PRP curves reported by McCann and Johnston (1992). As discussed by Meyer and Kieras (1997a), slow refixation on the Task 2 stimulus location can preclude post-selection slack in Task 2 RTs at short SOAs, especially when Task 1 is completed quickly.
Simulated mean RTs. Substantiating these possibilities, Figure 7 shows simulated mean RTs (dashed curves) that the SRD model produces with respect to McCann and Johnston's (1992, Exp. 1) PRP study. For their Task 1, the fit between the simulated and empirical mean RTs is excellent (RMSE = 6 ms). There is also a reasonably good fit between the simulated and empirical mean Task 2 RTs (R2 = .956; RMSE = 19 ms). Just like the empirical PRP curves, the simulated PRP curves are nearly "parallel", exhibiting essentially additive effects of SOA and Task 2 response- selection difficulty. The SRD model's present success requires no more context-dependent parameter values than in previous simulations where excellent fits to RT data have been obtained.8
Theoretical implications. Our simulation of results from the PRP study by McCann and Johnston (1992, Exp. 1) therefore has a clear message, which echoes earlier theoretical points (Meyer & Kieras, 1997a). Parallel PRP curves do not necessarily prove the existence of an immutable structural response-selection bottleneck. Rather, they may stem from short Task 1 durations and relatively long ocular orientation times that preclude temporal overlap between potentially concurrent response-selection processes. Apparently the SRD model has the sensitivity and generality to differentiate among various contexts in which such overlap does or does not occur. Unfortunately, such sensitivity and generality are lacking in past bottleneck models, whose
7 During McCann and Johnston's (1992, Exp. 1) study, compound Task 1 stimuli were presented. Following a visual warning stimulus at the start of each trial, a 500 msec standard tone occurred as the first part of the Task 1 stimulus. Next there was a 300 msec intertone interval. Then a 500 msec comparison tone occurred as the second part of the Task 1 stimulus. Subjects judged whether the comparison tone was higher or lower in pitch than the standard tone. Task 1 RTs and SOAs for Task 2 stimuli were measured relative to the onset of the Task 1 comparison tone. Similarly, the present ocular orientation time is measured relative to this onset. Our simulation assumes that the ocular motor processor begins preparing an eye movement to the Task 2 stimulus location at about the same time as the Task 1 comparison tone starts. The ocular orientation time determines when EPIC's eyes arrive at the Task 2 stimulus location after the onset of the Task 1 comparison tone.
8 The present account of RTs for McCann and Johnston's (1992, Exp. 1) PRP study is supported further by results from a PRP study that Schmacher, Glass, Lauber, Gmeindl, Woodside, Kieras, and Meyer (1996, Exp. 3) have conducted. During the latter study, S-R compatibility in Task 2 was manipulated systematically across trial blocks, and eye movements immediately before the Task 2 stimuli were strongly discouraged. Under these conditions, SOA and Task 2 S-R compatibility affected mean Task 2 RTs interactively; the compatibility effect was less at short SOAs than at long SOAs, yielding divergent rather than "parallel" PRP curves. This outcome has several implications. It shows that not only S-R numerosity but also other factors whose influences occur in response selection can have interactive effects with SOA, indicative of temporally overlapping response-selection processes for Tasks 1 and 2. In addition, it shows that as predicted by the SRD model (Meyer & Kieras, 1997a, Figure 15), various patterns of mean Task 2 RTs may stem from mampulations of S-R compatibility just as they do from manipulations of S-R numerosity (cf. Figure 5), depending on certain contextual details.
21

Computational Theory of Human Performance: Part 2 Meyer & Kieras
assumptions fail to accommodate crucial details of executive processes, central cognitive-processor capacity, and peripheral perceptual-motor limitations.
Extensions of The SRD Model
Of course, we do not claim that the SRD model as described thus far accounts fully for human multiple-task performance under all circumstances. Rather, depending on circumstances at hand, the model may have to be modified and extended. For example, the next subsections outline several specific extensions that are still within the domain of the PRP procedure, but that foreshadow some future directions where theorizing could go.
Conservative Use of Deferred Response-Transmission Mode for Task 2
One initial feature of the SRD model has concerned the evolving status of Task 2 as Task 1 progresses during the PRP procedure. We have assumed that at short SOAs, response selection for Task 2 takes place in deferred response-transmission mode until Task 1 is "done" and the model's executive process starts unlocking Task 2 (Figure 4). While the deferred mode prevails, the identities of selected Task 2 responses are put in working memory temporarily, and they are later sent to their motor processor for overt execution after unlocking is finished. By contrast, we have assumed that at long SOAs, Task 2 response-selection proceeds in immediate response-transmission mode. The deferred-to-immediate mode shift is made by the SRD model's executive process as it unlocks Task 2, if a Task 2 response has not been selected already. Following the mode shift, subsequently selected Task 2 responses are sent to their motor processor directly, rather than passing through working memory along the way. This more direct route helps shorten the overall Task 2 RTs, and it contributes beneficially to good fits produced by some of our simulations.
Elevated empirical PRP curve. However, some data suggest that performance of Task 2 is occasionally less optimized than the SRD model implies. For example, consider the mean Task 2 RTs that Hawkins et al. (1979) obtained when they combined an auditory-vocal Task 1 with an easy visual-manual Task 2 (Figure 5A). There the empirical (solid) PRP curve at moderately long and very long SOAs (viz. 600 and 1200 ms) was significantly (i.e., about 50 ms) higher than the SRD model's simulated (dashed) PRP curve. This may have occurred because the easy Task 2 was being performed in the context of a Task 1 that took a relatively long time to complete (i.e., the auditory- vocal Task 1 reactions were rather slow). Perhaps participants adopted a conservative strategy for using the deferred response-transmission mode to avoid producing Task 2 responses before Task 1 responses, thereby delaying the Task 2 responses more than necessary after Task 1 was "done."
Continuation of Task 2 in deferred/permitted mode. Concerning such conservatism, a simple extension of the SRD model may characterize how it arises. Suppose that when Task 1 is "done" and unlocking of Task 2 begins, the model's executive process continues Task 2 in the deferred response-transmission mode, rather than shifting it to immediate mode. Also, suppose that to unlock Task 2 without the mode shift, the executive process puts a permission note in working memory, indicating that the identities of future selected Task 2 responses may be transmitted to their motor processor as soon as they have entered working memory through the deferred mode. Then at long SOAs, this deferred/permitted-mode strategy would take one more cognitive-processor cycle than the immediate-mode strategy does for Task 2 responses to reach their motor processor.9
Consequently, the overt onsets of these responses would be delayed by an average increment of 50 ms compared to what the original SRD model implies, just as Hawkins et al. (1979) observed.
9 Immediate-mode production mles send the identities of selected Task 2 responses directly to their motor processor, using one cognitive-processor cycle, whereas deferred-mode production rules use one cycle for sending them to working memory, and a second cycle for transmitting them from working memory to their motor processor.
22

Computational Theory of Human Performance: Part 2 Meyer & Kieras
Progressive Unlocking
Some aspects of participants' performance are not so conservative, however. For example, let us again consider what Hawkins et al. (1979) found when they combined an auditory-vocal Task 1 with an easy visual-manual Task 2 (Figure 5 A). In that case, the empirical mean Task 2 RTs at short SOAs (viz. 0 < SOA < 200 ms) fell on a PRP curve whose slope was significantly steeper than the slope of the curve on which the simulated mean Task 2 RTs fell (viz. -1.3 vs. -1.0). Neither the original SRD model nor an unadorned response-selection bottleneck model can explain this discrepancy, because they imply that PRP curves should always have slopes of-1 or shallower.
Rationale for PRP curves with slopes less than or equal -1. The original SRD model implies PRP curves no steeper than -1 because its executive process does "static unlocking" of Task 2. At the start of each trial, the executive process specifies a prospective internal event such that when it happens during the performance of Task 1, this will qualify Task 1 to be declared "done" and Task 2 to be unlocked The specified Task 1 unlocking event remains set throughout the rest of the trial (hence the term "static unlocking"). The amount of time that transpires between the selection of a Task 1 response and the occurrence of the Task 1 "done" event is, by definition, the executive process's unlocking-onset latency. Unlocking of Task 2 begins as soon as the specified Task 1 "done" event subsequently occurs. For example, Task 1 might be declared "done" and unlocking of Task 2 might begin after the onset of an overt Task 1 response. With static unlocking, Task 2 will always be unlocked at about the same moment in time relative to the onset of the Task 1 stimulus, regardless of the SOA. As a result, the most extreme effect that an increase of the SOA can have on the mean Task 2 RT is to decrease it by the same amount as the SOA increases, yielding a PRP curve with a slope of-1.
Augmentation with progressive unlocking. To account for PRP curves whose slopes are steeper than -1, the SRD model may be augmented with a new optimization feature called "progressive unlocking." It involves making successive contingent choices about what the Task 1 "done" event will be during a trial. Among the possible choices for this event are the following ones: (a) the identity of a selected Task 1 response is sent to its motor processor for movement- feature preparation and execution; (b) preparation of the movement features for the Task 1 response is completed; or (c) the overt Task 1 response has begun.
With progressive unlocking, the specification of the prospective Task 1 "done" event is contingently updated during the course of each trial. In particular, if the Task 1 stimulus gets identified before the Task 2 stimulus has been detected, then the executive process revises the prospective Task 1 "done" event to be an earlier one than was specified initially (hence the term "progressive unlocking"). Consequently, at short SOAs (e.g., SOA < 100 ms), Task 1 might be declared "done" when an overt Task 1 response movement has started, whereas at longer SOAs, Task 1 might be declared "done" as soon as the identity of a selected Task 1 response has been sent to its motor processor for movement production. This dynamic adaptation is justified because long SOAs give Task 1 responses a headstart toward being completed before Task 2 responses, so it becomes feasible to unlock Task 2 at an earlier moment than short SOAs would allow. Also, because progressive unlocking differentially shortens the unlocking-onset latency of the executive process as the SOA increases, it decreases the mean Task 2 RTs at long SOAs more than static unlocking does, thereby yielding PRP curves whose slopes are steeper than -1.
Simulated mean Task 2 RTs based on progressive unlocking. Some explicit benefits of progressive unlocking appear in Figure 8. Here we have replotted empirical mean Task 2 RTs (solid curve) from the combination of an auditory-vocal Task 1 and easy visual-manual Task 2 in the PRP study by Hawkins et al. (1979). Also shown for this case are simulated mean Task 2 RTs (dashed curve) that the SRD model produced when we augmented its executive process with progressive unlocking. Unlike before (cf. Figure 5A), the PRP curve formed by the simulated mean Task 2 RTs at short SOAs is now steeper than -1 and more closely matches the PRP curve of empirical mean Task 2 RTs. The obtained goodness-of-fit suggests that this extension of the SRD model may aptly characterize how participants try to optimize their multiple-task performance under these particular conditions.
23

Computational Theory of Human Performance: Part 2 Meyer & Kieras
1200-,
1000 (0
£ o E
C o ~ 800- u (0 0)
CO Q)
600-
400 200 400 600 800 1000 1200
SOA (ms)
Figure 8. Improved goodness-of-fit between simulated mean RTs (small circles on dashed curves) and empirical mean RTs (large circles on solid curves) for Hawkins et al.'s (1979) PRP study with an auditory-vocal Task 1 and easy visual-manual Task 2. The simulated RTs come from an extension of the SRD model in which its executive process used a new optimization feature, "progressive unlocking," combined with resumption of Task 2 in "permitted" deferred mode after unlocking was completed. Together, these features significantly improve the previous goodness-of-fit achieved by the model (cf. Figure 5A), accounting both for the especially steep slope in the PRP curve at short SOAs and for the somewhat elevated Task 2 RTs at the longest SOA.
24

Computational Theory of Human Performance: Part 2 Meyer & Kieras
Likewise noteworthy in Figure 8 are the simulated mean Task 2 RTs at the moderately long and very long SOAs (i.e., 600 < SOA < 1200 ms). Consistent with the immediately preceding section (Conservative Use of Deferred Mode), our present simulation produced these RTs by performing Task 2 in the deferred/permitted response-transmission mode after progressive unlocking took place. As a result of this executive strategy, the PRP curve of simulated RTs closely matches the PRP curve of empirical RTs over the entire SOA range. Taken together, the extensions made thus far to the SRD model have therefore significantly improved its goodness-of-fit for Hawkins et al.'s (1979) combination of auditory-vocal and easy visual-manual tasks (revised R2 = .996, and RMSE =11 ms; original R2 = .967, and RMSE = 45 ms).10
Strategic Reflexive Control ofSaccadic Eye Movements
Another related extension of the SRD model, which again bears on the optimization of task scheduling, involves the control of eye movements by the model's executive process. Our proposals here stem from results of some additional PRP studies whose participants did not know exactly where visual stimuli for Tasks 1 and/or 2 would occur in space. These studies and their results are interesting because they supplement previous data (e.g., Hawkins et al., 1979; Karlin & Kestenbaum, 1968; McCann & Johnston, 1992, Exp. 1) obtained when participants had complete foreknowledge about the spatial locations of impending visual stimuli.
Specifically, it appears that when people lack complete foreknowledge about where an impending Task 2 stimulus will be located, they do not simply keep their eyes centrally fixated until the Task 2 stimulus occurs. Instead, they pre-position their eyes at one possible Task 2 stimulus location, and then make rapid eye movements to other locations if the Task 2 stimulus occurs there instead. This anticipatory strategy helps minimize mean Task 2 RTs, because it reduces the frequency with which eye movements that have relatively long ocular orientation times must be made to Task 2 stimulus locations after the onsets of Task 2 stimuli. To characterize such benefits, we have augmented the SRD model and ocular motor processor of the EPIC architecture with capabilities for strategic control of reflexive saccades. The present section illustrates these extensions through simulations of mean RTs from a second PRP study by McCann and Johnston (1992, Exp. 2).
McCann and Johnston's second PRP study. This study combined an auditory-vocal Task 1 (viz. responding " high" and "low" respectively to high and low pitch tones) with a visual-manual Task 2. The Task 2 stimuli consisted of two letters ("M" and "T") and two horizontal arrows (<-- and —>) mixed randomly within blocks of trials. The Task 2 responses consisted of keypresses with the left and right index fingers. A compatible S-R mapping was used to associate arrows with keypresses (i.e., press left index finger for a left-pointing arrow, and press right index finger for a right-pointing arrow). In contrast, an incompatible mapping was used to associate letters with keypresses (e.g., press left index finger in response to "M", and press right index finger in response to "T"). The spatial locations of the Task 2 stimuli also varied randomly from trial to trial; they fell on either the left or right side of a central visual-fixation location. Participants were instructed to focus their attention initially on the central location at the start of each trial. Horizontal visual angles of 6.1° separated the central fixation location from the alternative left and right Task 2 stimulus locations. Participants did not know for sure where the next Task 2 stimulus would be located (i.e., left or right of central fixation) until it actually appeared. Also, the Task 2 stimuli were relatively small, subtending visual angles of less than 1° on average. It therefore seems likely that after the onset of the Task 2 stimulus, participants sometimes had to move their eyes rapidly to the Task 2 stimulus in order to identify it accurately. Because of spatial stimulus uncertainty, these eye movements presumably occurred at both short and long SOAs. Unlike in other previous studies (e.g., Hawkins et al., 1979; McCann & Johnston, 1992, Exp. 1), lengthening the SOA did not always let participants pre-position their eyes at the appropriate Task 2 stimulus location.
10 In evaluating this improvement, it should be recalled that the standard errors of the empirical mean Task 2 RTs reported by Hawkins et al. (1979) are approximately 10 ms.
25
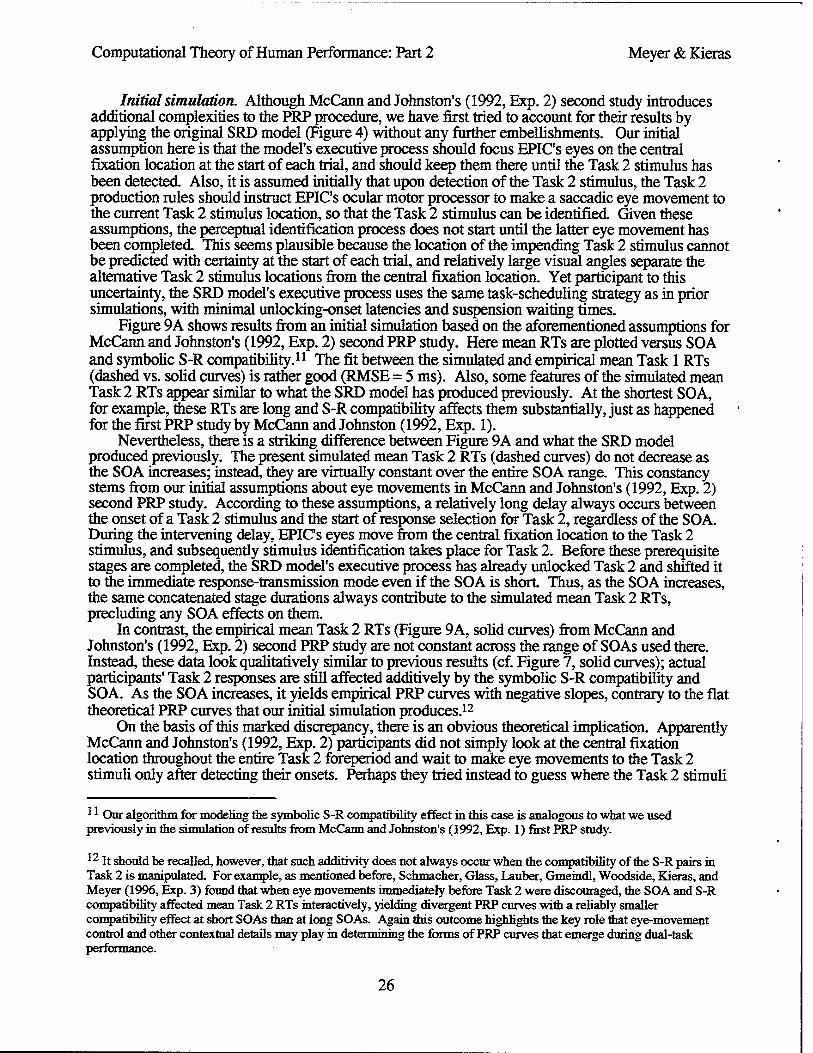
Computational Theory of Human Performance: Part 2 Meyer & Kieras
Initial simulation. Although McCann and Johnston's (1992, Exp. 2) second study introduces additional complexities to the PRP procedure, we have first tried to account for their results by applying the original SRD model (Figure 4) without any further embellishments. Our initial assumption here is that the model's executive process should focus EPIC's eyes on the central fixation location at the start of each trial, and should keep them there until the Task 2 stimulus has been detected. Also, it is assumed initially that upon detection of the Task 2 stimulus, the Task 2 production rules should instruct EPIC's ocular motor processor to make a saccadic eye movement to the current Task 2 stimulus location, so that the Task 2 stimulus can be identified. Given these assumptions, the perceptual identification process does not start until the latter eye movement has been completed. This seems plausible because the location of the impending Task 2 stimulus cannot be predicted with certainty at the start of each trial, and relatively large visual angles separate the alternative Task 2 stimulus locations from the central fixation location. Yet participant to this uncertainty, the SRD model's executive process uses the same task-scheduling strategy as in prior simulations, with minimal unlocking-onset latencies and suspension waiting times.
Figure 9A shows results from an initial simulation based on the aforementioned assumptions for McCann and Johnston's (1992, Exp. 2) second PRP study. Here mean RTs are plotted versus SOA and symbolic S-R compatibility.11 The fit between the simulated and empirical mean Task 1 RTs (dashed vs. solid curves) is rather good (RMSE = 5 ms). Also, some features of the simulated mean Task 2 RTs appear similar to what the SRD model has produced previously. At the shortest SOA, for example, these RTs are long and S-R compatibility affects them substantially, just as happened for the first PRP study by McCann and Johnston (1992, Exp. 1).
Nevertheless, there is a striking difference between Figure 9A and what the SRD model produced previously. The present simulated mean Task 2 RTs (dashed curves) do not decrease as the SOA increases; instead, they are virtually constant over the entire SOA range. This constancy stems from our initial assumptions about eye movements in McCann and Johnston's (1992, Exp. 2) second PRP study. According to these assumptions, a relatively long delay always occurs between the onset of a Task 2 stimulus and the start of response selection for Task 2, regardless of the SOA. During the intervening delay, EPIC's eyes move from the central fixation location to the Task 2 stimulus, and subsequently stimulus identification takes place for Task 2. Before these prerequisite stages are completed, the SRD model's executive process has already unlocked Task 2 and shifted it to the immediate response-transmission mode even if the SOA is short. Thus, as the SOA increases, the same concatenated stage durations always contribute to the simulated mean Task 2 RTs, precluding any SOA effects on them.
In contrast, the empirical mean Task 2 RTs (Figure 9 A, solid curves) from McCann and Johnston's (1992, Exp. 2) second PRP study are not constant across the range of SOAs used there. Instead, these data look qualitatively similar to previous results (cf. Figure 7, solid curves); actual participants' Task 2 responses are still affected additively by the symbolic S-R compatibility and SOA. As the SOA increases, it yields empirical PRP curves with negative slopes, contrary to the flat theoretical PRP curves that our initial simulation produces.12
On the basis of this marked discrepancy, there is an obvious theoretical implication. Apparently McCann and Johnston's (1992, Exp. 2) participants did not simply look at the central fixation location throughout the entire Task 2 foreperiod and wait to make eye movements to the Task 2 stimuli only after detecting their onsets. Perhaps they tried instead to guess where the Task 2 stimuli
11 Our algorithm for modeling the symbolic S-R compatibility effect in this case is analogous to what we used previously in the simulation of results from McCann and Johnston's (1992, Exp. 1) first PRP study.
12 It should be recalled, however, that such additivity does not always occur when the compatibility of the S-R pairs in Task 2 is manipulated. For example, as mentioned before, Schmacher, Glass, Lauber, Gmeindl, Woodside, Kieras, and Meyer (1996, Exp. 3) found that when eye movements immediately before Task 2 were discouraged, the SOA and S-R compatibility affected mean Task 2 RTs interactively, yielding divergent PRP curves with a reliably smaller compatibility effect at short SOAs than at long SOAs. Again this outcome highlights the key role that eye-movement control and other contextual details may play in determining the forms of PRP curves that emerge during dual-task performance.
26

Computational Theory of Human Performance: Part 2 Meyer & Kieras
1000n (A) Fit by Original SRD Model
Mean RT Task 1 Task 2 —o— —•— Compatible Task 2 -*- -*— Incompatible Task 2
-* 900 CO
(B) Fit by Extended SRD Model
MeanRT Taskl Task 2
Compatible Task 2 Incompatible Task 2
fll.TT.lft
200 400 SOA (ms)
600 800 0 200 400 SOA (ms)
600 800
Figure 9. Results from simulations with the SRD model for the second PRP study by McCann and Johnston (1992, Exp. 2). Large symbols on solid curves represent empirical mean RTs; small symbols on dashed curves represent simulated mean RTs. Filled circles and triangles represent mean Task 2 RTs when Task 2 involved an S-R mapping that was either symbolically compatible or incompatible, respectively; unfilled circles and triangles represent corresponding mean Task 1 RTs. The RTs have been averaged across conditions in which the stimuli and responses were spatially congruent or incongruent. A: Poor fit for Task 2 RTs produced by the original SRD model. B: Improved fit for Task 2 RTs produced by an extension of the SRD model that incorporated strategic executive control of reflexive saccadic eye movements.
27

Computational Theory of Human Performance: Part 2 Meyer & Kieras
would occur and moved their eyes there anticipatorily, thus achieving typical PRP performance at least on those trials during which the anticipatory eye movements succeeded.
Augmented simulation. To account more veridically for the preceding data, we have extended the SRD model and EPIC architecture in new directions during a subsequent augmented simulation. As part of this extension, the model's executive process instructed EPIC's ocular motor processor to make anticipatory eye movements at the start of each simulated trial under conditions like those of McCann and Johnston's (1992, Exp. 2) second PRP study. These eye movements involved randomly guessing where the next Task 2 stimulus would be displayed (either left or right of central fixation) and then pre-positioning EPIC's eyes there. If the next Task 2 stimulus was displayed subsequently at its anticipated location, then performance of Task 2 took place according to the original SRD model. However, if the next Task 2 stimulus was displayed elsewhere, then soon after its onset was detected, EPIC's ocular motor processor initiated an extra "corrective" saccadic eye movement. This involved executing another saccade to the actual Task 2 stimulus location, after which stimulus identification and other stages of processing (e.g., response selection) proceeded for Task 2.
Furthermore, while implementing this extension of the SRD model, we made an important supplementary discovery. In order for the simulated Task 2 RTs to have appropriately short values at long SO As, the latencies of the corrective saccadic eye movements had to be very brief (< 150 ms). The required brevity could not be achieved with a full series of steps during which (a) the Task 2 stimulus is detected at an unanticipated location, (b) a note about the detection event is placed in working memory, (c) the cognitive processor fires a production rule that instructs EPIC's ocular motor processor to produce a saccadic eye movement to the Task 2 stimulus location, (d) the ocular motor processor prepares a complete set of eye-movement features, and then (e) the saccade is physically initiated. Rather, for corrective saccades that are sufficiently fast, a different short- circuited pathway must be taken from detecting the Task 2 stimulus onsets to starting the corrective saccades toward them. That there might be such a pathway is, of course, consistent with prior evidence of "express" saccades (Fischer & Ramsberger, 1984,1986; Reuter-Lorenz, Hughes, & Fendrich, 1991).
We have accordingly elaborated EPIC's ocular motor processor with a new "reflex" mode through which rapid saccadic eye movements are produced automatically. The reflex mode complements the "voluntary" (i.e., cognitive-processor controlled) mode through which eye movements were initiated during our previous simulations with the SRD model. When set to reflex mode, the ocular motor processor waits for a signal that the onset of a new visual stimulus has occurred. This signal, which by-passes working memory, comes directly from EPIC's visual perceptual processor. The visual perceptual processor also provides the ocular motor processor with directly accessible information about the stimulus onset's spatial location. Upon accessing this information in response to the stimulus-onset signal, the ocular motor processor immediately prepares and initiates a saccade toward the stimulus without further ado. Given how the ocular motor processor's reflex mode works, the latency of a saccade produced through it may be as short as 125 ms, approximating previously reported express-saccade latencies (Fischer & Ramsberger, 1984, 1986; Reuter-Lorenz, Hughes, & Fendrich, 1991).13 This value is substantially less than the one associated with cognitively controlled saccades, whose latency can be as much as 300 ms.14
Both the reflex and voluntary control modes of EPIC's ocular motor processor contributed significantly to our augmented simulation for McCann and Johnston's (1992, Exp. 2) second PRP study. When the executive process of the SRD model requested that EPIC's eyes be pre-positioned on an anticipated Task 2 stimulus location (e.g., left of central fixation) at the start of each trial, the
13 To be precise, the 125 ms includes 50 ms for stimulus-onset detection by EPIC's visual perceptual processor, 25 ms for transmission of this onset-detection event to the ocular motor processor, and 50 ms for initiation of a subsequent overt express saccade.
14 To be precise, the 300 ms could include 100 ms for detecting a stimulus onset and putting a note about it in working memory, 50 ms for firing a cognitive-processor production rule to request an eye movement by the ocular motor processor, 100 ms for preparing the features of the eye movement, and 50 ms for initiating physical action after the ocular motor processor has prepared these features.
28

Computational Theory of Human Performance: Part 2 Meyer & Kieras
response to this request involved using the voluntary control mode. After the eyes reached the anticipated location, the executive process shifted the ocular motor processor to its reflex mode and prepared for a prospective express saccade to the other possible Task 2 stimulus location (e.g., right of central fixation). This minimized the latencies of corrective saccadic eye movements whenever they were needed. The assumed distinction between reflex and voluntary ocular-motor control modes is supported by both past neurophysiological data (eg., Guitton, Buchtel, & Douglas, 1985; Henik, Rafalf& Rhodes, 1994; Leichnetz, 1981; Rafal, Henik, & Smith, 1991; Schiller, Sandell, & Maunsell, 1987) and present simulation results.15 .
Figure 9B(dashed curves) shows mean RTs that we produced with our augmented simulation tor the second PRP study of McCann and Johnston (1992, Exp. 2). Compared to their empirical mean RTs (solid curves), the fit of these simulated mean RTs fit is reasonably good. For example, the effects of both the SOA and symbolic S-R compatibility on mean Task 2 RTs are mimicked rather well (R2 = .986; RMSE = 11 ms). The present simulated PRP curves appear approximately "parallel" (i.e., vertically equidistant) because the adaptive eye-movement strategy used to deal with inherent spatial stimulus uncertainty precludes post-selection slack during Task 2.
Effect of spatial S-R congruence. Another interesting result from McCann and Johnston s second PRP study concerns the effect of spatial congruence between Task 2 stimuli and responses (i.e., the degree to which the Task 2 stimulus locations matched the locations of the correct Task 2 responses). This factor gave no relevant information to participants; only the Task 2 stimulus identities indicated what the correct Task 2 responses were. Nevertheless, consistent with previous research (e.g., Hasbroucq & Guiard, 1991; Hedge & Marsh, 1975; Simon, Acosta, Mewaldt, & SpiedeL 1976), McCann and Johnston (1992, Exp. 2) found a reliable effect of spatial S-R congruence on empirical mean Task 2 RTs (Figure 10). As the SOA increased, Task 2 responses became differentially faster when they were spatially congruent than when they were incongruent, forming divergent PRP curves with an interaction between SOA and spatial S-R congruence.
To account for the latter pattern, we have elaborated the production rules used by the model s executive process in anticipatory preparation of Task 2 responses. This elaboration includes three additional steps: (a) the executive process waits for the onset of the visual Task 2 stimulus to be detected- (b) after the detection event, a decision is made about whether the auditory Task 1 stimulus has already ended; (c) if so, then the executive process instructs EPIC's manual motor processor to prepare for making a keypress with the hand on the same side (i.e., left or right) as the current Task 2 stimulus. . ,. ^
The rationale for these steps is straightforward. In many situations where an object appears at some peripheral location, it ultimately has to be reached and grasped manually. Anticipatory preparation of a movement by the arm and hand on the same side of space as the object may speed the reaching and grasping action. Thus, out of habit, perhaps participants also use such preparation as part of their executive processes under the PRP procedure when they must respond manually to Task 2 stimuli on either side of a central fixation point .
This preparatory strategy has some interesting consequences. Its likelihood of being completed soon enough to facilitate a Task 2 response increases as a function of the SOA. If preparation is completed beforehand, then on average, it will reduce the ultimate movement production time that the manual motor processor contributes to the simulated mean Task 2 RTs. Illustrating the expected outcome, Figure 10 shows simulated mean RTs (dashed curves) for spatially congruent and incongruent Task 2 responses in McCann and Johnston's (1992, Exp. 2) second PRP study. The fit with corresponding empirical mean Task 2 RTs (solid curves) seems adequate as a first approximation (R2 = .984; RMSE= 12 ms). Table 2 (right column) lists the mean values of the
15 Some neurophysiological studies of brain-lesion effects on ocular-motor control suggest mat the superior colliculus of the human brain might directly mediate a reflex mode of saccade production, whereas the brain's frontal eye fields might play a greater part in the voluntary mode (Guitton et al., 1985; Henik et al., in press; Leichnetz, 1981; Rafal et al., 1991; Rafal & Henik, 1994; Schiller et al., 1987). The frontal eye fields might also contribute significantly to shifts between these two modes.
29
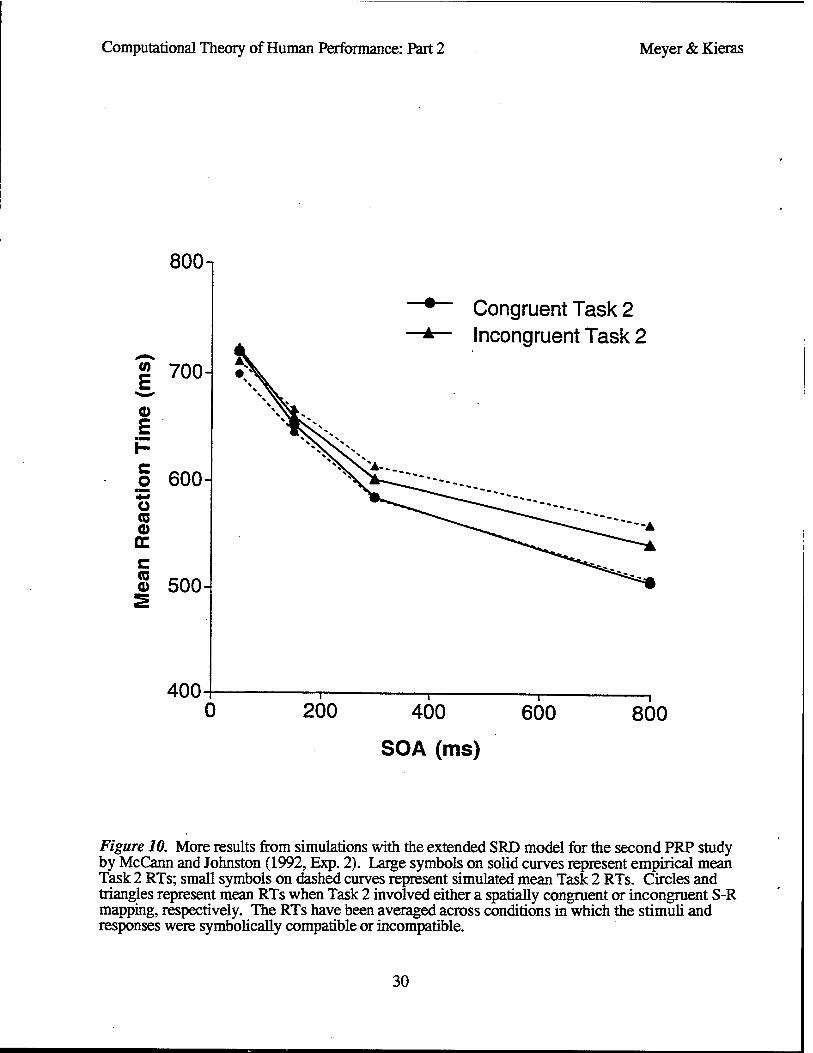
Computational Theory of Human Performance: Part 2 Meyer & Kieras
800-1
<0
E 700 "»—^
0) £ i- c o 600 +* Ü (0 0 oc c (C 500
400-
"•" Congruent Task 2 -*— Incongruent Task 2
0 200 400 600
SOA (ms)
800
Figure 10. More results from simulations with the extended SRD model for the second PRP study by McCann and Johnston (1992, Exp. 2). Large symbols on solid curves represent empirical mean Task 2 RTs; small symbols on dashed curves represent simulated mean Task 2 RTs. Circles and triangles represent mean RTs when Task 2 involved either a spatially congruent or incongruent S-R mapping, respectively. The RTs have been averaged across conditions in which the stimuli and responses were symbolically compatible or incompatible.
30

Computational Theory of Human Performance: Part 2 Meyer & Kieras
parameters used in producing the present fit. On most counts, they are similar to those used during our previous successful simulations.16
Theoretical implications. From the success of our simulations for McCann and Johnston's (1992, Exp. 2) second PRP study, we infer that the SRD model and its underlying EPIC architecture are precise and powerful enough to help understand how people cope with environmental uncertainties during elementary multiple-task performance. Specifically, the present extension of the model provides a detailed account of what happens when there is subjective uncertainty about the prospective spatial locations of visual secondary-task stimuli. As part of this account, various modes of ocular-motor control may be distinguished, through which corrective saccadic eye movements take place if visual stimuli arrive at locations other than those where the eyes are currently focused Together with such control, the principles of task scheduling used by the executive process of the original SRD model still seem applicable for characterizing empirical data from the PRP procedure.17
Symmetric Deferred-Mode Scheduling of Temporally-Uncertain Vocal and Manual Tasks
Further substantiating the previous conclusions, we have extended the SRD model to theorize about how people cope with other types of uncertainty during multiple-task performance. Our next simulations concern what happens when two tasks must be performed rapidly in proper serial order, but the order of required responses remains uncertain until the onsets of the stimuli for them are detected. This latter situation differs from the standard PRP procedure, where the primary and secondary tasks are completely specified beforehand, and their stimuli always occur in the same order (i.e., the SOA is non-negative). Because of such differences, one might expect that alternative strategies of task scheduling would be needed to cope with the various degrees of temporal uncertainty that are involved here. The present section discusses how these strategies can be implemented on the basis of mechanisms already assumed under the original SRD model. In particular, we show that the model's deferred response-transmission mode may again make important contributions, enabling efficient performance of multiple tasks despite an absence of foreknowledge about their serial order.
Pashler's study with variable task order. For our current objectives, an innovative study by Pashler (1990, Exp. 2) provides a first helpful benchmark. During this study, participants performed two successive choice-reaction tasks. One task required manual (right index, middle, or ring finger keypress) responses to visual stimuli ("A", "B", or "C); the other task required vocal ("high" or "low") responses to auditory stimuli (300 or 900 Hz tones). SOAs ranging from 100 to 700 ms separated the onsets of the stimuli for these tasks.
Two conditions with different levels of temporal uncertainty about the serial order of the tasks were included in Pashlef s (1990, Exp. 2) study. We will call these the constant-order and variable- order conditions, respectively. Separate blocks of discrete test trials were conducted under each condition. Participants were always told what the current condition was. For the constant-order condition, the serial order of the visual and auditory stimuli was the same (e.g., auditory first, and
16 Nevertheless, there is one interesting parametric difference here. Our simulation of McCann and Johnston's (1992, Exp. 2) second PRP study involves a shorter unlocking-onset latency than was used for their first study. This difference is presumably due to subjects unlocking Task 2 sooner after the onset of the Task 1 stimulus in the second study. Such early unlocking may have occurred because during the second study, prevailing uncertainties about impending stimulus locations delayed subjects* eye movements to the Task 2 stimulus, thereby letting Task 1 always be finished before Task 2 without a need for long unlocking-onset latencies.
17 It should be noted, however, that McCann and Johnston (1992, Exp. 2) also reported a small but reliable triple interaction between the effects of SOA, symbolic S-R compatibility, and spatial S-R congruence on mean Task 2 RTs. This interaction suggests that these three factors jointly influenced at least one stage of processing (Sternberg, 1969). Neither the present extension of the SRD model nor any extant bottleneck model accounts fully for such a finding. More theoretical work is therefore needed to deal completely with results from McCann and Johnston's (1992, Exp. 2) PRP study.
31

Computational Theory of Human Performance: Part 2 Meyer & Kieras
visual second) on each trial during a block, so participants knew exactly which task would come first, as in the standard PRP procedure. For the variable-order condition, however, there was more temporal uncertainty; the serial order of the stimuli varied randomly from trial to trial (i.e., auditory- visual on one trial, and visual-auditory on another) during a block. No task precues were provided under the variable-order condition, so participants did not know which task would come first until the stimulus onsets had been detected. Nevertheless, for both the variable-order and constant-order conditions, participants were instructed to "respond as promptly as possible to the first stimulus that appears, and then respond as promptly as possible to the second stimulus" (Pashler, 1990, p. 831). Given this latter constraint together with distinct degrees of uncertainty about the serial order of the stimuli, the SRD model's principles for task scheduling predict that empirical RT data from the variable-order and constant-order conditions should embody both systematic similarities and differences.
Empirical mean RTs. Figure 11A confirms the veracity of this prediction. Here we have plotted empirical mean RTs (solid curves) respectively for the variable-order and constant-order conditions as a function of SOA when the auditory-vocal task came first and the visual-manual task came second during Pashler's (1990, Exp. 2) study. The mean Task 1 RTs in this case are substantially (about 100 ms) longer for the variable-order condition. However, the mean Task 2 RTs are quite similar across conditions; uncertainty about the serial order of the stimuli slowed Task 2 responses much less than Task 1 responses. Indeed, at the shortest (100 ms) SOA, Task 2 responses were slightly faster when such uncertainty prevailed. Also, as the SOA increased, the mean Task 2 RTs decreased at about the same rate for the variable-order and constant-order conditions, forming nearly superimposed PRP curves that never differed by more than about 30 ms from each other.
Neither a simple response-selection bottleneck model (Pashler, 1984,1990,1993; Smith, 1967; Welford, 1967) nor a movement-initiation bottleneck model (Keele, 1973) can easily explain this pattern of RTs. Without embellishment, these models predict that when Task 1 responses are slowed by cognitive factors such as uncertainty about the serial order of stimuli, then the slowing should propagate onward to delay Task 2 responses commensurately. Yet such additional delays did not occur during Pashler's (1990, Exp. 2) study when more temporal uncertainty was introduced, even though the uncertainty substantially slowed Task 1 responses. What happened instead may be interpreted as evidence of a processing system that gracefully adapts to complex task contingencies without undue debilitation. This adaptation is consistent with the general principles on which our SRD model and its EPIC architecture have been predicated.
Likewise consistent with these principles are other data from Pashler's (1990, Exp. 2) study, as shown in Figure 1 IB. Here we have depicted empirical mean RTs (solid curves) for the variable- order and constant-order conditions when the visual-manual task came first and the auditory-vocal task came second. The mean Task 1 RTs in this case are again more than 100 ms longer for the variable-order condition. Yet the mean Task 2 RTs are fairly similar across conditions, especially at the shorter (< 200 ms) SOAs. For example, when the SOA was 100 ms, Task 2 responses took about the same amount of time on average for each condition. Thus, in at least some respects, it appears that participants perhaps use similar types of strategy for task scheduling under both temporal certainty and uncertainty. Apparently these strategies are flexible enough that they yield comparable Task 2 RTs when given either of two equally likely stimulus sequences and when given either complete or incomplete foreknowledge about the serial order of impending stimuli. As suggested already, this flexibility and generality are beneficial capabilities that the deferred response- transmission mode of the SRD model's executive process can provide.
Details of simulation. To account for Pashler's (1990, Exp. 2) results, we have augmented the SRD model with additional executive production rules that use the deferred response-transmission mode in scheduling dual tasks when the serial order of their stimuli is uncertain. For present purposes, these rules are assumed to apply whenever, despite prevailing temporal uncertainty, one task must be primary and the other secondary, as in Pashler's variable-order condition. A diagram of the assumed scheduling strategy appears in Figure 12. Here the flow of control is similar to what was proposed in the original SRD model, except that response selection for both tasks proceeds initially in the deferred transmission mode, and a Task 1 response gets released from working memory after an intermediate decision has been made about which task is primary. Given how the
32

Computational Theory of Human Performance: Part 2 Meyer & Kieras
CO E, a S I-
o a a CC e IB a S
1100
1000-
900
800
700
600
500-
400-
(A) Auditory-Vocal Task 1 Visual-Manual Task 2
MeanRT
Taskl Task 2 Constant Order
Variable Order
200 400 600
SOA (ms)
800 0
(B) Visual-Manual Task 1 Auditory-Vocal Task 2
MeanRT Taskl Task2 —o— —♦— Constant Order
-*- -*- Variable Order
A-.. S^g^™" -«4
o—
200 400
SOA (ms)
600 800
Figure 11. Results from simulations with the extended SRD model for Pashler's (1990, Exp. 2) dual-task study that combined an auditory-vocal task and a visual-manual task. Large symbols on solid curves represent empirical mean RTs; small symbols on dashed curves represent simulated mean RTs. Unfilled and filled circles represent mean Task 1 and Task 2 RTs, respectively, when the serial order of the auditory-vocal and visual-manual tasks was the same on each trial of a block (i.e., constant-order condition). Unfilled and filled triangles represent mean Task 1 and Task 2 RTs, respectively, when the serial order of the auditory-vocal and visual-manual tasks varied randomly across the trials of a block (i.e., variable-order condition). A: Mean RTs from trials on which the auditory-vocal task was primary and the visual-manual task was secondary. B: Mean RTs from trials on which the visual-manual task was primary and the auditory-vocal task was secondary.
33

Computational Theory of Human Performance: Part 2 Meyer & Kieras
Auditory-Vocal Task
S-auditory
Perceptual Processing
I Response Selection
Deferred Mode
Wait for response permission
1—;:
Immediate Mode
Motor Processing
R-vocal
)
Executive Process Trial Started
Enable both tasks in deferred mode
Wait for detection of first stimulus
Designate as Task 1
^ ^ Wait for selection of Task 1 response
.^— — "" Permit Task 1 response
Wait for Task 1 done
Unlock Task 2 Permit Task 2 Response or
Shift to immediate mode
Visual-Manual Task
S-visual
Perceptual Processing
\
Response Selection
Deferred Mode
Wait for response permission
±
Immediate Mode
Motor Processing j
} R-manual
Figure 12. Symmetric deferred-mode task scheduling for the variable-order condition of Pashler's (1990, Exp. 2) dual-task study with auditory-vocal and visual-manual tasks. In the diagram, the auditory-vocal task comes first However, the visual-manual task could come first instead, and if so, its role would be interchanged with that of the auditory-vocal task. For further details, see text
34
Computational Theory of Human Performance: Part 2 Meyer & Kieras
model's executive process works under this circumstance, we refer to it as involving symmetric deferred-mode task scheduling.1*
Specifically, according to Figure 12, the executive process starts each trial of the vanable-order condition by enabling response selection to proceed in the deferred response-transmission mode for both (i.e., auditory-vocal and visual-manual) tasks. After the trial has started, one of EPIC's perceptual processors next sends a note to working memory, indicating which type of test stimulus - either auditory or visual - has been detected first Upon receipt of this note, the executive process designates the task associated with the initially detected stimulus to be primary, and puts another note about its designation in working memory. Following the initial stimulus-detection event, stimulus identification and response selection for the designated primary task proceed until its response has been selected and put in working memory through the deferred mode. Meanwhile, if the SOA is short, stimulus identification and response selection for the secondary task may likewise proceed. When the selected primary-task response enters working memory, its presence there together with the stored note about which task is primary triggers a production rule. The action of the triggered rule passes the primary-task response to its motor processor for movement production. Also, after a subsequent optional unlocking-onset latency, the executive process begins unlocking the current secondary task. The latter unlocking process involves the same steps as for Task 2 of the standard PRP procedure (e.g., suspension of incomplete Task 2 response selection, shift of Task 2 from deferred to immediate mode, and resumption of Task 2; cf. Figure 4).
Symmetric deferred-mode scheduling of the tasks in Pashler*s (1990, Exp. 2) variable-order condition has a straightforward rationale. With this executive control strategy, progress on both tasks may proceed as best possible despite initial uncertainty about the tasks' serial order and relative priority. Unlike for Task 1 of the standard PRP procedure, it would not be appropriate here to use the immediate response-transmission mode initially for either task. This is because doing so without knowing which task will eventually be primary could result in the secondary task having the immediate mode assigned improperly to it, thereby leading its response to be produced prematurely (i.e., before the primary-task response).
Our proposal of symmetric deferred-mode task scheduling leads to two major quantitative predictions. First, RTs for the primary task should be longer under Pashler's (1990, Exp. 2) variable- condition than under the constant-order condition. This follows because the identities of selected Task 1 responses take more time to reach their motor processor when transmitted through the deferred mode rather than immediate mode. Second, although completion of the primary task is delayed under the variable-order condition, RTs for the secondary task there can still have about the same magnitudes as those under the constant-order condition. This follows because under both conditions, response selection for the secondary task may be completed through the deferred mode while early and intermediate stages of the primary task are underway. Depending on the concomitant unlocking-onset latency, preselected secondary-task responses can then emerge at about the same time after short SOAs regardless of prior uncertainty about which task will be primary and which will be secondary.
Simulated mean RTs. Illustrating these predictions, Figure 11A shows simulated mean RTs (dashed curves) for Pashler's (1990, Exp. 2) variable-order and constant-order conditions when the auditory-vocal task was primary and the visual-manual task was secondary. The simulated mean RTs for the variable-order condition come from symmetric deferred-mode task scheduling. The simulated mean RTs for the constant-order condition come from asymmetric immediate/deferred- mode task scheduling. As anticipated, there is a reasonably good fit (R2 = .970; RMSE = 10 ms) between the simulated and empirical mean Task 1 RTs. Most important, the simulated mean Task 1 RTs aptly embody the effect of introducing a priori uncertainty about the serial order of the tasks. Similarly, there is a good fit (R2 = .977; RMSE = 12 ms) between the simulated and empirical mean Task 2 RTs, which are not influenced much by such uncertainty.
18 Consistent with the above terminology, the strategy used by the executive process of the original SRD model (Figure 4) involves asymmetric immediate/deferred-mode task scheduling. This strategy initially assigns the immediate and deferred response-transmission modes to the primary and secondary tasks, respectively, whereas with symmetric deferred-mode scheduling, both primary and secondary tasks are assigned the deferred mode initially.
35

Computational Theory of Human Performance: Part 2 Meyer & Kieras
An encouraging picture appears likewise in Figure 1 IB, which shows simulated mean RTs (dashed curves) for the variable-order and constant-order conditions when the visual-manual task was primary and the auditory-vocal task was secondary. Again the fit between the simulated and empirical mean Task 1 RTs is good (Ü2 = .986; RMSE = 21 ms). There is also at least a moderately good fit between the simulated and empirical mean Task 2 RTs (Ä2 = .945; RMSE = 19 ms). That the fit continues to be good regardless of temporal uncertainty and ambiguous task priorities is consistent with our assumptions about the respective roles of immediate-mode and deferred-mode task scheduling.
Parameter values used as part of the present simulations appear in Table 3. By and large, these values were similar to those of parameters in previous simulations of results from the standard PRP procedure. Insofar as the executive-process parameters changed with temporal uncertainty, unlocking-onset latencies tended to be shorter when the serial order of the tasks varied randomly across trials, but this trend was off-set by compensatory increases of the suspension waiting times.
Theoretical implications. Our success at simulating the results from Pashler's (1990, Exp. 2) dual-task study illustrates how the extended SRD model can account for performance under diverse conditions. The model deals gracefully with not only spatial uncertainty about prospective stimulus locations but also temporal uncertainty about the serial order of prospective task stimuli. When confronted with the latter type of uncertainty, the model's executive process may be adapted efficiently on the basis of its deferred and immediate response-transmission modes, thereby maintaining relatively high performance. At present, no other models - including ones with simple response-selection or movement-initiation bottlenecks — have capabilities that would let them achieve such efficiency and generality.
Symmetric Deferred-Mode Scheduling of Temporally-Uncertain Dual Manual Tasks
Yet a related question remains. Does the extended SRD model apply as well to other situations in which the serial order of two tasks is uncertain and additional stimulus or response combinations are involved? The answer is not obvious, since thus far we have considered just one relevant case involving a combination of vocal and manual responses (i.e., Pashler, 1990, Exp. 2).
For example, suppose instead that two tasks both require manual responses, and that the serial order of their stimuli varies randomly across trials, so the primary task is ^determinate beforehand. Then the extended SRD model might not be applicable, if people actually lack the flexible response- transmission modes of the model's executive process. The lack of such flexibility could become especially evident when two manual responses must be produced rapidly in various orders, because the same limited-capacity manual motor processor presumably has to prepare and initiate each response. Nevertheless, given what we have assumed previously, people should still perform reasonably well in this case; through further efficient use of the deferred and immediate response- transmission modes, good accounts of empirical RT data ought to be possible even for studies with dual manual tasks.
Pashler's other study with variable task order. A test of our optimistic expectations is provided by another dual-task study that Pashler (1990, Exp. 1) conducted under constant-order and variable- order conditions. During this study, participants performed two manual tasks. The procedure was the same as before (cf. Pashler, 1990, Exp. 2), except that now one task required left-hand manual keypresses in response to auditory stimuli, and the other task required right-hand keypresses in response to visual stimuli.
Some RT data from performance of these tasks appear in Figure 13 A, which shows empirical mean RTs (solid curves) for the variable-order and constant-order conditions when the auditory- manual task came first and the visual-manual task came second. The effect of variable task order on mean Task 1 RTs was even greater (240 vs. 100 ms) than when vocal primary and manual secondary responses were involved (cf. Figure 11 A). Another interesting result here is that SOA affected mean Task 1 RTs significantly for the variable-order condition; as the SOA increased, these RTs decreasd. Such a trend did not happen previously. Also unlike before, the present mean Task 2 RTs are much longer (170 ms on average) for the variable-order condition than for the constant-order condition.
36

Computational Theory of Human Performance: Part 2 Meyer & Kieras
Table 3
Context-Dependent Parameters in Simulations for Pashler's (1990, Exp. 2) Dual-Task Study with
Auditory-Vocal and Visual-Manual Tasks
System Component Parameter Name Primary Task Serial Order Mean
perceptual processors auditory identification time aud & vis visual identification time
task processes
executive process
apparatus
number of selection cycles
preparation benefit
ocular orientation time unlocking onset latency
suspension waiting time
preparation waiting time
manual transduction time vocal transduction time
aud & vis con&var 285
aud & vis con&var 260
auditory con& var 1.25
visual con&var 1.67
aud & vis con & var 50
aud & vis con & var 0
auditory constant 125 variable 0
visual constant 175 variable 50
auditory constant 50 variable 200
visual constant 100 variable 350
aud & vis con & var 700
aud & vis con&var 40
aud & vis con & var 50
Note. Time parameters are given in milliseconds. "Aud" and "vis" refer to the stimulus modality in each task (i.e., auditory and visual, respectively). "Con" and "var" refer to the serial order of the stimuli during a trial block (i.e., constant or variable).
37

Computational Theory of Human Performance: Part 2 Meyer & Kieras
1400
~ 1200-^ E, a p 1000 c o
tr c CO 0) E
800-
600-
400
(A) Auditory-Manual Task 1 Visual-Manual Task 2
MeanRT
Taskl Task 2 Constant Order Variable Order
(B) Visual-Manual Task 1 Auditory-Manual Task 2
Mean RT
Taskl Task2 Constant Order Variable Order
200 400 600 800 0 200 400
SOA (ms) SOA (ms) 600 800
Figure 13. Results from simulations with the extended SRD model for Pashler's (1990, Exp. 1) dual-task study that combined an auditory-manual task and a visual-manual task Large symbols on solid curves represent empirical mean RTs; small symbols on dashed curves represent simulated mean RTs. Unfilled and filled circles represent mean Task 1 and Task 2 RTs, respectively, when the serial order of the auditory-manual and visual-manual tasks was the same on each trial of a block (i.e., constant-order condition). Unfilled and filled triangles represent mean Task 1 and Task 2 RTs, respectively, when the serial order of the auditory-manual and visual-manual tasks varied randomly across the trials of a block (i.e., variable-order condition). A: Mean RTs from trials on which the auditory-manual task was primary and the visual-manual task was secondary. B: Mean RTs from trials on which the visual-manual task was primary and the auditory-manual task was secondary.
38

Computational Theory of Human Performance: Part 2 Meyer & Kieras
Pashler (1990, Exp. 1) obtained a similar pattern of empirical mean RTs when the visual-manual task was primary and the auditory-manual task was secondary (Figure 13B, solid curves). Again the mean Task 1 and Task 2 RTs were much longer on average for the variable-order condition than for the constant-order condition. Variable task order affected mean Task 1 RTs especially at the shortest SOA, as if processes for the primary and secondary tasks interacted most when their stimuli arrived together within a brief span of time.
From such results, further theoretical inferences may be reached. Given that the variable task order slowed bi-manual as well as combined vocal and manual responses, we infer that some aspects of task scheduling are similar regardless of the motor processors involved. Nevertheless, bi-manual responses apparently entail extra complexities, which are manifested by several facets of Pashler's (1990, Exp. 1) data: (a) large effects of variable task order on both mean Task 1 and Task 2 RTs; (b) equality of these RTs at the shortest SOA in the variable-order condition; and (c) moderate effects of SOA on mean Task 1 RTs when the task order varies.
Viewed overall, this particular pattern suggests that under the variable-order condition, participants temporally group their manual primary and secondary responses at short SOAs, rather than producing each response independently. Such a strategy has been observed during some previous dual-task studies (e.g., Pashler & Johnston, 1989; Sanders, 1964). Indeed, response grouping may provide an especially efficient motor-control strategy when the same limited-capacity (i.e., manual) motor processor must be used repeatedly and the required order of successive responses is unpredictable beforehand. To account for mean RTs from Pashler's (1990, Exp. 1) study of bi-manual responses and variable task order, we have therefore supplemented the manual motor processor of the EPIC architecture with a response-grouping mechanism, which is exploited by the executive process of the extended SRD model.
Details of simulation. Using this additional mechanism, two more simulations are reported here for the bi-manual constant-order and variable-order conditions, respectively. Our simulation of performance under the constant-order condition relies on the same sorts of processes and parameter values as for the standard PRP procedure. Our simulation of performance under the variable-order condition relies on symmetric deferred-mode task scheduling as outlined earlier for variably ordered auditory-vocal and visual-manual tasks (Figure 12). For present purposes, this strategy also incorporates some more production rules whereby selected manual responses are temporally grouped during movement production at short SOAs.
On the basis of these rules, response grouping is accomplished through a sequence of related steps. At the start of each trial, the executive process of the SRD model enables response selection to proceed in deferred response-transmission mode for both the auditory-manual and visual-manual tasks. Subsequently, as soon as a response to the first-detected test stimulus has been selected and put in working memory, it is designated the primary-task response. Upon completing this designation, the executive process next waits for a brief period, during which the secondary-task response may be selected and put in working memory as well. This waiting period is the response- integration time, whose duration constitutes a context-dependent parameter. At its end, a decision is made by the executive process about whether the identities of the responses for both the primary and secondary tasks have been selected already. If the decision is positive, then the executive process instructs the manual motor processor to prepare and execute a bi-manual response, composed of two successive keypresses with designated fingers on the left and right hands, including ones for the primary and secondary tasks, respectively. Otherwise, if the decision is negative (i.e., the secondary- task response has not been selected yet), then the executive process simply instructs the manual motor processor to make just a uni-manual primary-task response, producing the one (e.g., left hand) keypress selected thus far. In the latter case, performance of the secondary task is completed along the same path as it would be under the constant-order condition; that is, the executive process suspends the Task 2 response-selection process temporarily, shifts it from deferred to immediate mode, and then resumes remaining operations for Task 2.
At the short SOAs where bi-manual responses are presumably grouped together, EPIC's manual motor processor produces them through a new style of compound operation. It involves preparing either four or five movement features before the ringer keypress for the primary task is initiated. Four features are prepared when the primary and secondary tasks require keypresses by homologous
39

Computational Theory of Human Performance: Part 2 Meyer & Kieras
(e.g., left-index and right-index) fingers on the two hands; these features specify (a) the hand to be used for the primary-task keypress, (b) the finger to be used for the primary-task keypress, (c) the hand to be used for the secondary-task keypress, and (d) the duration of a brief temporal lag to be inserted between the initiation of the primary-task and secondary-task keypresses. If instead the primary and secondary tasks require keypresses by nonhomologous fingers on the two hands (e.g., left-index and right-middle fingers), then five features are prepared, including the four mentioned previously plus a fifth feature mat specifies the finger to be used for the secondary-task keypress. This fifth feature is not needed in the case of bi-manual responses that involve homologous fingers, because the finger feature (e.g., "index") prepared for the primary-task keypress can be used as well for the secondary-task keypress.
After the movement features for grouped bi-manual responses have been prepared, the manual motor processor enters a final execution phase. As part of it, first the primary-task keypress is initiated, next the inter-initiation lag is inserted, and finally the secondary-task keypress is initiated. The inter-initiation lag must be inserted so that the respective identities of the primary-task and secondary-task responses are fully apparent from their serial order. This yields two movement production times, one for the primary task, and one for the secondary task. By definition, the primary-task movement production time is the total time that the manual motor processor takes in preparing the four or five specified movement features and initiating the primary-task keypress; the secondary-task movement production time is the total time taken in initiating the secondary-keypress after the end of the inter-initiation lag. To set the values of these times, we again assume that on average, preparation of each feature consumes 50 ms and so does movement initiation, as during our previous simulations of performance under the standard PRP procedure.19
Table 4 lists the mean values of the parameters whereby we implemented the manual motor processor's mechanisms for producing bi-manual responses. Also shown here are the mean values of other parameters used during our simulations of performance in Pashlefs (1990, Exp. 1) study of variable task order with combined auditory-manual and visual-manual tasks. Many of these values are identical to those used before (cf. Table 3). However, some instructive differences should be noted too. For example, the present values of the unlocking onset latency and suspension waiting time are shorter than those in our simulations under the variable-order condition with combined auditory-vocal and visual-manual tasks (Pashler, 1990, Exp. 2). A plausible rationale for this reduction is that these particular parameters did not need especially large values here to ensure that responses occurred in the correct serial order. Rather, with its response-grouping mechanisms and inter-initiation lag, the manual motor processor took over the role of ensuring that the serial order of the responses was correct, thereby freeing other parameters of the SRD model's executive process to have minimal values.
Simulated mean RTs. Some results from these extensions of the SRD model and EPIC architecture appear in Figure 13A. Here we show simulated mean RTs (dashed curves) versus empirical mean RTs (solid curves) for the case in which the auditory-manual and visual-manual tasks of Pashler's (1990, Exp. 1) study were respectively primary and secondary. Like results from our previous simulations, the fit is fairly good here (for mean Task 1 RTs, R2 = .962; RMSE = 25 ms; for mean Task 2 RTs, R2 = .999; RMSE = 19 ms). The simulated mean RTs account well for the interactive effects of SOA and variable task order on empirical mean RTs, whose magnitudes increased sharply and became more sensitive to the SOA under the variable-order condition. This success may be attributed to the aptness of our assumptions about symmetric deferred-mode task scheduling and response grouping.
19 For secondary-task keypresses that involve homologous fingers, the final initiation step is assumed to take no extra time.
40

Computational Theory of Human Performance: Part 2 Meyer & Kieras
Table 4 Context-Dependent Parameters in Simulations for Pashler's (1990, Exp. 2) Dual-Task Study with
Auditory-Manual and Visual-Manual Tasks
System Component Parameter Name Primary Task Serial Order Mean
perceptual processors
manual motor processor
task processes
executive process
apparatus
auditory identification time aud & vis con&var 285
visual identification time aud & vis con &var 260
movement production time
homol Task 1 responses aud & vis variable 250
homol Task 2 responses aud & vis variable 0
nonhomol Task 1 responses aud & vis variable 300
nonhomol Task 2 responses aud & vis variable 50
inter-initiation lag auditory variable 100
visual variable 50
number of selection cycles auditory con & var 1.25
visual con&var 1.67
preparation benefit aud & vis con & var 50
ocular orientation time aud & vis con&var 0
response-integration time auditory variable 100
visual variable 150
unlocking onset latency aud & vis constant 125
aud & vis variable 225
suspension waiting time aud & vis con&var 0
preparation waiting time aud & vis con&var 700
manual transduction time aud & vis con&var 40
vocal transduction time aud & vis con&var 50
Note. Time parameters are given in milliseconds. "Aud" and "vis" refer to the stimulus modality in each task (i.e., auditory and visual, respectively). "Con" and "var" refer to the serial order of the stimuli during a trial block (i.e., constant or variable). "Homol" and "nonhomol" refer to the relationship between finger keypresses in the primary and secondary tasks (i.e., homologous and non-homologous,
respectively).
41

Computational Theory of Human Performance: Part 2 Meyer & Kieras
Reinforcing such an attribution, Figure 13B summarizes more results obtained through these processing mechanisms. Here simulated mean RTs (dashed curves) are plotted versus empirical mean RTs (solid curves) for the case in which the visual-manual and auditory-manual tasks were primary and secondary, respectively. Again the overall fit is fairly good (for mean Task 1 RTs, R2
= .995; RMSE = 12 ms; for mean Task 2 RTs, R2 = .995; RMSE = 15 ms). The extended SRD model still accounts well for the interactive effects of SOA and variable task order, using the same basic assumptions as when the auditory-manual task was primary and the visual-manual task was secondary (cf. Figure 13 A).
Theoretical implications. Our extensions of the SRD model to variably-ordered bi-manual tasks illustrate how task scheduling may be adapted in accord with two contextual factors: degree of foreknowledge about the serial order of impending stimuli, and degree of dependence between the mechanisms that produce successive responses. If the serial order of impending stimuli is uncertain and task priorities are ambiguous, but concurrent tasks require different motor processors (e.g., vocal and manual), then efficient adaptation to these circumstances is possible through executive processes that have flexible control over alternative modes (i.e., immediate and deferred) for response selection and transmission. However, when concurrent tasks all require the same (e.g., manual) motor processor, other types of control enter the picture, including production of grouped responses whose movement features are prepared and executed conjointly.
Theoretical Interpretation of Other PRP Phenomena
Although no further simulations are reported here, we should stress that the SRD model readily accounts for numerous other phenomena mat have been discovered through the PRP procedure. Among these phenomena and the present theoretical interpretations of them are several instructive cases.
Effects of stimulus preview on serial choice reactions. Using a method similar to the standard PRP procedure, Pashler (1994b) had participants perform a serial choice-reaction task (cf. Telford, 1931). He displayed individual alphanumeric characters, and for each one, participants had to make a manual keypress response. During some trial blocks, the required S-R mapping was relatively compatible, whereas during other blocks, it was less so. Also, the amount of preview that participants had for successive stimuli varied systematically. During some trial blocks, each stimulus appeared while the participants were still engaged in identifying and responding to the preceding stimulus; during other blocks, each stimulus appeared only after a response to the preceding stimulus had occurred
Under these conditions, the mean inter-response interval (IRI; i.e., average time between temporally adjacent responses) decreased as the amount of stimulus preview increased. Given sufficient preview, participants apparently identified the next stimulus at the same time as they selected and executed a response to the preceding stimulus. Also, the IRIs decreased as the compatibility of the required S-R mapping increased, suggesting that response selection had been facilitated. However, the compatibility effect stayed the same regardless of how much stimulus preview was provided. Pashler (1994b) therefore concluded that response-selection processes for the next stimulus did not overlap temporally with response-selection processes for the preceding stimulus. According to him, such overlap is precluded by an immutable response-selection bottleneck of the same sort as he had previously advocated on the basis of results from the standard PRP procedure (e.g., Pashler, 1984,1990).
We agree that even with ample stimulus preview, response selection in Pashler's (1994b) study perhaps occurred for only one stimulus at a time. This is entirely consistent with our SRD model. The consistency stems from two logical constraints imposed jointly by Pashler's experimental design and task instructions: (a) during a serial choice-reaction task like the one given to his participants, the same S-R mapping must be applied repeatedly to successive stimuli; and (b) the selected responses must have the same serial order as the stimuli for which they are appropriate. Regardless of whether response-selection processes can take place concurrently for two or more successive stimuli on other occasions, these constraints essentially preclude the use of such temporal overlap
42

Computational Theory of Human Performance: Part 2 Meyer & Kieras
(McLeod & Hume, 1994). Under Pashler's (1994b) conditions, concurrent response-selection processes could create confusions about which selected responses go with which displayed stimuli. To avoid the potential confusions, the executive process of the SRD model would — through judicious management of task goals and status notes in working memory — let response selection proceed for only one stimulus at a time, just as Pashler (1994b) observed. As before, an important lesson to be learned here is that conclusions about multiple-task performance must take into account the logical restrictions imposed by contextual and instructional factors on executive task-scheduling strategies.
• PRP effects during equal-priority tasks. The preceding lesson bears strongly on how results from a study by Ruthruff, Pashler, and Klaasen (1995,1996) should be interpreted. This study attempted to test EPIC's assumption that response-selection processes for each of two concurrent tasks can proceed simultaneously at the same rate as during single-task performance. In order to do so, Ruthruff et al. (1995,1996) had participants perform two tasks under a novel dual-task condition with zero SOA. One task required making vocal responses to auditory stimuli; on each trial, participants counted how many consecutive brief tones were presented, and they reported the number ("one" or "two") verbally. The other task required making manual responses to visual stimuli; on each trial, participants discriminated whether a printed letter was presented in normal or mirror- inverted orientation, and they pressed a corresponding finger key to indicate their decision. The participants were instructed that during blocks of dual-task trials, the two tasks should receive equal priority, and their responses should be produced simultaneously with a near-zero ERI. Also included were blocks of single-task trials during which only one task (either auditory-vocal or visual-manual) was performed on each trial.
The rationale of this study was based on several argumentative steps. Ruthruff et al. (1995, 1996) reasoned that because of their equal-priority instructions, on each dual-task trial there should have been a race between processes for the auditory-vocal task and processes for the visual-manual task, witii the concomitant RT equaling the duration of whichever processes took longer to finish. Also, they reasoned that if EPIC were correct, the times taken to finish the processes for the auditory-vocal task on dual-task trials should have had the same distribution as they did on single- task trials, because the visual-manual task would not have interfered with the auditory-vocal task. An analogous implication was claimed about the times taken to finish the processes for the visual- manual task on dual-task trials.
This reasoning led Ruthruff et al. (1995,1996) to argue that were EPIC's assumptions correct, then the cumulative distribution function (F12) of a participant's individual RTs on the dual-task trials should have been closely approximated by another derived cumulative distribution function (Fmax). By definition, Fmax was derived through applying.a "max operation" to pairs of empirical RTs sampled randomly from the single-task trial blocks, where one RT of each pair occurred during the auditory-vocal task, and the other RT of each pair occurred during the visual-manual task. The max operation yielded the larger RT of each pair, consistent with there being a supposed race on each dual-task trial between two sets of processes whose slower contributors gave the time at which the race ultimately ended. Nevertheless, Ruthruff et al. (1995,1996) found that F12(t) substantially exceeded Fmax(t) over a wide range of time values t, so they concluded that EPIC's assumptions are wrong.
However, the rationale on which Ruthruff et al. (1995,1996) based their conclusions is seriously flawed. It completely ignores essential time contributions by extra processes that would be needed on dual-task trials to make participants' responses have suitably short IRIs, as prevailing task instructions required. Given such instructions, our extended SRD model implies that on dual-task trials, response-selection processes for the two tasks would have to operate in the deferred response- transmission mode, ensuring that the overt response for one task does not occur prematurely before the overt response for the other task. Yet on single-task trials, the response-selection processes for each task could operate in the immediate response-transmission mode, letting overt responses occur substantially sooner there than on dual-task trials. The latter difference in needed executive control for the two trial types may easily explain Ruthruff et al.'s (1995,1996) results. As anticipated, this
43

Computational Theory of Human Performance: Part 2 Meyer & Kieras
constitutes another object lesson that valid conclusions about multiple-task performance must take into account the constraints imposed by instructional factors on viable strategies of task scheduling.
The SRD model applies likewise to results from a study by Pashler (1994c) in which there were two tasks with equal priority. Here an auditory-manual choice-reaction task (pressing left-hand finger keys for low and high tones) had to be performed simultaneously with a visual-manual choice- reaction task (pressing right-hand finger keys for printed letters). Participants were instructed to "place about equal emphasis on each task... (Do not) put more effort into responding quickly to one task or the other. They are equally important, whichever stimulus comes first" (Pashler, 1994c, p. 335). Nor did the participants have to produce the responses for the two tasks in grouped fashion (i.e., with near-zero IRI). Pashler (1994c) therefore alleged that if an immutable central response- selection bottleneck does not exist, then these relaxed instructions should have eliminated RT increments associated with performing two tasks at short SOAs. Nevertheless, on trials with short SOAs, the secondary responses (i.e., responses for the second of two temporally proximate stimuli) produced by Pashler's (1994c) participants had relatively long latencies, exhibiting RT increments similar to those found previously with the standard PRP procedure.
Be this as it may, the latter results fail to prove there is an immutable central response-selection bottleneck. Although Pashler (1994c) used instructions that were less restrictive than those of the standard PRP procedure, his participants still presumably had to defer the production of selected secondary responses at short SOAs, because two manual tasks were involved. We assume that only one manual motor processor is available to program and initiate each individual response. Thus, according to our SRD model, when two manual tasks are performed concurrently and the SOA is short, movement production for one of them must wait on the other, or else the responses must be temporally grouped as a compound action. This limitation at the motor level is unavoidable no matter how much the procedural instructions are relaxed and response-selection processes are temporally overlapped. Furthermore, the availability of just one manual motor processor accounts for why some of Pashler's (1994c) participants had a strong bias to group their responses on trials that involved short SOAs.
PRP effects on lateraäzed readiness potentials. Our interpretation of Pashler's (1994c) results is reinforced by Osman and Moore (1993). They measured lateralized readiness potentials (LRPs) of participants who performed an auditory-manual Task 1 and a visual-manual Task 2 during a standard PRP procedure. The LRPs manifested event-related brain potentials over areas of motor cortex associated with producing the individual responses in each task Interestingly, a PRP effect on the latencies of LRPs for Task 2 responses occurred at short SOAs. This outcome dovetails neatly with the SRD model's assumption that movement-feature programming and overt initiation of these responses are deferred until EPIC's manual motor processor has made sufficient progress toward completing prior Task 1 responses. Because of such deferment, the latencies of both covert Task 2 LRPs and overt Task 2 responses should be lengthened, just as Osman and Moore (1993) found. Indeed, the neural substraits of EPIC's manual motor processor presumably reside at least partly in cortical areas from which the LRP emanates (Coles, 1989).
PRP effects without Task 1 responses. It has been reported previously, however, that PRP effects on Task 2 responses sometimes occur even if Task 1 does not entail selecting or producing overt responses (Davis, 1959; Fraisse, 1957; Nickerson, 1965; Van Seist & Johnston, 1996). How might this intriguing result bear on the SRD model? The answer is simple. When no overt Task 1 responses are needed, the instructions of the standard PRP procedure still require that overt Task 2 responses wait until after Task 1 stimuli have been detected and cognitively processed to some extent Compliance with these instructions would therefore lead again to the temporary deferment of selected Task 2 responses at short SOAs, yielding a PRP effect somewhat as if Task 1 processes had actually led to a motor processor being preoccupied.
According to the SRD model, what might also happen under such circumstances (i.e., ones with no overt Task 1 responses) is a reduction of how much time Task 2 remains in deferred mode. If so, then the magnitude of the PRP effect on Task 2 RTs at short SOAs should decrease relative to cases in which overt Task 1 responses are required. Indeed, some past experimenters have reported
44

Computational Theory of Human Performance: Part 2 Meyer & Kieras
decreases of this sort, supporting the model's assumption of efficient adaptive executive processes (Davis, 1959; Fraisse, 1957; Kay & Weiss, 1961; Nickerson, 1965; Van Seist & Johnston, 1996).20
PRP effects and SO A variability. Other evidence of adaptive executive processes comes from past PRP studies that manipulated the assignment of SOAs to blocks of dual-task trials. In particular, some investigators have examined participants' performance when a constant SOA was assigned to all trials of a block, and the SOA assignment changed systematically across blocks. Under such conditions, PRP effects have been less than when each block of trials contained randomly variable SOAs (e.g., Borger, 1963).
This result has a natural interpretation in terms of the SRD modeL If the length of an impending SOA can be predicted before the start of a trial, then executive processes may make extra preparations that will speed the ultimate output of overt Task 2 responses. For example, suppose that the impending SOA is predictable and not especially short. Then rather than using the deferred response-transmission mode for performing Task 2, the executive process might instead simply start Task 2 in immediate mode, exploiting the fact that the SOA will be long enough to let Task 1 finish first no matter how quickly progress on Task 2 occurs after its stimulus onset Such opportunistic use of the immediate mode for Task 2 could reduce Task 2 RTs after intermediate SOAs, because the identities of selected Task 2 responses would not have to wait in working memory, nor would Task 2 have to be suspended and shifted from deferred to immediate mode. In contrast, if the impending SOA is unpredictable and could be either very short or long, unbridled use of the immediate mode for Task 2 would create potential serious problems; overt Task 2 responses might occur before overt Task 1 responses, violating instructions about task priorities for the standard PRP procedure.
PRP effects and cerebral hemispheric localization. Participants' adherence to instructions about task priorities may explain observed relationships between PRP effects and cerebral hemispheric localization. For example, Pashler and O'Brien (1993) had participants perform an auditory-vocal Task 1 and a visual-manual Task 2 under the standard PRP procedure. The Task 1 stimuli were high and low tones to which the responses were the spoken words "high" and "low", respectively. The Task 2 stimuli were individual circular disks, each displayed in one of the four quadrants around a central fixation point For each Task 2 stimulus, participants responded by pressing either an upper or lower finger key with the middle or index finger on their left or right hand, indicating in which quadrant the disk appeared. RTs were measured as a function of the SOA and Task 2 stimulus location. This experimental design purportedly tested whether the human brain has distinct immutable response-selection bottlenecks localized respectively in the left and right cerebral hemispheres.
The rationale of these tests was based on several a priori hypotheses. From previous evidence about hemispheric localization (e.g., Friedman & Poison, 1981; Friedman, Poison, Gaskill, & Dafoe, 1982; Heilige, Cox, & Litvac, 1979; Kinsbourne & Hicks, 1978; liederman, 1986), Pashler and O'Brien (1993) initially hypothesized that during their auditory-vocal Task 1, response selection and production might occur through neural mechanisms located in the left cerebral hemisphere (viz. Broca's area). They also hypothesized that during their visual-manual Task 2, the neural mechanisms used for right-side stimuli and responses might be located in the left hemisphere, whereas those used for left-side stimuli and responses might be located in the right hemisphere. If so, then for the left-side Task 2 stimuli and responses, perhaps there would be little or no PRP effect at short SOAs, because they need not involve the same hemispherically localized response-selection bottleneck as Task 1 stimuli and responses do. Nevertheless, obtained PRP effects had roughly equal magnitudes regardless of whether Task 2 stimuli and responses occurred on the left or right side. Pashler and O'Brien (1993) therefore concluded that contrary to their a priori hypotheses, the brain's left and right hemispheres do not constitute entirely separate channels, but instead process information through one shared and immutable response-selection bottleneck.
According to our SRD model, however, there is another plausible interpretation. As Pashler and O'Brien (1993) assumed originally, perhaps their participants selected vocal responses through left- hemisphere mechanisms and, concurrently, left manual responses through right-hemisphere
20 The SRD model also accounts well for various patterns of factor effects on mean Task 2 RTs that Van Seist and Johnston (19%) observed under conditions in which there were no overt responses to Task 1 stimuli (i.e., "no-go" trials).
45

Computational Theory of Human Performance: Part 2 Meyer & Kieras
mechanisms. Still, regardess of which hemispheres were involved, these participants needed to defer the selected Task 2 responses at short SOAs, in order to satisfy instructions about task priorities associated with the PRP procedure. By necessity, this deferment would yield approximately equal PRP effects for the brain's two hemispheres; such equivalence has no direct bearing on the hemispheres' functional separation during stimulus identification and response selection.
The latter conclusions apply as well to results from elementary multiple-task performance by split-brain patients (Ivry, Franz, Kingstone, & Johnston, 1994,1996; Pashler, Luck, Hillyard, Mangun, O'Brien, & Gazzaniga, 1994). For example, Ivry et al. (1994,1996) studied a split-brain patient who performed under the standard PRP procedure. Although the patient's corpus callosum had been extensively severed, causing his left and right cerebral hemispheres to be functionally separate, he still produced essentially normal PRP effects when Task 1 and Task 2 required left- hemisphere and right-hemisphere mechanisms, respectively. Yet this does not prove that he had one shared and immutable response-selection bottleneck either before or after his callosectomy. Instead, the patient's persistent normal PRP effects may have stemmed from executive processes that, despite his callosectomy, continued to respect instructions about task priorities for the PRP procedure. The existence of such processes is consistent with proposals made by some investigators who have previously studied split-brain patients (e.g., Gazzaniga, 1970; Sperry, 1968).
PRP effects after extended practice. Likewise relevant to executive processes and instructions about task priorities are studies of PRP effects after extended practice at multiple-task performance. In these studies, participants have performed many thousands of trials under the standard PRP procedure (e.g., Gottsdanker & Stelmach, 1971). As a result, RTs for Task 1 and for Task 2 at long SOAs gradually decreased. Nevertheless, throughout practice, substantial PRP effects on Task 2 RTs at short SOAs have persisted. Such persistence has been attributed to an immutable response- selection bottleneck (e.g., see Pashler, 1993,1994a).
To the contrary, however, the SRD model again provides an alternative explanation. Persistent PRP effects may occur merely because the instructions about task priorities under the standard PRP procedure stay the same regardless of how much practice has transpired. After many thousands of trials, these instructions still dictate that Task 1 is primary and Task 2 is secondary, thereby encouraging primary-task responses to be produced before secondary-task responses. Consequently, throughout practice, executive processes would have to continue performing Task 2 in the deferred response-transmission mode at short SOAs. In turn, the continued use of the deferred mode would yield persistently long Task 2 RTs whenever the SOA is short, no matter how fest single-task performance becomes.
Null PRP effects. Even so, not all previous studies of elementary multiple-task performance have yielded significant PRP effects. For example, Koch (1993,1994) had participants perform two choice-reaction tasks concurrently, including an auditory-manual task and a visual-vocal task with a zero SOA between their stimuli. The participants were instructed to respond as quickly as possible to each stimulus without waiting for other stimuli or responses; there were no constraints on the order in which the responses had to occur during each trial. As a result, the PRP effect virtually disappeared, casting further doubt on the existence of an immutable response-selection bottleneck From the perspective of our theoretical framework, this outcome presumably happened because Koch's (1993,1994) particular ensemble of tasks and instructions about their relative priorities allowed response-selection and production processes to proceed in immediate mode for each task, exploiting the parallel-processing capability that both people's and EPIC's cognitive processor may have. Additional evidence of such parallel-processing capability has been reported by other investigators under conditions that relax the constraints of the standard PRP procedure (e.g., Greenwald & Shulman, 1973).
46

Computational Theory of Human Performance: Part 2 Meyer & Kieras
General Discussion
In this article, which extends previous theorizing by Meyer and Kieras (1992,1994,1997a), we have further demonstrated that the strategic response-deferment (SRD) model and its Executive- Process Interactive Control (EPIC) architecture aptly characterize elementary multiple-task performance. For the psychological refractory period (PRP) procedure and related laboratory situations, the present theoretical framework yields good fits between simulated and empirical RT data from combinations of tasks involving various perceptual modalities, motor modalities, stimulus- response mappings, and instructions about relative task priorities. The successes of our computer simulations support a number of basic conclusions: (a) at a cognitive level, people have the capacity to apply distinct sets of production rules concurrently for executing the procedures of multiple tasks; (b) the human information-processing system has no immutable "central'1 response-selection or decision bottleneck; (c) people's ability to process information and to take action at "peripheral'' perceptual-motor levels is significantly limited; (d) to cope with such limitations and to satisfy task priorities, flexible scheduling strategies are used; (e) these strategies are mediated by executive cognitive processes that coordinate concurrent tasks and adapt efficiently to prevailing environmental contexts; (f) quantitative computational modeling of multiple-task performance with a precise and veridical information-processing architecture can yield instructive new insights not available through past qualitative verbal hypotheses, models, and theories.
Given these conclusions, it seems likely that EPIC and extensions of the SRD model may be applied as well to explain, quantify, and predict multiple-task performance in not only simple laboratory situations but also complex real-world situations. For example, the final section of this article focuses on aircraft-cockpit operation and speed-stressed human-computer interaction, where adaptive executive processes and flexible task-scheduling strategies play even greater roles than under the PRP procedure. However, before potential future applications are discussed at more length, some remaining possible concerns and criticisms with respect to the present theoretical framework should be assuaged.
Critique of EPIC and SRD Model
A critique of the EPIC architecture and SRD model might include at least three types of criticism: (1) our underlying substantive assumptions about multiple-task performance are patently false, as evidenced by available empirical data; (2) the model and architecture that embody these assumptions are excessively complex and have too many free parameters, thereby making results from computer simulations with the present theoretical framework be essentially uninformative; (3) the framework leads to no interesting new predictions. Of course, we disagee with each of these criticisms, as argued next
Criticism 1: Empirical falseness. That the assumptions associated with EPIC and the SRD model are empirically false has been alleged by some investigators on the basis of RT data from the PRP procedure and other related dual-task paradigms. Nevertheless, in each such case to date, the putative contradictory data are actually consistent with the present theoretical framework, and on some counts are explicitly predicted by it Failures to acknowledge these consistencies and to offer appropriate interpretations for them may stem from a less than full grasp of how the model and its architecture function in detail.
For example, Ivry et al. (1994,1996) observed PRP effects (i.e., effects of SOA on mean Task 2 RTs) whose magnitudes stayed about the same regardless of whether Tasks 1 and 2 were both visual- manual tasks or Task 1 was visual-manual and Task 2 was visual-vocal. This prompted these investigators to dispute EPIC's assumptions that (a) there is a single manual motor processor for producing left-hand and right-hand responses, and (b) there are separate manual and vocal motor processors for producing left-hand and spoken responses (cf. Figure 1). The dispute by Ivry et al. was based on an apparent misunderstanding about the principal source of PRP effects under the SRD model Ivry et aL reasoned that if the SRD model and EPIC were correct then contrary to then- empirical data, PRP effects should always be greater when both Task 1 and Task 2 are visual-manual
47

Computational Theory of Human Performance: Part 2 Meyer & Kieras
tasks, because this particular task combination would entail more motor-output interference. However, such reasoning is fallacious. According to the SRD model, the magnitudes of PRP effects do not necessarily depend on what perceptual-motor modalities are entailed by the primary and secondary tasks. Rather, PRP effects stem directly from the times taken by Task 1 stimulus identification, Task 1 response selection, and executive processes that unlock temporarily postponed Task 2 processes (Meyer & Kieras, 1997a, Table 3). On some occasions, the values of these parameters can be independent of the Task 1 and Task 2 motor modalities that are involved. With generic parameter values, the SRD model could readily produce equivalent PRP effects for visual- manual and visual-vocal secondary tasks when they are combined with a visual-manual primary task of the sort used by Ivry et al. (1994,1996).
A similar caveat applies to inferences made by Van Seist and Jolicoeur (1993). They observed additive effects of SOA and S-R numerosity (i.e., number of alternative S-R pairs in Task 2) on mean Task 2 RTs, which were construed as evidence for an immutable response-selection bottleneck and against our assumptions about concurrent response-selection processes. However, as we have shown here (Figure 5D; Figure 7; Figure 9B) and elsewhere (Meyer & Kieras, 1992,1994,1997a), such additivity is a natural consequence of the SRD model if time parameters associated with Task 1 processes, Task 2 processes, and executive processes have certain plausible values. Whenever the model is tested on the basis of an obtained data set, these considerations must be taken into account.
Dubious claims about the empirical falseness of the SRD model and EPIC architecture have also been made by Ruthruff et al. (1995,1996). As mentioned before (see PRP Effects on Equal-Priority Tasks), these investigators compared RTs from dual-task and single-task trials. The dual-task trials required subjects to perform auditory-vocal and visual-manual tasks simultaneously with equal priority; overt responses for the two tasks had to be produced at the same time (i.e., temporally grouped). Obtained dual-task RTs were substantially longer than those from single-task trials during which either the auditory-vocal or visual-manual task was performed alone. On the basis of this seemingly large RT difference and a supplementary mathematical analysis, Ruthruff et aL (1995, 1996) inferred that contrary to the SRD model, response-selection processes for the two tasks were not concurrent during the dual-task trials. Yet the results of these investigators are actually what the model would predict when it is properly modified to accomodate the prevailing instructions about equal-task priorities and temporal response grouping. Because of such instructions, response- selection processes for the two tasks could take place concurrently during dual-task trials, but progress on each task would have to proceed through a deferred response-transmission mode like the SRD model has, so that overt task responses are properly grouped. Such obligatory use of the deferred mode on dual-task trials would substantially lengthen predicted RTs relative to those on single-task trials, where task and executive processes could use the immediate response-transmission mode instead, just as Ruthruff et al. (1995,1996) found.
Criticism 2: Excessive complexity. The ability of the SRD model to account for various patterns of RT data stems in part from the complexity of our theoretical framework and the multidimensionality of its parameter space. What we have proposed here and elsewhere (Meyer & Kieras, 1997a) is more elaborate than an unadorned single-channel hypothesis (cf. Welford, 1952, 1959) or response-selection bottleneck model (cf. Pashler, 1994a; Welford, 1967,1980). Confronted with this state of affairs, some critics might object that our framework's complexity and multidimensionality are much too great A conceivable corollary objection is that with its available "free" parameters, the SRD model would fit any imaginable RT data that a PRP study could produce, thereby making the model empirically untestable. However, we disagree. Our disagreement rests on several counterarguments.
In evaluating our theoretical framework, one first should appreciate that even "elementary" multiple-task performance of the sort required by the standard PRP procedure is itself rich and varied. An appreciation of this fact may be cultivated more fully by considering similar past cases. For example, a dominant model in the history of sensory psychophysics was high-threshold theory (HTT; Krantz, 1969; Luce, 1963). Analogous to the classic perceptual and response-selection bottleneck models, HTT assumed that human observers detect simple sensory stimuli (e.g., light flashes and tone bursts) through a discrete all-or-none threshold mechanism, wherein the subjective stimulus intensity must exceed some constant absolute level to be detected. Because of this
48

Computational Theory of Human Performance: Part 2 Meyer & Kieras
threshold's putative rigidity, little accommodation was provided by HTT for observers' decision criteria and judgment strategies. As a result, many problematic psychophysical data went unexplained. Ultimately, however, statistical signal-detection theory (SDT) emerged on the scene, reconciling phenomena that had previously bedeviled HTT (Green & Swets, 1966; Tanner & Swets, 1954). Unlike in HTT, no discrete absolute high threshold is assumed in SDT. Instead, SDT attributes observers' detection performance to stochastic processes that involve a continuum of sensory states and adjustable decision criteria. According to SDT, observers set their decision criteria strategically to achieve various preferred frequencies of "hits" for stimulus signals and "correct rejections" for noise, depending on prevailing reward schemes. A key insight of SDT is that even the most basic types of human performance are mediated by sophisticated adaptive executive processes rather than just rigid perceptual or passive cognitive mechanisms. From this perspective, the moderate complexity of the EPIC architecture and SRD model seem reasonably justifiable, given that the PRP procedure and other multiple-task situations obviously require more of human performers than does a single signal-detection task.
With these considerations in mind, it comes as no surprise that depending on the particular design of task conditions, studies with the PRP procedure have yielded diverse and elaborate patterns of Task 1 and Task 2 RTs (e.g., Figures 5,6,7,9,10,11, and 13). Systematic practice effects and reliable individual differences among subjects may occur under these conditions (e.g., Ivry et al., 1994,1996; Lauber, Schumacher, Glass, Zurbriggen, Kieras, & Meyer, 1994; Meyer et al., 1995; Pashler 1994c). Details of instructions about task priorities also influence the data substantially (Koch, 1993,1994; Lauber, 1994; Meyer et al., 1995; Pashler, 1990; Sanders, 1964). There is simply no way that an unadorned single-channel hypothesis or structural bottleneck model can explain this plethora of phenomena (Meyer et al., 1995). What one therefore needs instead is a more realistic set of precise assumptions that embody the true power and generativity of the human information-processing system.
It is toward satisfying this need that EPIC and the SRD model have been formulated. Indeed, because of their objectives, this model and its architecture have some striking sirnilarities to certain aspects of statistical signal-detection theory. For example, the adjustable lockout points and unlocking events that are used by the SRD model's executive process to satisfy task priorities bear close kinship with the adjustable decision criteria of SDT. If the classic single-channel hypothesis and structural-bottleneck models likewise were augmented to characterize multiple-task performance more veridically than they do now, these competitors would become at least as complex and parameter laden as our theoretical framework is.
Still, EPIC and the SRD model do not have an unlimited number of "free" parameters, nor can they fit every imaginable RT data set Some of EPIC's parameters are context independent; their mean values stay the same across all situations to which our theoretical framework may apply. For example, we assume that the mean of EPIC's cognitive-processor cycle time typically equals 50 ms (Meyer & Kieras, 1997a), and this assumption has held throughout all of our simulations thus far. Other parameters are context dependent; their mean values may change from one condition to the next, depending on what perceptual modalities, motor modalities, and S-R mappings are entailed there. For example, if Task 1 of the PRP procedure requires identifying tones, whereas Task 2 requires identifying printed letters, then the mean values respectively assigned to the stimulus- identification times for EPIC's auditory and visual perceptual processors might differ. Within a particular context, however, the mean values of parameters such as stimulus-identification times, response-selection times, and movement-feature preparation times would stay the same across related conditions, insofar as they involve the same stimuli, responses, and S-R mappings.
Given the preceding constraints, the SRD model has a maximum of six "free" (context dependent) parameters with which to account quantitatively for a particular PRP curve (i.e., mean Task 2 RTs plotted against SOAs) from a specific condition of an experiment with the PRP procedure. Among these parameters are the mean ocular orientation, stimulus-identification, and response-selection times for Task 2, together with the unlocking onset latency, suspension waiting time, and response-preparation waiting time of the model's executive process. In combination, they may yield a simulated PRP curve that is formed from up to five linear segments (Meyer & Kieras, 1997a, Figure 14). If an empirical PRP curve includes mean Task 2 RTs associated with seven or
49

Computational Theory of Human Performance: Part 2 Meyer & Kieras
more SOAs (e.g., see Figure 6), then the SRD model is not guaranteed to fit it well, regardless of what mean values are assigned to the available context-dependent parameters.
Furthermore, when empirical PRP curves from several conditions of the same study must be fit conjointly, the constraints on the SRD model and its simulated PRP curves are much greater, because at least some context-dependent parameters have to stay the same across conditions. For example, consider our account of mean RTs from the PRP study by Hawkins et al. (1979). Then- data included eight empirical PRP curves of mean Task 2 RTs with six SOAs per curve (Figure 5). To fit these curves well, we had 22 context-dependent parameter values (Meyer & Kieras, 1997a, Table 4), whereas the mean Task 2 RTs of Hawkins et al. (1979) had 48 degrees of freedom, among which were 30 reliable independent linear RT contrasts. Thus, there was no a priori guarantee that the SRD model could account for these data adequately.
Indeed, we have presented some other cases for which the original SRD model yielded rather poor fits between simulated and empirical mean RTs. These cases illustrate that this model does not have arbitrarily great freedom to fit every data set extremely well. For example, consider the PRP study by McCann and Johnston (1992, Exp. 2). With respect to it, the model failed miserably at first (Figure 9A). The failure apparently occurred because this study induced participants to use elaborate eye-movement strategies, which were not anticipated initially as part of the model's executive process and EPIC architecture. To obtain an improved fit between simulated and empirical mean RTs, we had to augment the model and architecture with some principled modifications. In turn, these modifications not only provide an improved fit for McCann and Johnston's (1992, Exp. 2) data but also make some further explicit testable predictions.
Criticism 3: Lack of predictive power. That EPIC and the SRD model lack predictive power might have been a third criticism against them. However, as the preceding discussion indicates, our theoretical framework actually leads to many testable new predictions about overt behavior during multiple-task performance. For example, we predict that if the eye movements of participants were to be monitored during a future replication of McCann and Johnston's (1992, Exp. 2) PRP study, they would have spatial and temporal characteristics similar to those of the extended SRD model from which the simulated mean RTs in Figure 9B came. Other extensions of the SRD model, such as those proposed for Pashlefs (1990) PRP studies with variable task order (Figure 12), make predictions about the frequency and temporal characteristics of manual response grouping.
Additional Predictions
In addition, our theoretical framework yields further predictions about task-difficulty effects, individual differences among peoples' preferred strategies of task scheduling, and benefits of special training for multiple-task performance. Under the general class of adaptive executive control (AEC) models to which the SRD model belongs, people may coordinate their performance during the PRP procedure by choosing an optional Task 2 lockout point and Task 1 unlocking event (Figure 3). These choices supposedly ensure that instructions about task priorities are satisfied and Task 1 responses precede Task 2 responses regardless of the SOA. The possible lockout points include ones that are right before the start of either stimulus identification, response selection, or movement production for Task 2. The possible unlocking events include ones that are right after the end of stimulus identification, response selection, or movement production for Task 1. Specifically, in the SRD model, the Task 2 lockout point is right before the start of movement production for Task 2, whereas the Task 1 unlocking event is right after the end of either response selection or movement production for Task 1. However, other Task 2 lockout points and Task 1 unlocking events may be used instead, given the flexible nature of the executive processes that the EPIC architecture enables.
Two distinct types of strategy are therefore available under the AEC models for scheduling task performance in the PRP procedure (Meyer & Kieras, 1996; Meyer et al., 1995). One of these types is cautious. Cautious scheduling strategies involve relatively early Task 2 lockout points and relatively late Task 1 unlocking events. For example, to implement such a strategy, the executive process could use a pre-selection Task 2 lockout point and post-movement Task 1 unlocking event (Figure 14). This would be cautious because it allows little temporal overlap between Task 1 and Task 2, increasing Task 2 RTs at short SOAs in order to decrease the chances that overt Task 2
50
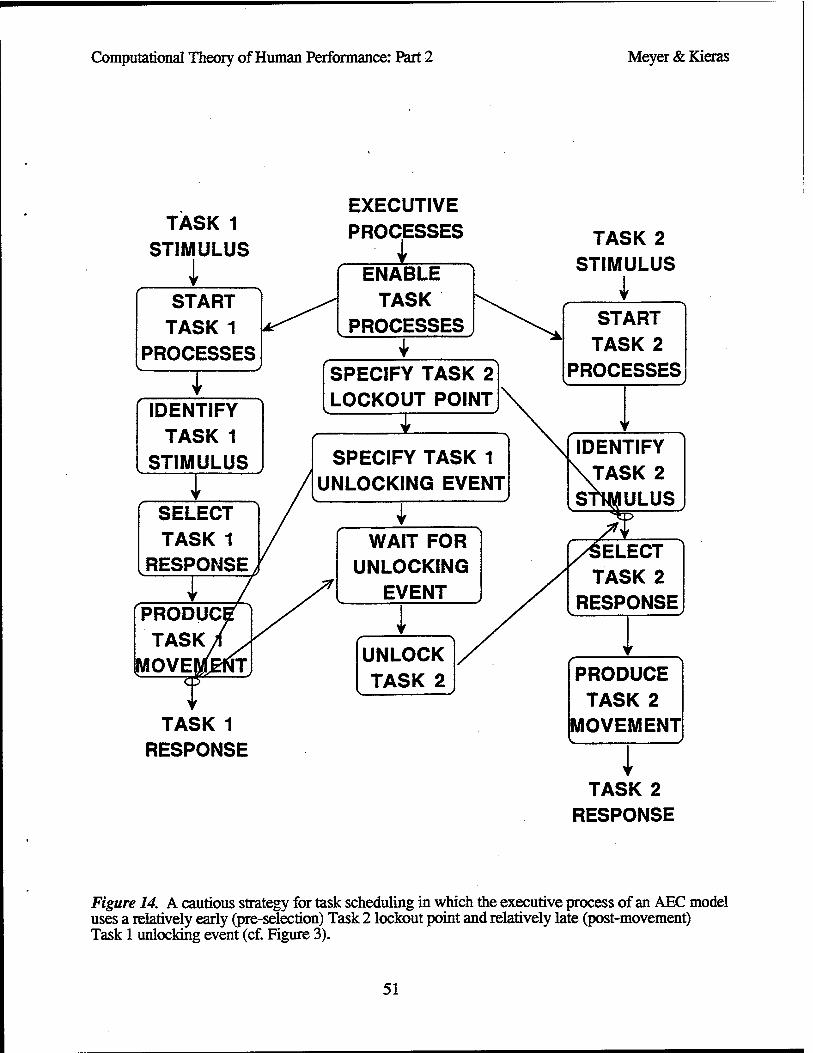
Computational Theory of Human Performance: Part 2 Meyer & Kieras
TASK 1 STIMULUS
i START
TASK 1 PROCESSES
IDENTIFY TASK 1
STIMULUS
SELECT TASK 1
RESPONSE
PRODUCi TASK
MOVEMENT
TASK 1 RESPONSE
EXECUTIVE PROCESSES
ENABLE TASK
PROCESSES
SPECIFY TASK 2 LOCKOUT POINT
SPECIFY TASK 1 UNLOCKING EVENT
I WAIT FOR
UNLOCKING EVENT
1 UNLOCK TASK 2
TASK 2 STIMULUS
i START
TASK 2 PROCESSES
IDENTIFY TASK 2
STIMULUS \TASI
IELECT TASK 2
RESPONSE
PRODUCE TASK 2
MOVEMENT
1 TASK 2
RESPONSE
Figure 14. A cautious strategy for task scheduling in which the executive process of an AEC model uses a relatively early (pre-selection) Task 2 lockout point and relatively late (post-movement) Task 1 unlocking event (cf. Figure 3).
51
Computational Theory of Human Performance: Part 2 Meyer & Kieras
responses might occur prematurely before overt Task 1 responses. By contrast, a second possible type of scheduling strategy is daring. Daring scheduling strategies involve relatively late Task 2 lockout points or relatively early Task 1 unlocking events. For example, to implement such a strategy, the executive process could use a post-selection Task 2 lockout point and pre-movement Task 1 unlocking event (Figure 15).21 This would be daring because it allows more temporal overlap between Task 1 and Task 2 stages of processing, decreasing Task 2 RTs at short SOAs but increasing the chances that overt Task 2 responses might occur prematurely before overt Task 1 responses. Of course, which type of scheduling strategy is used in a particular context may depend on factors such as the subjective difficulties of Tasks 1 and 2, amount of prior experience with multiple-task situations, and personal preferences that people have for cautious or daring performance.
Predicted effects of Task 1 difficulty. To be precise, a plausible prediction by our theoretical framework is that in the PRP procedure, participants will adopt a cautious scheduhng strategy more often when Task 1 is difficult than when it is easy. This follows directly from several joint considerations: (a) the amount of time needed to complete Task 1 increases with its difficulty, thereby increasing the subjective probability that Task 2 responses might occur prematurely unless progress on Task 2 is constrained more strictly than when Task 1 is easy; (b) use of a cautious scheduling strategy provides the desired extra constraint on Task 2 progress; (c) under instructions that emphasize high response accuracy, people tend to perform less daringly than their information- processing capacities would ultimately allow.
If so, then Task 1 difficulty should affect the pattern of mean Task 2 RTs and PRP curves that emerge when Task 2 difficulty and SOA are manipulated too. Given the late (i.e., post-selection) Task 2 lockout point that might be used as part of a daring scheduling strategy in the context of an easy Task 1, mean Task 2 RTs ought to embody interactive effects of Task 2 difficulty and SOA, forming divergent PRP curves like those associated with the SRD model (e.g., Figures 5A and 5C). By contrast, given the earlier (e.g., pre-selection) Task 2 lockout point that might be used as part of a cautious scheduling strategy in the context of a difficult Task 1, mean Task 2 RTs ought to embody additive effects of Task 2 difficulty and SOA, forming "paraller (i.e., vertically equidistant) PRP curves like those associated with a response-selection bottleneck model.
Predicted individual differences in task-scheduling strategies. Nevertheless, when Task 1 is difficult, some people might still adopt a daring scheduling strategy. This prediction follows from several more considerations: (a) regardless of whether Task 1 is easy or difficult, EPIC enables various Task 2 lockout points and Task 1 unlocking events to be used for task scheduling; (b) people differ in the extent to which their performance is routinely cautious or daring; (c) despite strong rewards for cautiousness, some individuals continue to perform daringly (e.g., Etickman & Meyer, 1987).22 If so, then analyses of individual participants' PRP curves when Task 1 is difficult should reveal various systematic patterns. Participants who tend toward cautious task scheduling with an early (e.g., pre-selection) Task 2 lockout point ought to produce "paraller PRP curves of mean Task 2 RTs that embody additive SOA and Task 2 response-selection difficulty effects. In contrast, a different RT pattern should emerge from participants who tend toward daring task scheduling with a late (i.e., post-selection) Task 2 lockout point regardless of prevailing primary-task difficulty. They ought to produce divergent PRP curves of mean Task 2 RTs that embody interactive SOA and Task 2 response-selection difficulty effects, just as if Task 1 were easy.
21 By definition, the scheduling strategy of the SRD model, a member of the AEC class, is therefore relatively daring.
22 For example, Dickman and Meyer (1987) studied groups of participants who scored high, medium, or low on a self- report personality questionnaire (Eysenck & Eysenck, 1977) feat measured degrees of "impulsivity." During three experiments with basic perceptual-motor and cognitive tasks, the high-impulsive participants performed more quickly but less accurately than the low-impulsive participants. Payoff schemes that emphasized either response speed or accuracy affected how daring (fast) or cautious (accurate) the participant's performance was. However, these effects did not eliminate fee inherent individual differences between groups or change their preferred strategies of information processing.
52

Computational Theory of Human Performance: Part 2 Meyer & Kieras
TASK 1 STIMULUS
i START
TASK 1 PROCESSES
IDENTIFY TASK 1
STIMULUS
SELECT TASK
RESPpfiSE.
PRODUCE TASK 1
[MOVEMENT
TASK 1 RESPONSE
EXECUTIVE PROCESSES
1 ENABLE TASK
PROCESSES
SPECIFY TASK 2 LOCKOUT POINT
SPECIFY TASK 1 UNLOCKING EVENT
I WAIT FOR
UNLOCKING EVENT
1 UNLOCK TASK 2
TASK 2 STIMULUS
START TASK 2
PROCESSES
IDENTIFY TASK 2
STIMULUS
.SELECT 'ASK 2
RESPONSE
PRODUCE TASK 2
MOVEMENT
1 TASK 2
RESPONSE
Figure 15. A daring strategy for task scheduling in which the executive process of an AEC model uses a relatively late (post-selection) Task 2 lockout point and relatively early (pre-movement) Task 1 unlocking event (cf. Figure 14).
53

Computational Theory of Human Performance: Part 2 Meyer & Kieras
Predicted benefits of special training. Despite the preceding considerations, people who prefer a cautious scheduling strategy when Task 1 is difficult need not do so forever. To the contrary, if our theoretical framework is correct, their preferences can be shaped through special training protocols that induce them to adopt more daring scheduling strategies. We predict that such training protocols should eliminate differences among people's strategies and lead them to temporally overlap their response-selection processes for primary and secondary tasks regardless of Task 1 difficulty. In turn, this would yield uniformly divergent PRP curves with strongly interactive effects of SOA and Task 2 difficulty on mean Task 2 RTs.
Empirical Tests of Predictions
Initial confirmatory tests of the preceding predictions have been conducted in our laboratory (Lauber et al., 1994; Meyer et al., 1995; Schumacher, Glass, Lauber, Gmeindl, Woodside, Kieras, & Meyer, 1996). For these tests, we replicated and extended some conditions of the PRP study by Hawkins et al. (1979). This replication and extension involved three experiments.
Experiment 1: PRP procedure with easy Task 1. Our first experiment confirmed that after practice at the PRP procedure, participants consistently adopt a danng scheduling strategy with a post-selection Task 2 lockout point when Task 1 is easy (Lauber et al., 1994; Schumacher et al., 1996). During Experiment 1, ten participants performed an easy auditory-manual primary task together with either an easy or hard visual-manual secondary task. For Task 1, there were two alternative S-R pairs (left-hand keypresses to tones). For Task 2, there were either two or eight alternative S-R pairs (right-hand keypresses to digits), which made response selection during Task 2 be easy or hard, respectively. Each participant had three days of practice with these tasks. Like Hawkins et al. (1979), we found that under such conditions, empirical mean Task 2 RTs formed divergent PRP curves with interactive effects of SOA and Task 2 response-selection difficulty. For example, Figure 16A shows this pattern from participants' third day of practice in Experiment l.23. It therefore appears that as our framework predicts, Task 1 and Task 2 responses were selected concurrently at short SOAs when Task 1 was easy, consistent with the daring scheduling strategy of the SRD model.
Moreover, Figure 16B suggests that all of Experiment l's participants performed in the same consistent fashion. This figure shows interactions between the effects of SOA and response- selection difficulty on mean Task 2 RTs separately for each participant who contributed to Figure 16A. Over the horizontal axis of Figure 16B, these interactions are ordered in terms of their individual magnitudes and signs. Here a zero interaction indicates that a participant had equal Task 2 difficulty effects at the shortest and longest SOAs, which came from "parallel" (vertically equidistant) PRP curves. A positive interaction indicates that a participant's PRP curves diverged as the SOA increased, and a negative interaction indicates that they converged. In Figure 16B, it can be seen that the participants' interactions were always positive. Their distribution is very similar to what should occur if every participant used a daring scheduling strategy through which Task 1 and Task 2 responses were selected concurrently.
To support this latter conclusion further, a comparison may be made between the light vertical bars (predicted interactions) and dark vertical bars (observed interactions) in Figure 16B. The light vertical bars were derived through three steps: (a) it was assumed that all participants used the same strategy for task scheduling; (b) the interactions observed for individual participants were assumed to differ from each other only because of residual between-trial variance or "noise" in each participant's RTs; (b) given these assumptions, we estimated the distribution of interactions that should emerge across participants on the basis of their prevailing between-trial RT variances.24 Thus, if all participants used the same scheduling strategy, the light bars ought to approximate the dark bars
23 The corresponding mean Task 1 RTs equalled 327 ms and 334 ms when Task 2 was easy and hard, respectively. There were no reliable effects of SOA on the mean Task 1 RTs.
24 Between-trial RT variances were calculated through separate analyses of variance on each participant's individual trial-by-trial RTs. Pooled residuals from these analyses provided estimates of the "noise" in the data.
54

Computational Theory of Human Performance: Part 2 Meyer & Kieras
7001 (A) Reaction Times in Task 2 of Exp. 1 (B) Interactions in Task 2 of Exp. 1
400 600 SOA (ms)
4 5 6 7 8 Participant
9 10
Figure 16. Results from Day 3 of PRP Experiment 1 with an easy auditory-manual Task 1 and easy or hard visual-manual Task 2. A. Mean Task 2 RTs as function of SOA and Task 2 response- selection difficulty for a group of ten participants. B. Magnitudes of interaction between the effects of SOA and Task 2 difficulty on mean Task 2 RTs for individual participants. Dark vertical bars represent the participants' observed interactions. Light vertical bars represent the distribution of predicted interactions that should have occurred if all participants used the same daring strategy of task scheduling and the observed interactions differed only because of between-trial RT variance (i.e., "noise") in each participant's data.
55

Computational Theory of Human Performance: Part 2 Meyer & Kieras
closely. Indeed, this approximation is fairly close, indicative of a shared daring scheduling strategy that has a post-selection Task 2 lockout point (cf. Figure 15).
Experiment 2: PKP procedure with difficult Task 1. We and colleagues (Lauber et al., 1994; Meyer et al., 1995) next conducted a second PRP experiment with a group of eight new participants. Experiment 2 tested our framework's prediction that increasing the difficulty of Task 1 should induce at least some participants to adopt a cautious scheduling strategy. For this purpose, Task 1 involved four rather than two alternative S-R pairs (i.e., left-hand keypresses to tones). The harder primary task was performed together with an easy and hard visual-manual secondary task, for which there were respectively either two or eight alternative S-R pairs (right-hand keypresses to digits), as in Experiment 1. Again, each participant had three days of practice. Under such conditions, the group PRP curves no longer diverged on average; to the contrary, empirical mean Task 2 RTs formed "parallel" (vertically equidistant) PRP curves that embodied additive effects of SOA and Task 2 response-selection difficulty. For example, Figure 17A shows this pattern from participants' third day of practice in Experiment 2.25 These results imply that response selection for Task 2 occurred after a period of temporal slack during which the secondary task was "locked out" and did not overlap with response selection for Task 1, as would happen with a cautious scheduling strategy that has a pre-selection Task 2 lockout point (cf. Figure 14). Thus, Experiment 2 supports the prediction that making Task 1 harder may induce at least some participants to adopt scheduling strategies that are less daring.
Nevertheless, as also expected, there were systematic differences among the patterns of mean Task 2 RTs that individual participants produced during Experiment 2. To be precise, consider Figure 17B, which shows interactions between the effects of SOA and response-selection difficulty on mean Task 2 RTs for each participant who contributed to Figure 17A. Here the distribution of interactions is rather diffuse; one participant had an approximately null interaction (i.e., additive effects of SOA and Task 2 response-selection difficulty), but three participants had markedly negative interactions, and four others had various magnitudes of positive interaction including some that were quite large. This is not what would happen if every participant used the same scheduling strategy. To the contrary, some participants apparently used strategies that were cautious (i.e., ones without overlapping response-selection processes), whereas others used strategies that were about as daring (i.e., involved overlapping response-selection processes) as those in Experiment 1.
To support this latter conclusion further, a comparison may be made between the light vertical bars (predicted interactions) and dark vertical bars (observed interactions) in Figure 17B. The light vertical bars were derived through steps analogous to those taken before (cf. Figure 16B). Thus, if every participant had used the same cautious scheduling strategy in Experiment 2, the light vertical bars should approximate the dark bars closely. However, this did not happen. A large majority (i.e., 7/8) of the dark vertical bars in Figure 17B are longer than the light vertical bars paired with them, embodying consistently more extreme interactions than a single cautious scheduling strategy would predict. Instead, our results suggest that Experiment 2 included at least two distinct subgroups of participants, some of whom (e.g., Participant 1) produced significantly convergent PRP curves and others of whom (e.g., Participant 8) produced significantly divergent PRP curves. The overall outcome of Experiment 2 therefore supports our framework's predictions that task scheduling involves adaptive mechanisms of executive control and that, because of systematic personal preferences, some though not all participants may adopt daring scheduling strategies with post- selection Task 2 lockout points even when Task 1 is relatively hard.
For example, Figures 18A and 18B further illustrate the various patterns of RT data that can result from such individual differences.26 In Figure 18A are the mean Task 2 RTs produced by Participant 1 of Experiment 2 (cf. Figure 17B). This individual had convergent PRP curves for
25 The corresponding mean Task 1 RTs equalled 512 ms and 521 ms when Task 2 was easy and hard, respectively. These values were reliably greater than those in Experiment 1, exceeding them by 186 ms on average, because Experiment 2 involved a harder primary task.
26 Each participant who contributed to Figures 18A and 18B had mean Task 1 RTs mat averaged slightly more than 500 ms and were not much affected by either the SOA or Task 2 difficulty.
56

Computational Theory of Human Performance: Part 2 Meyer & Kieras
1000
«a
© E
900
800-
700-
u | 600
<0
£ 500
400
300+ 0
(A) Reaction Times in Task 2 of Exp. 2 150i (B) Interactions in Task 2 of Exp. 2
200 400 600 800 1000
SOA (ms)
2 3 4 5 6 Participant
Figure 17. Results from Day 3 of PRP Experiment 2 with a hard auditory-manual Task 1 and easy S visual-manual Task 1 A. Mean TaS 2 RTs as function of SOA and Task 2 re^onse- selection difficulty for a group of eight participants. B. Magnitudes of interaction betweenithe effS of SOA and Task2difficulty on mean Task 2 RTs for individual participant ^vertical bars represent the participants' observed interactions. light vertical bars.representdie^smbution of predicted interactions that should have occurred if all participants used the ^e^°T
usv!^
y of task scheduling and the observed interactions differed only because of between-tnal RT variance (i.e., "noise") in each participant's data.
57

Computational Theory of Human Performance: Part 2 Meyer & Kieras
1000
-. 900 CO
E "-" 800 CD
E P 700 c ~ 600 u CO
ffi 500 c S 400
300
200
(A) RTs for Participant 1 in Task 2 of Exp. 2 1000i
CO 900-
E
o 800- E I- 700 c o o 600 cs CB oc 500 c CO CB
E 400
300
200
(B) RTs for Participant 8 in Task 2 of Exp. 2
Easy Task 2
200 400 600
SOA (ms)
800 1000 200 400 600 800 1000
SOA (ms)
Figure 18. Results from two different participants whose RTs contributed to Figures 17A and 17B on Day 3 in Experiment 2. A. Mean Task 2 RTs as function of SOA and Task 2 response-selection difficulty for Participant 1, who had converging PRP curves and apparently used a cautious scheduling strategy. B. Mean Task 2 RTs as function of SOA and Task 2 response-selection difficulty for Participant 8, who had diverging PRP curves and apparently used a daring scheduling strategy.
58

Computational Theoiy of Human Performance: Part 2 Meyer & Kieras
which the Task 2 difficulty effect decreased as the SOA increased, manifesting a special type of cautious scheduling strategy that perhaps used a hybrid combination of pre- and post-selection Task 2 lockout points.27 By contrast, in Figure 18B are the mean Task 2 RTs of Participant 8, who had divergent PRP curves for which the Task 2 difficulty effect increased as the SOA increased, manifesting a daring scheduling strategy that consistently used a post-selection Task 2 lockout point.28 Although averaging the RT data across such individuals yields "parallel" group PRP curves (Figure 17A), it obviously would be mistaken to conclude from them that every participant chose the same cautious scheduling strategy with a pre-selection Task 2 lockout point The specter of this potential mistake makes one wonder how many previous researchers have reached erroneous theoretical conclusions in favor of the response-selection bottleneck hypothesis by averaging their PRP data across participants while ignoring individual differences among them.
Experiment 3: Training for flexible task scheduling. Supplementing our results about the predicted effects of Task 1 difficulty on Task 2 RTs and individual differences in task scheduling, we and colleagues (Lauber et al., 1994; Meyer et al., 1995) conducted a third experiment It tested another related prediction: even when Task 1 is hard, special training protocols can induce most, if not all, participants to adopt daring instead of cautious scheduling strategies. Specifically, given the adaptive executive control that EPIC enables, such training should promote the use of a late post- selection rather than early pre-selection Task 2 lockout point If so, all participants ought ultimately to produce divergent PRP curves that embody positive interactions of SOA and Task 2 difficulty effects on mean Task 2 RTs when Task 1 is hard, as happened before when Task 1 was easy (cf. Figures 16A and 16B). . ..
During Experiment 3, this prediction was tested by giving eight new participants an initial three- day phase of special "variable priority" training after which they went through a subsequent one-day assessment phase with the standard PRP procedure. The training phase followed Gopher's (1993) suggestions about how to enhance the efficiency of dual-task performance. It required concurrent auditory-manual and visual-manual tasks to be performed with equally high priority and relaxed constraints on the serial order of stimuli and responses. As part of this training, stimuli for the auditory-manual task occurred either first or second on a trial, and conversely, stimuli for the visual- manual task occurred either second or first Here participants did not know which type of stimulus would occur first, nor did they have to produce their responses in one particular prespecified order. The relative difficulties of the auditory-manual and visual-manual tasks also varied orthogonally across the trial blocks run under these conditions. Because of instructions given before the training phase started, participants were strongly encouraged to overlap their response-selection processes for the two tasks, as a daring scheduling strategy would entail. After the training phase ended, participants entered the subsequent assessment phase. It involved the same PRP procedure as had been administered during Experiment 2, which combined a hard auditory-manual primary task with easy and hard visual-manual secondary tasks. We then measured the mean RTs from the assessment phase of Experiment 3 to check whether they manifested more daring strategies of task scheduling than had been used during Experiment 2.
27 That the cautious scheduling strategy of Participant 1 was "special" appears so because his PRP curves at short SOAs had slopes much steeper than -1 (Figure 18A). For example, when Task 2 was easy and hard, the slopes of these curves over the SOA interval from 50 to 150 ms were -1.33 and -2.19, respectively. Such extreme steepness, which falls substantially outside the typical expected range of (-1,0), suggests that this participant's scheduling strategy involved a type of "progressive unlocking" as we discussed before (Figure 8) regarding the PRP data of Hawkins et al. (1979). In particular, Participant 1 may have used a relatively early (e.g., pre-selection) Task 2 lockout point after the shortest (50 ms) SOA, but switched dynamically to using a later (e.g., post-selection) Task 2 lockout point after longer (>100 ms) SOAs. If so, this would account for both why his PRP curves had slopes steeper than -1 and why his PRP curves converged as the SOA increased.
28 The daring scheduling strategy of Participant 8 does not appear to have involved progressive unlocking, because bis PRP curves at short SOAs had slopes much shallower than those of Participant 1 (Figure 18B). For example, when Task 2 was easy and hard, the slopes of these curves over the SOA interval from 50 to 150 ms were -0.69 and -1.07, respectively.
59

Computational Theory of Human Performance: Part 2 Meyer & Kieras
Some results from these measurements appear in Figures 19A and 19B. We found that during the assessment phase of Experiment 3, empirical mean Task 2 RTs again formed divergent PRP curves with interactive effects of SOA and Task 2 response-selection difficulty (Figure 19A).29 On average, it appears that these participants selected their Task 1 and Task 2 responses concurrently at short SOAs even when Task 1 was hard, as would happen through a daring scheduling strategy of the type associated with the SRD model. Indeed, the post-training RT pattern in Experiment 3 looks much like what we obtained previously in Experiment 1 when Task 1 was relatively easy (cf. Figure 16A).
Moreover, Figure 19B suggests that after variable-priority training, all participants performed in much the same fashion. This figure shows interactions between the effects of SOA and response- selection difficulty on mean Task 2 RTs separately for each participant who contributed to Figure 19A. Here it can be seen that the participants' interactions were uniformly positive. Their distribution is very similar to what should occur if every participant used a daring scheduling strategy through which Task 1 and Task 2 responses were selected concurrently.
To support this latter conclusion further, a comparison may be made between the light vertical bars (predicted interactions) and dark vertical bars (observed interactions) in Figure 19B. The light vertical bars were derived through steps analogous to those taken for analyzing the results of Experiment 1 (cf. Figure 16B). Thus, if all participants used the same scheduling strategy, the light bars ought to approximate the dark bars closely. Indeed, this approximation is again fairly close, once more indicative of a shared daring scheduling strategy that has a post-selection Task 2 lockout point Such additional consistency emerged even though Experiment 3 involved the same hard primary task as in Experiment 2, where participants apparently had used a much more diverse set of scheduling strategies that included some rather cautious ones (cf. Figure 17B).
Summary. On balance, results from the preceding three experiments support several key predictions derived from our theoretical framework. This pervasive support bodes well for possible future research with the EPIC architecture and AEC models in other domains that entail stressful speeded multiple-task performance.
Directions for Future Research
There are many promising directions for future research starting from the present point of development in the EPIC architecture and computational models of multiple-task performance based on it As discussed next, some of these directions extend our research to realistic task domains where useful practical applications may be possible.
Modeling of rapid human-computer interaction. One such direction involves the modeling of rapid human-computer interaction (Card et al., 1983). Studies of toll-assistance operators (TAOs) who use computer workstations to provide service for third-party billing of customers' telephone calls have revealed patterns of performance consistent with our theoretical framework (Gray, John, & Atwood, 1993; John, 1988,1990; John, Vera, & Newell, 1994). During such performance, substantial amounts of temporal overlap take place among concurrent perceptual, cognitive, and motor processes.
To characterize these processes more fully, we have begun constructing EPIC models that predict detailed aspects of TAOs' performance (Kieras & Meyer, 1997; Kieras et al., 1995,1997; Wood et al., 1994). Like the SRD model, our models of TAO performance account for substantial amounts of variance in observed RT data, using parsimonius assumptions and modest numbers of parameters. This application helps illustrate both the practicality and generality of the present framework for precisely modeling multiple-task performance across a variety of task domains.
29 The corresponding mean Task 1 RTs equalled 485 ms and 487 ms when Task 2 was easy and hard, respectively, again substantially exceeding the mean Task 1 RTs from Experiment 1 in which the primary task was easier than in Experiment 3.
60
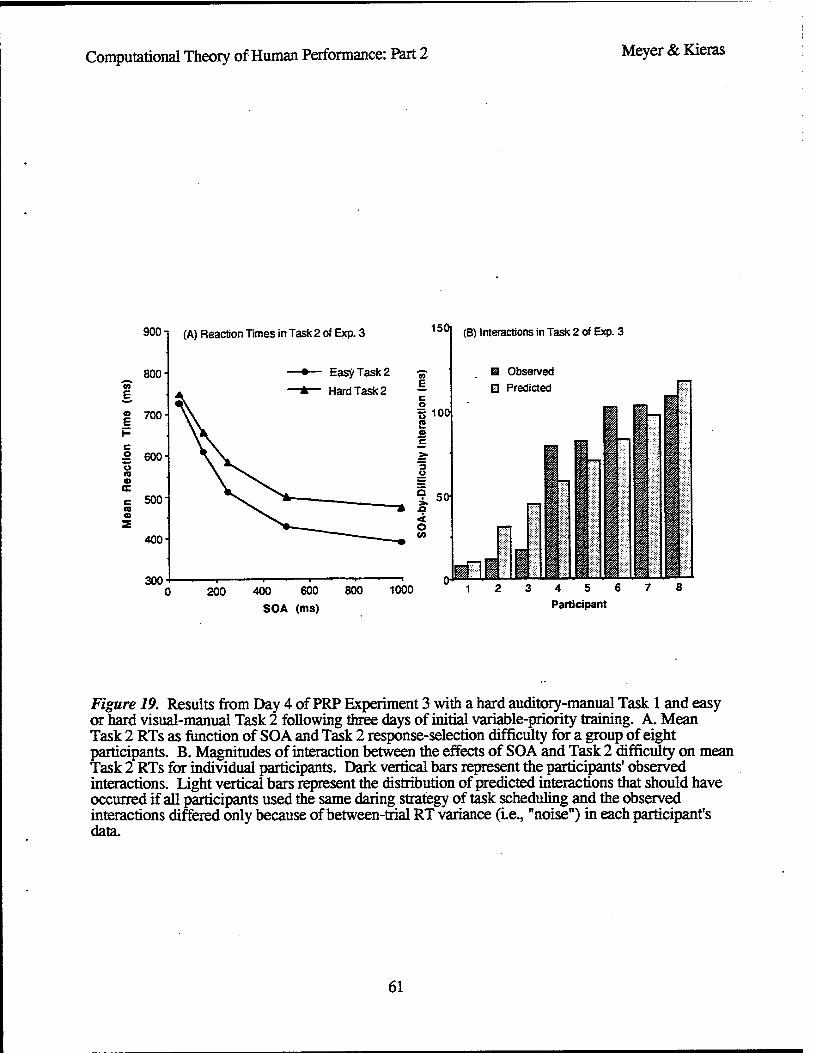
Computational Theory of Human Performance: Part 2 Meyer & Kieras
(A) Reaction Times in Task 2 of Exp. 3 150I (B) Interactions in Task 2 of Exp. 3
200 400 600 SOA (ms)
800 1000 4 5 6 Participant
Figure 19. Results from Day 4 of PRP Experiment 3 with a hard auditory-manual Task 1 and easy or hard visual-manual Task 2 following three days of initial variable-priority training. A. Mean Task 2 RTs as function of SOA and Task 2 response-selection difficulty for a group of eight participants. B. Magnitudes of interaction between the effects of SOA and Task 2 difficulty on mean Task 2 RTs for individual participants. Dark vertical bars represent the participants' observed interactions. Light vertical bars represent the distribution of predicted interactions that should have occurred if all participants used the same daring strategy of task scheduling and the observed interactions differed only because of between-trial RT variance (i.e., "noise") in each participant's data.
61

Computational Theory of Human Performance: Part 2 Meyer & Kieras
For example, consider Figure 20, which contains results from a representative exchange between a TAO and prospective customer who was charging a phone call to a third-party billing number.30 During this exchange, the TAO proceeded through several operations that included: (a) detecting the onset of a tone over a pair of headphones, which signalled that a call from a prospective customer was coming through; (b) looking at the display screen of a computer workstation for alphanumeric information that identified the call's category; (c) greeting the customer who was making the call; (d) getting the billing number to charge the call; (e) entering this and other relevant information in the computer by making a series of keystrokes on the computer's keyboard; (f) looking at the display screen and checking that the information had been entered correctly; (g) completing the connection for the customer by typing a call-initiation key; (h) bidding the customer farewell. The operations done by the TAO therefore were analogous to ones that might also occur during an extended PRP or serial choice-RT procedure.
In Figure 20, the large filled circles on the solid curve show the observed response latencies of the TAO's keystrokes as a function of their serial position throughout the typing sequence. The nearby small filled circles and dashed curve show simulated latencies from a corresponding series of keystrokes produced by an EPIC model of the TAO's performance that used a daring scheduling strategy with substantial temporal overlap among concurrent stimulus identification, response selection, and movement production processes. By contrast, the dotted curve shows simulated latencies from a model that had an artificial response-selection bottleneck and used a cautious scheduling strategy with relatively little overlap among stimulus identification, response selection, and movement production processes.
From Figure 20, several conclusions may be reached. At the start of the keystrokes (first serial position), the observed response latencies rise to a maximum level after which they decrease gradually as the serial position increases. Consequently, there is a downward latency trend that looks much like the curves found in past studies with the PRP procedure (e.g., Figure 5, mean Task 2 RTs), suggesting some postponement of pending processes in order for current processes to be completed. Such postponement was presumably necessary so that the TAO's keystrokes occurred in the correct serial order, just as instructions for the PRP procedure require that Task 1 responses occur before Task 2 responses. Yet despite the constrained order of these keystrokes, their observed response latencies are fit very poorly (R2 = 0.039; RMSE = 1150 ms) by the model that has an artificial response-selection bottleneck and cautious scheduling strategy, whose simulated latencies (Figure 20, dotted curve) extremely overpredict the data (cf. Figure 20, solid curve). Clearly, this model grossly exaggerates the amount of temporal slack that actually occurred between the TAO's successive keystrokes.31 However, the observed response latencies are fit reasonably well (R2
= 0.929; RMSE = 95 ms) by the model that has a daring scheduling strategy.32 Of course, this
30 We thank Michael Atwood of the NYNEX Science and Technology Center for providing video tapes of TAO operators' on-line performance from which the data in Figure 20 were transcribed. Helpful comments by Bonnie John and Rory Stuart regarding our studies of this performance are also gratefully acknowledged.
31 Such exaggeration happened even though our simulation for the response-selection bottleneck model was programmed to approximate the observed latencies as best possible, given inherent capacity limits of the model's bottleneck and cautious scheduling strategy.
32 The overall mean of the response latencies in Figure 20 is about 1100 ms. Relative to this baseline, the RMSE of 95 ms constitutes an 8.5% error of prediction. When working in realistic domains such as that of a TAO operator, engineers typically consider theoretical models to be useful for practical design purposes when they can predict observed numerical values within margins of error that are less than 10% (Card et al., 1983). The present EPIC model that has a daring scheduling strategy therefore satisfies this engineering criterion whereas the model that has an artificial response- selection bottleneck and cautious scheduling strategy does not. The fit of the model that has the daring scheduling strategy seems especially satisfactory because the various response latencies in Figure 20 come from single keystrokes rather than large sample averages. As a result, the goodness-of-fit here is about what one might expect if the model were correct but each response latency also contained a roughly 10% contribution from "noise" in the TAO's information- processing system, which would be typical of practiced performers under such circumstances.
62

Computational Theory of Human Performance: Part 2 Meyer & Kieras
35001
3000
| 2500
o § 2000 CO -J
0) CO
o a CO a>
Observed
Predicted: Daring Scheduling
Predicted: Cautious Scheduling
*.—....
1500-
1000
500
3456789 10 11
Keystroke Serial Position
12
Figure 20. Response latencies as a function of keystroke serial position for a series of keystrokes typed by a toll-assistance operator during a representative exchange with a customer who wanted to charge a telephone call to a third-party billing number (Kieras & Meyer, 1995,1997; Kieras, Wood, & Meyer, 1997). Large filled circles on the solid curve denote observed latencies. Small filled circles on the nearby dashed curve denote simulated latencies from an EPIC computational model that used a daring scheduling strategy with substantial temporal overlap between concurrent stimulus identification, response selection, and movement production processes. The upper dotted curve denotes simulated response latencies from another model that had an artificial response-selection bottleneck and used a cautious scheduling strategy with little temporal overlap between these processes.
63

Computational Theory of Human Performance: Part 2 Meyer & Kieras
outcome was to be expected from our previous findings for the PRP procedure. It also was to be expected because TAOs have had substantial on-the-job experience and want to complete phone calls quickly so that customers stay satisfied and phone-company expenses stay low.
Modeling of concurrent visual-manual tracking and serial choice reactions. A second realistic domain in which our theoretical framework may be applied instructively involves concurrent visual-manual tracking and serial choice-RT tasks. Under various practical circumstances (e.g., automobile and aircraft operation), this sort of task combination plays a key role. Many past studies of dual-task performance therefore have collected data on how people cope with laboratory analogs of these circumstances (e.g., Brickner & Gopher, 1981; Gopher, 1993; Gopher, Brickner, & Navon, 1982; McLeod, 1977; North, 1977; Wickens, 1976).
To explore where our research may go from here, we (Kieras & Meyer, 1995,1997; Meyer & Kieras, 1996) have focused on empirical results from one such study by Ballas, Heitmeyer, and Perez (1992). Their participants, who included some trained pilots, worked with a computerized visual display similar to ones in military aircraft cockpits. On the right side of the display was a window for a visual-manual tracking task. In this window were a cursor (circle with interior crosshairs) and iconic airplane that depicted a target object moving haphazardly through space. When participants performed the tracking task, they had to keep the cursor on target by moving a right-hand joystick that controlled the cursor's spatial position. Root mean squared error (distance between cursor and target) was measured (12 samples per second) for the tracking task Meanwhile on the left side of the display was a window for a tactical-decision task. In this window were iconic blips that appeared sequentially at unpredictable times and locations, depicting potentially dangerous objects (e.g., jet fighters, bombers, and missle sites) whose locations changed gradually over time. When participants performed the tactical-decision task, they looked at these blips one after another and indicated which ones were "hostile" or "neutral" by typing on a keyboard with their left hands. Response latencies of the keypresses were measured for the tactical-decision task.33
Some results from these measurements appear in Figure 21.34 Here the large filled circles on the solid curve show observed mean response latencies for the tactical-decision task as a function of the serial positions in which blips were evaluated throughout a sequence of tactical decisions. By design, the blip that occupied the first serial position occurred immediately after a long (2 min) interval during which the participants had been performing only the tracking task.35 Consequently, the observed latencies were longer at the start of the blip sequence, and they tended to decrease as the blip serial position increased, forming a downward curve that contained a PRP-like effect. The nearby small filled circles and dashed curve in Figure 21 show simulated response latencies from an EPIC model that performed the tactical-decision and tracking tasks with a daring scheduling strategy whose flexibility enabled substantial temporal overlap among concurrent stimulus identification, response selection, and movement production processes. This model fit the observed response latencies reasonably well (R2 = 0.975; RMSE = 90 ms). By contrast, the more distant dotted curve
33 The response latency for a blip equaled the amount of time between two successive events: (a) the color of the blip changed from black to red, blue, or amber, and (b) a key was pressed to indicate the blip's tactical status. Red blips had to be classified as "hostile"; blue blips had to be classified as "neutral"; amber blips had to be classified as either "hostile" or "neutral" on the basis of their direction and speed of movement
34 We thank James Ballas and bis colleagues at the Naval Research Laboratory in Washington, DC, for generously providing us with their data and other helpful information.
35 This extended interval of single-task tracking was designed to emulate realistic conditions associated with intermittent adaptive automation of aircraft cockpit operations. During adaptive automation, an on-board computer takes over performing one task (e.g., tactical-decision making) whenever another task (e.g., visual-manual tracking) becomes especially difficult, allowing a pilot to concentrate more fully on the difficult task. Later, when the difficult task becomes easier again, the computer signals the pilot to resume dual-task performance for both the previously automated task and the previously difficult manual task. Under such conditions, this resumption can lead to temporarily poor performance (an automation deficit) caused by a lack of prior situation awareness, which Ballas, Heitmeyer, and Perez (1992) sought to study and perhaps ameliorate.
64

Computational Theory of Human Performance: Part 2 Meyer & Kieras
60001
~ 50001 0)
> o c $ 40001
(0
Observed Predicted: Daring Scheduling
Predicted: Cautious Scheduling
o Q. CO Q>
CO CD
3000
2000
1000
Blip Serial Position
Figure 21. Mean response latencies as a function of blip serial position for the tactical-decision task in the study by Ballas, Heitmeyer, and Perez (1992). Large filled circles on the solid curve denote observed latencies. Small filled circles on the nearby dashed curve denote simulated latencies from an EPIC computational model that used a daring scheduling strategy with substantial temporal overlap between concurrent stimulus identification, response selection, and movement production processes. The upper dotted curve denotes simulated response latencies from another model that had an artificial response-selection bottleneck and used a cautious scheduling strategy with little temporal overlap between these processes. All three latency curves come from a sequence of tactical decisions that occurred immediately after an extended period during which only a visual-manual tracking task had been performed.
65
Computational Theory of Human Performance: Part 2 Meyer & Kieras
shows simulated latencies from a model that had an artificial response-selection bottleneck and used a cautious scheduling strategy whose inflexibility enabled relatively little overlap among these processes. This model's fit was much worse (R2 = 0.869; RMSE = 439 ms); it substantially overpredicted the observed response latencies, even though our simulation was programmed to approximate them as best possible despite inherent capacity limits of the response-selection bottleneck and cautious scheduling strategy.
The pattern of response latencies in Figure 21, which supports our EPIC model that has a daring scheduling strategy, is similar to what we found for the PRP procedure and TAOs' performance (cf. Figures 5 and 20). In addition, this model accounts well for the root mean squared errors observed by Ballas et al. (1992) in the visual-manual tracking task under both single-task and dual-task conditions.36 As anticipated already, it therefore appears that our theoretical framework may be applied usefully across a variety of realistic task domains, among which are tactical decision making and visual-manual tracking.
Formulation of mental-workload measures. Because of their inherent generality and precision, EPIC and our computational models of multiple-task performance may also contribute to formulating more useful measures of mental workload. If so, this could have significant practical benefits. Human-factors engineers and work planners have previously sought valid quantitative mental-workload measures to facilitate the design of person-machine interfaces, the arrangement of job activities, and the selection of qualified personnel. By taking prevalent mental and physical work requirements into account, such measures can help assess the feasibility of alternative interface designs, task composition, and personnel assignments. However, the formulation of adequate mental-workload measures has been fraught with difficulty. No single satisfactory composite workload measure yet exists; the models used thus far in seeking one have been rather crude and atheoretical. For relevant examples, reviews, and critiques, see Chubb (1981), Donchin and Gopher (1986), Lane, Strieb, Glenn, and Wherry (1981), Moray (1979), O'Donnel and Eggemeier (1986), Wickens (1991), Wierwille and Conner (1983), and Willeges and Wierwille (1979).
Of course, our theoretical framework implies that no a single satisfactory mental-workload measure may exist According to EPIC, many different processing components mediate the hypothetical mental workload imposed by multiple-task situations. This workload presumably depends on complex interactions among diverse components of processing; also, it depends on what sorts of executive processes are used to coordinate various aspects of performance and to do task scheduling. Because of the disparate entities involved, and because of the context-dependent nature of their contributions, it may be impossible for a single quantitative measure to characterize prevailing "mental workload" aptly under all circumstances.
Nevertheless, we can suggest some possible future directions in which the quantification of mental workload might proceed: (a) If our assumptions about people's capacities for executing cognitive procedures are correct, mental-workload measures should tend to discount how many production rules must be applied simultaneously in a given task situation, (b) Mental-workload measures should weight more heavily the perceptual-motor requirements of concurrent tasks, taking into account the extent to which they entail competitive access to the same peripheral sensors and effectors, especially where simultaneous ocular and manual or auditory and articulatory performance are involved. Within the present theoretical framework, it is such competition that can make concurrent tasks both objectively and subjectively very difficult, (c) In addition, improved mental- workload measures would profit from taking the limits of human working memory into account more fully.
Characterization of working-memory capacities. As part of implementing our recommendations about mental-workload measurement, distinctions should be acknowledged among potentially different types of capacity that are inherent in the human information-processing system. On the one hand, consistent with our prior assumptions, people may be able to test the conditions
36 Balks et al. (1992) found that when participants performed the tracking task alone and in combination with the tactical-decision task, their root mean squared errors averaged 39.0 and 48.0 pixel units, respectively. Correspondingly, the respective simulated root mean squared errors produced by the EPIC model that had a daring scheduling strategy" were 38.8 and 46.7 pixel units, which closely approximate the observed values.
66

Computational Theory of Human Performance: Part 2 Meyer & Kieras
and execute the actions of multiple production rules simultaneously during the same cognitive- processor cycle, regardless of how many rules there are to be applied. On the other hand, however, working memory for storing declarative episodic perceptual and motor information relevant to task performance may be quite limited. Also, working memory for storing procedural information (e.g., task goals and sequential control notes) is conceivably limited too. Each of these limitations must be accommodated by future measures of mental workload.
Although we have not yet tried to characterize working memory thoroughly as part of the EPIC architecture, there are some obvious future directions in which to go for this purpose. In particular, our subsequent research may build on findings from previous studies about how working-memory capacities contrain various cognitive and perceptual-motor processes that underlie general intelligence (Baddeley, 1986; Baddeley & Hitch, 1974; Baddeley & Lieberman, 1980; Carpenter & Just, 1989; Carpenter, Just, & Shell, 1990; Chase & Ericsson, 1983; Daneman & Carpenter, 1980; Gilhooly, Logie, Wetherick, & Wynn, 1993; Jonides, Smith, Koeppe, Awh, Minoshima, & Mmtun, 1993; Just & Carpenter, 1994; Just, Carpenter, & Hemphill, 1994; Kimberg & Farah, 1993; Kyllonen & Christal, 1990). As a result, the scope of the present theoretical framework for multiple-task performance could be expanded considerably.
Analysis of procedural-skill acquisition. We also anticipate that EPIC and our computational models of multiple-task performance may contribute significantly to subsequent analyses of skill acquisition in realistic task domains. According to previous conceptions about perceptual-motor and cognitive skill, people pass through several distinct phases of learning as they go from being novice to being expert performers. Specifically, Anderson (1982,1983,1987) has distinguised between an initial declarative stage and several later procedural substages of skill acquisition (cf. Fitts, 1964). During the declarative stage, performance is presumably mediated by propositional knowledge about how the tasks at hand should be performed; application of such knowledge apparently requires slow controlled verbal interpretive processes that lead indirectly to overt action. Nevertheless, through extended practice, propositional knowledge about proper task performance eventually can be converted to executable procedures whereby the tasks are performed directly with sets of appropriate production rules; the creation of these rules and gradual successive refinements of them characterize the substages of procedural learning. Thus, because EPIC has a production-system formalism, it provides a natural foundation on which to analyze skill acquisition further. In particular, learning algorithms such as those proposed by Anderson (1982,1983,1987) and others (e.g., Bovair, Kieras, & Poison, 1990; Bovair & Kieras, 1991) may be programmed into EPIC's cognitive processor, enabling the creation and refinement of production rules for performing single and multiple tasks.
With regard to the latter attractive prospect, an important new objective will entail understanding, describing, and predicting how flexible strategies of task scheduling are acquired and incorporated into evolving executive processes. That such acquisition occurs and can markedly influence ultimate performance levels has been demonstrated already (e.g., Gopher, 1993; Lauber et al., 1994; Meyer et al., 1995; Schumacher et al., 1996). We know specifically that the rate of learning and ultimate performance levels depend on what types of intermediate practice take place. An important next step therefore will involve modeling the learning algorithms and time course through which various training protocols promote both optimized temporal overlap among task processes and efficient allocation of limited perceptual-motor resources. Perhaps EPIC and our adaptive executive-control models can contribute significantly to this prospective endeavor.
Symbiotic relationship with cognitive neuroscience and neural-network modeling. Finally, although EPIC and the present models of multiple-task performance are expressed in terms of a production-system formalism and abstract symbolic computation, our theoretical framework may have a symbiotic relationship with cognitive neuroscience in general and connectionist neural- network modeling in particular. This symbiosis seems iniminent because the architecture of EPIC has properties that are, in fundamental ways, similar to those of the human brain and central nervous system like principal modules of the brain, EPIC's perceptual, cognitive, and motor processors operate simultaneously and interactively with each other. The assumed ability of the cognitive processor to test and apply multiple production rules in parallel is consistent with the brain's high information-processing capacity. That the cognitive processor cycles at a 20 Hz rate also is consistent with emerging evidence about the important role played by neural rhythmicities in
67

Computational Theory of Human Performance: Part 2 Meyer & Kieras
information processing (cf. Dehaene, 1993; Engel, König, Kreiter, & Singer, 1991; Jokeit, 1990; Klimesch, 1995; Lisman & Idiart, 1995; von der Malsburg & Schneider, 1986). We have chosen to embody our theoretical ideas in an architectural production system and symbolic computation, rather than in hypothetical "subsymbolic" neural mechanisms, simply because the former level of representation is perhaps most appropriate for initially characterizing functional aspects of executive cognitive processes and multiple-task performance (cf. Marr, 1982). Nevertheless, our ideas could inspire future complementary research on connectionist network models, neural systems, and brain organization.
For example, as part of present EPIC models, certain functions of executive cognitive processes have been postulated. These include our notions that (a) abstract response identities are selected in either an "immediate" or "deferred" transmission mode, (b) which mode is used at a particular time depends on task goals and strategy notes maintained in a working-memory control store, and (c) an executive process shifts from one response-transmission mode to another on the basis of efference- copy signals from on-going motor processes. Furthermore, we have claimed that the preparation and execution of overt movements is mediated through motor processes with additional important characteristics, such as feature-based programming and selectable alternative types of control (viz. voluntary cognitive initiation and automatic reflexive initiation). These characteristics and functions provide targets for which cognitive neuroscientists may seek the underlying brain mechanisms and for which neural-network modelers may formulate the corresponding connectionist control structures.
Indeed, the latter sort of research is already underway and has made substantial progress. Some primary loci of working-memory stores in the brain have been identified through single-cell recording (e.g., Goldman-RaMc, 1987; Miller, & Desimone, 1991) and brain imaging (e.g., Awh, Jonides, Smith, Schumacher, Koeppe, & Katz, 1995; D*Esposito, Detre, Alsop, Shin, Atlas, & Grossman, 1995; Jonides et al., 1993; Paulesu, Frith, & Frackowiak, 1993). Probable cites of executive cognitive processes and the paths of interaction whereby they supervise task processes likewise have been identified through brain imaging (Evans, Lauber, Meyer, Rubinstein, Gmeindl, Junck, & Koeppe, 1996; Lauber, Meyer, Evans, Rubinstein, Gmeindl, Junck, & Koeppe, 1996; Meyer, Evans, Lauber, Rubinstein, Gmeindl, Junck, & Koeppe, 1996; Owen, Doyon, Perrides, Evans, & Gjedde, 1994; Rogers, Baker, Owen, Frith, Dolan, Frackowiak, & Robbins, 1994) as well as event-related brain potential recording (e.g., Dehaene, Posner, & Tucker, 1994; Gehring, Coles, Meyer, & Donchin, 1995; Gehring, Goss, Coles, Meyer, & Donchin, 1993) and functional brain- lesion analysis (e.g., Brown, & Marsden, 1991; Chao, & Knight, 1995; Downes, Sharp, Costall, Sagar, & Howe, 1993; Fimm, Bartl, Zimmerman, & Wallesch, 1994; Kimberg, & Farah, 1993; Milner, 1963; Nelson, 1976; Owen, Roberts, Hodges, Summers, Polkey, & Robbins, 1993; Rubinstein, Evans, & Meyer, 1994; Rubinstein, Evans, & Meyer, 1995; Shallice, 1982; Shallice, & Burgess, 1991). Given empirical results from these studies, neural-network modelers have begun to construct accounts of executive cognitive processes at subsymbolic levels (e.g., Cohen, Dunbar, & McClelland, 1990; Dehaene, & Changeux, 1991; Levine, & Prueitt, 1989). Hopefully such endeavors will continue forward and ultimately incorporate whatever new conceptual insights are provided by our symbolic computational modeling of behavioral data associated with executive cognitive processes and human multiple-task performance.
68

Computational Theory of Human Performance: Part 2 Meyer & Kieras
References
Abrams,R.A.,&Jonides,J. (1988). Programming saccadic eye movements. Journal of Experimental Psychology: Human Perception and Performance, 14,428^43.
Allport, D A. (1993). Attention and control: Have we been asking the wrong questions? A critical review of 25 years. In D. E Meyer & S. Kornblum (Eds.), Attention and performance XIV. Synergies in experimental psychology, artificial intelligence, and cognitive neuroscience (pp. 183-218). Cambridge, MA: M. I. T. Press.
Anderson, J. R. (1976). Language, memory, and thought. Hillsdale, NJ: Lawrence Erlbaum
Anderson, J. R. (1982). Acquisition of cognitive skill. Psychological Review, 89,369-406. Anderson, J. R. (1983). The architecture of cognition. Cambridge, MA: Harvard University Press. Anderson, J. R. (1990). The adaptive character of thought. Hillsdale, NJ: Erlbaum. Anderson, J. R. (1993). Rules of the mind. Hillsdale, NJ: Lawrence Erlbaum. Anderson, S., Damasio, H., Jones, R., & Tranel, D. (1991). Wisconsin Card Sorting Test
performance as a measure of frontal-lobe damage. Journal of Clinical and Experimental Neuropsychology, 13,909-922.
Atkinson, R C, Hernstein, R. J., Lindzey, G., & Luce, R. D. (Eds.). (1988). Steven's handbook of experimental Psychology (Second Edition). New York: John Wiley.
Awh, E, Jonides, J., Smith, E. E, Schumacher, E H., Koeppe, R., & Katz, S. (1995). Dissociation of storage and rehearsal in verbal working memory: Evidence from PET. Psychological Science.
Baddeley, A. D. (1986). Working memory. Oxford: Oxford University Press. Baddeley,A.D.,&Hitch,G.J. (1974). Working memory. In G. Bower (Ed.), Recent advances in
learning and motivation, Vol. VUI (pp. 47-90). New York: Academic Press. Baddeley, A. D., & Lieberman, K. (1980). Spatial working memory. In R. Nickerson (Ed.),
Attention and performance VIII (pp. 521-539). Hillsdale, NJ: Lawrence Erlbaum Associates. Ballas J A Heitmeyer, C. L., & Perez, M. A. (1992). Direct manipulation and intermittent
automation in advanced cockpits. Technical Report NRL/FR/5534-92-9375. Naval Research Laboratory, Washington, D. C.
Bertelson,P. (1966). Central intermittency 20 years later. Quarterly Journal of Experimental Psychology, 18,153-164. ry
Boff, K. R., Kaufman, L., & Thomas, J. P. (Eds.). (1986). Handbook of perception and human performance. New York: John Wiley.
Borger, R. (1963). The refractory period and serial choice reactions. Quarterly Journal of Experimental Psychology, 15,1-12.
Bovair S., & Kieras, D. E (1991). Toward a model of acquiring procedures from text InR.Barr, M. L. Kamil, P. Mosenthal, & P. D. Pearson (Eds.), Handbook of Reading Research (Vol. II, pp. 206-229). White Plains, NY: Longman.
Bovair, S., Kieras, D. E, & Poison, P. G. (1990). The acquisition and performance of text editing skill: A cognitive complexity analysis. Human-Computer Interaction, 5,1-48.
Brickner, M., & Gopher, D. (1981, February). Improving time-sharing performance by enhancing voluntary control on processing resources. Technical Report AFOSR-77-3131C. Technion - Israel Institute of Technology, Haifa, Israel.
Broadbent, D. E (1993). A word before leaving. In D. E Meyer & S. Kornblum (Eds.), Attention and performance XTV. Synergies in experimental psychology, artificial intelligence, and cognitive neuroscience (pp. 863-879). Cambridge, MA: M. I. T. Press.
Brown, R, & Marsden, C. (1991). Dual task performance and processing resources in normal subjects and patients with Parkinson's disease. Brain, 114,215-231.
Card, S. K., Moran, T. P., & NeweU, A. (1983). The psychology of human-computer interaction. Hillsdale, NJ: Lawrence Erlbaum Associates.
Carpenter, P. A., & Just, M. A. (1989). The role of working memory in language comprehension. In D. klahr & K. Kotovsky (Eds.), Complex information processing: The impact of Herbert A. Simon (pp. 31-68). Hillsdale, NJ: Lawrence Erlbaum Associates.
69
Computational Theory of Human Performance: Part 2 Meyer & Kieras
Carpenter, P. A., Just, M. A., & Shell, P. (1990). What one intelligence test measures: A theoretical account of the processing in the Raven Progressive Matrices Test Psychological Review, 97, 404-431.
Chao, L., & Knight, R. (1995). Human prefrontal lesions increase distractability to irrelevant sensory inputs. NeuroReport, 6,1605-1610.
Chase, W. G., & Ericsson, K. A. (1982). Skill and working memory. In G. H. Bower (Ed.), The psychology of learning and motivation (Vol. 16, pp. 1-58). New York: Academic Press.
Chubb, G. P. (1981). SAINT, a digital simulation language for the study of manned systems. In J. Moraal & K. F. Kraas (Eds.), Manned system design (pp. 153-179). New York: Plenum.
Cohen, J. D., Dunbar, K., & McClelland, J. L. (1990). On the control of automatic processes: A parallel distributed processing account of the Stroop effect Psychological Review, 97, 332-361.
Coles, M. G. H. (1989). Modern mind-brain reading: Psychophysiology, physiology, and cognition. Psychophysiology, 26,251-269.
Covrigaru, A, & Kieras, D. E. (1987). PPS: A parsimonious production system (Tech. Rep. No. 26). (TR-87/ONR-26). Ann Arbor University of Michigan, Technical Communication Program.
D'Esposito, M., Detre, J., Alsop, D., Shin, R, Atlas, S., & Grossman, M. (1995). The neural basis of the central executive system of working memory. Nature, 378,279-281.
Damos, D. L. (1991). Multiple-task performance. London: Taylor & Francis. Daneman, M., & Carpenter, P. A. (1980). Individual differences in working memory and reading.
Journal of Verbal Learning and Verbal Behavior, 19,450-466. Davis, R. (1959). The role of "attention" in the psychological refractory period. Quarterly Journal
of Experimental Psychology, 11,211-220. Dehaene, S. (1993). Temporal oscillations in human perception. Psychological Science, 4,264-
270. Dehaene, S., & Changeux, J.-P. (1991). The Wisconsin card sorting test: Theoretical analysis and
modeling in a neural network. Cerebral Cortex, 1, 62-79. Dehaene, S., Posner, M. I., & Tucker, D. M. (1994). Localization of a neural system for error
detection and compensation. Psychological Science, 5, 303-306. De Jong, R. (1993). Multiple bottlenecks in overlapping task performance. Journal of
Experimental Psychology: Human Perception and Performance, 19,965-980. Dickman, S. J., & Meyer, D. E (1987). Impulsivity and speed-accuracy tradeoffs in information
processing. Journal of Personality and Social Psychology, 54,274-290. Downes, J., Sharp, H., Costall, B., Sagar, J., & Howe, J. (1993). Alternating fluency in Parkinson's
disease. Brain, 116, 887-902. Duncan, J. (1986). Disorganization of behaviour after frontal lobe damage. Cognitive
Neuropsychology, 3,271-290. Engel, A. K., König, P, Kreiter, A. K., & Singer, W. (1991). Interhemispheric synchronization of
oscillatory neuronal responses in cat visual cortex. Science, 252,1177-1179. Evans, J. E., Lauber, E J., Meyer, D. E., Rubinstein, J., Gmeindl, L., Junck, L., & Koeppe, R A.
(1996, November). Brain areas involved in the executive control of task switching as revealed by PET. Paper presented at the meeting of the Society for Neuroscience, Washington, DC.
Eysenck, S., & Eysenck, H. (1977). The place of impulsiveness in a dimensional system of personality description. British Journal of Personality and Clinical Psychology, 16,57-68.
Fimm, B., Bartl, G., Zimmerman, P., & Wallesch, C. (1994). Different mechanisms underlie shifting set on external and internal cues in Parkinson's disease. Brain and Cognition, 25,287- 304.
Fischer, B., & Ramsberger, E. (1984). Human express saccades: Extremely short reaction times of goal directed eye movements. Experimental Brain Research, 57,191-195.
Fischer, B., & Ramsberger, R (1986). Human express-saccades: Effects of randomization and daily practice. Experimental Brain Research, 64,569-578.
Fitts, P. M. (1964). Perceptual-motor skill learning. In A. W. Melton (Ed), Categories of human learning. New York Academic Press.
Fraisse, P. (1957). La periode refractaire psychologique. Annee Psychologique, 57, 315-328.
70

Computational Theory of Human Performance: Part 2 Meyer & Kieras
Friedman, A., & Poison, M. C. (1981). Hemispheres as independent resource systems: limited- capacity processing and cerebral specialization. Journal of Experimental Psychology: Human Perception and Performance, 7,1031-1058.
Friedman, A., Poison, M. C, Gaskill, S. J., & Dafoe, C. G. (1982). Competition for left hemisphere resources: Right hemisphere superiority at abstract verbal information processing. Journal of Experimental Psychology: Human Perception and Performance, 7,1031-1051.
Gazzaniga, M. S. (1970). The bisected brain. New York: Appleton. Gehring, W. J., Coles, M. G. H., Meyer, D. E., & Donchin, E. (1995). A brain potential
manifestation of error-related processing. In G. Karmos, M. Molnar, V. Csepe, I. Czigler, & J. E. Desmedt (Eds.), Perspectives of event-related potentials research (pp. 261-272). New York: Elsevier Science.
Gehring, W. J., Goss, B., Coles, M. G. H., Meyer, D. E., & Donchin, E. (1993). A neural system for error-detection and compensation. Psychological Science, 4,385-390.
Gilhooly,K.J.,Logie,R.H.,Wetherick,N.E,&Wynn,V. (1993). Working memory and strategies in syllogistic-reasoning tasks. Memory & Cognition, 21,115-124.
Goldman-Rakic, P. S. (1987). Circuitry of primate prefrontal cortex and regulation of behavior by representational knowledge. In F. Plum & V. Mountcastle (Eds.), Handbook of Physiology (Vol. 5, pp. 373-417). Bethesda, MD: American Physiological Society.
Gopher, D. (1993). Attentional control: Acquisition and execution of attentional strategies. InD. E. Meyer & S. Komblum (Eds.), Attention and performance XTV. Synergies in experimental psychology, artificial intelligence, and cognitive neuroscience (299-322). Cambridge, MA: M. I. T. Press.
Gopher, D., Brickner, M., & Navon, D. (1982). Different difficulty manipulations interact differently with task emphasis: Evidence for multiple resources. Journal of Experimental Psychology: Human Perception and Performance, 8,146-157.
Gopher, D., & Donchin, E (1986). Workload: An examination of the concept In K. R. Boff, L. Kaufman, & J. P. Thomas (Eds). Handbook of perception and human performance, Volume II, Cognitive processes and performance (pp. 41.1-41.49). New York: Wiley.
Gottsdanker, R., & Stelmach, G. E. (1971). The persistence of the psychological refractoriness. Journal of Motor Behavior, 3, 301-312.
Gray, W. D., John, B. E., & Atwood, M. E. (1993). Project Ernestine: Validating a GOMS analysis for predicting and explaining real-world task performance. Human-Computer Interaction, 8, 237-309.
Green, D. M., & Swets, J. A. (1966). Signal detection theory andpsychophysics. New York- Wiley.
Greenwald, A. G., & Shulman, H. (1973). On doing two things at once U: Elimination of the psychological refractory period. Journal of Experimental Psychology, 101,70-76.
Guitton, D., Buchtel, H. A., & Douglas, R. M. (1985). Frontal lobe lesions in man cause difficulties in suppressing reflexive glances and in generating goal-directed saccades. Experimental Brain Research, 58,455-472.
Hasbroucq, T., & Guiard, Y. (1991). Stimulus-response compatibility effects and the Simon effect: Toward a conceptual clarification. Journal of Experimental Psychology. Human Perception and Performance, 17,246-266.
Hawkins, H. L., Rodriguez, E, & Reicher, G. M. (1979). Is time-sharing a general ability? ONR Technical Report No. 3, University of Oregon, Eugene, OR.
Hedge, A., & Marsh, N. W. (1975). The effect of irrelevant spatial correspondences on two-choice response-time. Acta Psychologica, 39,427-439.
Heilige, J. B., Cox, P. J., & Litvac, L. (1979). Information processing in the cerebral hemispheres: Selective hemispheric activation and capacity limitations. Journal of Experimental Psychology: General, 108,251-279.
Herrik, A., Rafal, R., & Rhodes, D. (1994). Endogenously generated and visually guided saccades after lesions of the human frontal eye fields. Journal of Cognitive Neuroscience, in press.
Hunt, E, & Lansman, M. (1986). A unified model of attention and problem solving. Psychological Review, 93,446-461.
71

Computational Theory of Human Performance: Part 2 Meyer & Kieras
Ivry, R. B., Franz, E A., Kingstone, A., & Johnston, J. C. (1994, November). The PRP effect in a split-brain patient: Response uncoupling despite normal interference. Paper presented at the meeting of the Psychonomic Society, St Louis, MO.
Ivry, R. B., Franz, E. A., Kingstone, A., & Johnston, J. C. (1996). The PRP effect following callosotomy: Residual interference despite uncoupling oflateralized response codes. Manuscript submitted for publication.
John, B. E. (1988). Contributions to engineering models of human-computer interaction. Unpublished doctoral dissertation, Carnegie-Mellon University, Pittsburgh, PA.
John, B. E. (1990). Extensions of GOMS analyses to expert performance requiring perception of dynamic visual and auditory information. kiProceedingsof CHI 1990 (pp. 107-115). New York: Association of Computing Machinery.
John, B. E., Vera, A. H. & Newell, A. (1994) Toward real-time GOMS: A model of expert behavior in a highly interactive task Behavior and Information Technology, vol 13, no. 4, pp. 255-267.
Jokeit,H. (1990). Analysis of periodicities in human reaction times. Naturwissenschaften, 77,289- 291.
Jonides, J., Smith, E. E., Koeppe, R. A., Awh, E., Minoshima, S., & Mintun, M. A. (1993). Spatial working memory in humans as revealed by PET. Nature, 363,623-625.
Just, M. A., & Carpenter, P. A. (1994). Spatial working memory: Cognitive capacity in mental rotation. Manuscript submitted for publication.
Just, M. A., Carpenter, P. A., & Hemphill, D. D. (1994). Constraints on processing capacity: Architectural or implementational? In D. Steier & T. Mitchell (Eds.), Mind matters: A tribute to Allen Newell, in press.
Kahneman,D. (1973). Attention and effort. Englewood Cliffs, NJ: Prentice-Hall. Kantowitz, B. H. (1974). Double stimulation. In B. H. Kantowitz (Ed.),Human information
processing: Tutorials in performance and cognition (pp. 83-131). Hillsdale, NJ: Erlbaum. Kay, H., & Weiss, A. D. (1961). Relationship between simple and serial reaction time. Nature,
191, 790-791. Keele, S. W. (1973). Attention and human performance. Pacific Palisades, C A: Goodyear. Keele, S. W., & Neill, W. T. (1978). Mechanisms of attention. In E. C. Carterette & M. P.
Friedman (Eds.), Handbook of perception (pp. 3-47). London: Academic Press. Kieras, D. E., & Meyer, D. E. (1995). Predicting human performance in dual-task tracking and
decision making with computational models using the EPIC architecture. In D. S. Alberts, D. Buede, T. Clark, R. Hayes, J. Hofmann, W. Round, S. Starr, & W. Vaughan (Eds.), Proceedings of The International Symposium on Command and Control Research and Technology (pp. 314- 325). Washington, DC: National Defense University, 1995.
Kieras, D. E., & Meyer, D. E. (1997). An overview of the EPIC architecture for cognition and performance with application to human-computer interaction. Human-Computer Interaction, in press.
Kieras, D. E., Wood, S. D., & Meyer, D. E. (1995). Predictive engineering models using the EPIC architecture for a high-performance task. In I. R. Katz, R. Mack, L. Marks, M. B. Rossan, & J. Nielsen (Eds.), Proceedings of The CHI'95 Conference on Human Factors in Computing Systems (pp. 11-18). New York: Association of Computing Machinery.
Kieras, D. E., Wood, S. D., & Meyer, D. E (1997). Predictive engineering models based on the EPIC architecture for a multimodal high-performance human-computer interaction task Transactions on Computer-Human Interaction, in press.
Kimberg, D. Y., & Farah, M. J. (1993). A unified account of cognitive impairments following frontal lobe damage: The role of working memory in complex organized behavior. Journal of Experimental Psychology: General, 122,411-428.
Kinsbourne, M., & Hicks, R. (1978). Functional cerebral space: A model for overflow, transfer, and interference effects in human performance. In J. Requin (Ed.), Attention and performance VII (pp. 345-362). Hillsdale, NJ: Lawrence Erlbaum.
Klimesch, W. (1995). Memory processes described as brain oscillations in the EEG-alpha and theta bands. Brain and Behavioral Sciences.
72

Computational Theory of Human Performance: Part 2 Meyer & Kieras
Koch,R. (1993). Die psychologische Refraktärperiode. Doctoral dissertation, University of Bielefeld, Bielefeld, Germany. .
Koch,R. (1994, December). Hick's Law and the psychological refractory period. Paper presented at the KNAW Symposium on Discrete versus Continuous Information Processing, Amsterdam, The Netherlands. ,,.,„. «,,«-,,
Krantz D.H. (1969). Threshold theories of signal detection. Psychological Review, 76,308-324. Kyllonen, P. C, & Christal, R. E. (1990). Reasoning ability is (little more than) working-memory
capacity?! Intelligence, 14,389-433. Laird, L E., Newell, A., & Rosenbloom, P. S. (1987). SOAR: An architecture for general
intelligence. Artificial Intelligence, 33,1-64. Lane, N. E., Strieb, M. I., Glenn, F. A., & Wherry, R. J. (1981). The human operator simulator An
overview. In J. Moraal & K. F. Kraas (Eds.). Manned system design (pp. 121-152). New York:
Lauber, E. i., Meyer, D. E., Evans, J. E., Rubinstein, J., Gmeindl, L., Junck, L., & Koeppe, R. A (1996, June). The brain areas involved in the executive control of task switching as revealed by PET. 'Paper presented at the Second International Conference on Functional Mapping of the Human Brain, Boston, MA. . . , , -.,
Leichnetz, G. R. (1981). The prefrontal cortico-oculomotor trajectories m the monkey: A possible explanation for the effects of stimulation/lesion experiments on eye movements. Journal of Neurological Sciences, 49,3S7.
Levine, D. S., & Prueitt, P. S. (1989). Modeling some effects of frontal lobe damage: Novelty and pereeveration. Neural Networks, 2,103-116. .
Liederman, J. (1986). Subtraction in addition to addition: Dual-task performance improves when tasks are presented to separate hemispheres. Journal of Clinical and Experimental Neuropsychology, 8,486-502. . .
Lisman, J. R, & Idiart, M. A. P. (1995). Storage of 7 ± 2 short-term memories m oscillatory subcycles. Science, 267,1512-1515. .
Logan G (1985). Executive control of thought and action. Acta Psychologies 60,193-210. Luce, R. D. (1963). Detection and recognition. In R. D. Luce, R R. Bush, & E. Galanter (Eds.),
Handbook of mathematical psychology, Vol. 1. New York: Wiley. Marr, D. (1982). Vision San Francisco: Freeman. . McCann, R. S., & Johnston, J. C. (1992). Locus of the single-channel bottleneck in dual-task
performance. Journal of Experimental Psychology: Human Perception and Performance, 18, 471-484.
McLeocLP.D. (1977). A dual task response modality effect: Support for multiprocessor models of attention. Quarterly Journal of Experimental Psychology, 29,651-667.
McLeod, P. D., & Hume, M. (1994). Overlapping mental operations in serial performance with preview: Typing. A reply to Pashler. Quarterly Journal of Experimental Psychology, 47A, 193- 199.
Meyer, D. E., Evans, J. E., Lauber, E. J., Rubinstein, J., Gmeindl, L., Junck, L., & Koeppe, R. A. (1996). Activation of brain mechanisms for executive mental processes in cognitive task switching. Manuscript submitted for publication.
Meyer, D. E., Irwin, D. E., Osman, A. M., & Kounios, J. (1988). The dynamics of cognition and action: Mental processes inferred from speed-accuracy decomposition. Psychological Review, 95 183-237
Meyer D. E., & Kieras, D. E. (1992, November). The PRP effect: Central bottleneck, perceptual- motor limitations, or task strategies! Paper presented at the meeting of the Psychonomic Society, St Louis, MO. .
Meyer, D. E., & Kieras, D. E. (1994, June). EPIC computational models of psychological refractory-period effects in human multiple-task performance. EPIC Report No. 2 (TR-94/ONR- EPIC-2), University of Michigan, Ann Arbor.
Meyer D. E., & Kieras, D. E. (1996, November). EPIC - Adaptive executive control of human multiple-task performance. Paper presented at the meeting of the Psychonomic Society, Chicago, IL.
73

Computational Theory of Human Performance: Part 2 Meyer & Kieras
Meyer, D. E., & Kieras, D. E. (1997a). A computational theory of executive cognitive processes and multiple-task performance: Part 1. Basic mechanisms. Psychological Review, in press.
Meyer, D. E., & Kieras, D. E. (1997b). A computational theory of executive cognitive processes and multiple-task performance: Part 2. Accounts of psychological refractory-period phenomena. Psychological Review, in press.
Meyer, D. E., Kieras, D. E, Lauber, E, Schumacher, E, Glass, J., Zurbriggen, E, Gmeindl, L., & Apfelblat, D. (1995). Adaptive executive control: Flexible multiple-task performance without pervasive immutable response-selection bottlenecks. Acta Psychologica, 90,163-190.
Meyer, D. E, & Komblum, S. (Eds.). (1993). Attention and performance XIV. Synergies in experimental psychology, artificial intelligence, and cognitive neuroscience. Cambridge, MA: M. I. T. Press.
Miller, E K., & Desimone, R. (1991). A neural mechanism for working and recognition memory in inferior temporal cortex. Science, 254,1377-1379.
Milner, B. (1963). Effects of different brain lesions on card sorting. Archives of Neurology, 9,90- 100.
Moray, N. (1967). Where is capacity limited? A survey and a model. Acta Psychologica, 27,84- 92.
Moray, N. (1979). Mental workload: Its theory and application. New York: Plenum. Neisser, U. (1967). Cognitive psychology. Englewood Cliffs, NJ: Prentice Hall. Nelson, H. E. (1976). A modified card sorting test sensitive to frontal lobe defects. Cortex, 12,
313-324. Newell, A. (1973). You can't play 20 questions with nature and win. In W. G. Chase (Ed.), Visual
information processing (pp. 283-308). New York: Academic Press. Newell, A. (1990). Unified theories of cognition. Cambridge, MA: Harvard University Press. Nickerson, R. S. (1965). Response time to the second of two successive signals as a function of
absolute and relative duration of intersignal interval. Perceptual and Motor Skills, 21, 3-10. Norman, D. A. & Shallice, T. (1986). Attention to action: Willed and automatic control of
behavior. In R. J. Davidson, G. E. Schwartz, & D. Shapiro (Eds.), Consciousness and self- regulation (Vol. 4, pp. 1-18). New York: Plenum Press.
North, R. (1977, January). Task components and demands as factors in dual-task performance. Report No. ARL-77-2/AFOSE-77-2. University of Illinois, Urbana, EL.
O'Donnell, R. D., & Eggemeier, F. T. (1986). Workload assessment methodology. In K. R. Boff, L. Kaufman, & J. P Thomas (Eds.). Handbook of perception and human performance, Volume II, Cognitive processes and performance (pp. 42.1- 42.49). New York: Wiley.
Owen, A. M., Roberts, A., Hodges, J., Summers, B., Polkey, C, & Robbins, T. (1993). Contrasting mechanisms of impaired attentional set-shifting in patients with frontal lobe damage or Parkinson's disease. Brain, 116,1159-1175.
Osman, A. M., & Moore, C. M. (1993). The locus of dual-task interference: Psychological refractory effects on movement-related brain potentials. Journal of Experimental Psychology: Human Perception and Performance, 19,1292-1312.
Owen, A. M., Doyon, J., Petrides, M., Evans, A. C, & Gjedde, A. (1994). The neural mediation of high level planning examined using positron emission tomography (PET). Society for Neurosciences Abstracts, 20,353.
Pashler, H. (1984). Processing stages in overlapping tasks: Evidence for a central bottleneck. Journal of Experimental Psychology: Human Perception and Performance, 10,358-377.
Pashler, H. (1990). Do response modality effects support multiprocessor models of divided attention? Journal of Experimental Psychology: Human Perception and Performance, 16, 826- 842.
Pashler, H. (1993). Dual-task interference and elementary mental mechanisms. In D.E. Meyer & S. Komblum (Eds.), Attention and performance XIV. Synergies in experimental psychology, artificial intelligence, and cognitive neuroscience (pp. 245-264). Cambridge, MA: M. I. T. Press.
Pashler, H. (1994a). Dual-task interference in simple tasks: Data and theory. Psychological Bulletin, 116, 220-244.
74

Computational Theory of Human Performance: Part 2 Meyer & Kieras
Pashler,H. (1994b). Overlapping mental operations in serial performance with preview. Quarterly Journal of Experimental Psychology, 47A, 161-191.
Pashler,H. (1994c). Graded capacity-sharing in dual-task interference. Journal of Experimental Psychology: Human Perception and Performance, 20,330-342.
Pashler, H., & Johnston, J. C. (1989). Chronometrie evidence of central postponement in temporally overlapping tasks. Quarterly Journal of Experimental Psychology, 41 A, 19-45.
Pashler, H., Luck, S. J., Hillyard, S. A., Mangun, G. R., O'Brien, S., & Gazzaniga, M. S. (1994). Sequential operation of the disconnected cerebral hemispheres in "split-brain" patients. Neuroreport, 5,2381-2384. ,,,_.,_
Pashler, H., & O'Brien, S. (1993). Dual-task interference and the cerebral hemispheres. Journal of Experimental Psychology: Human Perception and Performance, 19,315-330.
Paulesu, E., Frith, C. D., & Frackowiak, R. S. J. (1993). The neural correlates of the verbal component of working memory. Nature, 362, 342-344.
Posner, M. I. (Ed.). (1989). Foundations of cognitive science (pp. 631-682). Cambridge, MA: M. I. T.Press. a .- . , . .
Rafal, R., Henik, A., & Smith, J. (1991). Extrageniculate contributions to reflexive visual orienting in'normal humans: A temporal hemifield advantage. Journal of Cognitive Neuroscience, 3,323- 329
Reuter-Lorenz, P. A., Hughes, H. C, & Fendrich, R. (1991). The reduction of saccadic latency by prior offset of the fixation point: An analysis of the gap effect Perception & Psychophysics, 49, 167-175. . ^. . c
Reynolds, D. (1964). Effects of double stimulation: Temporary inhibition of response. Psychological Bulletin, 62,333-347.
Rogers, R. D., Baker, S. C, Owen, A. M., Frith, C. D., Dolan, R. J., Frackowiak, S. J., & Robbms, T. W. (1994). Frontal and parietal activations in a test of planning: A PET study with the Tower of London. Society for Neurosciences Abstracts, 20,353.
Rosenbaum, D. A. (1980). Human movement initiation: Specification of arm, direction, and extent Journal of Experimental Psychology: General, 109,475-495.
Rubinstein, J. S., Evans, J., & Meyer, D. E. (1994, March). Task switching in patients with prefrontal cortex damage. Poster presented at the meeting of the Cognitive Neuroscience Society, San Francisco, CA. .
Rubinstein, J. S., Evans, J., & Meyer, D. E. (1995, February). Task switching in patients with prefrontal and parietal cortex damage. Paper presented at the meeting of the International Neuropsychology Society, Seattle, WA. .
Ruthruff, E., Pashler, H., & Klaasen, A. (1995, November). Preparation and strategy in dual-task interference. Poster presented at the meeting of the Psychonomic Society, Los Angeles, CA.
Ruthruff, E., Pashler, H., & Klaasen, A. (1996). Processing bottlenecks in dual-task performance: Structural limitation or strategic postponement? Manuscript submitted for publication.
Sanders, A. F. (1964). Selective strategies in the assimilation of successively presented signals. Quarterly Journal of Experimental Psychology, id, 368-372.
Sanders, A. F. (1980). Stage analysis of reaction processes. In G. E. Stelmach & J. Requin (Eds.), Tutorials in motor behavior (pp. 331-354). Amsterdam: North-Holland.
Schiller, P. H., Sandell, J. H, & Maunsell, J. H. R. (1987). The effect of frontal eye field and superior colliculus lesions on saccadic latencies in the rhesus monkey. Journal of Neurophysiology, 57,1033-1049.
Schumacher, E. H., Glass, J., Lauber, E. J., Gmeindl, L., Woodside, B. J., Kieras, D. E., & Meyer, D. E. (1996, November). Concurrent response-selection processes in multiple-task performance. Poster presented at the meeting of the Psychonomic Society, Chicago, IL.
Shallice,T. (1972). Dual functions of consciousness. Psychological Review, 79,383-393. Shallice,T. (1982). Specific impairments of planning. Philosophical Transactions of the Royal
Society London, B298,199-209. . Shallice, T., & Burgess, P. W. (1991). Deficits in strategy application following frontal lobe
damage in man. Brain, 114,727-741.
75
Computational Theory of Human Performance: Part 2 Meyer & Kieras
Simon, J. R., Acosta, E., Mewaldt, S. P., & Spiedel, C. R. (1976). The effect of an irrelevant directional cue on choice reaction time: Duration of the phenomena and its relation to stages of processing. Perception & Psychophysics, 19,16-22.
Smith, M. C. (1967). Theories of the psychological refractory period. Psychological Bulletin, 67, 202-213.
Sperry, R. W. (1968). Hemispheric disconnection and unity in conscious awareness. American Psychologist, 23,723-733.
Sternberg, S. (1969). On the discovery of processing stages: Some extensions of Donders'method. Acta Psychologica, 30, 276-315.
Tanner, W. P., Jr., &Swets, J. A. (1954). A decision-making theory of visual detection. Psychological Review, 61,401-409.
Telford, C. W. (1931). The refractory phase of voluntary and associative response. Journal of Experimental Psychology, 14,1-35.
Van Seist, M., & Johnston, J. (1996, November). The role of response processing in the single- channel PRP bottleneck. Paper presented at the meeting of the Psychonomic Society, Chicago, IL.
Van Seist, M., & Jolicoeur, P. (1993, November). A response-selection account of the effect of number of alternatives on dual-task processing. Paper presented at the meeting of the Psychonomic Society, Washington, D.C.
von der Malsburg, C, & Schneider, W. (1986). A neural cocktail-party processor. Biological Cybernetics, 54,29-40.
Welford, A. T. (1952). The "psychological refractory period" and the liming of high speed performance - A review and a theory. British Journal of Psychology, 43,2-19.
Welford, A. T. (1959). Evidence of a single-channel decision mechanism limiting performance in a serial reaction task. Quarterly Journal of Experimental Psychology, 2, 193-210.
Welford, A. T. (1967). Single channel operation in the brain. Acta Psychologica, 27,5-22. Welford, AT. (1980). The single-channel hypothesis. In A. T. Welford (Ed.), Reaction time (pp.
215-252). San Diego, CA: Academic Press. Wickens, C. D. (1976). The effect of divided attention on information processing in manual
tracking. Journal of Experimental Psychology: Human Perception and Performance, 2,1-13. Wickens, C. D. (1984). Processing resources in attention. In R. Parasuraman, J. Beatty, & R.
Davies (Eds.), Varieties of attention (pp. 63-101). New York John Wiley & Sons. Wickens, CD. (1991). Engineering psychology and human performance (Second Edition). New
York: Harper Collins. Wierwille, W. W., & Connor, S. A. (1983). Evaluation of 20 workload measures using a
psychomotor task in a moving-base aircraft simulator. Human Factors, 25,1-16. Williges, R.C. & Wierwille, W.W. (1979). Behavioral measures of aircrew mental workload.
Human Factors, 21,549-574. Wood, S. D., Kieras, D. E., & Meyer, D. E. (1994). An EPIC model for a high-performance HCI
task. Proceedings of The CHT94 Conference on Human Factors in Computing (pp. 24-28). New York: Association of Computing Machinery.
Yaniv, I., Meyer, D. E., Gordon, P. C, Huff, C. A., & Sevald, C. A. (1990). Vowel similarity, connectionist models, and syllable structure in motor programming of speech. Journal of Memory and Language, 29,1-26.
76

Richard Abrams Psychology Dept. Box 1125 Washington University St. Louis, MO 63130
Phillip L. Ackerman Psychology Dept. University of Minnesota 75 E. River Rd. Minneapolis, MN 55455
Terry Allard Program in Cognitive Neuroscience Office of Naval Research 800 Quincy St. Arlington, VA 22217-5000
Nancy Allen Educational Testing Service Rosedale Rd. Princeton, NJ 08541
Alan Allport Dept. of Experimental Psychology University of Oxford South Parks Road Oxford OX1 3UD, England UK
John Anderson Department of Psychology Carnegie Mellon University 5000 Forbes Ave. Pittsburgh, PA 15213
Nancy S. Anderson Dept. of Psychology University of Maryland College Park, MD 20742
Greg Ashby Dept. of Psychology University of California Santa Barbara, CA 93016
Alan Baddeley MRC Applied Psychology Unit 15 Chaucer Road Cambridge CB2 2EF, England United Kingdom
David Balota Psychology Dept. Washington University St. Louis, MO 63130
Lawrence Barsalou Psychology Dept. University of Chicago 5848 South University Ave. Chicago, IL 60637
Gordon Baylis Dept. of Psychology University of South Carolina Columbia, SC 29208
Shlomo Bentin Dept. of Psychology The Hebrew University Jerusalem 91905 ISRAEL
Ira Bernstein Psychology Dept. University of Texas P.O. Box 19528 Arlington, TX 76019-0528
Paul Bertelson Lab. Psych. Exp. Univ. Lib. Bruxelles 117 Avnue. Ad. Buyl Bruxelles 1050 BELGIUM
Derek Besner Dept. of Psychology University of Waterloo Waterloo, ON N2L 3G1 Canada
Thomas G. Bever Dept. of Linguistics Douglas Hall University of Arizona Tucson, AZ 85721
Irving Biederman Psychology Dept. Hedco Neuroscience Bldg. University of Southern CA Los Angeles, CA 90089-2520
Gautam Biswas Dept. of Computer Science Vanderbuilt University Box 1688 Station B Nashville, TN 37235
Robert A. Bjork Dept. of Psychology University of California Los Angeles, CA 90024
Anne M. Bonnel CNRS Lab. Neurosciences Cog. 31, Chemin Joseph Aiguier Marseilles 13402, CDX. 2 France
Walter Borman Dept. of Research Personnel Decisions Research Institutes Inc. 43 Main St. SE Suite 405 Minneapolis, MN 55414
H. Bouma Institute for Perception Research P.O. Box 513 5600 Eindhoven THE NETHERLANDS
Bruce Bridgeman Psychology Dept. KerrHall University of California Santa Cruz, CA 95064
Claus Bundesen Psychology Laboratory Copenhagen University Njalsgade 90 DK-2300 Copenhagen S. DENMARK
Bruce Britton Center for Family Research University of Georgia Research Foundation Inc. Ill Barrow Hall Athens, GA 30602-2401
Jerome R. Busemeyer Dept. of Psychology Purdue University West Lafayette, IN 47907
Stuart Card Xerox PARC 3333 Coyote Hill Rd. Palo Alto, CA 94304
Patricia A. Carpenter Dept. of Psychology Carnegie-Mellon University Pittsburgh, PA 15213
Thomas H. Can- Psychology Dept. Psychology Research Building Michigan State University East Lansing, MI 48824
Richard Catrambone School of Psychology GA Institute of Technology Atlanta, GA 30332-0170
Carolyn Cave Dept. of Psychology Vanderbilt University Nashville, TN 37240
Kyle R. Cave Psychology Dept. Vanderbilt University Nashville, TN 37240

Susan Chipman Office of Naval Research ONR 342 CS 800 North Quincy St. Washington, DC 22217-5660
Jonathan Cohen Psychology Dept. Carnegie-Mellon University Pittsburgh, PA 15213
Marvin Cohen Cognitive Technologies Inc. 4200 Lorcom Lane Arlington, VA 22207
Michael Coles Psychology Dept. University of Illinois 603 E. Daniel Champaign, IL 61820
Charles E. Collyer Dept. of Psychology University of Rhode Island Kingston, RI 02881
Hans Colonius Univ. 01denburg/FB5, Inst. Fur Kognitionsforschung, P.O. Box 2503 Oldenburg D-26111 GERMANY
Max Coltheart School of Behavioural Science MacQuarie University Sydney NSW 2109 AUSTRALIA
Albert Corbett Dept. of Psychology Carnegie Mellon University 5000 Forbes Ave. Pittsburgh, PA 15213
Nelson Cowan Psychology Dept. 210 McAlester Hall University of Missouri Columbia, MO 65211
James Cowie Computing Research Lab New Mexico State University Box 3001 Department 3CRL Las Cruces, NM 88003-8001
F.I.M. Craik Dept. of Psychology University of Toronto Toronto, ON M5S 1A1 CANADA
Tim Curran Dept. of Psychology Case Western University 10900 Euclid Ave. Cleveland, OH 44106-7123
James E. Cutting Dept. of Psychology Uris Hall Cornell University Ithaca, NY 14853-7601
Antonio Damasio Dept. of Neurology University of Iowa Hospital & Clinics, NO 2007RCP 200 Hawkins Dr. Iowa City, IA 52242-1053
Diane Damos Dept. of Human Factors University of Southern CA, Los Angeles University Park Los Angeles, CA 90089-0021
Erik De Corte Katholieke Universiteit Tiensestraat 102B Leuven, 3000 BELGIUM
Michael Dehaemer International Technology Institute Loyola College of Maryland 4501 N. Charles St. Baltimore, MD 21210-2699
Stephen Delia Pietra IBM Watson Research Center Room J2 H24 PO Box 704 Yorktown Heights, NY 10598
Gary S. Dell Beckman Institute University of Illinois 405 North Mathews Urbana, IL 61801
Emanual Donchin Dept. of Psychology Universtiy of IL 603 E. Daniel St. Champaign, IL 61820
Sharon Derry Educational Psychology University of Wisconsin 1025 W. Johnson St. Rm. 1065 Madison, WI 53706
David Diamond Dept. of Pharmacolgy VA Medical Center 1055 Clermont St. Box C236 Denver, CO 80220
Barbara A. Dosher Cognitive Psychology Social Science Tower University of California Irvine, CA 92717
Jonathon Stevens Driver Experimental Psychology University of Cambridge Downing St. Cambridge CB2 3EB, England UK
David Dubois Psychological Systems and Research Inc. 1975 Willow Ridge Circle Kent, OH 44240
Kevin Dunbar Dept. of Psychology McGill University Montreal, Quebec H3A 1B1 CANADA
John Duncan MRC Applied Psychology Unit 15 Chaucer Rd. Cambridge CB2 2EF, England UK
Howard Egeth Dept. of Psychology Johns Hopkins University Baltimore, MD 21218
Howard Eichenbaum Center for Behavioral Neuroscience SUNY at Stony Brook W 5510 Melville Library Stony Brook, NY 11794-2575
Steve Ellis Naval Personnel R&D Center Code 133 53335 Ryne Rd. San Diego, CA 92152-7250
Randall Engle School of Psychology Georgia Institute of Tech. Atlanta, GA 30332-0170

W. K. Estes Dept. of Psychology William James Hall Harvard University Cambridge, MA 02138
Martha Evens IL Institute of Technology Amour College of Engineering and Science Chicago, IL 60616-3793
Martha J. Farah Psychology Dept. University of Pennsylvania 3815 Walnut St. Philadelphia, PA 19104-6169
Ira Fischler Dept. of Psychology University of Florida Gainesville, FL 32611
Donald Lloyd Fisher 117 Amity St. Amherst, MA 01002
Jimmy Fleming Air Force Armstrong Lab AL/HRPI Bldg 578 7909 Lindberg Dr. Brooks Air Force Base, TX 78235-5352
John H. Flowers Psychology Dept. 209 Burnett University of Nebraska Lincoln, NE 68588-0308
Charles L. Folk Psychology Dept. Villanova University Villanova, PA 19085
Kenneth Ford Istitute for Human and Machine Cognition The University of West Florida 11000 University Parkway Pensacola, FL 32514-5750
Peter Fox Ric Image Analysis Facility The University at Texas Health Science Center 7703 Floyd Curl Dr. San Antonio, TX 78284-7801
Jennifer Freyd Dept. of Psychology University of Oregon Eugene, OR 97403
John Gabrieli Dept. of Psychology Stanford University Jordan Hall, Bldg. 420 Stanford, CA 94305-2130
C. R. Gallistel Psychology Dept. UCLA 504 Hilgard Ave. Los Angeles, CA 90024-1563
Michael Gazzaniga Program in Cognitive Neuroscience 6162 Silsby Hall Dartmouth College Hanover, NH 03755-3547
Bill Gehring Psychology Dept. University of Michigan 525 E. University Ann Arbor, MI 48109-1109
Dedre Gentner Dept. of Psychology Northwestern University 2029 Sheridan Rd. Evanston, IL 60208-2710
Alan Gevins One Rincon Center Sam Technologies Inc. 101 Spear St. Suite 203 San Francisco, CA 94105
Robert Gibbons Dept. of Psychiatry MC 913 The University of IL at Chicago 912 S. Wood St. Chicago, IL 60612
Mark Gluck Center for Molecular And Beh Neuroscience Rutgers University 197 University Ave. Newark, NJ 07102
Sam Glucksberg Dept. of Psychology Princeton University Princeton, NJ 08544-1010
Paul Gold Dept. of Psychology University of Virginia Gilmer Hall Room 102 Charlottesville, Va 22903
Susan Goldman Learning Tech Center Vanderbilt University Box 45 Peabody Nashville, TN 37203
Pat Goldman Rakic Yale Med School Sec of Nanat C303 SHM Yale University 333 Cedar St. New Haven, CT 06510
Timothy Goldsmith Dept. of Psychology University of New Mexico Logan Hall Albuquerque, NM 87131-1161
Daniel Gopher Industrial Engineering, The Technion Israel Institute of Technology Haifa 3200 ISRAEL
Diana Gordon Naval Research Lab Code 5514 Artificial Intelligence Ctr. 4555 Overlook Ave. SW Washington DC, 20375-5337
Peter Gordon Dept. of Psychology University of North Carolina Chapel Hill, NC 27599
T. Govindaraj CHMSR School of Engineering & Systems Engineering GA Institute of Technology Mail Code 0205 Atlanta, GA 30332-0205
Arthur Graesser Dept. of Psychology Memphis State University Room 202 Memphis, TN 38152-0001
Wayne Gray Dept. of Psychology George Mason University 4400 University Dr. Fairfax, VA 22030-4444
Louise Guthire Computing Research Lab New Mexico State University Box 30001 3CRL Las Cruces, NM 88003

Richard Haier Dept. of Pediatrics and Neurology University of California, Irvine Irvine hall Room 100 Irvine, CA 92717-4275
Bruce Hamill Applied Physics Lab The Johns Hopkins University Ames Hall 227 Laurel, MD 20723-6099
Stewart Harris Imetrix Inc. PO Box 152 1235 Route 28A Cataumet, MA 02534-0152
Harold Hawkins Code 1142 Office of Naval Research 800 Quincy St. Arlington, VA 22217-5000
Herbert Heuer Institut fur Arbeitsphysiologie Ardeystrasse 67 Dortmund D-44 139 GERMANY
Steve Hillyard Dept. of Neuroscience, M008 University of CA, San Diego La Jolla, CA 92093
William Hirst Psychology Dept. New School for Social Research 65 Fifth Ave. New York, NY 10003
James E. Hoffman Dept. of Psychology University of Delaware Newark, DE 19716
Phillip J. Holcomb Dept. of Psychology Tufts University Medford, MA 02156
Keith Holyoak Dept. of Psychology 6613 Franz Hall UCLA Los Angeles, CA 90024
Bernard Hommel Institute for Psychology University of Munich Leopoldstrasse 13 80802 Munich GERMANY
H. Honda Dept. of Behavioral Sciences Faculty of Humanities Niigata University Niigata 950-21 JAPAN
G. W. Humphreys Psychology Dept. University of Birmingham Edgbaston Birmingham B15 2TT, England UK
Earl Hunt Dept. of Psychology University of Washington NI25 Seattle, WA 98195
Daniel Dgen Dept. of Psychology Michigan State University East Lansing, MI 48824
David E. Irwin Psychology Dept. University of Illinois 603 E. Daniel Champaign, IL 61820
Richard Ivry Dept. of Psychology University of California Berkeley, CA 94720
Robert Jacob Dept. of Electical and Computer Science Tufts University 161 College Ave. Medford, MA 02155
Richard Jagacinski Psychology Dept. Ohio State University 142 Towshend Hall 1885 Neil Ave. Columbus, OH 43210
Bonnie John Dept. of Computer Science Carnegie Mellon University 5000 Forbes Ave. Pittsburght, PA 15213-3890
Todd Johnson Dept. of Pathology 385 Dreese Lab The Ohio State University 2015 Neil Ave. Columbus, OH 43210-1277
James C. Johnston MS 262-2 NASA-Ames Research Center Moffett Field, CA 94035
Pierre Jolicoeur Psychology Department University of Watterloo Waterloo, ON N2L 3G1 CANADA
Douglas Jones Thatcher Jones Associates 1280 Woodfern Ct. Toms River, NJ 08755
John Jonides Dept. of Psychology The University of Michigan 525 E. University Ann Arbor, MI 48109-1109
Michael I. Jordan Dept. of Brain/Cognitive Science, E10-034D MIT Cambridge, MA 02139
Marcel Just Dept. of Psychology Carnegie-Mellon University Pittsburgh, PA 15213
Daniel Kahneman Psychology Dept. Princeton University Princeton, NJ 08544-1010
Barry Kantowitz Bauteile Human Affairs Research Center 4000 N.E. 41st St. Seattle, WA 98105
Steven W. Keele Dept. of Psychology University of Oregon Eugene, OR 97403
Beth Ken- Psychology Dept., NI-25 University of Washington Seattle, WA 98195
Raymond Kesner Dept. of Psychology University of Utah Salt Lake City, UT 84112
William Kieckhaefer RGI Inc., Suite 802 3111 Camino Del Rio North San Diego, CA 92108 Peter R. Killeen

Peter R. Killeen Dept. of Psychology Box 871104 Arizona State University Tempe, AZ 85287-1104
Walter Kintsch Psychology Dept. University of Colorado Boulder, CO 80309-0345
Susan Kirschenbaum Naval Undersea Weapons Center Code 2212 Bldg. 1171/1 Newport, RI 02841
Stuart T. Klapp Dept. of Psychology California State University Hayward, CA 94542
Gary Klein Klein Associates Inc. 582 E. Dayton Yellow Springs Rd. Fairbom, OH 45324-3987
Raymond Klein Dept. of Psychology Dalhousie University Halifax, Nova Scotia B3H 4J1 CANADA
David Kleinman Dept. of Electrical and Systems Engineering The University of Connecticut Room 312 U 157 260 Glenbrook Rd. Storrs, CT 06269-3157
Thomas Knight AI Lab, M.I.T. 545 Technology Square Cambridge, MA 02139
Kenneth Koedinger Human Computer Interface Inst. Carnegie Mellon University 5000 Forbes Ave. Pittsburgh, PA 15213-3890
Asher Koriat Dept. of Psychology University of Haifa Haifa, 3199 ISRAEL
Stephen Kosslyn Dept. of Psychology 33 Kirkland St. William James Hall Harvard University Cambridge, MA 02138
Arthur F. Kramer Psychology Dept. University of Illinois 603 E. Daniel Champaign, IL 61820
David Krantz Dept. of Psychology Schermerhorn Hall Columbia University New York, NY 10027
Neal Kroll 3421 Breton Ave. Davis, CA 95616
Michael Kubovy University of Virginia Psychology Dept.,Gilmer Hall Charlottesville, VA 22903-2477
Michael Kuperstein Symbus Tech. Inc., Suite 900 950 Winter St. Waltham, MA 02154
Jack Lancaster Health Science Center The University of Texas 7703 Floyd Curl Dr. San Antonio, TX 78284-7801
T K. Landauer 625 Utica Ave. Boulder, CO 80304
Joseph S. Lappin Dept. of Psychology Vanderbilt University Nashville, TN 37240
Timothy Lee School of Physical Education McMaster University Hamilton, ON L8S 4K1 CANADA
Paul Lehner Dept. of Information Systems George Mason University 4400 University Dr. Fairfax, VA 22030-4444
Alan Lesgold Dept. of Psych and Intel. Syst. University of Pittsburgh 3939 O'Hara St. Pittsburgh, PA 15260
Michael Levine Dept. of Educational Psych. University of IL 809 S. Wright St. Champaign, IL 61820-6219
Alexander Levis Ctr. for Excellence in Command and Control George Mason University 4400 University Dr. Fairfax, VA 22030
Gregory Lockhead Dept. of Psychology Duke University Durham, NC 27706
R. Bowen Loftin Dept. of Computer Science University of Houston 4800 Calhoun Rd. Houston, TX 77204-2163
Geoffrey Loftus Dept. of Psychology NI-25 University of Washington Seattle, WA 98195
Gordon D. Logan Dept. of Psychology University of Illinois 603 E. Daniel Champaign, IL 61820
Jack Loomis Dept. of Psychology University of California Santa Barbara, CA 93106-2050
R. Duncan Luce Institute for Mathematical and Behavioral Sciences Social Sciences Tower University of California Irvine, CA 92717
Stephen J. Lupker Psychology Dept. University of Western Ontario London, Ontario N6A 5C2 CANADA
Donald G. Mackay Dept. of Psychology UCLA Los Angeles, CA 90024-1563
Colin MacKenzie Dept. of Anesthesiology University of MD at Baltimore 22 S. Greene St. Baltimore, MD 21201
Colin M. MacLeod Life Sciences Scarborough Campus University of Toronto Scarborough, Ontario MIC 1A4 CANADA

Scott Makeig Naval Health Research Center P 0 Box 85122, Bldg. 331 San Diego, CA 92186-5122
Sandra Marshall Dept. of Psychology San Diego State University 5250 Campanile Dr. San Diego, CA 92182-1931
Dominic W. Massaro Program in Experimental Psych. Dept. of Psychology University of California Santa Cruz, CA 95064
James L. McClelland Dept. of Psychology Carnegie-Mellon University Pittsburgh, PA 15213
Peter McLeod MRC Applied Psychology Unit 15 Chaucer Road Cambridge CB2 2EF, England UK
Douglas L. Medin Psychology Dept. Northwestern University 2029 Sheridan Rd. Evanston, IL 60208
Jonathan Merril High Techsplanations Inc. 6001 Montrose Rd., Suite 902 Rockville, MD 20852
D. J. K. Mewhort Dept. of Psychology Queens University Kingston, ON CANADA
Joel Michael Dept. of Physiology Rush Medical College 1750 W. Harrison St. Chicago, IL 60612
Ryszard Michalski Center for Artificial Intel. George Mason University 4400 University Dr. Fairfax, VA 22030-4444
George Miller Dept. of Psychology Princeton University Green Hall Princeton, NJ 08544-0001
Robert Mislevy Educational Testing Service Rosedale Rd. Princeton, NJ 08541
Stephen Monsell Dept. of Expt. Psych. Univ. of Cambridge, Downing St. Cambridge CB2 3EB, England UK
Johanna Moore Dept. of Computer Science at MIB University of Pittsburgh 202B Mineral Industries Bldg. Pittsburgh, PA 15260
Ben Morgan Dept. of Psychology University of Central Florida 4000 Central FL Blvd. Orlando, FL 32816-1390
Gilbertus Mulder Institute of Experimental Psych. University of Groningen Grote Kruisstyaat 2/1 9712 TS Groningen THE NETHERLANDS
Bennett B. Murdock Dept. of Psychology University of Toronto Toronto, Ontario ON M5S 1A1 CANADA
Bengt Muthen Graduate School of Education University of CA Los Angeles 405 Hilgard Ave. Los Angeles, CA 90024-1521
David Navon Dept. of Psychology University of Haifa Haifa 3199 ISRAEL
James H. Neely Dept. of Psychology SUNY-Albany Albany, NY 12222
Ulric Neisser Psychology Department Emory University Atlanta, GA 30322
Raymond S. Nickerson 5 Gleason Rd. Bedford, MA 01730
Mary Jo Nissen 5265 Lochloy Drive Edina, MN 55436
Robert Nosofsky Psychology Department Indiana University Bloomington, IN 47405
Stellan Ohlsson Learning R&D Ctr. University of Pittsburgh 3939 O'Hara St. Pittsburgh, PA 15260
John Palmer Dept. of Psychology, NI-25 University of Washington Seattle, WA 98195
Stephen E. Palmer Dept. of Psychology, University of California Berkeley, CA 94720
Harold Pashler Dept. of Psychology, C-009 University of California La Jolla, CA 92093
Karalyn Patterson MRC Applied Psychology Unit 15 Chaucer Rd. Cambridge CB2 UNITED KINGDOM
Richard Pew BBN Laboratories 10 Moulton St. Cambridge, MA 02238
John Polich Neuropharmacology Dept. TPC-10 Scripps Research Institute La Jolla, CA 92037
Alexander Pollatsek Dept. of Psychology University of Massachusetts Amherst, MA 01003
Michael I. Posner Dept. of Psychology University of Oregon Eugene, OR 97403
Wolfgang Prinz Max-Plank-Institute Psychologische Forschung Postfach 44 01 09 München 80750 GERMANY

Robert W. Proctor Psychological Sciences Purdue University 1364 Psychology Building West Lafayette, IN 47907-1364
Roger Ratcliff Psychology Dept. Northwestern University Evanston, IL 60208
Lynne Reder Dept. of Psychology Carnegie Mellon University 5000 Forbes Ave. Pittsburgh, PA 15213
Roger W. Remington NASA-ARC MS 262-2 Moffett Field, CA 94035
Patricia A. Reuter-Lorenz Psychology Department University of Michigan 525 E. University Ann Arbor, MI 48109-1109
Seth Roberts Dept. of Psychology University of California Berkeley, CA 94720
Lynn C. Robertson Center for Neuroscience University of California Davis, CA 95616
Henry L. Roediger, III Dept. of Psychology Washington University St. Louis, MO 63130
Jannick Rolland Dept. of Computer Science The Univ. of North Carolina Box 3175, Sitterson Hall Chapel Hill, NC 27599-3175
David Rosenbaum Psychology Dept., Moore Bldg. Pennsylvania State University University Park, PA 16802-3106
Salim Roukos Watson Research Center International Business Machines PO Box 218 Yorktown Heights, NY 10598
William Rouse Search Technology Inc. 4898 S. Old Peachtree Rd. NW Atlanta, GA 30071-4707
David E. Rumelhart Psychology Dept. Stanford University Stanford, CA 94305
David Ryan-Jones Navy Personnel Research & Development Center, Code 13 5335 Ryne Rd. San Diego, CA 92152-6800
Timothy A. Salthouse School of Psychology Georgia Institute of Technology Atlanta, GA 30332
Fumiko Samejima Dept. of Psychology The University of Tennessee 307 Austin Peay Bldg. Knoxville, TN 37996-0900
Arthur G. Samuel Psychology Department SUNY-Stony Brook Stony Brook, NY 11794-2500
Andries Sanders Dept. of Psychology, Vakgroep Psychonomie Vrije Universiteit DeBoelelaan 111, B-106 1081 HV Amsterdam THE NETHERLANDS
Thomas Sanquist Hum. Aff. Res. Ctr.,Box C 5395 Battelle, 4000 NE 41st St. Seattle, WA 98105-5428
Daniel L. Schacter Psych. Dept., William James Hall Harvard University Cambridge, MA 02138
Richard Schemes Dept. of Philosophy Carnegie Mellon University 5000 Forbes Ave. Pittsburgh, PA 15213-3890
Carl Schneider U S Naval Academy Office of the Academic Dean 589McNairRd. Annapolis,MD 21402-5031
Walter Schneider Dept. of Psychology University of Pittsburgh 3939 O'Hara St. Pittsburgh, PA 15260
Jan Maarten Schraagen Human Information Processing Group TNO Human Factors Research Inst. Kampweg 5 PO Box 23 Soesterberg THE NETHERLANDS
Arthur Schulman Dept. of Psychology University of Virginia Charlottesville, VA 22903-2477
Richard Schweickert Psychological Sciences Purdue University West Lafayette, IN 47907
Roger Schvaneveldt Dept. of Psychology New Mexico State University Las Cruces, NM 88003
Colleen M. Seifert Dept. of Psych., U. M. 330 Packard Rd. Ann Arbor, MI 48104-2994
Martin Sereno Dept. of Cognitive Science University of CA San Diego 9500 Gilman Dr. Dept. 0515 La Jolla, CA 92093-0515
Reza Shadmehr Dept. of Biomedical Engineering The Johns Hopkins University 720 Rutland Ave. Baltimore, MD 21205-2196
Tim Shallice Dept. of Psychology University College London Gower Street London WC1E 6TB, England UK
Roger N. Shepard Psychology Dept., Bldg. 420 Stanford University Stanford, CA 94305-2130
Richard M. Shiffrin Dept. of Psychology Indiana University Bloomington, IN 47405
Edward J. Shoben Psychology Dept. University of Illinois 603 E. Daniel Champaign, IL 61820

Tracey Shors Dept. of Psychology Princeton University Green Hall Princeton, NJ 08544-1010
Harvey G. Shulman Dept. of Psychology Townsend Hall Ohio State University Columbus, OH 43210
Mark Siegel Dept. of Psychology University of the D C 4200 Connecticut Ave. NW Washington DC 20008
H. A. Simon Dept. of Psychology Carnegie-Mellon University 5000 Forbes Ave. Pittsburgh, PA 15213-3890
Greg B. Simpson Dept. of Psychology University of Kansas Lawrence, KS 66045
Edward E. Smith U M Dept. of Psychology 525 E. University Ann Arbor, MI 48109-1109
Mark Smolensky CTR for Aviation/AeroRes. Embry Riddle Aeronautical Univ. 600 S. Clyde Morris Blvd. Daytona Beach, FL 32114-3900
George Sperling Dept. of Cognitive Science University of California Irvine, CA 92717
Peter Spirtes Dept. of Philosophy Carnegie Mellon University 5000 Forbes Ave. Pittsburgh, PA 15213
Larry R. Squire VA Medical Center, VI16A University of CA San Diego 3350 La Jolla Village Dr. San Diego, CA 92161
John Stasko College of Computing Georgia Inst. of Tech. Atlanta, Georgia 30332-0289
Garold Stasser Dept. of Psychology Miami University 136 Benton Hall Oxford, OH 45056
George E. Stelmach Dept. of Exercise Science & Psychology Arizona State University Tempe, AZ 85287
Robert J. Sternberg Dept. of Psychology Box 280205 Yale Station New Haven, CT 06520-8205
Saul Sternberg Psychology Dept. 3815 Walnut St. University of Pennsylvania Philadelphia, PA 19104-6196
Randy Stiles R&D Division ORGN 90-31/201 Lockheed Missiles and Space Co. 3251 Hanover St. Palo Alto, CA 93404-1191
David L. Strayer Dept. of Psychology University of Utah Salt Lake City, UT 84112
Devika Subramanian Computer Science Dept. Cornell University 5133 Upson Hall Ithaca, NY 14853-2801
Ron Sun Dept. of Computer Science The University of Alabama Box 870290 Tuscaloosa, AL 35487-0290
John A. Swets BBN Laboratories 10 Moulton St. Cambridge, MA 02238
David A. Swinney Psychology Dept., 0109 U.C.S.D. La Jolla, CA 92093
John Theios Dept. of Psychology University of Wisconsin Madison, WI 53706
Steven Tipper Dept. of Psychology University College of North Wales Bangor, Gwynedd, LL57 2DG, WALES, GREAT BRITAIN
Douglas Towne Behavioral Tech Labs use 1120 Pope St., Suite 201 C St. Helena, CA 94574
James T. Townsend Dept. of Psychology Indiana University Bloomington, IN 47405
Anne M. Treisman Dept. of Psychology Princeton University Princeton, NJ 08544-1010
Leonard Trejo Navy Personnel R&D Center Code 134 53335 Ryne Rd. San Diego, CA 92152-7250
Carlo Umilta Dipartimento di Psicologia Generale University di Padova Piazza Capitaniato 3 35139 Padova ITALY
William R. Uttal Dept. of Psychology Arizona State University Tempe, AZ 85287-5906
Maurits Van der Molen Dept. of Psychonomics Universtiy of Amsterdam Roetersstraat 15 1018 WB Amsterdam THE NETHERLANDS
Kurt Van Lehn Dept. of Computer Science The University of Pittsburgh 3939 O'Hara St. Pittsburgh, PA 15260
Karl Van Orden Med. Info Sys.and Operations Res. Naval Health Research Center P.O. Box 85122 San Diego, CA 92186-5122
Ross Vickers Stress Medicine Dept. Naval Health Research Center PO Box 85122 San Diego, CA 92138

Alex Waibel School of Computer Science Carnegie Mellon University 5000 Forbes Ave. Pittsburgh, PA 15213-3890
David Washbum Center for Excellence for Research on Training Morris Brown College 643 Martin Luther King Jr. Dr.,NW Atlanta, GA 30314-4140
Daniel J. Weeks Human Factors Lab Simon Fräser Univ. Burnaby, B C, V5A 1S6 CANADA
Sally Wertheim, Dean Graduate Seh. & Grants Admin. John Carroll University 20700 N. Park Blvd. University Heights, OH 44118
Halben White Dept. of Economics 0508 University of CA San Diego 9500 Gilman Dr. La Jolla, CA 92093-0508
Chris Wickens Dept. of Psychology Aviation Research Laboratory University of Illinois 1 Airport Road Savoy, IL 61874
David Wilkins Beckman Institute University of IL at Urbana Champaign 405 N. Matthews Ave. Urbana, IL 61801
Jack Wilkinson Dept. of Mathematics Wright Hall University of Northern Iowa 27th and College St. Cedar Falls, IA 50614-0506
Kent Williams Dept. oflEMS University of Central Florida 4000 Central FL Blvd. Orlando, FL 32816-0150
Alan Wing MRC Applied Psychology Unit 15 Chaucer Road Cambridge CB2 2EF, England UK
Ted Wright Dept. of Cognitive Science University of California Irvine, CA 92717
Steven Yantis Dept. of Psychology Johns Hopkins University Baltimore, MD 21218-2686
Wayne Zachary CHI Systems Inc. GWYNEDD Office Park 716 N. Bethlehem Pike, Suite 300 Lower Gwynedd, PA 19002-2650
Howard Zelaznik Dept. of Kinesiology Motor Behavior Lab. Purdue University West Lafayette, IN 47907
Jan Zytkow Dept. of Computer Science George Mason University 4400 University Dr. Fairfax, VA 22030
Mark Wilson Quantitative Methods in Education Graduate School of Education University of CA Berkeley Berkeley, CA 94720