a comprehensive experimental characterization of the ipix ... · 2016 jinst 11 p08012 contents 1...
TRANSCRIPT

This content has been downloaded from IOPscience. Please scroll down to see the full text.
Download details:
IP Address: 128.141.192.151
This content was downloaded on 20/03/2017 at 12:27
Please note that terms and conditions apply.
A comprehensive experimental characterization of the iPIX gamma imager
View the table of contents for this issue, or go to the journal homepage for more
2016 JINST 11 P08012
(http://iopscience.iop.org/1748-0221/11/08/P08012)
Home Search Collections Journals About Contact us My IOPscience
You may also be interested in:
Erratum: A comprehensive experimental characterization of the iPIX gamma imager
K. Amgarou, V. Paradiso, A. Patoz et al.
Measurement of an accelerator based mixed field with a Timepix detector
S.P. George, C.T. Severino, E. Fröjdh et al.
Imaging and spectroscopic performance studies of pixellated CdTe Timepix detector
D Maneuski, V Astromskas, E Fröjdh et al.
Characterization of a 2x3 Timepix assembly with a 500m thick silicon sensor
M Zuber, T Koenig, E Hamann et al.
TimepixCam: a fast optical imager with time-stamping
M. Fisher-Levine and A. Nomerotski
Depth of interaction and bias voltage depenence of the spectral response in a pixellated CdTe
detector operating in time-over-threshold mode subjected to monochromatic X-rays
E Fröjdh, C Fröjdh, E N Gimenez et al.
Investigation of charge collection in a CdTe-Timepix detector
D Krapohl, C Fröjdh, E Fröjdh et al.
X-ray absorption and charge transport in a pixellated CdTe detector with single photon processing
readout
E Fröjdh, B Norlin, G Thungström et al.
Geometric correction methods for Timepix based large area detectors
J. Zemlicka, J. Dudak, J. Karch et al.

2016 JINST 11 P08012
Published by IOP Publishing for Sissa Medialab
Received: May 9, 2016Revised: July 19, 2016
Accepted: July 29, 2016Published: August 16, 2016
A comprehensive experimental characterization of theiPIX gamma imager
K. Amgarou,a,1 V. Paradiso,a,b,2 A. Patoz,a F. Bonnet,a J. Handley,a,b P. Couturier,a
F. Beckerc and N. Menaaa
aCANBERRA Industries Inc.,1, rue des Hérons, Saint Quentin en Yvelines, F-78182 France
bCERN, Experimental Physics Department, ATLAS Detector Operation,Geneva 23, CH-1211 Switzerland
cKarlsruhe Institute of Technology — KIT, Institute for Nuclear Waste Disposal,Hermann-von-Helmholtz-Platz 1, Eggenstein-Leopoldshafen, 76344 Germany
E-mail: [email protected]
Abstract: The results of more than 280 different experiments aimed at exploring the main featuresand performances of a newly developed gamma imager, called iPIX, are summarized in this paper.iPIX is designed to quickly localize radioactive sourceswhile estimating the ambient dose equivalentrate at the measurement point. It integrates a 1 mm thick CdTe detector directly bump-bonded to aTimepix chip, a tungsten coded-aperture mask, and a mini RGB camera. It also represents a majortechnological breakthrough in terms of lightness, compactness, usability, response sensitivity, andangular resolution. As an example of its key strengths, an 241Am source with a dose rate of onlyfew nSv/h can be localized in less than one minute.
Keywords: Dosimetry concepts and apparatus; Search for radioactive and fissile materials
1Present address: CEA, DEN/MAR/DPAD/CMET, B.P. 17171, Bagnols sur Cèze, F-30207 France.2Corresponding author.
© CERN 2016, published under the terms of the Creative Commons Attribution 3.0License by IOP Publishing Ltd and Sissa Medialab srl. Any further distribution of this
work must maintain attribution to the author(s) and the published article’s title, journal citation and DOI.doi:10.1088/1748-0221/11/08/P08012
2016 JINST 11 P08012
Contents
1 Introduction 1
2 Materials and methods 32.1 Timepix chip 3
2.1.1 Counting modes 42.1.2 Charge sharing between adjacent pixels 52.1.3 Pixel output signal 62.1.4 Pulse pile-up under intense photon fluxes 62.1.5 Pulse summation due to extended shutter-times 72.1.6 Threshold equalization 8
2.2 Coded-aperture mask 82.3 Irradiation set-up 9
3 Results and discussion 133.1 Data quality 133.2 ToT-energy calibration 183.3 Dose rate linearity 203.4 Dose calibration factor vs. incident photon energy 203.5 Cluster sizes vs. incident photon energy 223.6 Sensitivity and influence of background radiation 223.7 Off-axis response 273.8 Angular resolution 29
4 Conclusions 33
1 Introduction
In-situ localization of radiation emitting objects or hotspots is of prime concern during decommis-sioning and clean-up activities of nuclear facilities at the end of their life-cycle. It is also of greatimportance in homeland security for detecting illicit traffic of nuclear materials as well as in crisismanagements of radiological emergency situations for recovering orphan or lost radioactive sourceson the one side, and for delimiting suspicious radiological contaminated areas after an accidentevent or malevolent act on the other side [1–3].
Gamma imaging technique, applied for the first time by Anger in 1952 as a human bodytomographic scanner to detect early stage tumours [4], provides an optimal solution to track X-or γ-ray emitting objects from greater distances than conventional rate meters, thus significantlyreducing the radiation dose received by operators in line with the well-known ALARA principle.However, the associated equipment usually used for medical applications is generally too bulky,heavy, and complex to be employed for in-field monitoring.
– 1 –
2016 JINST 11 P08012
An earlier attempt to develop a portable gamma imager was carried out in the 1990s byCEA. The outcome of this effort was the CARTOGAM instrument [5], which has been widelycommercialized by CANBERRA during the last decade. This instrument is a mature technologycombining an inverted double-cone collimator (i.e., two right circular cones placed apex-to-apex) tobe used as a single pinhole aperture, a CsI/Tl (thallium doped caesium iodide) scintillation crystal,a multi-channel image intensifier, and a CCD camera. With the exception of the pinhole aperture,the whole instrument is fully shielded against background radiation.
CARTOGAM applies the same approach of a basic photographic camera (i.e., a light-opaquebox with a pinhole aperture through which the light coming from an object is projected inside toform an inverted image). Although it is still demonstrating good performances, namely at severeirradiation conditions, its heavy weight (∼18 kg) poses several constraints from a practical point ofview. In addition, its detection efficiency is quite limited by the small size of its pinhole aperture.
To overcome these shortcomings, CANBERRA has recently developed a second-generationgamma imager, called iPIX (figure 1), in the framework of a partnership agreement with CEA [6–8].iPIX integrates a 1 mm thick CdTe (cadmium telluride) detector directly bump-bonded to a Timepixchip [9], a tungsten coded-aperture mask (i.e., a front-end collimator with several pinholes) [10],and a mini RGB camera. Under this configuration, the real view of the scene under study is firstlytaken by the mini RGB camera and is subsequently superimposed by the associated X- or γ-rayinformation (i.e., a sort of color map display) derived as a result of the mask pattern design (seesection 2.2 for more details).
The coded-aperture technique has played a crucial role in astronomy to help resolving the originof γ-ray bursts from distant galaxies [11] and can be used under a mask/anti-mask mode [12] toreduce the background noise interference without the need of heavy radiation shielding. This allowsfor an ultra-portable (2.35 kg) and compact (9 × 9 × 18.8 cm3) device, which is remotely controlled(via a single Ethernet cable up to 80 meters long) by means of an easy-to-use, fully ergonomic,and highly intuitive Graphical User Interface (GUI). The latter when launched is systematicallyconfigured and, with only one click, a new acquisition can be started.
Other main features of iPIX are:
• Easily deployable and plug-and-play system,
• Automatic parameter settings,
• Dynamic display of the measurement progress,
• Industrial design for use in harsh environments,
• Dust and water proof,
• Easy to clean, especially for unwanted radioactive contamination,
• Protection against unpredictable vibrations, chocks and falls,
• More than five hours autonomy, and
• Motorized pan-tilt support.
– 2 –

2016 JINST 11 P08012
Figure 1. The iPIX gamma imager (left) together with a cross-section not to scale (right) showing its mainscomponents and relevant dimensions. It has three coded-aperture masks (see section 2.2) that are labelledby different colors to facilitate their identification during measurements.
The present paper is mainly focused on the description of the iPIX gamma imager. It alsoanalyzes and discusses the results of a comprehensive experimental study, carried out with ISOnarrow X-ray beams or N-Series [13] and standard radioactive sources.
2 Materials and methods
2.1 Timepix chip
The Timepix chip is a pixelated CMOS ASIC directly bump-bounded to a given semiconductorsubstrate in order to detect X- or γ-rays (hereafter referred to as “photons”). It consists of 256 ×256 square pixels with 55 µm side, providing a global detection area of 14 × 14 mm2. Each pixelcontains ∼550 transistors with ∼13.5 µW static power consumption and it has its own electroniccircuitry: charge-sensitive amplifier, discriminator with polarity control pin, 4-bit DAC offset forthreshold adjustment, synchronization logic, 8-bit configuration register, and 14-bit counter.
The photon detection is based on a depletion region that is formed in the vicinity of the PNjunction under a reverse-bias voltage. The number of collected charge carriers (electrons and holes)is expected to be proportional to the amount of the energy deposited in the depletion region by thepassage of ionizing radiation. However, the active pixels give no signal when the pre-set thresholdlevel (THL) is not crossed. The 14-bit counter of each pixel operates only when the Timepix shutteris open (see section 2.1.1) and has an overflow control that stops at 11810 counts [9]. All theTimepix parameters are easily configured via Pixelman, a cross-platform and modular software tooldeveloped by the Czech Technical University in Prague [14].
Figure 2 compares the energy dependence of photon absorption probability, which is directlyrelated to the photon detection efficiency, for the three substrates (Si, CdTe and GaAs) that canbe currently chosen for the Timepix chip. According to this figure, CdTe has globally a betterphoton absorption probability due to its high atomic number and density (Z = 48.52 and ρ = 5.32g cm−3). The maximum difference, up to a factor 20 around 50–70 keV, is shown between CdTeand Si. At this energy range, the photon absorption probability on CdTe is near 50%. However, thethree materials provide quite comparable behaviour at photon energies above 400 keV showing lowabsorption probabilities (<1%).
– 3 –

2016 JINST 11 P08012
Figure 2. Absorption probability for CdTe, GaAs and Si as a function of incident photon energy.
2.1.1 Counting modes
Every pixel of the Timepix chip can be independently configured to run in one of the following fourdifferent operating modes:
• Masked mode: individual pixels can be masked.
• Medipix (MPX) mode: the pixel counter is incremented by one each time its output signalcrosses the pre-set threshold level.
• Time-over-Threshold (ToT) or energy mode: the counter is incremented continuously aslong as the pixel output signal is above the pre-set threshold level. The number of clockcycles is counted until the pixel output signal crosses back below this threshold. As stated insection 2.1.3, the number of clock cycles can be directly related to the voltage amplitude ofthe pixel output signal.
• Time-of-Arrival (ToA) or time mode: the counter is incremented continuously from the timethe pixel output signal crosses the pre-set threshold level until the closure of the shutter. Thismode is beyond the iPIX scope and will not be addressed hereafter since it is essentiallyused in the Large Hadron Collider (LHC) at CERN for accurate tracking of fundamentalparticles [15].
A reference clock with up to 100 MHz frequency is used for the last two counting modes.However, as the iPIX default clock frequency is fixed to 9.6 MHz, each ToT unit corresponds to atime period of 1.042×10⁻⁷ sec.
As pointed out before, all the above counting modes rely on the configured shutter-time, whichis the active time during which the Timepix sensor is kept switched on. When this shutter-timeends, pixel values are retrieved from the buffer and cleared. The process repeats for the duration ofthe measurement (i.e., until the chosen number of frames is reached). A comparison between MPXand ToT modes is illustrated in figure 3.
– 4 –

2016 JINST 11 P08012
Figure 3. Comparison between MPX and ToT modes of the Timepix chip.
2.1.2 Charge sharing between adjacent pixels
When an incident photon (γ- or X-ray) interacts with an electron within the depletion region,mainly via photoelectric effect or Compton scattering, this primary electron then ionizes nearbyatoms releasing more electron-hole pairs. Consequently, these charge carriers drift in oppositedirections towards the corresponding electrodes because of the electric field and may be collectedat the same time by several adjacent pixels, resulting in a “cluster”.
Therefore, each registered cluster can be directly associated to the original photon interaction.This means that each cluster is equivalent to a “count” for conventional radiation detectors. Inaddition, the whole charge created by any incident photon can be revealed by summation of thefractional charges collected by all the pixels forming its associated cluster. The extent of chargesharing effect generally depends on the incident photon energy, pixel size, substrate layer, appliedbias voltage, and the interaction depth within the sensitive volume [16].
A “cluster reconstruction”method (see figure 4) has been applied to correct for the above chargesharing effect. This method consists of determining the span of each registered cluster and definingthe associated pixel with the highest ToT value as the possible location on the sensor surface ofthe original photon interaction. All the registered clusters can then be reduced to just the origininteraction pixels, improving the precision of the measurement. Furthermore, when using the ToTmode, the reading value of all the nearby pixels forming a given cluster can be summed to returnthe total energy deposited by the primary incident photon.
The method of cluster reconstruction also allows for a direct integration of the whole clustersregistered along successive frames taken during the same measurement. Therefore, the number ofregistered clusters divided by the detection “live-time” (i.e., the preset shutter-time multiplied bythe total recorded frames) directly provides the conventional “count rate” or “cps”.
In principle, as illustrated in figure 4, both ToT and MPX modes are able to generate similarcount rates under identical irradiation conditions. The only difference in MPX mode is that, as allthe pixels associated to a given cluster provide the same reading value (one hit or 1), an arbitrarycriterion regarding the possible location of the original photon interaction must be applied. This iswhy the cluster reconstruction step in theMPXmode is represented in figure 4 with a hatched arrow.
– 5 –

2016 JINST 11 P08012
Figure 4. Example of application of the “cluster reconstruction” method.
2.1.3 Pixel output signal
The pixel output signal is approximated to a triangular pulse, with ∼100 ns rise time and a falltime that can reach several tens of microseconds for the photon energy of interest, ranging between10 keV and 1.5MeV. Due to this triangular shape, the time duration (i.e., the number of clock cyclesdivided by the clock frequency in ToT mode) of any pixel output signal above the pre-set thresholdlevel remains proportional to its voltage amplitude, which in turn is directly related to the portion ofthe total energy deposited by the incident photon that has been transferred to the considered pixel.
To have an idea how the ToT value varies with the associated energy deposited by the incidentphoton, figure 5 illustrates the example of single-pixel clusters. The green curve in this figureputs into evidence that the resulting ToT-energy calibration curve can be generally described by thefollowing non-linear function depending on four parameters (a, b, c and d):
Eγ = f (ToT) = aToT + b −c
ToT − d. (2.1)
This function has been experimentally confirmed by Jakubek et al. [17] showing a linear behaviourdown to a given critical energy (usually near 10 keV) because of the threshold level that must beapplied to avoid unwanted leakage current contribution (see section 2.1.6). Below this criticalenergy, the calibration curve deviates from linearity.
2.1.4 Pulse pile-up under intense photon fluxes
Under an excessive photon flux, the detector becomes saturated resulting in the pulse pile-upphenomenon. As illustrated in figure 6, when successive pulses are very close in time the systemwill wrongly record them as a single count with combined amplitude.
– 6 –

2016 JINST 11 P08012
Figure 5. ToT value vs. full deposited gamma energy for single-pixel clusters.
Figure 6. Illustration of the pulse pile-up effect.
2.1.5 Pulse summation due to extended shutter-times
When selecting an excessive shutter-time, even in case of a low incident photon flux, successivesignals can be collected and accumulated before it expires (see figure 7). The resulting readingvalue under ToT mode is the sum of all of the individual signals that are detected on the particularpixel within this excessive shutter-time.
For this purpose, the shutter-timemust be conveniently chosen to avoid this effect. If successivesignals are recorded on the same pixel under ToT mode, the corresponding reading would lead toa meaningless numerical value. This effect can be minimized by decreasing the shutter-time to alimit of not setting it shorter than the time it takes for the pulse to be fully collected by the pixel. Inaddition, a very short shutter-time has a great risk of not providing enough statistics, especially atlow photon fluxes. The iPIX response dependence with regards to the pre-set shutter-time is furtherexplored in section 3.1.
– 7 –

2016 JINST 11 P08012
Figure 7. Summation of succeeding pulses due to excessive shutter-time.
2.1.6 Threshold equalization
Threshold equalization is used to compensate the pixel-to-pixel threshold variations of the Timepixreadout chip due to local transistor mismatches. This procedure is normally applied using theinherent electronic noise as a trigger (i.e., the measurement is carried out in a radiation-freeenvironment). In that case, the system tries to automatically fine-tune the 4-bit DAC offset for everypixel to be as close as possible to an optimum threshold level common to all pixels so that unwantedleakage current contribution is conveniently discarded but not the input pulses of interest.
A new equalization method was specifically developed for iPIX to well fix the leaking currentissue. This method considers the real sensor response, instead of the inherent electronic noise,under a homogeneous X- or γ-ray flux in the energy range between 50–100 keV.
2.2 Coded-aperture mask
Three coded-aperture masks, providing two different mask ranks (see figure 8) and three differentthicknesses, are currently available for the iPIX platform. They are identified according to theirrank and thickness: R7e4, R7e8 and R13e2. The label “e” is an abbreviation of the word épaisseur(a French translation of “thickness”). Their planar area is four times that of the CdTe detector andtheir patterns were designed according to the well-known uniformly redundant arrays [18].
The benefit of a highmask rank is a more precise angular resolution with counterpart a decreaseof the detection efficiency due to its less open area. Whereas increasing the mask thickness providesmore photon filtering thus enhancing the signal-to-noise ratio but, in turn, it reduces the iPIX off-axis response (see section 3.7 for more details). The two masks of rank 7 can be inverted by a 90◦
rotation to perform anti-mask measurements. The application of the mask R13e2 is only limitedfor low photon energies. More specifically, this mask is used to detect the presence of plutonium innuclear wastes via the 59 keV γ-ray of 241Am.
– 8 –

2016 JINST 11 P08012
Figure 8. Pattern designs for the iPIX coded-aperture masks with rank 7 (left) and rank 13 (right).
By placing the coded-aperture mask in front of a photon beam, emitted from a given radioactivehotspot located within its field-of-view (FOV), a shadow of the “illuminated” portion of its pattern iscast onto the detector surface. It is thus necessary to apply a de-convolution process of the resultingdata collected with the Timepix chip to accurately reconstruct the location of the radioactive hotspoton the scene under study. The interested reader is referred to [18] and [19] for more informationabout the mathematical rules behind the coded-aperture technique.
2.3 Irradiation set-up
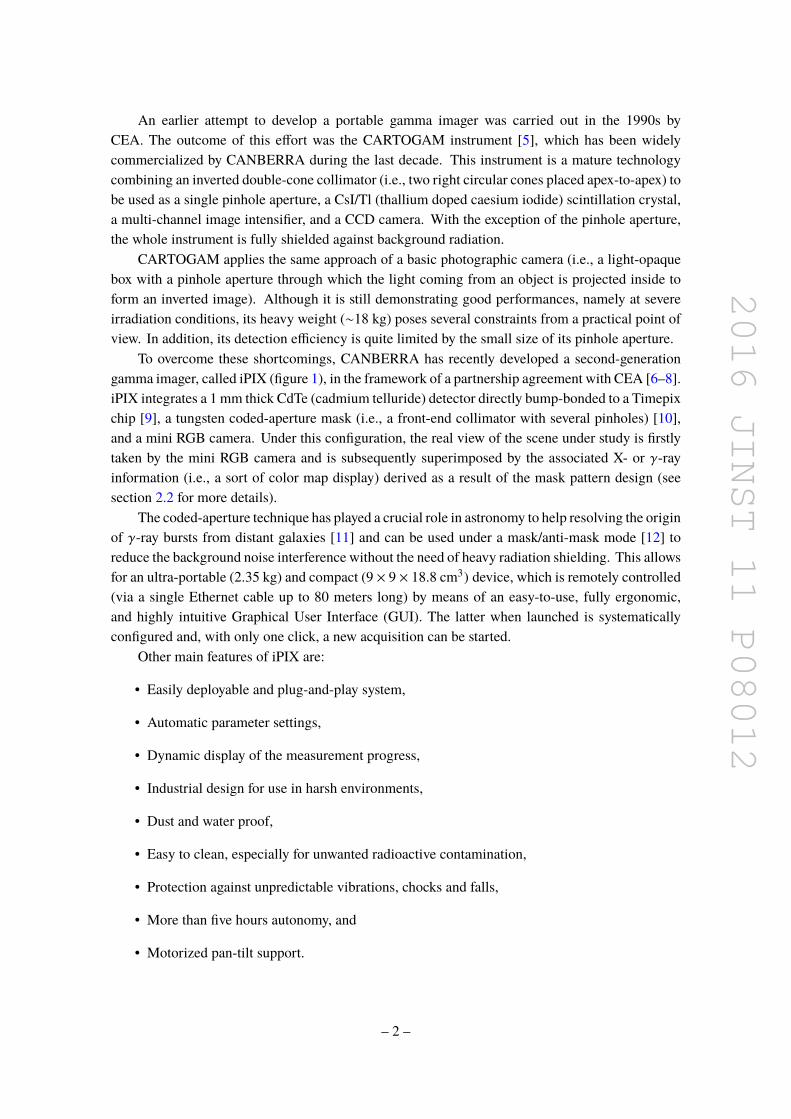
The iPIX experimental characterisation has been carried out at by means of the wide-range ir-radiation equipment located at CANBERRA’s Loches site as well as the KIT X-ray irradiationfacility.
The CANBERRA irradiation equipment (figure 9) consists of:
1. A “big” irradiator with six interchangeable standard 137Cs sources of nominal activitiesbetween 3 GBq and 30 TBq to provide a dose rate ranging from 20 µSv/h to 20 Sv/h atseveral source-to-detector distances.
2. A “small” irradiator with two interchangeable standard 137Cs (∼300 MBq) and 60Co (∼70MBq) sources to provide a dose rate at the chosen measurement point ranging from 2 µSv/hto 100 µSv/h.
3. A “portable” irradiator based on a standard 241Am source with ∼1.85 GBq nominal activityto provide a dose rate ranging from 1 to 50 µSv/h.
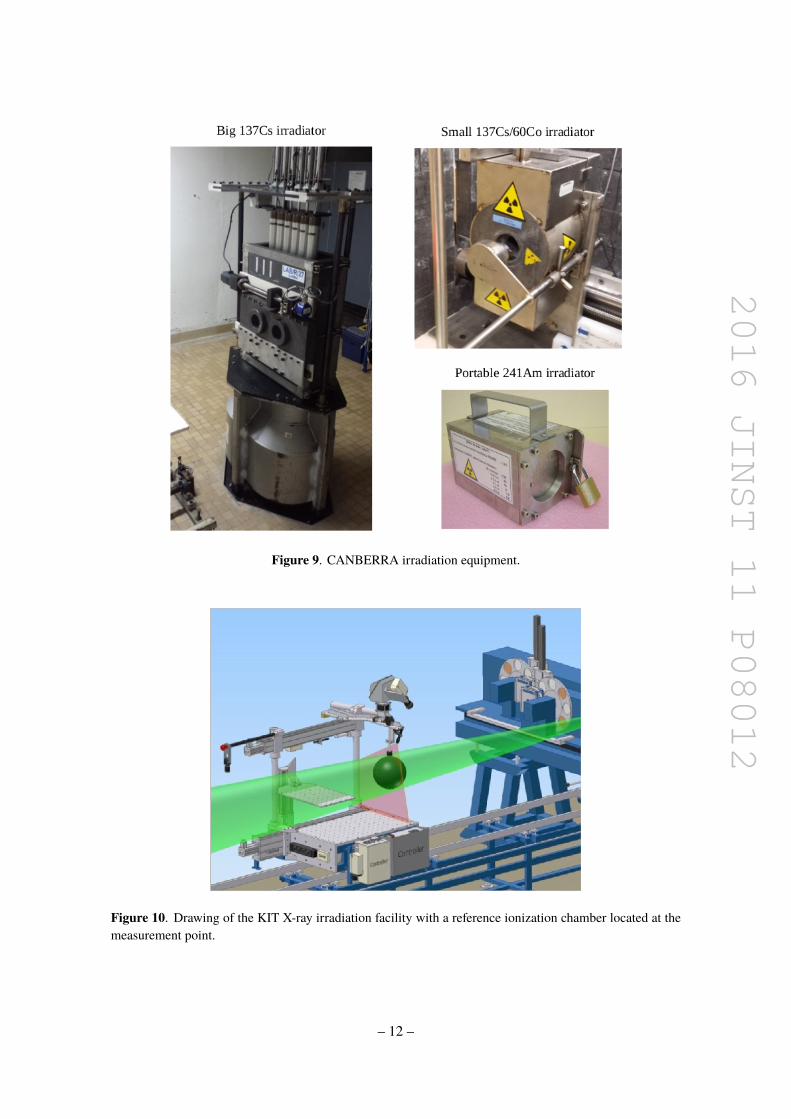
The KIT X-ray irradiation facility (figure 10) is equipped with secondary standards and is ableto provide the ISO standard narrow beams or N-Series [13]. All the X-ray beams used in this study,together with their theoretical energy distributions, are listed in table 1 and table 2. Increasing input
– 9 –

2016 JINST 11 P08012
Table 1. ISO X-ray narrow beams (15–60 kV) together with the measured ambient dose equivalent rates atvaried input currents (details are given in the text).
ISOreference
DistanceBeam Inputs
Mean EnergyH ∗ (10)
(mSv/h)
Energy Spectrum(reproduced from ref. [13])
Voltage Current
N-15 200 cm 15 kV
1 mA
13.3 keV
0.34 ± 0.02
5 mA 1.64 ± 0.08
10 mA 3.27 ± 0.16
15 mA 4.91 ± 0.25
20 mA 6.56 ± 0.33
N-20 200 cm 20 kV
1 mA
16.9 keV
1.58 ± 0.08
5 mA 7.89 ±0.39
10 mA 15.72 ± 0.79
15 mA 23.6 ± 1.2
20 mA 31.5 ± 1.6
N-30 200 cm 30 kV
1 mA
24.6 keV
1.83 ± 0.09
5 mA 9.23 ± 0.46
10 mA 18.44 ± 0.92
15 mA 27.5 ± 1.4
20 mA 36.8 ± 1.8
N-40 200 cm 40 kV
1 mA
33.0 keV
3.91 ± 0.19
5 mA 19.51 ± 0.98
10 mA 38.5 ± 1.9
15 mA 57.3 ± 2.9
20 mA 76.2 ± 3.8
N-60 200 cm 60 kV
1 mA
47.6 keV
2.59 ± 0.13
5 mA 13.15 ± 0.66
10 mA 26.5 ± 1.3
13 mA 34.5 ± 1.7
– 10 –

2016 JINST 11 P08012
Table 2. ISO X-ray narrow beams (80–300 kV) together with the measured ambient dose equivalent rates atvaried input currents (details are given in the text).
ISOReference
DistanceBeam Inputs
Mean EnergyH ∗ (10)(mSv/h)
Energy Spectrum(reproduced from ref. [13])
Voltage Current
N-80 200 cm 80 kV
1 mA
65.3 keV
1.45 ± 0.07
5 mA 7.47 ± 0.37
10 mA 14.93 ± 0.75
13 mA 19.42 ± 0.97
N-100 200 cm 100 kV
1 mA
83.8 keV
0.57 ± 0.03
5 mA 2.91 ± 0.16
10 mA 5.83 ± 0.29
13 mA 8.03 ± 0.40
N-150 200 cm 150 kV
1 mA
118.4 keV
5.00 ± 0.25
5 mA 25.4 ± 1.3
10 mA 50.6 ± 2.5
13 mA 67.7 ± 3.4
N-200 200 cm 200 kV
1 mA
164.5 keV
1.78 ± 0.09
5 mA 9.14 ± 0.46
10 mA 18.68 ± 0.93
13 mA 24.2 ± 1.2
N-250 200 cm 250 kV
1 mA
207.3 keV
1.75 ± 0.09
5 mA 9.00 ± 0.46
10 mA 18.02 ± 0.93
13 mA 22.8 ± 1.2
N-300 200 cm 300 kV
1 mA
247.5 keV
1.59 ± 0.08
5 mA 8.37 ± 0.42
10 mA 16.87 ± 0.84
13 mA 22.2 ± 1.1
– 11 –
2016 JINST 11 P08012
Figure 9. CANBERRA irradiation equipment.
Figure 10. Drawing of the KIT X-ray irradiation facility with a reference ionization chamber located at themeasurement point.
– 12 –

2016 JINST 11 P08012
electron currents were applied for each X-ray energy (i.e., at constant acceleration voltages in kV)in order to increase the associated flux at the considered measurement point.
For each irradiation run at the KIT X-ray irradiation facility, the following steps have beenessentially used for the determination of the iPIX response to X-ray beams:
• Firstly, a basic quantity such as air Kerma rate or Kair expressed in mGy/h units was directlymeasured with a calibrated ionization chamber at the considered distance (∼2 meters).
• Then, the appropriate operational quantity, in terms of the ambient dose equivalent rate orH ∗ (10) expressed in mSv/h units, was derived by the application of the associated conversioncoefficient derived from ICRP-74 [20]. The corresponding values for every X-ray beam atvaried input currents are summarized in tables 1 and 2.
• Lastly, the iPIX device under test was placed at the same measurement distance to evaluateits response.
Almost the same steps were followed at CANBERRA irradiation facilities with the onlydifference of using the calibrated ionization chamber earlier before at five reference distances forthe considered standard source to derive the associated fitting parameters (a and b) of the followingempirical relationship:
Kair = ax−b (2.2)
where x is the source-to-detector distance in cm.
3 Results and discussion
3.1 Data quality
In this section, a qualitative study of the measurement data collected at the KIT X-ray facility isperformed. In this case, the iPIX count rates measured at each X-ray beam have been normalizedto the corresponding dose rate (see tables 1 and 2) in order to facilitate comparison between thedifferent shutter-times used. Indeed, when increasing the X-ray beam currents the whole area ofthe measured spectra must be linearly proportional to the associated dose rates.
As expected, the masks R7e8 and R7e4 provide quite similar results whereas the ones obtainedwith R13e2 when the incident photon energy is above 200 keV were quite unsatisfactory (i.e., theradioactive hotspot is not anymore localized) due to its small thickness. The iPIX measurementdata collected with the mask R7e8 are plotted in figures 11–21 to show the typical evolution of thecluster ToT distributions with respect to the incident X-ray beam energy and current as well as tothe Timepix shutter-time.
According to these figures, when the shutter-time is appropriately chosen to avoid signaldistortions eventually due to pulse pile-up and/or summation effects, as explained in sections 2.1.4and 2.1.5, the associated count rates per unit of mSv/h must not change when only the X-ray beamcurrent is varied. This is the case when 10−4 sec shutter-time is chosen for all the considered ISOX-ray narrow beams and at practically the whole range of applied currents.
Conversely, caution should be taken when choosing a shutter-time of 10−5 sec since it cannotbe applied for photon energies above 150 keV. In fact, above this energy, the effect of incomplete
– 13 –

2016 JINST 11 P08012
Figure 11. Cluster ToT distributions measured with the mask R7e8 under different shutter-times for the N-15(Emean = 13.3 keV) X-ray narrow beams of varied currents. Owing to the photoelectric process there is asingle full-energy peak.
Figure 12. Cluster ToT distributions measured with the mask R7e8 under different shutter-times for the N-20(Emean = 16.9 keV) X-ray narrow beams of varied currents. Owing to the photoelectric process there is asingle full-energy peak.
– 14 –

2016 JINST 11 P08012
Figure 13. Cluster ToT distributions measured with the mask R7e8 under different shutter-times for the N-30(Emean = 24.6 keV) X-ray narrow beams of varied currents. Owing to the photoelectric process there is asingle full-energy peak.
Figure 14. Cluster ToT distributions measured with the mask R7e8 under different shutter-times for the N-40(Emean = 33.0 keV) X-ray narrow beams of varied currents. Owing to the photoelectric process there is asingle full-energy peak.
– 15 –

2016 JINST 11 P08012
Figure 15. Cluster ToT distributions measured with the mask R7e8 under different shutter-times for the N-60(Emean = 47.6 keV) X-ray narrow beams of varied currents. Besides the full-energy peak, an additional oneappears on the left at around 13 ToT (i.e., ∼1.4 µsec).
Figure 16. Cluster ToT distributions measured with the mask R7e8 under different shutter-times for the N-80(Emean = 65.3 keV) X-ray narrow beams of varied currents. Unlike the full-energy peak, the additional onedoes not move to the right with increasing the incident photon energy.
charge collection of the pixel output signals becomes apparent. Shutter-times higher than 10−4 seccan only be applied for a limited range of X-ray beams and at very low currents with the exceptionof 1 sec that completely failed in providing physically meaningful results.
Furthermore, a clear distinction has always to be made between radioactive hotspot localization(possible even under pulse pile-up and/or summation effects) and dose rate evaluation that can bedone only when dose rate linearity is fully guaranteed.
It must be noticed that interactions of low energy photons with the CdTe substrate occurprimarily via the photoelectric process giving rise to a single full-energy peak, which as expectedshifts to higher ToT values with increasing the beam acceleration voltage. When the incidentphoton energy is above 40 keV, an additional peak appears on the left at around 13 ToT (i.e., ∼1.4µsec) as shown in figure 15. In the beginning, we believed that it is a consequence of the possible
– 16 –

2016 JINST 11 P08012
Figure 17. Cluster ToT distributions measured with the mask R7e8 under different shutter-times for theN-100 (Emean = 83.8 keV) X-ray narrow beams of varied currents. Data obtained with a 10−5 sec shutter-timeand at low (1 mA) beam input current were statistically insignificant and are not reproduced here. Unlike thefull-energy peak, the additional one does not move to the right with increasing the incident photon energy.
Figure 18. Cluster ToT distributions measured with the mask R7e8 under different shutter-times for the N-150 (Emean = 118.4 keV) X-ray narrow beams of varied currents. Unlike the full-energy peak, the additionalone does not move to the right with increasing the incident photon energy.
escape from the detector sensitive volume of characteristic fluorescence X-rays (23–31 keV) locallyemitted by Cd or Te atoms after photoelectric interactions. Nevertheless, this peak remains fixedand contrary to the full-energy peak it does not move to the right with increasing the incidentphoton energy. For this reason, we think that it could be a direct detection of extra characteristicfluorescence X-rays emitted by other elements outside the CdTe substrate. The lack of knowledgeabout the actual composition of all surrounding materials does not allow us to make any kind ofprediction regarding this additional peak.
– 17 –

2016 JINST 11 P08012
Figure 19. Cluster ToT distributions measured with the mask R7e8 under different shutter-times for the N-200 (Emean = 164.5 keV) X-ray narrow beams of varied currents. Data obtained with a 10−5 sec shutter-timeand at low (1 mA) beam input current were statistically insignificant and are not reproduced here. Unlike thefull-energy peak, the additional one does not move to the right with increasing the incident photon energy.
Figure 20. Cluster ToT distributions measured with the mask R7e8 under different shutter-times for theN-250 (Emean = 207.3 keV) X-ray narrow beams of varied currents. Data obtained with a 10−5 sec shutter-time and at low (1 mA) beam input current were statistically insignificant and are not reproduced here. Themeasurement files for 10−5 sec shutter-time and 5 mA beam input current were corrupted. The full-energypeak is no longer visible whereas the additional one is still appearing.
3.2 ToT-energy calibration
Only clearly differentiated and sharp full-energy peaks were considered for the ToT-energy calibra-tion. This was the case for the incident photon mean energies ranging from 10 to 90 keV and 10−4
sec shutter-time (see figures 11–17). Each one of these peaks was fitted with a Gaussian function toderive the associated ToT value of its geometric centre. The results obtained are plotted in figure 22,where all the ToT values were divided by the default clock frequency to express them in time units.A satisfying linearity is observed between incident photon energies and their respective ToT values.
Figure 23 shows the measured 137Cs spectrum after applying the ToT-energy calibration rela-
– 18 –

2016 JINST 11 P08012
Figure 21. Cluster ToT distributions measured with the mask R7e8 under different shutter-times for theN-300 (Emean = 247.5 keV) X-ray narrow beams of varied currents. Data obtained with a 10−5 sec shutter-time and at low (1 mA) beam input current were statistically insignificant and are not reproduced here. Thefull-energy peak is no longer visible whereas the additional one is still appearing.
Figure 22. ToT-photon energy calibration curve for the iPIX gamma camera.
tionship derived in figure 22. The chosen experimental conditions were a dose rate of 1 Sv/h atthe measurement point and a total of 2000 frames (i.e., 1000 frames using the “mask” position and1000 frames using the “anti-mask” position) with a shutter-time of 10−4 sec.
This figure makes easily distinguishable two full-energy peaks associated to 32 keV γ-ray of137Cs and to the characteristic fluorescence photons (58–85 keV) emitted from the tungsten (W)atoms in the coded-aperture mask and/or from the irradiator Pb-based collimator. The currentenergy resolution of the CdTe detector does not allow resolving W and Pb characteristic lines.
Despite the small thickness of the CdTe substrate, the corresponding 662 keV peak of 137Cs aswell as its Compton edge (∼478 keV) are also visible on logarithmic scale (figure 23). This ultimatelyratifies the validity of the ToT-energy linearity also at high energies. The energy resolution for the662 keV peak was found to be approximately 9%.
– 19 –

2016 JINST 11 P08012
Figure 23. Measured 137Cs spectrum with iPIX.
Similar 137Cs spectra were obtained for other dose rates but considering highly significantstatistics as well as appropriate shutter-times to avoid signal distortions due to pulse pile-up and/orsummation effects (as explained in sections 2.1.4 and 2.1.5).
Taking into account the above ToT-energy calibration relationship, the expected ToT for the1500 keV energy is ∼85 µsec so that, as a general rule, the iPIX shutter-time should never decreasebelow 10−4 µsec to be sure that all pixel output signals generated in the photon energy range ofinterest (10 keV–1.5MeV) will be fully recorded.
3.3 Dose rate linearity
The variation of the iPIX count rates with respect to the reference dose rates was studied at theCANBERRA big irradiator considering the two masks R7e4 (see figure 24) and R7e8. Again, thesemasks provide quite similar results. In fact, depending on the chosen shutter-time, almost all thedose rate response curves are linear along a given range until reaching a maximum, after which theradioactive hotspot is no longer localized. These curves finally drop off towards a full saturation ofthe Timepix detector when a single cluster containing all of its pixels is registered. It can be alsoseen in figure 24 that the iPIX dose rate response may be considered as quite linear over a widerange reaching nearly 8 decades (10−6–101 Sv/h) if the Timepix shutter-time is correctly chosen toavoid signal distortions due to pulse pile-up and/or summation effects.
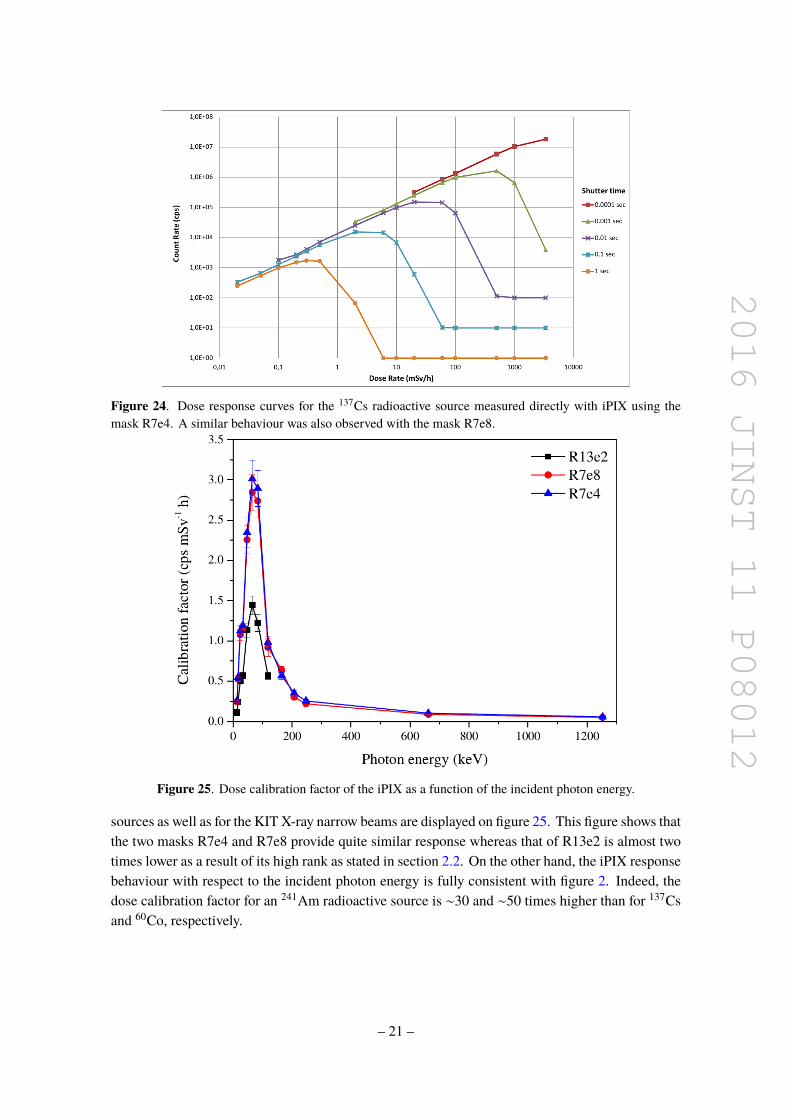
3.4 Dose calibration factor vs. incident photon energy
The iPIX dose calibration factor is energy dependent and is defined as the number of the registerednet counts per second (cps) divided by the photon ambient dose equivalent rate (in mSv/h units)at the measurement point. The corresponding values obtained for all the CANBERRA radioactive
– 20 –
2016 JINST 11 P08012
Figure 24. Dose response curves for the 137Cs radioactive source measured directly with iPIX using themask R7e4. A similar behaviour was also observed with the mask R7e8.
Figure 25. Dose calibration factor of the iPIX as a function of the incident photon energy.
sources as well as for the KIT X-ray narrow beams are displayed on figure 25. This figure shows thatthe two masks R7e4 and R7e8 provide quite similar response whereas that of R13e2 is almost twotimes lower as a result of its high rank as stated in section 2.2. On the other hand, the iPIX responsebehaviour with respect to the incident photon energy is fully consistent with figure 2. Indeed, thedose calibration factor for an 241Am radioactive source is ∼30 and ∼50 times higher than for 137Csand 60Co, respectively.
– 21 –

2016 JINST 11 P08012
3.5 Cluster sizes vs. incident photon energy
In this section, we examine the dependence of the cluster size with respect to incident photon energy.In each case, the shutter-time was appropriately chosen to avoid signal distortions on the Timepixdetector due to pulse pile-up and/or summation effects. Once again, as all the coded-aperture masksprovide quite similar results, only those obtained with themask R7e8 are shown in figures 26 and 27.
Figure 26. Cluster size distributions measured with the mask R7e8 for the X-ray narrow beams.
According to figure 26 a discrimination criterion, especially between low (e.g. 241Am) andhigh photon energies (e.g. 137Cs and 60Co), can be applied but only for a qualitative analysis toestimate an energy range of the observed hotspot(s). Conversely, the same criterion is not practicalto quantify the individual contribution of a given radionuclide to the overall dose rate as the clustersize distributions generated by different photon energies are significantly overlapping. In otherwords, there is not a clearly distinguishable signature in terms of cluster size distribution allowingboth identification and quantification of radionuclides.
Another aspect to remark is that an upper size threshold of 20 pixels can be applied to discardunwanted cluster events such as the ones that may be generated by cosmic rays.
3.6 Sensitivity and influence of background radiation
The iPIX sensitivity has been studied with the low-activity point sources listed on table 3 butplacing the CANBERRA small irradiator (figure 9) behind it in order to simulate, if needed,different background contributions. All the results obtained directly using the iPIX automatic
– 22 –

2016 JINST 11 P08012
Figure 27. Cluster size distributions measured with the mask R7e8 for 137Cs and 60Co.
mode1 and with the small irradiator entirely shielded are summarized in figures 28 and 30. Here,the natural background radiation dose rate at the iPIX location was previously monitored and it waswithin 0.1–0.2 µSv/h.
Table 3. Low-activity point sources used for sensitivity measurements.Radionuclide Current activity Distance H∗(10)
60Co 226 kBq 22.3 cm 2 µSv/h241Am 412 kBq 48.0 cm 10 nSv/h137Cs 368 kBq 61.5 cm 100 nSv/h
Table 4. Minimum localization time (considering data collection only).241Am 137Cs 60Co
(10 nSv/h) (100 nSv/h) (2.0 µSv/h)R13e2 50 sec — —R7e4 4 sec 190 sec 70 secR7e8 — 120 sec 60 sec
It can be observed in these figures that iPIX, once positioned, was fully able to localize byitself — without any further actions from the user — all the low-activity sources listed in table 3.Two criteria must be usually satisfied to decide if a radioactive source is adequately localized: 1)apparition of a hotspot in a clean picture without any kind of interferences or misleading artifacts,and 2) the corresponding peak is quite differentiated in a 3D profile plot, which shows the registeredcounts associated to each Timepix pixel after the de-convolution process (see section 2.2). Anotheraspect to highlight is that the parallax correction is no longer possible at source-to-detector distancesless than 50 cm (see the mismatch between the actual location of the considered radioactive sourcesand that of the associated colored hotspots as determined by iPIX in figures 28 and 29).
1Under which iPIX is able to autonomously select, among other parameters, the appropriate shutter-time and theminimum number of frames needed for every measurement environment.
– 23 –

2016 JINST 11 P08012
Figu
re28
.Measurementresultsof
iPIX
obtained
with
a226kB
q60Co
pointsourcelocatedat
adista
nceof
22.3
cmwith
varie
dbackground
radiation.
The
locatio
nof
theconsidered
radioactivesourcesa
reindicatedby
whitearrows.
– 24 –

2016 JINST 11 P08012
Figu
re29.Measurementresultsof
iPIX
obtained
with
a412kB
q24
1 Am
pointsourcelocatedat
adista
nceof
48cm
with
varie
dbackground
radiation.
The
locatio
nof
theconsidered
radioactivesourcesa
reindicatedby
whitearrows.
– 25 –

2016 JINST 11 P08012
Figu
re30
.Measurementresultsof
iPIX
obtained
with
a368kB
q13
7 Cspointsourcelocatedat
adista
nceof
64.5
cmwith
varie
dbackground
radiation.
The
locatio
nof
theconsidered
radioactivesourcesa
reindicatedby
whitearrows.
– 26 –
2016 JINST 11 P08012
Theminimum times needed, considering data collection only, to localize the above low-activitypoint sources are summarized in table 4. In all cases, the mask R7e8 mask always gives the fastestlocalization time. Moreover, iPIX was able to localize the 412 kBq 241Am point source, providinga dose rate at the measurement point of only 2 nSv/h, with a minimum of 70 frames of 1 secshutter-time. Additional measurements were also carried out as shown in table 5 to prove that iPIXhas better performances than the CARTOGAM system.
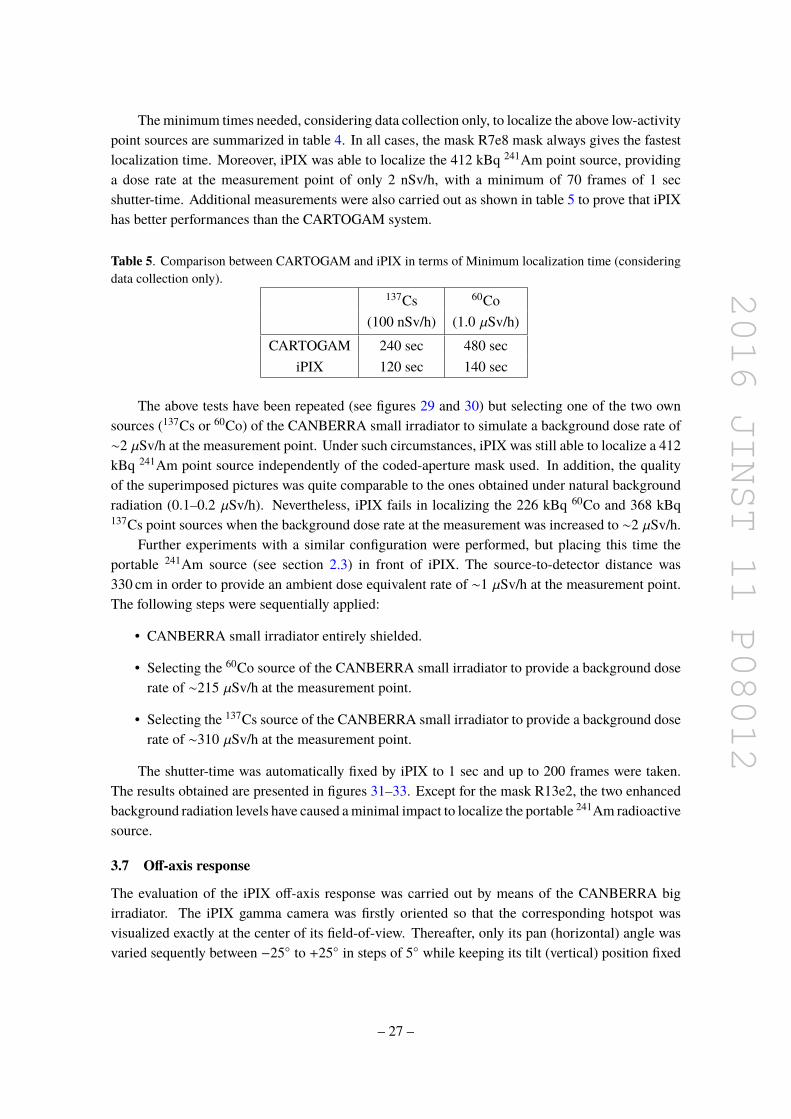
Table 5. Comparison between CARTOGAM and iPIX in terms of Minimum localization time (consideringdata collection only).
137Cs 60Co(100 nSv/h) (1.0 µSv/h)
CARTOGAM 240 sec 480 seciPIX 120 sec 140 sec
The above tests have been repeated (see figures 29 and 30) but selecting one of the two ownsources (137Cs or 60Co) of the CANBERRA small irradiator to simulate a background dose rate of∼2 µSv/h at the measurement point. Under such circumstances, iPIX was still able to localize a 412kBq 241Am point source independently of the coded-aperture mask used. In addition, the qualityof the superimposed pictures was quite comparable to the ones obtained under natural backgroundradiation (0.1–0.2 µSv/h). Nevertheless, iPIX fails in localizing the 226 kBq 60Co and 368 kBq137Cs point sources when the background dose rate at the measurement was increased to ∼2 µSv/h.
Further experiments with a similar configuration were performed, but placing this time theportable 241Am source (see section 2.3) in front of iPIX. The source-to-detector distance was330 cm in order to provide an ambient dose equivalent rate of ∼1 µSv/h at the measurement point.The following steps were sequentially applied:
• CANBERRA small irradiator entirely shielded.
• Selecting the 60Co source of the CANBERRA small irradiator to provide a background doserate of ∼215 µSv/h at the measurement point.
• Selecting the 137Cs source of the CANBERRA small irradiator to provide a background doserate of ∼310 µSv/h at the measurement point.
The shutter-time was automatically fixed by iPIX to 1 sec and up to 200 frames were taken.The results obtained are presented in figures 31–33. Except for the mask R13e2, the two enhancedbackground radiation levels have caused aminimal impact to localize the portable 241Am radioactivesource.
3.7 Off-axis response
The evaluation of the iPIX off-axis response was carried out by means of the CANBERRA bigirradiator. The iPIX gamma camera was firstly oriented so that the corresponding hotspot wasvisualized exactly at the center of its field-of-view. Thereafter, only its pan (horizontal) angle wasvaried sequently between −25◦ to +25◦ in steps of 5◦ while keeping its tilt (vertical) position fixed
– 27 –

2016 JINST 11 P08012
R7e8 R7e4 R13e2
Figure 31. Results obtained for the 1.85 GBq 137Am source located at a distance of 330 cm to the iPIX withnatural background radiation condition (0.1–0.2 µSv/h).
R7e8 R7e4 R13e2
Figure 32. Results obtained for the 1.85 GBq 137Am source located at a distance of 330 cm to the iPIX withan enhanced background dose rate of ∼310 µSv/h generated by the 137Cs source of the CANBERRA smallirradiator.
to 0◦, and vice versa. The measurements were performed using the masks R7e4 and R7e8. The−25◦ to +25◦ variation was considered to include the whole iPIX field-of-view.
The observed loss in counts for each mask was very similar with respect to both pan and tiltrotation angles. Figure 34 shows the average count rates, normalized to normal incidence (Pan = Tilt= 0◦), measured with these two masks at varied pan or tilt rotation angle. The response deviationfrom an ideal behaviour (i.e., following the cosine function represented by a red dashed curve in
– 28 –

2016 JINST 11 P08012
R7e8 R7e4 R13e2
Figure 33. Results obtained for the 1.85 GBq 137Am source located at a distance of 330 cm to the iPIX withan enhanced background dose rate of ∼215 µSv/h generated by the 60Co source of the CANBERRA smallirradiator.
figure 34) is within 3%–12% for the mask R7e4 and never exceeds the limit of 25% for the maskR7e8. These deviations, which can be considered as negligible from the perspective of radiationdosimetry, are mainly due to the collimation effect of incident photons at the same coded-aperturemask. Admittedly, as illustrated in figure 35, the number of transmitted photons is decreased undernon-normal incidences and thicker masks affecting moreover the shape of the projected open holes(they become oval instead of round) at the detector surface.
Nevertheless, as proved with a preliminary proof-of-concept prototype of iPIX [8], the self-attenuation effect is even more accentuated at low-energy photons (241Am like sources) and thecorresponding decrease in the iPIX response may surpass 50% for both the mask R13e2 and R7e4(or even 80% for the mask R7e8) when the non-normal incidence is above 10◦.
Concerning hotspot visualization, figure 36 displays an example of the superimposed picturesobtained at varied pan angles. According to this figure, a mirroring effect (i.e., false hotspotlocalization on the opposite side) may occur at the limit of the iPIX field-of-view (±25◦). Asillustrated in figure 37, this misleading artifact is caused by the projection on the detector surfaceof identical portions of the mask pattern. Therefore, it is suggested to systemically repeat anymeasurement resulting in a peripheral radioactive hotspot until this last is being targeted moredirectly. This will also have the benefit of increasing measurement statistics by mitigating the maskself-collimation effect.
3.8 Angular resolution
An important requirement in gamma imaging is the ability to track several radioactive sources atthe same time. The angular resolution, θ, is the most convenient parameter to define the distinctionlimit between two small and adjacent radioactive sources. Theoretically, it depends on the diameter,d, of the open holes on the coded-aperture mask used and the distance, D, between the outer surface
– 29 –

2016 JINST 11 P08012
Figure 34. Normalized count rates observed for the masks R7e4 and R7e8 at varied pan or tilt rotation anglesobtained with the 137Cs source.
Figure 35. Mask self-collimation effect.
of this mask and the Timepix detector, as follows:
θcalculated = tan−1(
dD
). (3.1)
As illustrated in figure 38, the angular resolution can also be experimentally estimated from thevertical or horizontal axial profile of the hotspot peak, taking into account the associated FWHM(Full With at Half Maximum). Since the iPIX field-of-view (FOV) has a square shape, its sidecorresponds to the maximum number of available pixels (i.e., 256) on the considered axis and wecan write then:
θmeasured =FOV × FWHM
256. (3.2)
The theoretical and experimental angular resolutions for the three iPIX masks are summarizedin table 6. According to this table, the experimental values obtained with the three masks agreeto within 68% (± 1σ) confidence level of their associated uncertainties with the theoretical ones.They also confirm that the angular resolution does not depend on the incident photon energy.
– 30 –

2016 JINST 11 P08012
0◦+5◦
+10◦
+15◦
+20◦
+25◦
Figu
re36.iPIXresults
atvarie
dpanangles.
– 31 –

2016 JINST 11 P08012
Figure 37. Illustration of the mirroring effect at the limit of the iPIX field-of-view. Radiation of the twoperipheral sources (radiation direction indicated with red and blue arrows) project identical portions of themask pattern on the detector surface.
Figure 38. Vertical or horizontal axial profile the hotspot peak.
Table 6. Determination of the iPIX angular resolution.θmeasured
θcalculated241Am 137Cs 60Co
R13e2 2.5◦ 2.8◦ ± 0.6◦ — —R7e4 6.0◦ 6.2◦ ± 0.6◦ 6.0◦ ± 0.6◦ 5.9◦ ± 0.6◦
R7e8 5.0◦ — 5.6◦ ± 0.7◦ 5.4◦ ± 0.7◦
To illustrate the optimal angular resolution of iPIX when compared to the existing gammaimagers [5, 21], additional measurements were also carried out using three identical low-activity241Am point sources (340 kBq). These sources were placed on a horizontal line at 40 cm distance(i.e., providing 3 × 12 nSv/h dose rates at the measurement point). As summarized in figure 39, thefollowing experimental configurations were considered:
a. All the sources were close to each other but the outside sources have remained separated fromthe central one by ∼4 cm, which is the diameter of their circular support. This representsaround ±6◦ separation angle.
b. The outside sources were separated by ±5 cm (i.e., ±7◦) from the central source.
c. The outside sources were separated by ±10 cm (i.e., ±14◦) from the central source.
– 32 –

2016 JINST 11 P08012
Satisfying results were obtained with the masks R7e4 and R7e8 (see figure 39 and figure 40,respectively). However, it is not possible to determine the exact location of each one of the threesources when they are very close to each other (i.e., ±6◦ separation angle). In addition, the strongdecrease of count rates at non-normal incidences corroborate themask self-collimation effect, whichhas already been discussed in the previous section. Due to this effect, the outside sources are lessvisible at ±14◦ separation angle.
±6 separation angle ±7 separation angle ±14 separation angle
Figure 39. Measurement results of three identical 241Am sources with mask R7e4 at different separationangles.
4 Conclusions
We have carried out a comprehensive experimental characterization of the iPIX gamma imager toexplore its main features and performances. In view of all the results obtained with ISO narrowX-ray beams at varied acceleration voltages and currents, we have observed that the Timepix shutter-time is the most critical parameter for an effective localization of radioactive hotspots and must beconveniently chosen to avoid signal distortions on the Timepix detector due to pulse pile-up and/orsummation effects.
Compared to existing gamma imagers, iPIX has an enhanced angular resolution (between2.5◦ and 6.0◦, depending on the coded-aperture mask used) and a high response sensitivity at lowenergies, tolerating at the same time high levels of background radiation (around 200–310 µSv/h).
Regarding its localization capability, an 241Am source providing only 2 nSv/h dose rate at themeasurement point was clearly spotted within 70 sec of data collection time. In the same way, iPIXwas able to localize low-activity 137Cs and 60Co sources (providing 100 nSv/h and 1 µSv/h doserates at the measurement point, respectively) with less than 2.5 min of data collection time.
This study has demonstrated that the mask R7e8 can be applied to almost the whole energyrange of interest (10 keV–1.5MeV). Whereas mask R13e2 is limited to only low photon energies
– 33 –

2016 JINST 11 P08012
±6 separation angle ±7 separation angle ±14 separation angle
Figure 40. Measurement results of three identical 241Am sources with mask R7e8 at different separationangles.
(e.g. 59 keV γ-rays of 241Am, whose detection usually indicates the presence of plutonium in nuclearwastes). As an intermediate application, mask R7e4 is able to localize radioactive sources in themedium photon energy range of 137Cs.
Finally, the iPIX dose rate response curve was equally checked with several standard 137Cssources of different activities showing a quite linear behaviour over a wide range covering nearly 8decades (10−6–101 Sv/h).
Acknowledgments
This study has been partially funded by the European Union Seventh Framework Programme,Marie Curie Actions, through the EDUSAFE Initial Training Network (EU FP7-PEOPLE-2012-ITN-316919). The authors would also like to acknowledge the staff of both CANBERRA and KIT(in particular T. Liedtke for providing figure 10) irradiation facilities for their valuable technicalsupport.
References
[1] International Atomic Energy Agency, Combating illicit trafficking in nuclear and other radioactivematerial. Reference manual, IAEA Nuclear Security Series No. 6, IAEA, Vienna Austria (2007).
[2] Nuclear Energy Agency, Strategic aspects of nuclear radiological emergency management. Planningfor Effective Decision Making. Consequence Management and Transition to Recovery, NEANo. 6387, OECD (2010).
[3] V. Schoepff et al., BOOSTER: Development of a Toolbox for Triage of a Large Groups of IndividualsExposed to Radioactive Material, IEEE Trans. Nucl. Sci. 61 (2014) 2210.
– 34 –

2016 JINST 11 P08012
[4] H.O. Anger, Use of a gamma-ray pinhole camera for in vivo studies, Nature 170 (1952) 200.
[5] O. Gal et al., CARTOGAM — a portable gamma camera for remote localization of radioactivesources in nuclear facilities, Nucl. Instrum. Meth. A 460(2001) 138.
[6] O. Gal et al., Development of a portable gamma camera with coded aperture, Nucl. Instrum. Meth. A565 (2006) 233.
[7] M. Gmar et al., GAMPIX: a new generation of gamma camera, Nucl. Instrum. Meth. A 652 (2011)638.
[8] K. Amgarou et al., Evaluation of the next generation gamma imager, in proceedings of the 3rdInternational Conference on Advancements in Nuclear Instrumentation Measurement Methods andtheir Applications (ANIMMA 2013), Marseille, France, June 23–27 (2013), IEEE (2013).
[9] X. Llopart, R. Ballabriga, M. Campbell, L. Tlustos and W. Wong, Timepix, a 65k programmable pixelreadout chip for arrival time, energy and/or photon counting measurements, Nucl. Instrum. Meth. A581 (2007) 485.
[10] R.H. Dicke, Scatter-Hole Cameras for X-Rays and Gamma Rays, J. Astrophys. 153 (1968) L101.
[11] G. Vedrenne and J.-L. Atteia, Gamma-Ray Bursts. The brightest explosions in the Universe,Springer-Verlag Berlin Heidelberg and Praxis Books (2009).
[12] J. Braga et al., A new mask-antimask coded-aperture telescope for hard X-ray astronomy, Exp. Astron.2 (1991) 101.
[13] International Organization for Standardization, X and gamma reference radiation for calibratingdosemeters and doserate meters and for determining their response as a function of photon energy —Part 4: Calibration of area and personal dosemeters in low energy X reference radiation fields,ISO/CD 4037-4 (2004).
[14] D. Turecek, T. Holy, J. Jakubek, S. Pospisil and Z. Vykydal, Pixelman: a multi-platform dataacquisition and processing software package for Medipix2, Timepix and Medipix3 detectors, 2011JINST 6 C01046.
[15] K. Akiba et al., The Timepix Telescope for High Performance Particle Tracking, Nucl. Instrum. Meth.A 723 (2013) 47 [arXiv:1304.5175].
[16] C. Teyssier et al., Performance of the Medipix and Timepix devices for the recognition ofelectron-gamma radiation fields, Nucl. Instrum. Meth. A 650 (2011) 92.
[17] J. Jakubek et al., Spectrometric properties of TimePix pixel detector for X-ray color and phasesensitive radiography, IEEE Nucl. Sci. Symp. Conf. Rec. (NSS/MIC) (2007) 2323.
[18] E.E. Fenimore and T.M. Cannon, Coded aperture imaging with uniformly redundant arrays, Appl.Opt. 17 (1978) 337.
[19] S.R. Gottesman and E.E. Fenimore, New family of binary arrays for coded aperture imaging, Appl.Opt. 28 (1989) 4344.
[20] ICRP, Conversion coefficients for use in radiological protection against external radiation, ICRPPublication 74, Ann. ICRP 26 (1996) 1 [Erratum ibid. 27 (1997) 1].
[21] C.G. Wahl et al., The Polaris-H imaging spectrometer, Nucl. Instrum. Meth. A 784 (2015) 377.
– 35 –