a comparative analysis of national innovation performance
TRANSCRIPT

A Comparative Analysis of the National Innovation Performance 1 University of Tartu
Faculty of Economics and Business Administration
A COMPARATIVE ANALYSIS OF NATIONAL INNOVATION
PERFORMANCE: THE BALTIC STATES IN THE EU
CONTEXT
Tiiu Paas, Helen Poltimäe
Tartu 2010

2 Tiiu Paas, Helen Poltimäe
ISSN-L 1406-5967 ISSN 1736-8995
ISBN 978-9985-4-0653-3 The University of Tartu FEBA
www.mtk.ut.ee/research/workingpapers

A Comparative Analysis of the National Innovation Performance 3
A Comparative Analysis of National Innovation Performance: the Baltic States in the EU Context
Tiiu Paas, Helen Poltimäe∗
Abstract
This paper bridges two approaches to assess national innovation performance based on European Innovation Scoreboard (EIS) composite indicators and the analysis of the factors that may be behind these indicators. The main focus of the study is on analysing the innovation performance of the Baltic States – small countries with similar post-socialist path dependence. Our aim is to explore what factors have been most influential in developing the different levels of innovation performance in these countries, and whether these differences are also captured by innovation measurement indicators. Our analysis shows that the inability to sufficiently capture the quality of human capital, the small
∗ Tiiu Paas, Professor of Econometrics, University of Tartu, Faculty of Economics and Business Administration, Narva Rd 4-A209, Tartu, 51009, Estonia. E-mail: [email protected] Helen Poltimäe, PhD student, University of Tartu, Faculty of Economics and Business Administration, Narva Rd 4-A208, Tartu, 51009, Estonia. Email: [email protected] The authors of the paper are grateful for the Estonian Ministry of Education and Science (grant No SF0180037s08) and the Estonian Science Foundation (research grant No 7756) for their financial support. We are also thankful for the valuable feedback and comments received from our colleagues during several seminars and discussions. Our particular thanks belong to Jaan Masso and Priit Vahter for their stimulating suggestions that helped us remarkably in refining the last version of this paper. The views expressed in the paper are solely those of the authors and, as such, should not be attributed to other parties.

4 Tiiu Paas, Helen Poltimäe
economy effect (i.e. high dependence on single enterprises in a sector) and data availability issues represent remarkable measurement problems. The measurement results may also be biased as a result of self-reporting indicators. This conclusion was confirmed by comparing the EIS evaluations with the results of our assessment via factor analysis. The results are robust. Estonian innovation performance seems to be ahead of the other two Baltic countries; the main causes have been the successful attraction of foreign investment, favourable tax policy and possible positive spillover effects from the Nordic neighbourhood, particularly Finland and Sweden.
JEL Classification: O3, O1, C8, I2
Keywords: national innovation performance, innovation measurement problems, composite indicators, the Baltic States

A Comparative Analysis of the National Innovation Performance 5
1. INTRODUCTION
It is a widespread belief that innovation is a necessary assumption for the economic growth of a country, region or enterprise. The concept of innovation and the methods for measuring it have been under constant dispute for decades. Without doubt, the measurement of innovation and its dynamics is of great importance for theoretical and empirical analysis of growth models, and to support the decision-making process of potential investors. We build on the argument by Archibugi et al (2009) that supporting the important role of statistical data in improving national technological capabilities also supports the measurement of innovation. We emphasise that there are at least three good reasons why innovation measurement is important. First, innovation assessment is important for the theoretical analysis and development of innovation theories. Statistical indicators can be used to test innovation theories and to broaden our knowledge of technological change and innovation as the determinants of economic growth, productivity, competitiveness and employment. Second, the assessment of innovation is important for the development and implementation of public policies. Statistical indicators on innovation and technological change allow us to identify national strengths and weaknesses and provide fundamental sources for carrying out effective innovation policy. Third, the results of innovation assessment are important inputs for the development of company strategy. Data on the technological capability and innovation of different countries make it possible to acquire a better understanding of the geographical contexts in which firms can develop and establish their innovative activities and make necessary investments.
Historically, innovation measurement has mainly been based on single indicators like R&D investments, number of patents, etc. However, these indicators generally reflect only one aspect of the complex phenomenon of innovation and do not provide a comprehensive overview. The role of composite indicators of innovation has remarkably increased in the assessment of the innovation processes in recent decades. Of course, as composite

6 Tiiu Paas, Helen Poltimäe
indicators retrieve information from several sources and are elaborated using different aggregation methods, several problems arise (e.g. see Nardo et al 2005; Hollanders and Arundel 2007; Grupp and Schubert 2010). Still, composite indicators are the best tool available for analysing the innovation environment and performance especially at the national level.
Composite indicators are widely used to compare a variety of countries with different backgrounds and levels of development, but these indicators do not tell us much about the country-specific innovation environment. At the same time, there is a separate branch of innovation literature (e.g. Edquist and Hommen 2008), which analyses national innovation systems, characterising only a specific country and discussing factors that may impact innovation performance in the country in question. In this paper we try to bridge these two approaches. First, we conduct a comparative analysis of the innovation performance of the countries using composite indicators, and second, we analyse factors that may explain the differences in innovation performance between the countries. We mainly rely on the European Innovation Scoreboard (EIS) methodology and several international and national data sources. Additionally, we implement a factor analysis in order to elaborate alternative composite indicators for the comparative assessment of national innovation performance and to test the robustness of the EIS methodology.
The main focus of this study is on analysing the innovation performance of the Baltic States – small countries, which have similar post-socialist path dependence; their economies are also comparable in size. Our aim is to explore what factors have been the most influential in the innovation performance of these countries, and whether these are captured by the EIS indicators. We believe that the results of our analysis will provide additional understanding for the development of innovation assessment methodologies taking into account the size and path dependence of an economy. The overwhelming aim of the study is to generate new information for elaborating policy proposals and for making decisions that support the development of national innovation performance.

A Comparative Analysis of the National Innovation Performance 7
As Fagerberg and Srholec (2008) have pointed out that differences in nature, geography and history influence the ability of a country to develop a well-functioning innovation system. In that sense, the Baltic States are an especially interesting case for studying innovation performance as well as the factors behind the differences. According to the European Innovation Survey 2008 (EIS 2008), Estonia belongs to the group of moderate innovators; the two other Baltic States, Latvia and Lithuania, belong to the group of catching-up innovators. The Summary Innovation Index (SII) in 2008 for Estonia was 0.454, for Lithuania 0.294 and Latvia 0.239, while the EU27 average was 0.475.
Since regaining their independence in 1991, the Baltic States have undergone similar processes of economic, political and social transformation. Under the Washington Consensus policy framework these countries aimed to create stability and international trust as well as attractiveness for foreign direct investments through a fixed exchange rate, balanced state budget and comparatively low tax and administrative burdens. In the late 1990s, the transition and restructuring paradigms were replaced by the concepts of catching up and economic convergence to the level of the developed economies of the enlarged EU. Unfortunately, large amounts of foreign investment and private lending went into financing consumption and the real estate boom, and as a consequence the export competitiveness of the Baltic economies started to weaken in the 2000s (see also Estonian Development Fund Report 2008). Also, the deepening downturn in the main trading partners of the Baltic States during the recent global crisis has remarkably weakened the economic outlook for these countries. In order to overcome the negative consequences of the recent downturn and to improve the economic outlook, the development of the knowledge-intensive sectors and innovations that promote export growth and increased productivity are unavoidable in all three Baltic States. Estonia is the only country from among the three Baltic States that is joining the euro zone in 2011. Adopting the euro in itself is unlikely to trigger any major change in the pace of recovery, but it will remove liquidity risks, add stability to the economy and help attract new investments.

8 Tiiu Paas, Helen Poltimäe
This paper is structured as follows. In the following section we present the theoretical and methodological framework for analysing national innovation performance. The third and fourth sections present the results of the comparative analysis of innovation performance in the Baltic States based on two methodological approaches – firstly a comparative analysis based on EIS, and secondly, a factor analysis as a multivariate analysis technique. The paper ends up with conclusions and discussion.
2. THEORETICAL AND METHODOLOGICAL FRAMEWORK FOR ANALYSING NATIONAL INNOVATION PERFORMANCE
2.1. Theoretical framework for assessing national innovation performance
The literature about innovation and its measurement has evolved with an understanding of the innovation process. Rodriguez-Pose and Crescenzi (2008) divide innovation theories aiming at establishing a link with economic growth into three categories: the linear model, systems of innovation and the knowledge spillovers approach. Landry et al (2002) have divided the evolution of innovation theories into five: the engineering theories of innovation, the market pull theories of innovation, the chain-link theories of innovation, the technological network theories of innovation and the social network theories of innovation. According to Marinova and Phillimore (2003), there are six innovation models: the black box model, linear models, interactive models, system models, evolutionary models and the innovative milieu. In general, we can observe that these classifications start with science-push and market-driven innovation theories and end with innovation theories that imply that innovation is knowledge-based, but also very dependent on social networks.
A Comparative Analysis of the National Innovation Performance 9
Another direction in the development of innovation literature belongs to a deeper consideration of the viewpoint that a firm does not innovate in isolation, but depends on extensive interaction with its environment. Various concepts have been introduced to enhance the understanding of this phenomenon, most of them including the terms ‘system’ or ‘network’ and “national innovation systems” (NIS) (e.g. see Fagerberg 2005). The research based on the NIS concept is mostly a qualitative analysis of a selected country’s innovation system. The analysis is presented, for example, as country chapters of a book, and there might also be a chapter with a comparative analysis of the innovation performance of countries (see e.g. Edquist and Hommen 2008). The NIS concept has initially been applied to developed European countries (Lundvall et al 2002). Lately, it has also been applied to less developed countries. For example, countries are divided in two: rapid growth countries (Taiwan, Singapore, Korea, Ireland and Hong Kong) and slow growth countries (Sweden, Norway, the Netherlands, Finland and Denmark) (see Edquist and Hommen, 2008). Still, the country coverage is rather limited.
The NIS based approach has been applied for analysing the consequences of the recent global economic crisis. A recent study by Filipetti and Archibugi (2010) showed that during the crisis, countries endowed with a stronger NIS are less affected and are better able to respond, while the most negative effect has emerged for the new EU Member States. They claim that although qualified human resources has a crucial role in levelling the effect of crisis, this is not the case for the previously planned economies, which have not yet been fully incorporated into the new competitive economy. We do not fully follow this viewpoint, putting attention on the fact that the new member states are all included in the same cluster, and no further possible distinctions between the new Member States are drawn. But the development patterns in these countries differ remarkably. Thus, both a case by case (or country by country) analysis in combination with cross-country comparative analysis of national innovation performance should be conducted in order to make profound conclusions about the potential consequences of economic crisis and the behaviour of national economies during crises.

10 Tiiu Paas, Helen Poltimäe
Innovation is a complex phenomenon and it has been studied on various levels: at national, regional, sector and firm levels. There is a lot of literature that studies innovation at the regional level because “this level constitutes the essential thing that is changing in a process of evolutionary economic change” (Rodriguez-Pose and Crescenzi 2008). Our approach is limited to the analysis of innovation performance at the national level. We first of all focus on the viewpoint, which is also the basic idea behind the NIS concept, that differences in economic and technological performance across nations are due to the combination of institutions involved (Metcalfe, Ramlogan 2008). Innovation strongly depends on different institutions and their interaction, and national policies are extremely important in developing national innovation performance.
The measurement of innovation has developed together with the understanding of the innovation process. The development of innovation theories called for the need to develop methods for measuring innovation already in the 1980s (see Arundel et al 2008). Up until the 1980s, innovation research was largely limited to case studies or to data on the creation of new knowledge, as measured by R&D investments, scientific publications, patented inventions and the stock of scientists and engineers. Arising from that, the traditional indicators used for innovation analysis were R&D expenditures, data on patent applications and bibliometric data. But there are also several problems arising from the use of such innovation indicators (see also Smith 2005). Ordinarily these indicators reveal only one or some aspects of innovation performance; sometimes they reveal only the preconditions for innovation and do not have direct links to the economic outcomes. Also, the NIS based approach to studying innovation performance does not provide sufficient information for the comparative analysis of national innovation performance. At the same time, there is a certain need for the comparative assessment of national innovation performance; for example, policy-makers prefer short and quick overviews of cross-country innovation performance, like innovation scoreboards.

A Comparative Analysis of the National Innovation Performance 11
Stemming from the need for comprehensive information about innovation, different innovation surveys were started at the end of the 1980s and the beginning of the 1990s. According to Smith (2005), innovation surveys can be divided into two basic types: object approach and subject approach surveys. The object approach focuses on the innovation itself and records information on the output of the innovation process. Information is collected from new product announcements, expert surveys, innovation inventories and so on. The most important example of the object approach is the SPRU database, developed by the Science Policy Research Unit at the University of Sussex. However, innovation activities must be sufficiently innovative to be publicized in trade journals or the general press; this requirement may cause a sample selection bias (Archibugi, Sirilli 2001). The subject approach focuses on the innovating firm and records information on the input to the innovation process. The information is collected at the firm level using mail questionnaires or direct interviews. The most important example of the subject approach is the Community Innovation Survey (CIS). While object approach surveys can be accused of innovations having to pass a test of significance, the opposite criticism – subjectivism – holds for subject surveys like the CIS (IAREG 2008).
Despite the fact that some scientists are not very eager to use synthetic indicators to assess national innovation performances (e.g. Grupp and Schubert, 2010), the implementation of composite indicators to assess innovation has been widely used in the recent decade, and they are also widely studied. For example, Archibugi et al (2009) demonstrated that the different aggregate indexes are quite consistent and their advantages over simple traditional indicators (like R&D intensity) appear when analysing a relatively homogeneous group of countries, while for demonstrating the differences between heterogeneous countries, R&D intensity data may also be sufficient.
Different composite indicators are being elaborated by several international organisations and associations, such as the World Bank, UN institutions, the World Economic Forum, the Economic Commission and so on. Innovation scoreboards can mainly serve
12 Tiiu Paas, Helen Poltimäe
three policy needs (Arundel, Hollanders 2008). First, they act as an ‘early warning’ system for potential problems at the national level. Second, if used over time, they can track changes in national strengths and weaknesses. And third, they can attract the interest of policy-makers, including civil servants and elected officials. In reality, mass media and politicians use these composite indicators intensively in their activities.
In Europe, the most widely set of the composite innovation indicators is the European Innovation Scoreboard (EIS). Of course, there are several problems related to these composite indicators and these are widely discussed in the literature. For example, Grupp and Schubert (2010) have criticized the weighting system in the EIS and find that the Summary Innovation Index is extremely non-robust to changes in weights. Schibany and Streicher (2008) bring out several problems in the EIS such as the selection of indicators, the mixture of short-term and long-term indicators, multicollinearity, the “more is better” assumption, outliers, statistical issues and comparability.
Regardless of the several discussions and arguments presented in the innovation literature, we find that composite indicators are feasible and practical tools for measuring and analysing such complex phenomena as innovation at least at the national level. We find that the EIS is an appropriate methodology that fits the aim of our study and allows us to analyse the innovation performance of the Baltic States and to generate new information for elaborating policy proposals that support the development of national innovation systems. In addition, in order to check the robustness of the results of the assessment, we also elaborate our own methodological approach that interlinks innovation inputs, outputs and processes based on the implementation of a factor analysis.
2.2. Data and methodology
In order to analyse the innovation performance of the Baltic States, we use EIS data, which has been published annually since 2001 to track and benchmark the relative innovation performance of the EU member states (Inno-metrics 2009). Up until 2007, the

A Comparative Analysis of the National Innovation Performance 13
indicators were grouped into two main categories: inputs and outputs. The methodology was revised for EIS 2008, and there are now three main categories:
1) “Enablers” capturing the main drivers of innovation that are external to the firm: “Human resources” and “Finance and support”.
2) “Firm activities” captures innovation efforts that firms undertake, comprising of “Firm investments”, “Linkages & entrepreneurship” and “Throughputs”.
3) “Outputs” capture “Innovators” – the number of firms that have introduced innovations onto the market and within their organisations; and “Economic effects”.
Altogether there are 29 innovation indicators covered by EIS 2008; more than half of them (16) are based on Eurostat databases. A remarkable number of indicators (8) are derived from the CIS. Other data sources are IMF, World Bank, Office of Harmonization for the Internal Market and Thomson/ISI.
According to the EIS evaluations, the EU member states are divided into four country groups: 1) innovation leaders, 2) innovation followers, 3) moderate innovators, and 4) catching-up countries (figure 1).
These country groups have been formed according to the Summary Innovation Index, which is calculated as a composite of the 29 EIS statistical indicators. The countries with an innovation performance above the EU27 average are the innovation leaders and followers. Those countries whose innovation performance is below the EU27 average are moderate innovators and catching-up countries. According to the latest evaluation (EIS-2008), Estonia belongs to the moderate innovators group; Latvia and Lithuania are somewhat behind, belonging to the group of catching-up countries.

14 Tiiu Paas, Helen Poltimäe
Figure 1. Country groups according to EIS for 2003–2008 Source: Inno-metrics 2008 & 2009
The EIS based classification of the countries has been robust for the period 2003–2008 (figure 1). Only some countries have changed their positions between the groups and these as a rule have small economies. Luxembourg changed its position twice: for 2004–2005 (moving from the group of innovation followers to the group of innovation leaders) and for 2007–2008 (moving from the group of innovation leaders again back to the group of innovation
2003 2004 2005 2006 2007 2008
FI DK DE UK
FI DK DE UK
SE SE SE
SE
SE
SE
FI DK DE UK LU
FI DK DE LU UK
FI DK DE UK LU
BE IE LU NL FR AT
LU BE NL IE FR AT
IE BE NL FR AT
IE BE FR NL AT
IE AT NL FR BE
EE IT CZ SI ES
SI EE CZ IT ES
EE SI CZ IT ES CY MT
EE SI CZ IT ES CY MT
EE CZ SI IT CY ES MT LT
CY MT EL HU LT SK PL PT BG
EL HU LT PT SK PL BG LV RO
CY MT EL HU PT LT SK PL BG
LT PT HU EL SK PL BG LV RO
HU EL PT SK PL BG LV RO
LV RO
LV RO
FI DE DK UK
AT IE LU BE FR NL
CY EE SI CZ ES PT GR IT
MT HU SK PL LT RO LV BG

A Comparative Analysis of the National Innovation Performance 15
followers). Cyprus and Malta improved their innovative position for 2004–2005 moving from the group of catching-up countries to the group of moderate innovators, but Malta fell back to the catching-up group in 2007–2008. Similar dynamics can be witnessed for Lithuania, which moved from the group of catching-up countries to the group of moderate innovators for 2006–2007 and fell back to the group of catching-up counties for 2007–2008. Greece and Portugal improved their innovative position for 2007–2008 belonging to the group of moderate innovators in 2008. We can see more changes in the assessment results for the years 2005 and 2008, when the EIS methodology was remarkably developed.
The movements of the countries between the EIS based classification groups confirm our opinion that despite the fact that the EIS results are rather robust, the innovation measurement results are still sensitive to the assessment methodology and the indicators selected as well as to several statistical issues and other measurement problems that EIS has been criticized for (see for example Schibany and Streicher 2009). Small countries are particularly sensitive to these innovation measurement problems.
Thus, the EIS is continually in its development stage confirming the necessity to continuously analyse the assessment results for national innovation performance focusing on the measurement problems that may cause biased results. The main trends in the development of the EIS methodology are induced by the necessity 1) to measure new forms of innovation; 2) to assess overall innovation performance; 3) to improve the comparability at national, regional and international levels; and 4) to measure progress and changes over time (see also Hollander and van Cruysen, 2008).
The new indicators included in EIS-2008 first of all focus on the better reflection of private-public cooperation (co-publications per million population), firm renewal (SMEs entries and exits; % of SMEs), the use of private credit (relative to GDP), the role technological innovators (% of SMEs), the improvement of resource efficiency indicators (the use of labour, energy and

16 Tiiu Paas, Helen Poltimäe
materials), development knowledge-intensive services exports (% of total services exports) and so on. As can already be seen in figure 1, the recent developments in EIS methodology in 2008 were first of all reflected in the evaluation results of the national innovation performance for small (Malta, Lithuania) and southern European countries (Portugal, Greece). The overall assessment results are still rather stable, indicating that the EIS methodology is providing robust results.
The changes in the choice of initial indicators and the improvements to the EIS methodology reflect changes in our understanding of the innovation process and the development of innovation models. The majority of the EIS indicators are still better suited to capturing science-based innovation; only some improvements made in EIS-2008 capture indicators that reflect the core ideas of the user and open innovation models. Thus, the development of the EIS methodology is natural progress, at least being in accordance with the three reasons for the measurement of innovation and comparative assessment of national innovation performance mentioned as important in the introductory part of the paper.
3. THE INNOVATION PERFORMANCE OF THE BALTIC STATES
3.1. The composite indicators of national innovation performance
We start with an analysis of the innovation performance of the Baltic States and focus first on the EIS Summary Innovation Index. In figure 2, the Summary Innovation Index of the EIS is presented for the Baltic States and the EU27 average. The Summary Innovation Index reflects the following six dimensions of national innovation performance: 1) human resources; 2) finance & support; 3) firm investments; 4) linkages & entrepreneurship; 5) throughputs; 6) innovators; and 7) economic effects.

A Comparative Analysis of the National Innovation Performance 17
Figure 2. The Summary Innovation Index using dimensions of the European Innovation Scoreboard for the Baltic States and EU27 average in 2008 (composed by the authors based on EIS 2008)
Two of the dimensions presented in figure 2 (human resources and finance & support) capture the main drivers of innovation that are external to firms in the Baltic States belonging to the group (or category) of innovation indicators called “Enablers” and representing first of all the preconditions for innovation (inputs).
The next three groups of indicators (firm investments, linkages & entrepreneurship and throughputs) capture the innovation efforts that the firms undertake, and they belong to the category of innovation indicators called “Firm activities”. This group of indicators reflect possible activities that the firms pursue in order to transform innovation inputs to outputs.
The last two groups of indicators (innovators and economic effects) belong to the category of indicators called “Outputs”, and they reflect the outputs of the innovation activities. The group of indicators called “Innovators” represent the number of firms that have introduced innovations onto the market, and the group of indicators called “Economic effects” represent the factors that are external to the firms.

18 Tiiu Paas, Helen Poltimäe
Based on figure 2 we can conclude that although one aspect of the innovation input – human resources – is at a comparatively good level in the Baltic States, the transformation process to innovation output has been more successful in Estonia than in Latvia and Lithuania. Estonia is doing better than the EU27 average in several categories, such as human resources, firm investments, linkages & entrepreneurship and innovators. At the same time, Estonia is lagging behind in economic effects and especially in throughputs. Lithuania is doing comparatively well in human resources and linkages & entrepreneurship, but lagging behind in the other dimensions. Latvia’s innovation performance is the lowest among the Baltic States. Regardless of the good performance in human resources, the performance in other dimensions is low.
3.2. The analysis of the components of the composite indicators assessing national innovation performance
In this part of our study we will use additional data sources (e.g. Estonian Development Fund Report 2008; the data from the national statistical authorities of the Baltic States; Eurostat, etc) in order to shed light on what is behind the indicators used in the EIS. We analyse these additional indicators in more detail to discuss the possible shortcomings of innovation measurement using the EIS.
Enablers
The enablers (or inputs) of innovation consist of two parts: human and financial resources (table 1). We first concentrate on the “human capital” indicators. As we can see from table 1 the number of graduates gives the best position to Lithuania: there are 60.3 graduates per 1000 population aged 20-29, for Latvia this indicator is 56.4 and for Estonia 38.2. Estonia is lagging behind in youth education attainment levels, but has a good position in the Baltic States in terms of the number of participants in lifelong learning and the number of doctoral graduates and tertiary education in general. Latvia, regardless of its good performance in the number of graduates, is lagging behind in the number of doctoral graduates (0.24 per 1000 population aged 25-34; in Estonia 0.57 and in

A Comparative Analysis of the National Innovation Performance 19
Lithuania 0.61) and tertiary education in general. These indicators are summed up in the Summary Innovation Index and for the dimension “human capital”, the aggregate result for the Baltic countries is quite similar: Estonia 0.452; Latvia 0.421 and Lithuania 0.537. However, these aggregate numbers hide different education systems and associated problems.
Table 1. The indicator values for the Baltic States in EIS 2008, category “Enablers” Indicator EU27 Estonia Latvia Lithuania
ENABLERS
Human Resources 0.437 0.452 0.421 0.537
Science and engineering (SE) & social sciences and humanities (SSH) graduates per 1000 population aged 20-29
40.3 38.2 56.4 60.3
SE & SSH doctorate graduates per 1000 population aged 25-34
1.11 0.57 0.24 0.61
Tertiary education per 100 population aged 25-64
23.5 24.3 22.6 28.9
Participation in lifelong learning per 100 population aged 25-64
9.7 7.8 7.1 5.3
Youth education attainment level 78.1 72.5 80.2 89.0
Finance and support 0.552 0.509 0.376 0.376
Public R&D expenditures (% of GDP)
0.65 0.58 0.42 0.58
Venture capital (% of GDP) 0.107 -- -- -- Private credit (relative to GDP) 1.31 0.94 0.93 0.61 Broadband access by firms (% of firms)
77.0 78.9 57.0 53.0
Source: Inno-metrics (2009)
Although the Baltic States started with a similar platform of a Soviet structure of education and science, these three countries chose different ways to reform their education systems. The main distinctive features of the transformation are: a more thoughtful approach to reform in Estonia, radical reform in Latvia and gradualism and gentleness in the Lithuanian reform (see also Kristapsons et al 2003). The results of these reforms are different as well.

20 Tiiu Paas, Helen Poltimäe
In 1990, just before the collapse of the Soviet Union, scientists in Estonia, Latvia and Lithuania published approximately 300 papers per year in journals indexed by Thomson Reuters Web of Science (Allik 2008). By 2007 this number had more than tripled for Estonia and Lithuania (1295 and 1067 respectively), but has not changed much for Latvia (426) (Ibid). There are several problems in Latvian higher education; some of the problems are as follows: absenteeism resulting from combining work and studies, aging academia, insufficient number of publications in peer-reviewed journals and inability to provide potential entrepreneurs with the human capital that facilitates innovativeness (Dombrovsky 2009, Kristapsons et al 2003).
Although Estonian and Lithuanian education seems to be on more solid ground, especially as measured by bibliometric indicators, they are still some distance from leading European countries. Several aspects of education are alarming. For example, if we compare the public spending on education, this is quite similar to the EU27 average: the average was 4.98% of GDP for the EU27 in 2007, 4.85 for Estonia, 5.00 for Latvia and 4.67 for Lithuania (table 2). At the same time, GDP per capita (PPP) in the Baltic States is remarkably below the EU-27 average. According to the Eurostat data, this indicator formed only around 60% in Estonia, 57% in Lithuania and only 48% in Latvia in 2009. This means that the Baltic States can invest much less in the development of their education compared to the more developed EU countries. It is evident that in order to develop an education system which is fully comparable with high international standards, a country needs to invest almost the same or at least approximately the same amount of money (of course, taking into account PPP) in education and science.
The proportion of the financial aid to pupils and students is remarkably lower in the Baltic States than in the EU27: the respective numbers are 3.6% of total public expenditure on education for Estonia, 4.3% for Latvia and 4.5% for Lithuania, while the EU27 average is 6.5% (table 2). Consequently, students

A Comparative Analysis of the National Innovation Performance 21
in the Baltic States are more eager to work to earn a living during their studies and that might cause problems with graduation.
Table 2. Total public expenditure on education and financial aid to pupils and students, 2007 EU27 Estonia Latvia Lithuania
Total public expenditure on education as % of GDP
4.98 4.85 5.00 4.67
Primary level 1.16 1.13 1.24 0.67 Secondary level 2.21 2.25 2.11 2.41 Tertiary level 1.11 1.07 0.93 1.01 Financial aid to pupils and students as % of total public expenditure on education
6.5 3.6 4.3 4.5
Primary and secondary level 3.8 3.2 4.8 2.0 Tertiary level 17.4 6.3 5.1 14.5
Source: Eurostat 2010
If we look at vocational training in enterprises, the situation looks better in Estonia than in Latvia and Lithuania: the data we can use is from 2005 and it shows that while there were 67% of enterprises in Estonia doing any kind of vocational training, the same figure for Latvia was 36% and for Lithuania 46%. The EU27 average was 60% (Eurostat 2010). The educational problems that are discussed in Estonia are, for example, whether there is too high a proportion of university graduates compared to vocational education, and the inability of universities to provide skills necessary for enterprises.
None of these problems are actually captured by the EIS indicators. We can see that actually it is not only the proportion of highly educated people or the number of graduates that matters, but also the system: how the scientific results are measured and grants assigned, the intensity of the collaboration between science and enterprises and so on. We think that the latter is especially important in order to transform the good innovative potential of human resources into innovative activities in enterprises. If that is not present, the R&D activities and spending might never result in innovation. This can also be seen from the output section of the EIS.

22 Tiiu Paas, Helen Poltimäe
In order to increase innovation performance, much more attention should be given to educating and retraining the labour force in the forthcoming years than they have done during the economic boom. Also, cooperation between universities and enterprises should be significantly improved and made more effective. These suggestions are also in line with the recent study by Filippetti and Archibugi (2010), who show that the presence of qualified human resources plays a crucial role in surviving the crisis, but the high level of human resources in the new EU Member States have not fulfilled this role and the effect of the crisis is greater in these countries.
We now turn to the next category of enablers in the EIS: finance & support. According to the aggregate index, Estonia is doing better than Latvia and Lithuania. The respective indicators are 0.509 for Estonia and 0.376 for Latvia and Lithuania, while the EU27 average is 0.552 (table 1). As for public R&D expenditures, Estonia (the respective indicator is 0.58% of GDP) and Lithuania (0.58%) are quite close to the EU27 average (0.65%), but Latvia is a bit lower (0.42%). The Baltic countries are doing remarkably worse in private credit (EU27 average is 1.31% of GDP), and Lithuania is especially lagging behind (0.61%; the respective indicators for Estonia are 0.94% and 0.93%). As for broadband access, Estonia, which is known for its successful ICT development, is doing even better than the EU27 average (the percentage of firms that have broadband access is 77.0 for the EU27 and 78.9 for Estonia); the number is not so high for Latvia (57.0) and Lithuania (53.0). It is worth noting that the indicators for the dimension “finance & support” have been criticized for the “more is better” assumption. Some authors are particularly critical of the expenditure indicators (see Schibany and Streicher 2008). Thus, we should take the comparative analysis of these innovation input indicators with some caution.
In general, looking at the finance & support indicators, we can conclude that Estonia is doing comparatively well at enabling innovation in enterprises compared to the other two Baltic States. However, due to the aforementioned fact that research and
A Comparative Analysis of the National Innovation Performance 23
enterprises are not very strongly linked, the actual situation is not that promising as can be seen from the statistics. The picture is even worse for Latvia and Lithuania.
Firm activities
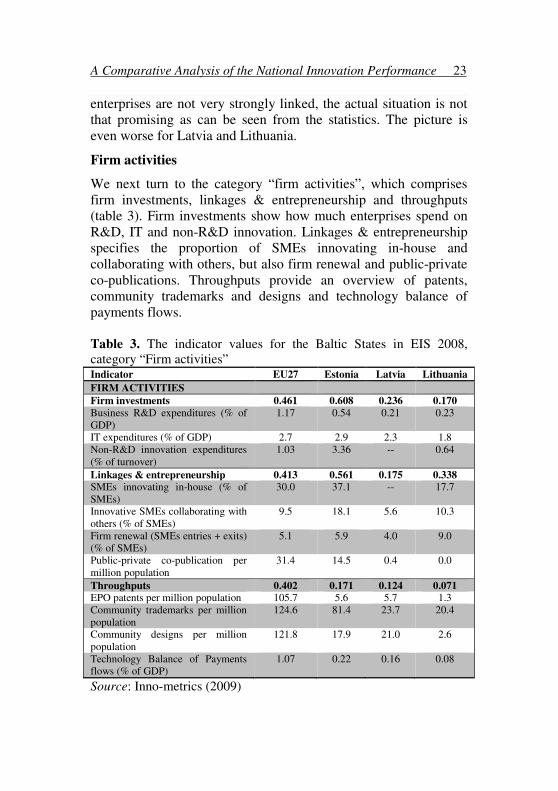
We next turn to the category “firm activities”, which comprises firm investments, linkages & entrepreneurship and throughputs (table 3). Firm investments show how much enterprises spend on R&D, IT and non-R&D innovation. Linkages & entrepreneurship specifies the proportion of SMEs innovating in-house and collaborating with others, but also firm renewal and public-private co-publications. Throughputs provide an overview of patents, community trademarks and designs and technology balance of payments flows.
Table 3. The indicator values for the Baltic States in EIS 2008, category “Firm activities” Indicator EU27 Estonia Latvia Lithuania
FIRM ACTIVITIES
Firm investments 0.461 0.608 0.236 0.170
Business R&D expenditures (% of GDP)
1.17 0.54 0.21 0.23
IT expenditures (% of GDP) 2.7 2.9 2.3 1.8 Non-R&D innovation expenditures (% of turnover)
1.03 3.36 -- 0.64
Linkages & entrepreneurship 0.413 0.561 0.175 0.338 SMEs innovating in-house (% of SMEs)
30.0 37.1 -- 17.7
Innovative SMEs collaborating with others (% of SMEs)
9.5 18.1 5.6 10.3
Firm renewal (SMEs entries + exits) (% of SMEs)
5.1 5.9 4.0 9.0
Public-private co-publication per million population
31.4 14.5 0.4 0.0
Throughputs 0.402 0.171 0.124 0.071 EPO patents per million population 105.7 5.6 5.7 1.3 Community trademarks per million population
124.6 81.4 23.7 20.4
Community designs per million population
121.8 17.9 21.0 2.6
Technology Balance of Payments flows (% of GDP)
1.07 0.22 0.16 0.08
Source: Inno-metrics (2009)

24 Tiiu Paas, Helen Poltimäe
According to the indicators in the group “Firm investments”, Estonia’s position in the dimension “Firms activities” is even better than the EU27 average. Thus, we try to explore whether there are some objective reasons or measurement problems behind this.
Regarding business R&D expenditures, all three Baltic States are behind the EU27 average. Business R&D expenditures form only 0.54% of GDP in Estonia, 0.21% in Latvia, 0.23% in Lithuania, while the respective average indictor is 1.17% in the EU27. At the same time, this figure has been constantly increasing in Estonia for 2004–2008 (see table 4). The share of R&D expenditures in GDP has also slightly increased in Lithuania, but this level is still lower than in Estonia. In Latvia, the share has been increasing to 2007, but decreased in 2008.
This indicator and its dynamics capture different developments, which vary between the economic sectors. In sectors with low productivity, R&D expenditure has been steadily increasing and profits decreasing, which does not enable these sectors to innovate (Estonian Development Fund 2008). In sectors with high productivity, some sectors have invested in new technologies; growth in others has resulted from the domestic market (electricity, gas and water supply, real estate) and not from innovations. Thus, it is possible to expect that this growth is not always sustainable. Both national and foreign capital based enterprises should invest much more in R&D activities. The government should apply special policy measures that facilitate the development of knowledge-intensive industries and their export.
Table 4. Business R&D expenditures for 2004–2008 (% of GDP) 2004 2005 2006 2007 2008
EU25/27 1.27 1.26 1.20 1.17 1.17 Estonia 0.22 0.28 0.42 0.50 0.54 Latvia 0.17 0.14 0.23 0.34 0.21 Lithuania 0.14 0.14 0.16 0.16 0.23 Source: Inno-metrics 2005-2009

A Comparative Analysis of the National Innovation Performance 25
IT expenditure measured as a percentage of GDP is somewhat higher in Estonia (2.9%) than the EU27 average (2.7%). In the two other Baltic States this indicator is lower: respectively 2.3% in Latvia and 1.8% in Lithuania in 2008. Estonia pursues the growing role of ICT in everyday life, including all kinds of services, for example, tax declaration as well as prescriptions via the internet.
It is a peculiarity of a small country that the activity of a single firm can remarkably change the value of some innovation indicators. The significant role of innovation expenditures made by one large enterprise in forming the respective average indicator of a small country has also been indicated by Statistics Estonia (Heinlo 2009).
If we compare Estonian non-R&D expenditures for 2004 and 2006, we notice that expenditures have almost tripled. The biggest increase results from the acquisition of machinery and equipment (see table 5). While in Estonia all types of R&D expenditures have increased in 2004–2006, in Lithuania these have decreased, except for extramural R&D, and as a result, also total expenditure on R&D has decreased.
However, 40% of expenditures in 2006 on machinery and equipment were made by a single enterprise and 50% of the expenditures on machinery and equipment were made by 6 enterprises, which shows how volatile this indicator might be for a small economy. When we exclude this single large investment, the growth of investments in machinery and equipment has been 1.12 times instead of 2.55 times. However, even when removing the aforementioned top six investments, non-R&D expenditures as a percentage of turnover in Estonia is 2.2%, which is still the highest value for the indicator in the EU-27: only Cyprus has a value that is quite close (2.12%) – the value for that indicator in other EU countries is 1.5 or below.

26 Tiiu Paas, Helen Poltimäe
Table 5. Non-R&D expenditures in the Baltic States, 2004 and 2006 (thousand EUR) Type of innovative
activity
Estonia Lithuania
2004 2006 2004 2006
Intramural R&D 48699 59560 61350 55901 Extramural R&D 10643 24715 8614 17440 Machinery and equipment
179592 637252 256374 148331
Acquisition of knowledge
6345 10259 7919 5738
Total 245280 731786 334257 227410 Source: Eurostat 2010
These considerations and additional calculations confirm our opinion that in the case of small countries innovation indicators may be very sensitive to the economic behaviour of single enterprises. At the same time, we would like to underline that the high level of non-R&D innovation expenditures as a % of turnover in the case of Estonia cannot be considered as a feature of small economies. We suppose that there are at least two reasons behind this.
First, the Estonian tax system stimulates enterprises to invest their profits and not to pay dividends – corporate tax is applied only in case profits are distributed, not when these are earned. Such a tax policy is unique in the European Union. Therefore, it is possible to believe that some of the profits are probably invested in activities and goods and these expenditures are reported as non-R&D innovation expenditures.
Second, there are also some subjective reasons that reflect how the innovation survey (CIS) questions have been answered. It is possible that some inter-communication between respondents (as a form of social capital) exists, and this may have a certain impact on the consideration of innovation expenditure. The impact of inter-communication is certainly stronger in the case of small countries. The likely instructions given by those conducting the CIS may also have a certain impact on how people interpret the questions and the essence of non-R&D innovation expenditures.

A Comparative Analysis of the National Innovation Performance 27
Estonia is also doing better than the other two Baltic countries in the category “linkages and entrepreneurship” (see table 3). The Summary Innovation Index for this group of indicators in Estonia is 0.561, in Lithuania 0.338 and only 0.175 in Latvia; the EU27 average is 0.413. The percentage of SMEs innovating in-house or collaborating with others is higher in Estonia than in Latvia and Lithuania at almost twice the EU27 average. The respective indicators are 18.1% of SMEs in the case of Estonia, 5.6% in Latvia and 10.3% in Lithuania, while the EU27 average is 9.5%.
One possible explanation for this situation could be that Estonia has a large share of enterprises with a head office in other countries, which could trigger innovative activities. For example, 12% of enterprises in Estonia were controlled by head offices in Scandinavian countries (Finland, Sweden, Denmark, and Norway, which are all innovation leaders according to EIS) in 2006. The same indicator was only 1% for Latvia and 0.5% for Lithuania.
At the same time we suppose that regardless of the positive effects of the collaboration with Scandinavian neighbours, this collaboration captures some dangers as well. A remarkable proportion of Estonian enterprises subcontract for other enterprises, and therefore, they are also highly dependent on the success or failure of the head office. During the recent crisis, several such enterprises have been closed down or significantly cut back on staff. At the same time, the owners and relevant network may also have helped during the crisis. Some positive impacts from foreign investments in the case of Estonian enterprises have been shown by Masso et al (2010) and Vahter (2010).
The dimension “throughputs” or intermediate results of the innovation process are the weakest group of indicators in the category “Firm activities” in the case of the all three Baltic States (see table 3). The number of patents, community trademarks and designs is marginal compared to more developed EU member states. For instance, the average number of EPO patents per million of population is 105.7 in the EU27; while this number is only 5.6 in Estonia, 5.7 in Latvia and 1.3 in Lithuania.

28 Tiiu Paas, Helen Poltimäe
Thus, innovation leaders have considerably higher patents and community trademarks and design values than the remaining countries; the differences between the old (EU15) and new (EU12) member states are remarkable. For example, the EU15 has an average of 131.76 EPO patents, and when Southern European countries Greece, Spain and Portugal are excluded, the average becomes 161.1. The average for the twelve new member states for the same indicator is only 9.1; the respective indicators for the Baltic States are even below the EU12 average. We should note that this indicator can only reach a high value after a long period accompanied with economic development.
In sum, it is extremely difficult if not impossible to change the throughput indicators (see table 3) in a short period in less developed countries. We suppose that the low level of patents per million population is also explained by the small size of the Baltic economies. The ability to solve all the more or less bureaucratic and administrative problems related to the registration of patents is lacking. This may also explain the other indicators from the block of throughputs.
Outputs
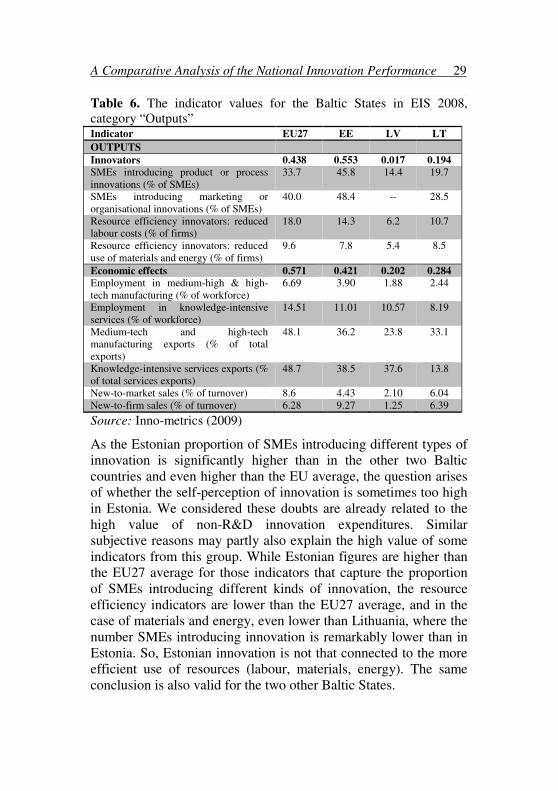
The last dimension of national innovation performance, outputs, is divided into two groups of indicators: innovators and economic effects (table 6). Innovators are comprised of SMEs introducing different types of innovation and resource efficiency innovators. Economic effects demonstrate employment in knowledge-intensive sectors, but also their exports and sales.
In terms of outputs, Estonia is ahead of the other two Baltic countries. In the “innovators” section, relative success in Estonia is based on the high proportion of SMEs introducing different kinds of innovations (see again table 6). The Latvian data for SMEs introducing marketing or organisational innovations is missing, which biases the results in the Summary Innovation Index.
A Comparative Analysis of the National Innovation Performance 29
Table 6. The indicator values for the Baltic States in EIS 2008, category “Outputs” Indicator EU27 EE LV LT
OUTPUTS
Innovators 0.438 0.553 0.017 0.194
SMEs introducing product or process innovations (% of SMEs)
33.7 45.8 14.4 19.7
SMEs introducing marketing or organisational innovations (% of SMEs)
40.0 48.4 -- 28.5
Resource efficiency innovators: reduced labour costs (% of firms)
18.0 14.3 6.2 10.7
Resource efficiency innovators: reduced use of materials and energy (% of firms)
9.6 7.8 5.4 8.5
Economic effects 0.571 0.421 0.202 0.284
Employment in medium-high & high-tech manufacturing (% of workforce)
6.69 3.90 1.88 2.44
Employment in knowledge-intensive services (% of workforce)
14.51 11.01 10.57 8.19
Medium-tech and high-tech manufacturing exports (% of total exports)
48.1 36.2 23.8 33.1
Knowledge-intensive services exports (% of total services exports)
48.7 38.5 37.6 13.8
New-to-market sales (% of turnover) 8.6 4.43 2.10 6.04 New-to-firm sales (% of turnover) 6.28 9.27 1.25 6.39
Source: Inno-metrics (2009)
As the Estonian proportion of SMEs introducing different types of innovation is significantly higher than in the other two Baltic countries and even higher than the EU average, the question arises of whether the self-perception of innovation is sometimes too high in Estonia. We considered these doubts are already related to the high value of non-R&D innovation expenditures. Similar subjective reasons may partly also explain the high value of some indicators from this group. While Estonian figures are higher than the EU27 average for those indicators that capture the proportion of SMEs introducing different kinds of innovation, the resource efficiency indicators are lower than the EU27 average, and in the case of materials and energy, even lower than Lithuania, where the number SMEs introducing innovation is remarkably lower than in Estonia. So, Estonian innovation is not that connected to the more efficient use of resources (labour, materials, energy). The same conclusion is also valid for the two other Baltic States.
30 Tiiu Paas, Helen Poltimäe
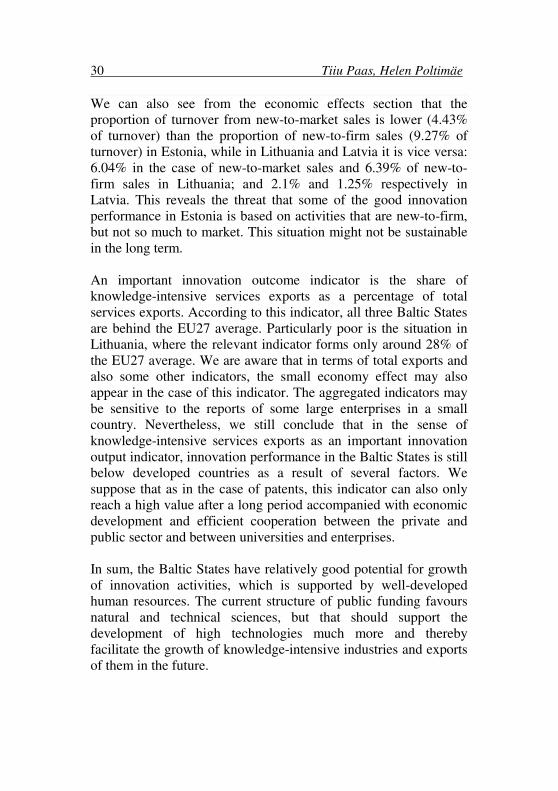
We can also see from the economic effects section that the proportion of turnover from new-to-market sales is lower (4.43% of turnover) than the proportion of new-to-firm sales (9.27% of turnover) in Estonia, while in Lithuania and Latvia it is vice versa: 6.04% in the case of new-to-market sales and 6.39% of new-to-firm sales in Lithuania; and 2.1% and 1.25% respectively in Latvia. This reveals the threat that some of the good innovation performance in Estonia is based on activities that are new-to-firm, but not so much to market. This situation might not be sustainable in the long term.
An important innovation outcome indicator is the share of knowledge-intensive services exports as a percentage of total services exports. According to this indicator, all three Baltic States are behind the EU27 average. Particularly poor is the situation in Lithuania, where the relevant indicator forms only around 28% of the EU27 average. We are aware that in terms of total exports and also some other indicators, the small economy effect may also appear in the case of this indicator. The aggregated indicators may be sensitive to the reports of some large enterprises in a small country. Nevertheless, we still conclude that in the sense of knowledge-intensive services exports as an important innovation output indicator, innovation performance in the Baltic States is still below developed countries as a result of several factors. We suppose that as in the case of patents, this indicator can also only reach a high value after a long period accompanied with economic development and efficient cooperation between the private and public sector and between universities and enterprises.
In sum, the Baltic States have relatively good potential for growth of innovation activities, which is supported by well-developed human resources. The current structure of public funding favours natural and technical sciences, but that should support the development of high technologies much more and thereby facilitate the growth of knowledge-intensive industries and exports of them in the future.

A Comparative Analysis of the National Innovation Performance 31
4. A MULTIVARIATE ANALYSIS OF THE BALTIC STATES’ INNOVATION PERFORMANCE
4.1. Factor analysis for elaborating composite indicators for the assessment of national innovation performance
The factor analysis (FA) analogously to the principal component analysis (PCA) aims to describe a set of initial k variables X1, X2,…
Xk in terms of a smaller number of m factors that highlight the relationship between these variables. Contrary to the PCA, the FA model assumes that the data is based on underlying factors of the model, and that data variance can be decomposed into that accounted for by common and unique factors (for more see Nardo, et al 2005).
The factor model is as follows:
ijijmji eFaX +=∑ =1 (1),
Where
X1, X2,… Xk – initial variables (standardised with zero mean and unit variance); i = 1,2,…k; k is the number of the initial variables;
F1, F2, ….Fm – aggregated indicators – common factors (uncorrelated, each has a zero mean and unit variance); j = 1,
2,….m; m is the number of factors;
aij – factor loadings related to the variable Xi, measured as a correlation between the initial variable i and factor j;
ei – the specific factor supposed independently and identically distributed with zero mean.

32 Tiiu Paas, Helen Poltimäe
There are several approaches to dealing with model (1), for example, the centroid method, principal axis method and principal component factor analysis (for more see Nicoletti et al 2000). The most common approach, which is implemented by elaborating composite indicators, is the use of PCA to extract the first m
principal components and consider them as factors and neglect the remaining information. On the issue of how factors should be retained in the analysis without losing too much information, the opinions of methodologists differ (see also Nardo et al 2005)
In addition, it must be stressed that a principal component analysis cannot always reduce a large number of initial variables to a small number of aggregated variables – factors (e.g. composite indicators). Indeed, if the initial variables are uncorrelated, then this analysis is of no value. On the other hand, a significant reduction will be obtained if the initial variables are highly correlated (positively or negatively). It should also be noticed that different extraction methods supply different results for factors (that means for composite indicators), influencing the score of the composite and thereby also the corresponding country ranking.
The interpretation of the essence of the composite indicators is based on the matrix of the factor loadings (aij). In order to support the interpretation of the factor loadings, the rotated matrix of the loading is calculated. There are various rotation strategies that have been proposed. The goal of these strategies is to obtain a clear pattern of factor loadings. The most common rotation method is the “varimax rotation”, which is used also in our case.
In sum, the main steps for elaborating the composite indictors for assessing national innovation performance are as follows:
1) Choose the initial statistical indicators that describe several aspects of innovation performance: innovation inputs, innovation outputs and processes allowing the transformation of inputs into outputs.
2) Calculate the covariance/correlation matrix for the initial indicators.

A Comparative Analysis of the National Innovation Performance 33
3) If possible, identify the number factors necessary to represent the initial indicators (based on theoretical considerations) and the method for calculating them.
4) If necessary, rotate the factors to enhance their interpretability.
5) Interpret the essence of the composite indicators of the innovation performance.
6) Calculate factor scores for the composite indicators and elaborate country rankings according to their innovation performance.
4.2. The choice of initial indicators for assessing innovation performance
In order to elaborate composite indicators for the national innovation performance we mainly relied on the Eurostat and Inno-metrics database of the EIS. The database includes statistical indicators that describe several aspects of innovation performance for the EU27 countries for 2002–2008, including data for five non-EU countries: Croatia (HR), Turkey (TR), Iceland (IC), Norway (NO) and Switzerland (CH). The initial indicators we chose for the assessment of the innovation performance belong to three groups taking into account that they should represent the main characteristics of the EIS categories: innovation enablers, firm activities and outputs.
The final choice of initial indicators bases on theoretical and methodological considerations as well as on the checking of the robustness of the extraction results (based on Cronbach coefficients, several statistical tests and the correlation matrix). Based on these considerations and the test results, the indicators were chosen so they reflect the internal consistency of the initial items and describe national innovation performance from different angles: innovation inputs, activities and outputs.

34 Tiiu Paas, Helen Poltimäe
The chosen set of initial variables for implementing the factor analysis consists of the following indicators:
• people with tertiary education per 100 population aged 25-64 (TERTIARY);
• participation in lifelong learning per 100 population aged 25-64 (LIFELONG);
• public R&D expenditure as % of GDP (PUBLIC_R&D);
• business R&D expenditure as % of GDP (BUSINESS_R&D);
• public-private co-publications per million population (CO_PUBLICATIONS);
• EPO patents per million population (PATENTS);
• Non-R&D innovation expenditure as % of turnover (NON_R%D_INNO);
• SMEs introducing product or process innovations as % of all SMEs (PROD_PROC_INNO);
• SMEs introducing marketing or organisational innovations as % of all SMEs (MARKET_INNO);
• employment in medium-high and high-tech manufacturing as % of workers (TECH_EMPL);
• medium and high-tech manufacturing exports as % of total exports (TECH_EXPORT).
Table 7 presents the correlation matrix of the selected innovation indicators. The correlation matrix is used to extract the aggregated indicators – factors, which in our case can be considered as the

A Comparative Analysis of the National Innovation Performance 35
composite indicators that describe different aspects of national innovation performance.
We can see that the majority of the initial innovation indicators are correlated. Only the indicator for non-R&D innovation expenditure does not have a statistically significant correlation with the other indicators. Thus, we will exclude this indicator by conducting a factor analysis. In addition, the high correlation of the initial innovation indicators (called multicollinearity) is one of the problems related to the measurement of innovation that was also stressed by Schibany and Streicher (2008). The implementation of factor analysis enables us to avoid this measurement problem.

36 Tiiu Paas, Helen Poltimäe
Table 7. Correlation matrix of the innovation indicators for the EU and selected European countries, 2008 Indicat. TERT LIFEL PUBRD BUSRD PUBL PAT NON PROD MARK TECH EXP TERT 1.000 .571** 405* .417* .501** 485** .138 .336 .081 -.368* -.323 LIFEL .571** 1.000 .792** .717** .816** .582** -.066 .240 .015 -.059 -.040 PUBRD .405* .792** 1.000 .740** .750** .451** -.141 .330 .240 .033 -.208 BUSRD .417* .717** .740** 1.000 .806** .791** -.118 .666** .502** .234 .171 PUBL .501** .816** .750** .806** 1.000 .722** -.055 .557** .252 .142 .055 PAT .485** .582** .451** .791** .722** 1.000 -.123 .646** .215 .107 .215 NON .138 -.066 -.141 -.118 -.055 -.123 1.000 .249 .148 -.052 -.077 PROD .336 .240 .330 .666** .557** .646** .249 1.000 .804** .083 -.054 MARK .081 .015 .240 .502** .252 .215 .148 .804** 1.000 -.198 -.148 TECH -.368* -.059 .033 .234 .142 .107 -.052 .083 -.198 1.000 .681** EXP -.323 -.040 -.208 .171 .055 .215 -.077 -.054 -.148 .681** 1.000
Source: authors calculations based on the Eurostat and Inno-metrics data. N=32; * - significance level 0.05; ** significance level 0.01

A Comparative Analysis of the National Innovation Performance 37
4.3. The results of the factor analysis
Based on the selected set of initial innovation indicators (see 4.2) for the 32 countries included in EIS, and using the principal components factor analysis method we extracted three principal components – factors Fj (j=1,2,3) that explains 81.3% of the variation of the initial indicators. The first factor (F1) explains 37.3%, the second (F2) 23.0% and the third (F3) 21.0% of the total variation. Table 8 presents the rotated factor loadings for these factors – innovation components and the explained variance.
Factor F1 has the strongest loadings (correlations) with the indicators LIFELONG (0.904), CO_PUBLICATIONS (0.885) and PUBLIC_R&D (0.823). The indicators PATENTS (0.746), BUSINESS_R&D (0.742) and TERTIARY (0.530) are also statistically significant indicators. All these indicators reflect first of all the preconditions for innovation activities including human resources (characterised by education), their activities (patents, publications) and both private and business R&D expenditure. Thus, we name this factor the innovation input component (F1), which consists of indicators of both groups “Enablers” and “Firm activities”, indicating that these groups of initial indicators are strongly interlinked.
Table 8. Rotated factor loadings for innovation Initial indicators F1
INNOVATION
INPUT
F2
INNOVATION
ACTIVITIES
F3
INNOVATION
OUTPUT
TERTIARRY 0.530 -0.021 -0.665
LIFELONG 0.904 -0.166 -0.166 PUBLIC_R&D 0.823 0.176 0.013 BUSINESS_R&D 0.742 0.528 0.225 CO_PUBLICATIONS 0.885 0.198 0.006 PATENTS 0.746 0.446 0.056 PROD_PROC_INNO 0.201 0.913 -0127 MARKET_INNO 0.093 0.928 -0.112 TECH_EMPL 0.096 -0.060 0.902
TECH_EXPORT 0.063 -0.128 0.855
Explained variance, % 37.263 22.925 20.983
Cumulative, % 37.263 60.187 81.171
Source: authors’ calculations based on the Eurostat and Inno-metrics data; N=32.

38 Tiiu Paas, Helen Poltimäe
Component F2 has the strongest loadings with the variables PROD_PROC_INNO and MARKET_INNO, but loadings for BUSINESS_R&D and PATENTS are also statistically significant. We can interpret this component as the innovation activities component (F2), which consists of indicators from the groups “Firm activities” and “Outputs” interlinking innovation activities with the preconditions for innovation.
Component F3 has the strongest loadings with the important outcomes of the innovation process, the variables TECH_EMPL and TECH_EXPORT, which reflect the share of employment in technology oriented sectors and the export of technological production in total exports. Thus, this component could be interpreted as the innovation output component.
Appendix 1 presents the component scores of components F1, F2 and F3 as standardised indicators reflecting the level of the component for a country in comparison with other countries. If the value of the score is 0, that means that according to this component this country has the average level, and respectively a negative and positive score reflects the countries’ position below or above the average.
In order to summarize the scores of the countries’ innovation performance components F1, F2 and F3 to obtain a synthesized innovation indicator – the composite innovation indicator – we use the weights that represent the explanatory power of these components (see table 8). Thus, the weights are 0.372, 0.230 and 0.210.
To compare the rankings for the factor analysis based composite indicator with the EIS-2008 rankings, we rescale the EIS ranking using the formula:
min)max
min, (
)(EISEIS
EISXEIS i
irescale−
−= (2),
A Comparative Analysis of the National Innovation Performance 39
Where iX represents the level of the EIS composite indicator for
the country i (i=1,2,…N) and minEIS and maxEIS are the minimum and maximum values for the respective EIS indicators.
The re-scaled indicators have the same dimension as the factor analysis and its score-based rankings: 0 – the country’s innovation performance is on the average level; negative or positive re-scaled EIS composite indicators show that the innovation performance is below or above the average level. The correlation coefficient between the two rankings is high: above 0.9 indicating that EIS composite indicators and respective rankings are robust also in the sense of other methodologies used for the comparative assessment of national innovation performance.
Sensitivity of innovation measurement results to self-reporting
We use the factor analysis methodology for elaborating the composite indicators also for examining our proposition that innovation indicators, and thus the assessment results of the national innovation performance, may be sensitive to self-reporting, particularly in the case of small countries.
We include in our set of initial innovation indicators the variable NON_R&D_INNO – the non-R&D innovation expenditure as % of turnover and estimate the factor model 1. This indicator is based on the CIS (Community Innovation Survey) and therefore reflects self-reporting activities and can be used as a proxy for self-reporting. The results of implementing the factor analysis are robust allowing us to extract three components: innovation input (F1), innovation activities (F2) and innovation output (F3). Also, the factor scores and the ranking of the countries are as a rule robust, but remarkable differences exist in the case of Estonia, a small Baltic country (see appendix 2 and table 9).
Table 9 presents the assessment results for national innovation performance in the Baltic States based on the composite indicators elaborated using the factor analysis compared with EIS-2008 composite indicators. The factor analysis based composite indicators consist of two variants: variant 1 based on 10 initial

40 Tiiu Paas, Helen Poltimäe
variables and variant 2 on 11 initial variables including the variable NON_R&D_INNO, which is considered a self-reporting proxy.
Table 9. Component scores and composite indicators for the assessment of national innovation performance in the Baltic States, 2008 Country Composite indicator
(based on weighted
scores): variant 1
Composite indicator
(based on weighted
scores): variant 2
EIS-
2008
EIS-
2008,
re-scaled
EE -0,201 -0.006 0,454 -0,026 LV -0,654 -0,670 0,239 -0,241 LT -0,664 -0,674 0,294 -0,186
Source: authors’ calculations based on Eurostat and Inno-metrics data
Estonian innovation performance is evaluated remarkably highly when non-R&D expenditure is taken into account. The results of the other two Baltic States are rather stable. Thus, we can conclude that there are some self-reporting problems within the CIS regarding non-R&D expenditure in the case of Estonia. Taking into account that Estonian tax policy favours investments instead of paying dividends, our calculations confirm the argumentation that some aspects of tax policy in combination with self-reporting may be reflected in the assessment of national innovation performance. This reflection is particularly evident in the case of a small economy.
5. CONCLUSION AND DISCUSSION
The paper bridges two approaches to the assessment of national innovation performance based on the composite indicators of the European Innovation Scoreboard (EIS) and on the analysis of factors that may be behind these indicators. The main focus of the study was the analysis of innovation performance in the Baltic States – Estonia, Latvia and Lithuania – which are small EU economies with a common post-socialist path dependence. In addition to the EIS methodology, we also used factor analysis in order to elaborate composite indicators to assess national innovation performance and to test the robustness of the EIS methodology and assessment results. The implementation of the factor analysis methodology for assessing national innovation

A Comparative Analysis of the National Innovation Performance 41
performance allows us to conclude that the EIS results are rather stable compared to the results of other methodological approaches.
According to the EIS assessments, the EU member states are divided into four country groups: 1) innovation leaders, 2) innovation followers, 3) moderate innovators, and 4) catching-up countries. Countries with innovation performance above the EU27 average are in the innovation leaders and followers groups, and those with innovation performance below the EU27 average are in the moderate innovators and catching-up countries groups. Estonia belongs to the third and the two other Baltic States, Latvia and Lithuania, to the fourth groups. Also, the factor analysis assessment results are in accordance with this ranking.
The EIS based classification of countries has been robust for 2003–2008; only a couple of countries have changed groups. Recent developments in the EIS methodology in 2008 are reflected first of all in the assessment results for national innovation performance in the small countries (EU new member states Malta and Lithuania and the Southern European countries Portugal and Greece). These reflections confirm the opinion that innovation measurement results are still sensitive to assessment methodology and the indicators selected to measure national innovation performance. We are aware that innovation performance is also highly dependent on available data. Among the Baltic States, Latvia in particular has missing data for several indicators and that biases the assessment of national innovation performance.
The results of our study show that there are some shortcomings in the measurement of national innovation performance based on the EIS methodology. First, the indicators of human resources capture only some aspects of the education system, and not the whole picture. For instance, according to the indicators used by the EIS, the Baltic States are doing well in terms of human capital. At the same time, there are several problems regarding potential links between innovation activities and human resources related to indicators that reflect the situation in higher education and research. These problems are especially evident in the case of Latvia, where the number of scientific publications in international peer-reviewed journals is extremely low compared to the other countries.

42 Tiiu Paas, Helen Poltimäe
A common problem for the Baltic States is the weak link between research and enterprises, which is also not fully captured by the EIS indicators. The lack of an effective link between research and enterprises can be explained by the post-socialist path dependence of the Baltic countries as well as by their small size. Another problem is the small economy effect on the indicators: small economies are highly dependent on single enterprises in a sector, and therefore, some indicators are very volatile. For example, non-R&D expenditures in Estonia on machinery and equipment have increased in 2004–2006 largely due to investments by one single enterprise.
The statistical indicators of small countries are particularly sensitive to the self-perception and self-reporting of enterprises and individuals. Still, it is not completely clear how much innovation performance can be attributed to the self-reporting form of the CIS, reflecting cultural traditions and attitudes to self-reporting. We suggest that there also exists some inter-communication between respondents (as a form of social capital), which may have an impact on how they consider the essence of innovation expenditure. The possible advice given by the conductors of the CIS may also have a certain impact on that how enterprises interpret the questions and the essence of expenditures, particularly non-R&D innovation expenditure. The impact of advice and inter-communication on the response results is certainly stronger in the case of small countries than large ones.
We analysed the Estonian example regarding indicators that reflect the share of SMEs in product, process, marketing or organisational innovations and found that non-R&D innovation expenditure as a percentage of turnover significantly surpassed the EU27 average in 2008. At the same time, the share of firms that have managed to reduce labour, material or energy costs was significantly lower in Estonia than the EU average. This example allows us to argue that innovation activities in Estonian enterprises are not sufficiently resource efficient.
In order to check the robustness of our conclusion that innovation indicators are sensitive to self reporting, and that particularly in the case of small countries, we compared the EIS and the factor analysis results and obtained confirmation that the composite results for Estonia are extremely sensitive to the self-reporting indicator of the

A Comparative Analysis of the National Innovation Performance 43
CIS that reflects the role of non-R&D innovations in national innovation performance.
Regardless of several measurement shortcomings, we still conclude that Estonian innovation performance is somewhat ahead of the other two Baltic countries. We argue that economic policy for attracting foreign investors and fostering entrepreneurship and the macro environment for innovative activities have been more favourable in Estonia that in other Baltic counties. Also, the neighbourhood of Estonia, the Scandinavian countries (particularly Sweden and Finland), which belong among the top of innovators in Europe, have had a positive impact on Estonian innovation performance. The majority of foreign investments in Estonia are from Sweden and Finland creating favourable preconditions for positive spillovers from innovative neighbouring countries. This is also in accordance with earlier findings about positive spillovers from FDI from source to target countries.
The Estonian tax policy, which promotes investments instead of paying dividends, boosts investments and innovative activities. We are aware that not all of these investments support innovation and sustainable growth; some of these are oriented towards employing comparatively cheap labour and not towards innovation and knowledge-based production and services. However, the relatively good innovation performance in Estonia compared to other Baltic countries does not mean that Estonia should be resting on its achievements. There is still much to be done to foster innovative economic activities and to exit the economic crisis stronger than before.
The economic crisis and post-recession periods provide plenty of challenges for the development of the innovation system and improving the innovation performance of the Baltic States. Enterprises based on both local and foreign capital should invest much more in R&D activities and educate and retrain their labour force in the coming years than they have done during the economic boom. Cooperation between the public and private institutions and between the universities and enterprises should be significantly improved and made more effective. In order to better use the good potential of the Baltic States in terms of the relatively well-developed human resources, efficient coordination of public and entrepreneurial policies

44 Tiiu Paas, Helen Poltimäe
is unavoidable. Special policy measures that facilitate the development of knowledge intensive industries and their exports have to be elaborated and implemented taking into account that these developments should be supported by the coordinated and efficient activities of the government and its institutions. The good potential that the Baltic countries have for innovation activities is still under-developed.
Last but not least, the shifts in the Baltic States from investment- to innovation-based development also stresses the need to continually improve the quality of statistical indictors and their analysis. Comprehensive and internationally comparable information is necessary in order to predict the main development trends, and to elaborate plans for possible structural changes to economies in the short-, medium- and long-term perspective. The time horizon for these predictions and development plans generates different requirements for elaborating statistical data and comparative analyses of composite indicators; all this should be taken into account when analysing and developing national innovation performance.
A Comparative Analysis of the National Innovation Performance 45
REFERENCES Allik, J. (2008), “Quality of Estonian science estimated through
bibliometric indicators (1997-2007)”, Proceedings of the
Estonian Academy of Sciences, 57(4), pp. 255-264. Archibugi, D.; Sirilli, G. (2001), „The Direct Measurement of
Technological Innovation in Business“, [in] Innovation and
enterprise creation: Statistics and indicators, B.Thuriaux, E.Arnold, C.Couchot (eds), Luxembourg: Office for Official Publications of the European Communities, pp. 38-49.
Archibugi, D.; Denni, M.; Filippetti, A. (2009), „The technological capabilities of nations: The state of the art of synthetic indicators“, Technological Forecasting and Social Change, 76(7), pp.917-931.
Arundel, A.; Bordoy, B.; Mohnen, P.; Smith, K. (2008), “Innovation surveys and policy: lessons from the CIS”, [in] Innovation policy in Europe. Measurement and Strategy, C. Nauwelaers and R. Wintjes (eds), Massachusetts: Edward Elgar Publishing Limited, pp. 3-28.
Arundel, A.; Hollanders, H. (2008), ”Innovation scoreboards: indicators and policy use”, [in] Innovation policy in Europe.
Measurement and Strategy, C. Nawelaers and R. Wintjes (eds), Massachusetts: Edward Elgar Publishing Limited, pp. 29-52.
Dombrovsky, V. (2009) “Is anything wrong with higher education in Latvia?”, Baltic Journal of Economics, 9(2), pp. 5-24.
Edquist, C.; Hommen, L., eds (2008). “Small Country Innovation Systems. Globalisation, Change and Policy in Asia and Europe”. Cheltenham UK, Northampton MA USA: Edward Elgar.
Estonian Development Fund (2008), “The Current Status and Future Outlooks of Competitiveness of Estonian Economy. Estonia in Focus, Tallinn: Estonian Development Fund, 68 pp.
Eurostat (2010) Eurostat database [http://epp.eurostat.ec.europa.eu] Fagerberg, J. (2005), „Innovation: A guide to the Literature“, [in]
The Oxford Handbook of Innovation, J. Fagerberg, D. C. Mowery and R. R. Nelson (eds), Oxford and New York: Oxford University Press, pp. 148-177.

46 Tiiu Paas, Helen Poltimäe
Fagerberg, J.; Srholec, M. (2008), „National innovation systems, capabilities and economic development“, Research Policy, Vol. 37, pp. 1417-1435.
Filipetti, A.; Archibugi, D. (2010), “Innovation in times of crisis: National Systems of Innovation, structure and demand”, Research Policy, article in press.
Grupp, H.; Schubert, T. (2010) “Review and new evidence on composite innovation indicators for evaluating national performance”, Research Policy, Vol. 39, pp. 67-78.
Heinlo, A. (2009) Innovation Scoreboard: Estonia’s advantages and shortcomings. Quarterly Bulletin of Statistics Estonia, No. 1, pp. 50-57.
Hollanders, H.; van Cruysen, A. (2008). “Rethinking the European Innovation Scoreboard. A New Methodology for 2008-2010”. INNNO-Metrics, UNU-MERIT. Maastricht.
Hollanders, H.; Arundel, A. (2007). “Differences in Socio-Economic Conditions and Regulatory Environment Explaining Variation in National Innovation Performance and Policy Implications”. INNO-Metrics Thematic Paper. UNU-MERIT. Maastricht.
IAREG (2008). „Report on traditional and new indicators of Science, Technology and Innovation (STI) and knowledge accumulation“, a report of IAREG research under EC Seventh Framework Programme.
Inno-metrics (2009), “European Innovation Scoreboard 2008” [http://www.proinno-europe.eu/metrics]
Inno-metrics (2008), “European Innovation Scoreboard 2007. Comparative Analysis of Innovation Performance” [http://www.proinno-europe.eu/metrics]
Inno-metrics (2007), “European Innovation Scoreboard 2006. Comparative Analysis of Innovation Performance” [http://www.proinno-europe.eu/metrics]
Inno-metrics (2006), “European Innovation Scoreboard 2005. Comparative Analysis of Innovation Performance” [http://www.proinno-europe.eu/metrics]
Inno-metrics (2005), “European Innovation Scoreboard 2004. Comparative Analysis of Innovation Performance” [http://www.proinno-europe.eu/metrics]

A Comparative Analysis of the National Innovation Performance 47
Kristapsons, J.; Martinson, H.; Dagyte, I. (2003), Baltic R&D Systems in Transition. Experiences and Future Prospects. Zinatne, Academic Publishers. 203 pp.
Landry, R.; Amara, N.; Lamari, M. (2002), „Does social capital determine innovation? To what extent?“, Technological
Forecasting & Social Change, Vol. 69, pp. 681-701. Lundvall, B.-Å.; Johnson, B.; Andersen, E.S.; Dalum, B. (2002)
“National systems of production, innovation and competence
building“, Research Policy, Vol. 31, pp. 213-231. Marinova, D.; Phillimore, J. (2003), „Models of Innovation“, [in]
The International Handbook on Innovation, L. V. Shavinina (ed), Oxford: Elsevier Science Ltd., pp. 44-53.
Masso, J.; Roolaht, T.; Varblane, U. (2010) "Foreign Direct Investment and Innovation in Central and Eastern Europe: Evidence From Estonia" Working Papers of FEBA, University of Tartu, No. 67.
Metcalfe, S.; Ramlogan, R. (2008) „Innovation systems and the competitive process in developing economies“, The Quarterly
Review of Economics and Finance, Vol. 48, pp. 433-446. Nardo, M.; Saisana, M.; Saltelli, A.; Tarantola, S.; Hoffman, A.
Giovannini, E. (2005) „Handbook on Constructing Composite Indicators. Methodology and User Guide“. OECD Statistical Working Papers 2005/3. OECD Publishing.
Nicoletti, G.; Scarpetta, S.; Boylaud, O. (2000) „Summary indicators of product market regulation with an extension to employment protection legislation“, OECD, Economics deparmnt working papers N0 226, ECO/WKP(99) 18.
Rodriguez-Pose, A., Crescenzi, R. (2008), „Research and Development, Spillovers, Innovation Systems, and the Genesis of Regional Growth in Europe“, Regional Studies, Vol. 42.1, pp.51-67.
Schibany, A.; Streicher, G. (2008), “The European Innovation Scoreboard: drowning by numbers?”, Science and Public
Policy, 35(10), pp. 717-732. Smith, K. (2005), “Measuring Innovation”, [in] The Oxford
Handbook of Innovation, J. Fagerberg, D. C. Mowery and R. R. Nelson (eds), Oxford and New York: Oxford University Press, pp. 148-177.

48 Tiiu Paas, Helen Poltimäe
Vahter, Priit (2010) "Does FDI Spur Innovation, Productivity and Knowledge Sourcing by Incumbent Firms? Evidence From Manufacturing Industry in Estonia", No. 69.
Van Hemert, P.; Nijkamp, P. (2010) „Knowledge investments, business R&D and innovativeness of countries: A qualitative meta-analytic comparison“, Technological Forecasting and
Social Change, Vol. 77, pp. 369-384. World Bank (2009), “Knowledge Assessment Methodology”,
[http://www.worldbank.org/].

A Comparative Analysis of the National Innovation Performance 49
Appendix 1. Component scores and composite indicators for assessing national innovation performance, EU-27 and selected European countries, 2008 Country F1 F2 F3 Composite indicator
(based on weighted
scores)
EIS-2008 EIS-2008,
re-scaled
BE 0,150 0.951 0,087 0,279 0,507 0,027 BG -0,776 - 1,466 -0,678 -0,762 0,221 -0,259 CZ -0,432 -0,331 1,788 0,111 0,404 -0,076 DK 1,617 -0,235 -0,069 0,600 0,570 0,090 DE 0,088 2,478 1,418 0,840 0,581 0,101 EE -0,412 0,795 -0,995 -0,201 0,454 -0,026
IE -0,149 0,406 -0,291 -0,034 0,533 0,053 EL -1,123 0,973 -1,191 -0,494 0,361 -0,119 ES 0,036 -0,749 -0,175 -0,177 0,366 -0,114 FR 0,241 0,136 0,623 0,252 0,497 0,017 IT -0,476 0,066 0,749 -0,031 0,354 -0,126 CY -0,223 0,514 -1,590 -0,302 0,471 -0,009 LV -0,670 -0,727 -1,132 -0,654 0,239 -0,241
LT -0,327 -1,386 -1,192 -0,664 0,294 -0,186
LU -0,802 1,816 -1,305 -0,208 0,524 0,044 HU -0,462 -1,256 1,479 -0,157 0,316 -0,164 MT -0,960 -0,726 1,293 -0,288 0,329 -0,151 NL 0,983 -0,539 -0,403 0,209 0,484 0,004 AT 0,326 1,598 0,687 0,607 0,534 0,054
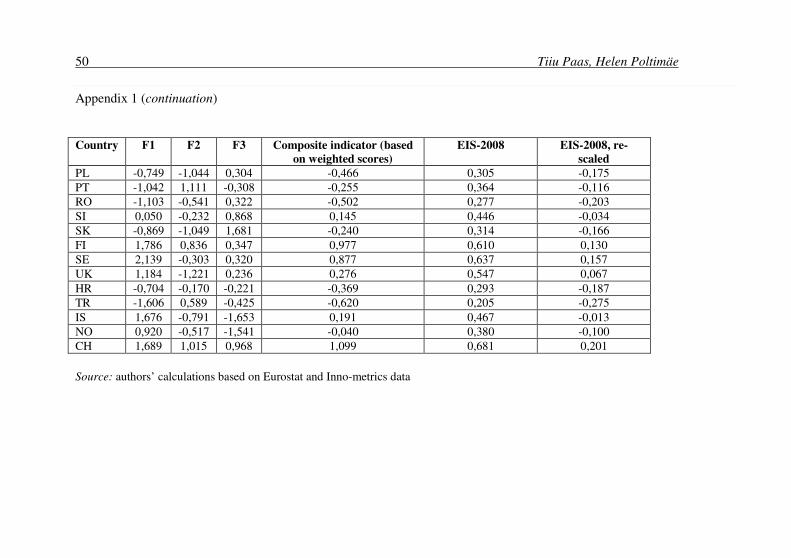
50 Tiiu Paas, Helen Poltimäe
Appendix 1 (continuation)
Country F1 F2 F3 Composite indicator (based
on weighted scores)
EIS-2008 EIS-2008, re-
scaled
PL -0,749 -1,044 0,304 -0,466 0,305 -0,175 PT -1,042 1,111 -0,308 -0,255 0,364 -0,116 RO -1,103 -0,541 0,322 -0,502 0,277 -0,203 SI 0,050 -0,232 0,868 0,145 0,446 -0,034 SK -0,869 -1,049 1,681 -0,240 0,314 -0,166 FI 1,786 0,836 0,347 0,977 0,610 0,130 SE 2,139 -0,303 0,320 0,877 0,637 0,157 UK 1,184 -1,221 0,236 0,276 0,547 0,067 HR -0,704 -0,170 -0,221 -0,369 0,293 -0,187 TR -1,606 0,589 -0,425 -0,620 0,205 -0,275 IS 1,676 -0,791 -1,653 0,191 0,467 -0,013 NO 0,920 -0,517 -1,541 -0,040 0,380 -0,100 CH 1,689 1,015 0,968 1,099 0,681 0,201
Source: authors’ calculations based on Eurostat and Inno-metrics data

A Comparative Analysis of the National Innovation Performance 51
Appendix 2. Component scores and composite indicators for assessing national innovation performance with inclusion of the initial variable NON_R&D_INNO; EU-27 and selected European countries, 2008 Country F1 F2 F3 Composite indicator (based on
weighted scores)
EIS-2008 EIS-2008,
re-scaled
BE 0,319 0,726 0,176 0,290 0,507 0,027 BG -1,025 -1,228 -0,798 -0,781 0,221 -0,259 CZ -0,283 -0,294 1,891 0,215 0,404 -0,076 DK 1,601 -0,505 -0,114 0,511 0,570 0,090 DE 0,444 2,129 1,614 0,879 0,581 0,101 EE -0,673 2,592 -1,050 -0,006 0,454 -0,026
IE -0,106 0,328 -0,273 -0,037 0,533 0,053 EL -0,837 0,858 -0,967 -0,365 0,361 -0,119 ES -0,092 -0,731 -0,262 -0,220 0,366 -0,114 FR 0,289 -0,129 0,627 0,215 0,497 0,017 IT -0,516 0,020 0,724 -0,053 0,354 -0,126 CY -0,301 0,656 -1,631 -0,325 0,471 -0,009 LV -0,814 -0,631 -1,197 -0,670 0,239 -0,241
LT -0,473 -1,320 -1,262 -0,674 0,294 -0,186
LU -0,602 1,588 -1,177 -0,184 0,524 0,044 HU -0,551 -1,174 1,418 -0,143 0,316 -0,164 MT -1,260 -0,750 1,071 -0,412 0,329 -0,151 NL 0,875 -0,765 -0,508 0,102 0,484 0,004 AT 0,561 1,295 0,810 0,614 0,534 0,054

52 Tiiu Paas, Helen Poltimäe
Appendix 2 (continuation)
Country F1 F2 F3 Composite indicator (based on
weighted scores)
EIS-2008 EIS-2008, re-
scaled
PL -0,875 -0,937 0,238 -0,462 0,305 -0,175 PT -0,748 1,078 -0,087 -0,115 0,364 -0,116 RO -1,100 -0,407 0,356 -0,431 0,277 -0,203 SI 0,126 -0,047 0,929 0,226 0,446 -0,034 SK -1,075 -0,855 1,552 -0,263 0,314 -0,166 FI 1,847 0,607 0,334 0,896 0,610 0,130 SE 2,205 -0,449 0,318 0,843 0,637 0,157 UK 0,907 -1,236 0,015 0,135 0,547 0,067 HR -0,624 -0,071 -0,135 -0,283 0,293 -0,187 TR -1,334 0,476 -0,209 -0,476 0,205 -0,275 IS 1,669 -0,656 -1,634 0,206 0,467 -0,013 NO 0,763 -0,783 -1,649 -0,173 0,380 -0,100 CH 0,319 0,726 0,176 0,290 0,681 0,201
Source: authors’ calculations based on Eurostat and Inno-metrics data
A Comparative Analysis of the National Innovation Performance 53
KOKKUVÕTE
Riikide innovatsioonisoorituse võrdlevanalüüs: Balti riigid Euroopa Liidu kontekstis
Innovatsiooni mõõtmine ning riikide innovatsioonisoorituste analüüs on arenenud koos arusaamisega innovatsiooniprotsessist ja -mudelitest. Kuni 1980-ndateni põhines innovatsiooni mõõtmine peamiselt kaasustel või sellistel näitajatel nagu teadus- ja arendustegevuse investeeringud, teadusartiklid, patenteeritud leiutised ning teadlaste ja inseneride arv. Need näitajad peegeldavad vaid innovatsiooniprotsessi üksikuid aspekte ning ei pruugi anda kompleksset ülevaadet riigi kui terviku innovatsioonisooritusest ja selle arengust. Innovatsiooni teooriate areng 1980-ndatel tekitas vajaduse uute mõõdikute järele, mis muu kõrval peegeldaksid ka turuväärtusi, seostaksid innovatsiooniprotsessi sisendeid ja väljundeid ning annaksid ka lisateavet innovatsiooniprotsessi enda kohta. Seetõttu algatati 1980-ndate lõpus ja 1990-ndate alguses mitmeid innovatsiooni küsitlusi, neist kõige levinuim on Euroopa Liidu innovatsiooniküsitlus (Community Innovation Survey – CIS).
Lisaks küsitlusinfole on viimastel aastakümnetel oluliselt kasvanud agregeeritud innovatsiooninäitajate (composite indicators) kasutamine innovatsiooniprotsesside ja riikide innovatsioonisoorituste võrdleval analüüsimisel. Agregeeritud innovatsiooninäitajate väljatöötamine tugineb erinevate infoallikate kombineeritud (sh ka innovatsiooniküsitluste andmed) kasutamisele. Kahtlematult kätkevad need näitajad nii andmeallikatest kui andmete agregeerimise metoodikatest tulenevaid küsitavusi ning ka teatavat subjektiivsust. See on reeglina omane kõigile agregeeritud näitajatele. Kuid vaatamata sellele on agregeeritud innovatsiooninäitajad koos neid selgitava metoodikaga oluliseks infoallikaks riikide innovatsioonisoorituste võrdleval hindamisel ning sellele tuginevalt riikide arengut toetavate majanduspoliitiliste otsusevariantide väljatöötamisel.

54 Tiiu Paas, Helen Poltimäe
Käesolev artikkel keskendub innovatsioonisoorituse analüüsile eelkõige Balti riikides kui geograafilises naabruses olevates väikestes post-sotsialistliku rajasõltuvusega majandustes. Analüüsisime Balti riikide innovatsioonisooritustele antud agregeeritud hinnanguid ning nende dünaamikat Euroopa Liidu teiste riikidega võrrelduna. Oma analüüsis tuginesime põhiliselt Euroopa Innovatsiooni Tulemuskaardile (European Innovation
Scoreboard – EIS). Lisaks EIS andmebaasis toodud infole kasutasime ka teisi infoallikaid (näiteks rahvusvaheliste ja riikide statistikaorganisatsioonide andmed), et avada põhjalikumalt EISis toodud agregaatnäitajate ja nende taga olevate üksiknäitajate sisulist tausta. Et testida EIS metoodika ja selle tulemuste robustsust pakkusime välja ka omapoolse metoodika agregeeritud innovatsiooninäitajate leidmiseks, mis tugineb faktoranalüüsi kasutamisele. Faktoranalüüsi kasutamine võimaldab testida ka agregaatnäitajate tundlikkust muutustele üksiknäitajates, sealhulgas ka küsitlusandmetes sisalduvat võimalikku subjektiivsust.
EISi järgi jagunevad EL liikmesriigid nelja gruppi: 1) innovatsiooni liidrid; 2) innovatsiooni järgijad; 3) tagasihoidlikud innovaatorid; 4) catching-up riigid. Eesti kuulub tagasihoidlike innovaatorite gruppi, Läti ja Leedu catching-up riikide hulka. Meie üheks oluliseks uurimisülesandeks oli välja tuua, mis on olnud need olulisemad tegurid, mis võiksid selgitada Balti riikide erinevat innovatsioonikäitumist ning kas see kajastub ka EIS andmestikus.
Analüüsi tulemusena selgusid mõned innovatsioonisoorituse mõõtmise nõrgad kohad EISis. Näiteks hõlmavad inimkapitali indikaatorid ainult teatud osa haridussüsteemist, ja Balti riikide õnneks just selliseid indikaatoreid, mis neil tugevad on. EISi kohaselt on Balti riikide inimkapital Euroopa Liidu keskmisel tasemel või isegi üle selle. Samal ajal on Balti riikide nõrkuseks inimkapitali ja teadusproduktsiooni, mida sageli mõõdetakse rahvusvahelistelt kõrgelt aktsepteeritud teaduspublikatsioonidena, vaheline nõrk seos. Eriti madal on teadusajakirjades ilmuvate artiklite arv Lätis. Kõikide Balti riikide ühiseks nõrkuseks on

A Comparative Analysis of the National Innovation Performance 55
teaduse ja ettevõtluse vahelised nõrgad seosed. Paraku EIS indikaatorid seda seost olulisel määral ei kajasta.
Teaduse ja ettevõtluse vahelise tõhusa sideme puudumine Balti riikides võib tuleneda nii nende väiksusest kui ka rajasõltuvusest. Väikestel riikidel on keerukam oma avastusi patenteerida, samuti puuduvad post-sotsialistliku taustaga riikide teadlastel head oskused oma töö tulemusi turule viia, seda eriti rahvusvahelisele turule. Riigi väiksus võib mõju avalda ka EIS indikaatorite teatavale ebastabiilsusele; mõned näitajad on mõnikord olulisel määral sõltuvad üksikutest ettevõtetest sektoris ning nendes ettevõtetes tehtud otsustest. Näiteks on n.ö. mitte-teadus- ja arendustegevuseks tehtavad keskmised kulud masinatele ja varustusele Eestis perioodil 2004-2006 suurenenud kaks ja pool korda, kuid seda peamiselt seoses ühe ettevõtte poolt tehtud investeeringutega.
Väikeste riikide mõned innovatsiooninäitajad on väga tundlikud küsimustele vastajate subjektiivsete hinnangute suhtes ning seda eriti riigis kiiresti leviva mitteformaalse info tõttu, mida mõnikord nimetatakse ka väikese riigi sotsiaalseks kapitaliks. Seda väidet kinnitasid ka faktoranalüüsi rakendamise tulemused. Eriti vastaja-tundlikud on need innovatsiooninäitajad, mis ei tulene ettevõtete otsesest teadus- ja arendustegevusest ja ei kajastu teadus- ja arendustegevusele tehtud otsestes kulutustes. Need näitajad põhinevad reeglina CIS küsimustikul, kus on võimaliku subjektiivsuse oht suur. Ettevõtetel on võimalus küsimusi erinevalt (või ka omavahel kokkulepitult) tõlgendada ning otsustada, mida lugeda innovatsioonidega seotud kulutusteks, mida mitte. Ka Eesti maksusüsteem, mis vabastab ettevõtjad investeeringuteks tehtud kasumiosa maksustamisest, mõjutab innovatsioonidega otsesest või kaudselt seonduvate kulutuste erinevat tõlgendamist.
Vaatamata mitmetele mõõtmisprobleemidele võib siiski järeldada, et Eesti innovatsioonisooritus on mõnevõrra paremal tasemel kui kahel ülejäänud Balti riigil. Eesti majanduspoliitika on seni olnud edukam välisinvesteeringute ligitõmbamisel ja ettevõtluse arendamisel. Teatavat positiivset mõju on avaldanud ka Eesti

56 Tiiu Paas, Helen Poltimäe
välisinvesteeringute päritolu. Põhiosa Eestisse tulnud välisinvesteeringutest on pärit innovatsiooniliidrite hulka kuuluvatest riikidest Soomest ja Rootsist.
Innovatsioonisoorituse võrdlevanalüüsi tulemused kinnitavad taas vajadust senisest enam investeerida teadus- ja arendustegevusse ning töötajate ümberõppesse ning radikaalselt parandada koostööd era- ja avaliku sektori vahel ning ülikoolide ja ettevõtete vahel. Oluline on leida oma konkurentsivõimelised nišid innovatsioonitegevuses kasutades selleks just neid tugevaid külgi, mis innovatsioonisoorituse võrdlevanalüüsi tulemusena selgusid ning arendades edasi neid külgi, mis on tugevuste kasutamisele seni takistuseks olnud.