a collection of curricula for the starlab ocean … files/6.x...a collection of curricula for the...
TRANSCRIPT
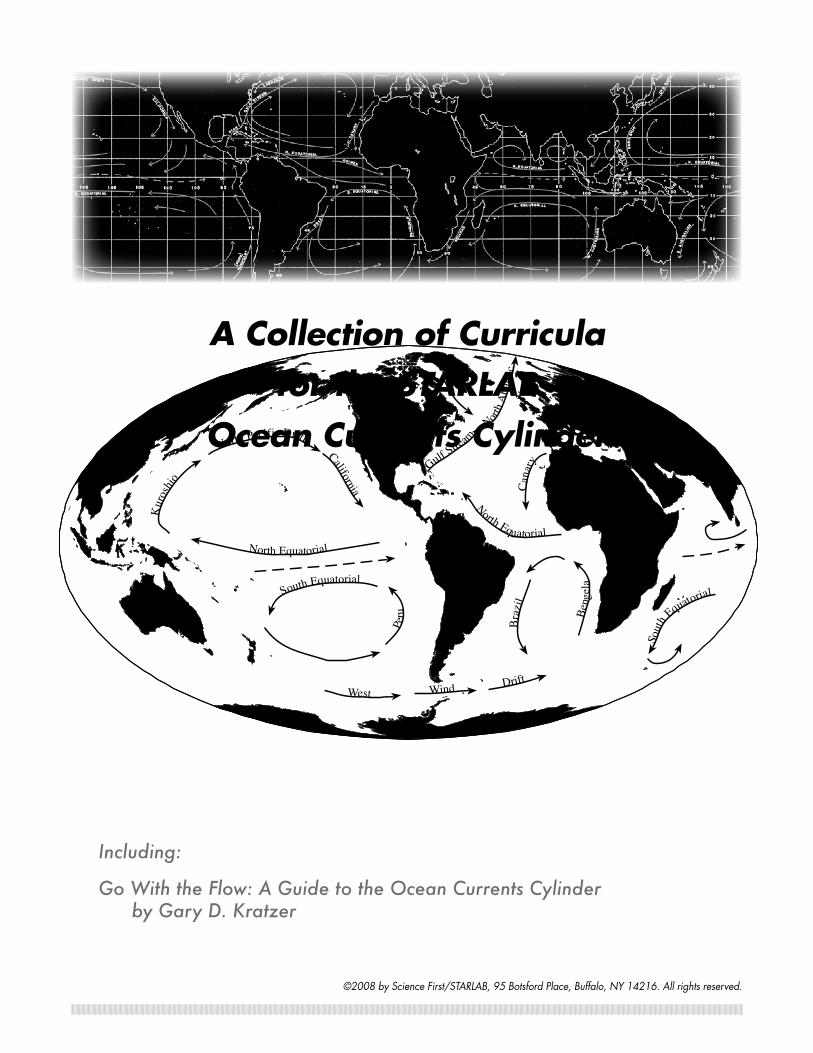
A Collection of Curriculafor the STARLAB
Ocean Currents Cylinder
Including:
Go With the Flow: A Guide to the Ocean Currents Cylinder by Gary D. Kratzer
©2008 by Science First/STARLAB, 95 Botsford Place, Buffalo, NY 14216. All rights reserved.

Curriculum Guide Contents
Go With the Flow — A Guide to the STARLAB Ocean Currents Cylinder .........................................3Introduction to Go With the Flow ..............................4Go With the Flow Lesson .........................................5
Activity Worksheet 1: Go With the Flow ...............6Activity Worksheet 2: Go With the Flow ...............7Activity Worksheet 3: Go With the Flow ...............8Modeling Ocean Currents in the Classroom .........9
Lost at Sea, Lesson 1 .............................................10Activity Worksheet: Lost at Sea, Lesson 1...........11
Lost at Sea, Lesson 2 ........................................12How to Make Magnetic Risers ...............................13Plotting the Path of a Hurricane ..............................14How to Make Glow-in-the-Dark Hurricanes ..............16Coordinates of Famous Hurricanes .........................17
Activity Worksheet 1: Plotting the Paths of Hurricanes ......................................................19Activity Worksheet 2: Plotting the Paths of Hurricanes ......................................................20
Go With the Flow Answer Key ...............................21

• Ocean Currents D-3 • Cylinder Guides
Go With the Flow — A Guide to the STARLAB Ocean Currents Cylinder
Contributed by Gary D. Kratzer

Cylinder Guides • Ocean Currents D-4 •
Materials• STARLAB Portable
Planetarium
• Ocean Currents Cylinder
• colored pencils or crayons
• arrow pointers
• cake pan
• modeling clay or Play-Doh
• rheoscopic fluid
• ring stand
• ring stand clamp
• hair dryer
• tape measures
• tape of ocean sounds
• glow-in-the dark hurricanes or Post-its™
• duct tape
• copies of all worksheets and coordinates
Introduction to Go With the Flow
Purpose
To examine the nature of ocean currents, what causes them and the effects they have on the earth.
Objectives1. Locate the positions of surface and density currents using coordinate values and
describe the factors that cause currents.
2. Make inferences as to how currents influence our everyday lives.
3. Model characteristics of ocean currents and identify factors that influence them.
4. Determine where and when a message in a bottle will be found if placed in an ocean current.
5. Establish a link between hurricane characteristics and ocean currents.
Suggestions
These activities were designed for use in a STARLAB Portable Planetarium but can be conducted in the classroom as well. Special attention has been given to the use of process skills in all of the activities in this guide so that your students will be active participants rather than passive observers. Many of the activities may be modified or adjusted as you see fit for your students. As you work with the Ocean Currents Cylinder you will discover a wealth of possibilities that exist for the development of additional lessons.

• Ocean Currents D-5 • Cylinder Guides
Go With the Flow Lesson
Note
In this planetarium activity, text that is in italics is suggested script for the teacher to use, but not necessarily intended to be read word for word
Objective
To locate the positions of surface and density currents, describe factors that cause cur-rents and make inferences as to how currents influence our everyday lives.
Process Skills
Describing • observing • drawing • interpreting • inferring • working cooperatively • communicating
Preparation
Set up the STARLAB dome and projector. Place the Ocean Currents Cylinder on the cylinder platform. Position the projector (90º latitude) so that longitude values are visible on the horizon. If the longitude values do not appear on the horizon you might have to straighten the wire leads on the projection lamp so that it will sit more erect in the projection lamp socket. Review the coordinate system with your students. Point out the prime meridian, lines of longitude and latitude and the equator. Position the prime meridian straight overhead in the STARLAB. Explain that longitude is measured east (to the right) of the prime meridian or west (to the left) of the prime meridian. Explain that latitude is measured north or south of the equator.
Procedure
After the students are seated and ready, begin a discussion of ocean currents.
Ocean currents move through the oceans like huge rivers. The great horizontal move-ments of water are driven by the wind and move at different speeds. Currents are also influenced by the unequal heating of the earth and the shape of land masses. There is a constant exchange of water from the poles to the equator. Ancient explor-ers used currents to their benefit when investigating the oceans. Today ocean travelers still pay attention to the direction of flow of currents. Today we are going to learn more about the types of currents and what causes them.
Arrange the students into groups of four or five. Pass out the worksheet to the students and have them work cooperatively to answer the questions.
Extensions
Research various coastal climates and report to the class. In the STARLAB, locate the position of various warm and cold water currents such as the North Atlantic Drift or Humbolt Currents (Peru) and describe the impact they have on the climates of Eng-land and South America.
Materials• STARLAB Portable
Planetarium
• Ocean Currents Cylinder
• colored pencils or crayons
• worksheets
• clipboards (optional)
• arrow pointers

Cylinder Guides • Ocean Currents D-6 •
Activity Worksheet 1: Go With the Flow
Note
There are two major types of ocean currents. The first is called a surface current. These less dense cur-rents are influenced by winds. The other major type of current is called a density current. These currents form when water increases in density, sinks to the bottom and begins to flow. Another factor influencing currents and wind movements is the Coriolis effect. This effect is due to the different speeds of the earth’s rotation. The earth’s velocity at the equator is 1600 kilometers per hour (1000 miles per hour) and the exact north and south poles rotate at zero. Currents resulting from the Coriolis effect are known as geostrophic currents. These currents form as bulged water at various latitudes, usually in the middle of the ocean, flows downward and away from the center. Large areas located in the middle of a geostrophic current are called gyres. Equatorial counter currents result when part of the eastward flowing water is carried back toward the west by equatorial currents.
Instructions
Locate the projections of the currents on the dome and answer the following questions on this worksheet.
Questions1. Which direction do currents rotate in the northern hemisphere? Southern hemisphere?
2. What kind of temperature is associated with surface currents?
3. What kind of water temperatures are associated with density currents?
4. What ocean currents originate near the following coordinates? Indicate if it is a surface current (warm) or a density current (cold).
a. 23.5ºN, 80ºW ________________________________________________________________
b. 70ºN, 60ºW ________________________________________________________________
c. 07ºN, 136ºE ________________________________________________________________
d. 12ºN, 30ºW ________________________________________________________________
e. 38ºN, 127ºW ________________________________________________________________
.

• Ocean Currents D-7 • Cylinder Guides
Activity Worksheet 2: Go With the Flow
5. Other than the wind, what other factors influence the patterns of ocean currents?
6. Where do most of the surface currents originate?
7. What happens to the water temperature of a surface current as it moves north? Explain.
8. Where do most of the density currents originate?
9. What happens to the water temperature of a density current as it moves south? Explain.
10. Locate the following coordinates: 30ºN, 45ºW. This area is known as the Sargasso Sea. How do you think water would behave in this area?
11. In 1492, Christopher Columbus sailed to the “New World.” Columbus set sail from an area near coordinates 39ºN, 09ºW. What is the name of this country? If you had been with Columbus on his voyage, which ocean current would you have recommended that he sail with to reach the New World? Which current would you have recommended to Columbus for the return home? Explain.
12. Have your teacher move the Ocean Currents Cylinder so that you can search for the longest ocean current on earth. What is the name of this great current? Is it a surface current or density current? Why?

Cylinder Guides • Ocean Currents D-8 •
Activity Worksheet 3: Go With the Flow

• Ocean Currents D-9 • Cylinder Guides
Modeling Ocean Currents in the Classroom
Objective
To model characteristics of ocean currents and identify factors that influence them.
Procedure1. Have the students make a cake pan model of the east coast of the United States
and Cuba using modeling clay or Play-Doh. Make sure they do not use too much of the area of the pan for the U.S. and Cuba.
2. Fill the pan with rheoscopic fluid. Do not allow the level of the fluid to exceed the height of the coastal model.
3. Position a hair dryer on a ring stand with a clamp or hold it by hand. Point the hair dryer at the lower right side of the pan parallel to the south side of the pan so that the fluid is “pushed” toward Cuba. Turn the hair dryer on low speed. Make sure the fluid flows below Cuba and then parallel to the U.S. east coast.
4. Observe the pattern of the simulated current.
5. Answer the following questions:
a. What did the hair dryer represent in this model?
b. What did the rheoscopic fluid represent in this model?
c. What influence does the land have on the direction of ocean currents?
d. What influence does the wind have on the direction of ocean currents?
e. How did the current flow in your model? (clockwise or counterclockwise)
f. If this was a real ocean current, what kind of temperature do you think the water would be? Why?
g. Describe the action of the fluid in the center of the pan.
Materials• Cake pan (18” x 24”) or
smaller
• modeling clay or Play-Doh
• ring stand
• ring stand clamp
• hair dryer
• rheoscopic fluid (64 oz.)
Note
Rheoscopic fluid is available from Novostar Designs, Inc., 609 McGee Street, Graham, N.C. 27253. Phone: 919-229-5656.

Cylinder Guides • Ocean Currents D-10 •
Lost at Sea, Lesson 1
Objective
To determine where and when a message in a bottle will be found if placed in an ocean current.
Process Skills
Observing • measuring • predicting • estimating • calculating • communicating • working cooperatively
Preparation
The STARLAB projector with the Ocean Currents Cylinder attached should be set at 90º latitude so that all of the northern hemisphere is above the horizon. Students should have worksheets with a chart of the speeds of the various ocean currents. Allow the students to work cooperatively in groups of 4 to 6. The students will be measuring distances on the dome using the scale 1 in = 40 mi or 1 cm = 26 km. Expect a high degree of activity. Caution the students to be careful when moving about the dome. It might be necessary to move the cylinder for some groups so that the distance they are measuring is within reach.
Procedure
After the students are seated in the planetarium explain the purpose of the lesson. Play a tape of ocean sounds.
Today we are going to imagine we are stranded on an island in the ocean. Along with a few supplies, we have an old 2-liter bottle and some paper and a pencil. We do know our location’s coordinates. We decide to place a message in the bottle and throw it into the ocean and hope for the best. Using the chart entitled “Speed the of Currents” and the measurements you make on the dome (1 in = 40 mi or 1 cm = 26 km), predict when and where your message might be found by someone. Then estimate how long it might take to prepare a rescue mission to finally reach you.
Pass out the student worksheets. Assign one or more of the following sets of coordi-nates to a group:
1. 16ºN, 24ºW
2. 25.05ºN, 77.21ºW
3. 7.25ºN, 151.47ºE
4. 12.30ºN, 54ºE
5. 28ºN, 15.30ºW
• After the students have had enough time to complete the instructions on the work-sheet, ask each group to take turns describing the location of their island. Have them discuss the method and the amount of time predicted for the rescue mission. Make sure all of the students are listening during the group presentations.
• As a homework assignment, have the students look up the coordinates on a world map, globe or atlas to find the actual name of the island they were stranded on. The islands listed above are: 1. Cape Verde Islands 2. Bahamas 3. Truk Islands 4. Socotra 5. Canary Islands 6. Near Islands 7. Martinique 8. Saint Helena 9. Marquesas Islands 10. Galapagos Islands.
Materials• STARLAB Portable
Planetarium
• Ocean Currents Cylinder
• tape measures
• worksheets
• arrow pointer
• tape of ocean sounds
Speed of the Currents
North Pacific Current
3 to 6 km/day
(2 to 4 miles)
North or South Equatorial Currents
3 to 6 km/day
(2 to 4 miles)
Gulf Stream and Kuroshio
40 to 120 km/day
(25 to 75 miles)
California and Canary Currents
3 to 7km/day
(2 to 5 miles)

• Ocean Currents D-11 • Cylinder Guides
Activity Worksheet: Lost at Sea, Lesson 1
Instructions
You were given a set of coordinates of an unknown island(s). Write the coordinates on the first line below. Locate the coordinates on the dome. On the map of the world, draw and label the current you think will carry your mes-sage and mark your prediction as to where it will make landfall with the letter “X.” Use your tape measure to find the distance on the dome from the island you are on to where the message might wash ashore. Use the “Speed of the Currents” chart to calculate approximately how long it will take for the message to be carried to land by a current. Remember! 1 in = 40 mi or 1 cm = 26 km. To convert miles to kilometers multiply miles by 1.6. To convert kilometers to miles multiply kilometers by .62. Explain how long it will take for the rescue mission to reach you. Include how you will be rescued. Do any calculations on the back of this sheet.
1. What is the approximate distance from the island to where the bottle might reach land?
2. Using the chart on the right, calculate the approximate time it will take the bottle to reach land.
3. Estimate how long a rescue mission might take to get to your island. Explain how you will be rescued. Use the back of this sheet if neces-sary.
Speed of the Currents
North Pacific Current
3 to 6 km/day
(2 to 4 miles)
North or South Equatorial Currents
3 to 6 km/day
(2 to 4 miles)
Gulf Stream and Kuroshio
40 to 120 km/day
(25 to 75 miles)
California and Canary Currents
3 to 7km/day
(2 to 5 miles)

Cylinder Guides • Ocean Currents D-12 •
Lost at Sea, Lesson 2
Procedure
Assign the following coordinates of islands to your students. You may cut these out and laminate them.
16ºN ............... 24ºW 52.40ºN ....173.30ºW
25.05ºN ..... 77.21ºW 14.40ºN ...........61ºW
7.25ºN .......151.47ºE 15.57ºS .........5.42ºW
12.30ºN ............54ºE 09ºS ..........139.30ºW
28ºN .......... 15.30ºW .30ºS ...........90.30ºW
Note
Your students may be interested to know that during a very bad Pacific Ocean storm on January 10, 1992, eleven steel cargo containers of an ocean-going freighter were washed overboard. One of the containers was forced open and 29,000 bathtub toys spilled into the ocean somewhere near the international date line. Ten months later, the toys began washing ashore along the coast of Alaska. The brightly colored ducks, frogs, turtles and beavers provided oceanographers with a wealth of knowledge about northeast Pacific winds and currents. Oceanographers periodically release bottles into the ocean for studies but usually recover only a few. Scientists used computer models to study the path of the bath toys and predicted that some of the toys would float into the Arctic Sea and perhaps around Greenland into the Atlantic. Another such incident occurred in the Pacific in 1992 when a container of Nike running shoes was washed off the deck of a freighter. Approximately 61,000 Nike shoes followed a similar path to that of the bathtub toys.

• Ocean Currents D-13 • Cylinder Guides
How to Make Magnetic Risers
Note
When conducting the lessons and activities in this guide, it might be neces-sary for all of the northern hemisphere to be visible at one time, including the equator with latitude and longitude coordinate values. As mentioned on the previous page, if the projection lamp is pushed too low into the housing, the result may be projections that are too high on the dome which may pre-vent the equatorial coordinate values from being seen. One effective remedy is to purchase inexpensive ceramic magnets, available at craft stores, that will attach to the existing magnets on the cylinder platform. This adaptation will raise the cylinder enough to allow the equatorial coordinate values to project onto the dome.
Procedure
Use the following diagram to help with putting together a set of magnetic risers.
Note
The Ocean Currents Cylinder may now be placed on top of the magnetic risers just as you normally would. Caution: magnet strength may vary from brand to brand and may not hold the cylinder as firmly as normal. The equator should now be well above the horizon and the latitude and longi-tude coordinate values should be clearly visible for everyone in the plan-etarium.
From a total of 12, stack 3 ce-ramic magnets on top of one another to make 4 magnetic risers. Approx. 13mm (1/2”) diameter and 4mm (3/8”) thick (each).
Place each of the four risers on top of an existing magnet on the cylinder platform
(Side view enlarged)

Cylinder Guides • Ocean Currents D-14 •
Plotting the Path of a Hurricane
Note
In this planetarium activity, text that is in italics is suggested script for the teacher to use, but not necessarily intended to be read word for word.
Objective
To establish a link between hurricane characteristics and ocean currents.
Process Skills
Observing • plotting • communicating • working cooperatively
Preparation
Set up the STARLAB dome and projector. Place the Ocean Currents Cylinder on the cylinder platform. When locating hurricanes in the northern hemisphere, the projector will needed to be tilted to an angle that will conveniently reveal the longitude and lati-tude coordinates so that your students will be able to plot their hurricane coordinates. Make sure the area they are plotting is not too high for them to reach when sticking on the glow-in-the-dark hurricanes or Post-its™.
Procedure
Begin the activity by asking the students about hurricanes.
Ask: “What is a hurricane?”
Hurricanes are devastating storms with winds of 74 mph or more near the storm center. Usually tropical in origin, a hurricane is called a cyclone in the Indian Ocean and a typhoon in the Pacific Ocean.
• Ask the students to use an arrow pointer to show you where hurricanes form (some may point to the Pacific Ocean, some to the Atlantic Ocean). Tell the students that some of the worst hurricanes in history originated in the Atlantic Ocean and eventually affected the United States.
• Review the concept of longitude and latitude. Ask various students to use the pointer to locate lines of longitude, latitude, the prime meridian and the equator. Have the students identify that longitude is measured east or west of the prime meridian, and latitude north or south of the equator.
• Ask the students if they have ever used a hurricane tracking chart. Explain that the STARLAB is about to become a giant tracking chart.
Today we are going to plot the paths of some of the worst hurricanes in history on our giant tracking chart!
• Organize your students into three groups.
• Assign each team a set of coordinates of a hurricane. Pass out 20 glow-in-the-dark hurricanes to each group.
• Tell the students to make a loop of duct tape to put on the back so it will stick on the dome. Hint: If you don’t have the glow-in-the-dark hurricane models, then let your students use Post-its™. Using the assigned coordinates, have the students locate the position of their hurricane. Make sure each student in a group gets coordinates to plot. Crowding may result if several students are plotting at one time. Use extreme caution if it becomes necessary to use a chair or two-step lad-
Materials• STARLAB Portable
Planetarium
• Ocean Currents Cylinder
• glow-in-the-dark hurricanes (see page 16) or Post-its™
• coordinates of hurricanes
• duct tape (one roll per group)
• colored pencils or crayons
• arrow pointer

• Ocean Currents D-15 • Cylinder Guides
der for shorter students to be able to reach higher places on the dome.
• After all coordinates are plotted, the path of famous hurricanes will be visible on the dome. After all the hurricanes have been plotted, have the students draw and label the paths they see on the dome onto their activity sheet. Follow the instruc-tions on the activity sheet.

Cylinder Guides • Ocean Currents D-16 •
How to Make Glow-in-the-Dark Hurricanes
Procedure
Cut out as many as 75 glow-in-the-dark hurricanes from poster board or file folders of almost any color. Paint the counter-clockwise arms with three coats of glow-in-the-dark paint. The inside of the circle does not need to be painted. The “L” (low pressure) in the center can be stenciled or drawn in. It is best to cover these in plastic (laminate) when finished. If you choose to make the “hurricanes,” a six-inch diameter equals a hurricane of 240 miles in diameter.
Extension
Use a slide projector to project an image of a hurricane on the dome. To achieve a small image of a hurricane, position the slide projector on the STARLAB projector case in front of the STARLAB projector. The image will need to be between 6 and 16 inches in diameter to represent a hurricane with a diameter of 240 to 640 miles. Us-ing the coordinates of a known hurricane, have the students position the center of the hurricane image on assigned coordinates. Using duct tape, place a glow-in-the-dark hurricane in place of the hurricane image then move to the next set of coordinates. A “glowing” trail of hurricanes will be left to mark the path.
Hint
To reduce the brightness of the hurricane image on the dome, make a disk to fit over the front of your slide projector’s lens (see diagram below). Cut a piece of plywood or cardboard the same diameter as the projector lens. Drill a one-fourth inch hole in the center of the disk. Tape the disk on the front of the projector lens. This will greatly reduce the brightness of the projected image but will still be bright enough to see in the STARLAB and not wash out the projections from the Ocean Currents Cylinder.

• Ocean Currents D-17 • Cylinder Guides
Coordinates of Famous Hurricanes
Month Date Time Lat. Long.
8 14 7 PM 19.7 82.88 15 7 AM 20.8 83.88 15 7 PM 22.3 84.48 16 7 AM 23.7 868 16 7 PM 25.2 87.38 17 7 AM 27 88.18 17 7 PM 29.2 898 18 7 AM 32 908 18 7 PM 34.5 908 19 7 AM 36.8 88.28 19 7 PM 38 84.58 20 7 AM 37.2 778 20 7 PM 36.7 73.28 21 7 AM 37.2 68.48 21 7 PM 39.1 61.48 22 7 AM 43 54
Month Date Time Lat. Long.
8 19 4 AM 17.6 56.38 19 4 PM 19.2 59.58 20 4 AM 21 618 20 4 PM 22.3 62.58 21 4 AM 24.3 63.78 21 4 PM 25.2 65.48 22 4 AM 25.8 67.58 22 4 PM 25.4 76.58 23 4 AM 25.4 808 23 4 PM 25.8 83.98 24 4 AM 26.8 87.48 24 4 PM 28.2 90.38 25 12 AM 29.7 91.78 25 9 AM 31.5 91.5
Hurricane Camille 1969
Hurricane Andrew 1992

Cylinder Guides • Ocean Currents D-18 •
Month Date Time Lat. Long.
8 23 4 AM 21.7 55.48 23 4 PM 23.7 58.28 24 4 AM 25.4 59.38 24 4 PM 28.3 60.28 25 4 AM 28.6 60.68 25 4 PM 28.6 60.18 26 4 AM 28.6 61.28 26 4 PM 27.4 62.58 27 4 AM 26.6 63.98 27 4 PM 26.5 64.98 28 4 AM 26.9 66.68 28 4 PM 28.3 67.98 29 4 AM 29.8 68.98 29 4 PM 31.2 70.18 30 4 AM 31.8 71.18 30 4 PM 32 72.58 31 4 AM 33.2 74.58 31 4 PM 35.2 75.19 1 4 AM 37.1 73.9
Hurricane Emily 1993

• Ocean Currents D-19 • Cylinder Guides
Activity Worksheet 1: Plotting the Paths of Hurricanes
Instructions
After the coordinates of several hurricanes have been plotted on the planetarium wall, draw and label their paths and names on the map of the world below in different colors. After drawing and labeling the hurricane paths on this worksheet, answer the questions on the next sheet.

Cylinder Guides • Ocean Currents D-20 •
Activity Worksheet 2: Plotting the Paths of Hurricanes
Instructions
Using Activity Worksheet 1, answer the following questions.
1. Where do the hurricanes in the northern hemisphere seem to originate?
2. What ocean current is located near the point of origin of the hurricanes that were plotted?
3. Why did some of the hurricanes turn and head north once in the Gulf of Mexico?
4. Why did one hurricane move north? What might have influenced its behavior?
5. What influences do ocean currents have on a hurricane?

• Ocean Currents D-21 • Cylinder Guides
Go With the Flow Answer Key
Go With the Flow — Activity Worksheets 1 & 2
Question 1
Clockwise in the northern hemisphere and counterclockwise in the southern hemi-sphere.
Note
Some of your students may notice that some currents in the northern hemi-sphere are forced to flow in a counterclockwise direction. Example: Ing-minger Current (N. Atlantic).
Question 2
Warm temperatures are usually associated with surface currents.
Question 3
Cold temperatures are usually associated with density currents.
Question 4
(Currents may be drawn on Activity Worksheet 3, page 6. Names of currents are optional.)
a. surface current (warm)
b. density current (cold)
c. surface current (warm)
d. surface current (warm)
e. density current (cold)
Question 5
Unequal heating of the earth, the Coriolis effect (due to the earth’s different speeds of rotation) and land masses.
Question 6
Most surface currents originate near the tropics (between latitudes 23.5°N and 23.5°S).
Question 7
As a surface current moves north (in the northern hemisphere) the water temperature begins to lower and the water density increases.
Note
Surface currents move south in the southern hemisphere and water tempera-ture lowers as well.
Question 8
Most density currents originate near the polar regions.
Question 9
Water temperature of a density current increases as it moves south. As the water enters the area known as the tropics the temperatures rises quickly.

Cylinder Guides • Ocean Currents D-22 •
Note
Density currents are also affected by the salinity of the water, evaporation and the addition of fresh water by rivers and heavy rainfall.
Question 10
The water in the area known as the Sargasso Sea moves very slowly, as is the case in most gyres. This area is known for Sargasso weed that grows abundantly and was known in early days of navigation as an extreme hazard. Due to the lack of water circulation, most species of ocean life found in this area flourishes near the currents where food is plentiful.
Question 11
Spain (some may identify Portugal as well). Leaving Spain, Columbus should have been advised to sail south with the Canary Current then west with the North Equato-rial Current to the “New World.” On the return voyage Columbus should have been advised to sail north then east with the Gulf Stream which would assist in his return to Spain.
Question 12
The longest continuous current is the West Wind Drift Current which circles the South Pole. The West Wind Drift is a density current because the water is very cold due to its close proximity to the South Pole.
Modeling Ocean Currents in the Classroom
Question 5a. The hair dryer represents the wind (Prevailing Easterlies).
b. The rheoscopic fluid represents ocean water and the Gulf Stream.
c. Land acts as natural boundaries that deflect currents to various directions.
d. The wind pushes the currents in certain directions.
e. Clockwise.
f. Warm water due to its origin being in the tropics.
g. A gyro forms and the rheoscopic fluid circulates very slowly in this area.
Lost at Sea — Activity Worksheet
Question 1
This answer will vary with the proximity of an island to land. Remember: Students have to measure the distance from their assigned location to where they predict the message will make land fall.
Question 2
Time of land fall will vary with distance from land and speed of the current.
Note
When doing calculations, students should be encouraged to average speeds of the currents rather than choosing the fastest speed or slowest speed the current travels per day.
Question 3
Answers will vary depending on the distance a rescue mission has to cover.

• Ocean Currents D-23 • Cylinder Guides
Note
In describing the rescue mission, students should consider whether or not an airplane could land on the island, a helicopter can fly that far, or if a ship would be a better way of accessing the island.
Plotting the Paths of Hurricanes — Activity Worksheet 2
Question 1
Most hurricanes in the northern hemisphere originate in warm water in the tropics.
Note
In the northern hemisphere these storms are called hurricanes in the Atlantic Ocean, and typhoons in the Pacific Ocean.
Question 2
The North Equatorial Current.
Question 3
Wind systems are often responsible for directing the path of a hurricane. To a lesser extent, the direction of current flow in that area has a slight affect on the path.
Question 4
Some of the hurricanes turned north due to the influence of the wind systems and direction of flow of the Gulf Stream.
Question 5
Ocean currents have some affect on hurricanes in that they supply the warm water necessary for hurricane formation. The actual direction the hurricane travels is more dependent on the wind.