a closer look* - innovation alliance
TRANSCRIPT

PricewaterhouseCoopers 1
A closer look*2008 Patent Litigation Study: Damages awards, success rates and time-to-trial
Advisory services

The heart of the matter
With the current threat of an economic recession, commercial litigation and, in particular, patent litigation is picking up. This comes at a moment of heightened action in the patent arena: a recent damages award of $1.5 billion, eight other damages awards in federal district courts exceeding $100 million in the past three years alone, judicial decisions reducing the likelihood of permanent injunctions and scope of eligible damages, proposed legislation to reduce the availability of damages, and a continuing increase in patents granted and actions fi led. Indeed, senior executives are facing a myriad of issues on the use of litigation to protect and monetize their patented products and ideas. Although the risks in patent litigation have increased, the damages awards remain signifi cant. These issues also raise questions about companies’ patent positions, protection and enforcement strategies, and litigation tactics.
The 2007 Microsoft v. Alcatel-Lucent damages award of $1.5 billion in Federal District Court (since reversed by the Court of Appeals for the Federal Circuit, CAFC) draws attention to the magnitude of the economic impact in patent litigation. While the appellate process continues, if the award stands, it would be the largest damages award in US patent litigation history. On the other hand, recent Supreme Court decisions have reduced the leverage of patent holders in enforcing their intellectual property rights. Implications from the decision in eBay v. MercExchange indicate a weakening of the negotiating position for patent holders due to a lower threat of injunctive relief. The decision in the MedImmune v. Genentech matter reduced the fi nancial and willfulness exposure to a licensee in challenging the validity of a licensor’s patent. The decision in the Microsoft v. AT&T matter restricted damages from infringing foreign sales. And, the KSR v. Telefl ex decision broadened the view of patent obviousness, potentially contributing to increased fi ndings of invalidity. On the legislative front, the pending Patent Reform Act of 2007 attempts to reduce the damages available to patent holders by utilizing royalty apportionment and easing the defense on a claim of willfulness. These judicial and legislative developments have curtailed the enforcement capability of patent holders, causing many executives to reassess the associated cost-benefi ts.
Although the impact of judicial decisions and prospective legislation remains to be seen, patent holders continue to assert their patented innovations before the federal courts at a signifi cant and increasing clip. The number of patent infringement actions fi led was 2,896 in 2007, lower than the 3,075 cases in 2004, but with a compound average growth rate (CAGR) of 5.8% since 1991. Meanwhile, the number of patents granted has also risen with a CAGR of 3.8% since 1991—about two-thirds the growth rate of new case fi lings of patent infringement. 2007 witnessed an increase in the number of patents granted from 182,687 in 2006 to 183,831, as shown in Chart 1. Various regulatory initiatives have been introduced to improve the quality of patents granted, as well as to restrict continuations or practices that would lead to uncertain patent expiration dates. In all, these trends suggest that corporations continue to realize value from patenting by the protection provided to their product commercialization initiatives, as well as through enforcement and other monetization efforts.

PricewaterhouseCoopers 1
Chart 1: Patent Case Filings and Grants
Pat
ent c
ases
1,000
1,500
2,000
2,500
3,000
3,500
1991 1992 1993 1994 1995 1996 1997 1998 1999 2000 2001 2002 2003 2004 2005 2006 20070
20,000
40,000
60,000
80,000
100,000
120,000
140,000
160,000
180,000
200,000
Pate
nt g
rant
s
Patent cases Patent grants
Sources: U.S. Patent and Trademark Office: Performance and Accountability Report and U.S. Courts: Judicial Facts and Figures
Years are based on September year-end.
Refl ecting these trends and developments, PricewaterhouseCoopers (PwC) has compiled and maintained a comprehensive database of patent damages awards (from 1980 through 2007), as well as patent holder success rates, appellate reversals and modifi cations, and time-to-trial statistics (from 1995 through 2007). Based upon this study, several observations can be made to help executives and litigators in assessing their patent enforcement and monetization decisions, while informing on litigation tactics.
In a nutshell: The annual median damages award since 1995 has remained fairly consistent, when adjusted for • infl ation.
The disparity between jury and bench awards has widened and is likely the contributing factor in • the signifi cant increase in use of juries since 1995.
Reasonable royalties continue to be the predominant measure of damages awards.•
Patent holders have been successful 37% of the time overall, with a 19% win rate in summary • judgments and a 57% win rate at trial.
Alleged infringers increase their trial success rates slightly as plaintiffs, but have not experienced • the same increased success in summary judgments.
While the median time-to-trial has remained fairly constant since 1995, signifi cant variations arise • by jurisdiction, and patent holder success rates tend to decrease with longer time-to-trial, up to a point.
Certain federal district courts (particularly Virginia Eastern, California Central, and Pennsylvania • Eastern) continue to be more favorable to patent holders, with shorter time-to-trial, higher success rates, and higher median damages awards.
32% of summary judgments are appealed, with 59% modifi ed or reversed; while 43% of trial • decisions are appealed, with 67% modifi ed or reversed.

PricewaterhouseCoopers 2
The annual median damages award since 1995 has remained fairly consistent, when adjusted for infl ation.
Adjusting for infl ation using the Consumer Price Index (CPI), the median annual damages award has remained fairly stable over the last 13 years. The median was $3.9 million from 1995 through 2000, and $3.8 million from 2001 through 2007. There are a few exceptions (1996, 2001, and 2005), as evidenced in Chart 2A; however, those exceptions are infl uenced by signifi cantly fewer cases with damages under $1 million.
Chart 2A: Median Damages Awarded: 1995 to 2007
$0
$5
$6
$7
Med
ian
dam
ages
aw
arde
d ($
in M
M)
$4
$3
$2
$1
Median damages are adjusted for inflation and represented in 2007 U.S. dollars.
$8
$9
$10
6 yr median $3.9 MM
7 yr median $3.8 MM
1995 1996 1997 1998 1999 2000 2001 2002 2003 2004 2005 2006 2007
As shown in Chart 2B, prior to 1995, the annual median awards of patent infringement cases were generally increasing. The median went from $2.1 million in 1985 to $6.1 million in 1994.
Chart 2B: Median Damages Awarded: 1985 to 1994
Median damages are adjusted for inflation and represented in 2007 U.S. dollars.
1985 1986 1987 1988 1989 1990 1991 1992 1993 1994$0
$5
$6
$7
Med
ian
dam
ages
aw
arde
d ($
in M
M)
$4
$3
$2
$1
An in-depth discussion
PricewaterhouseCoopers 3
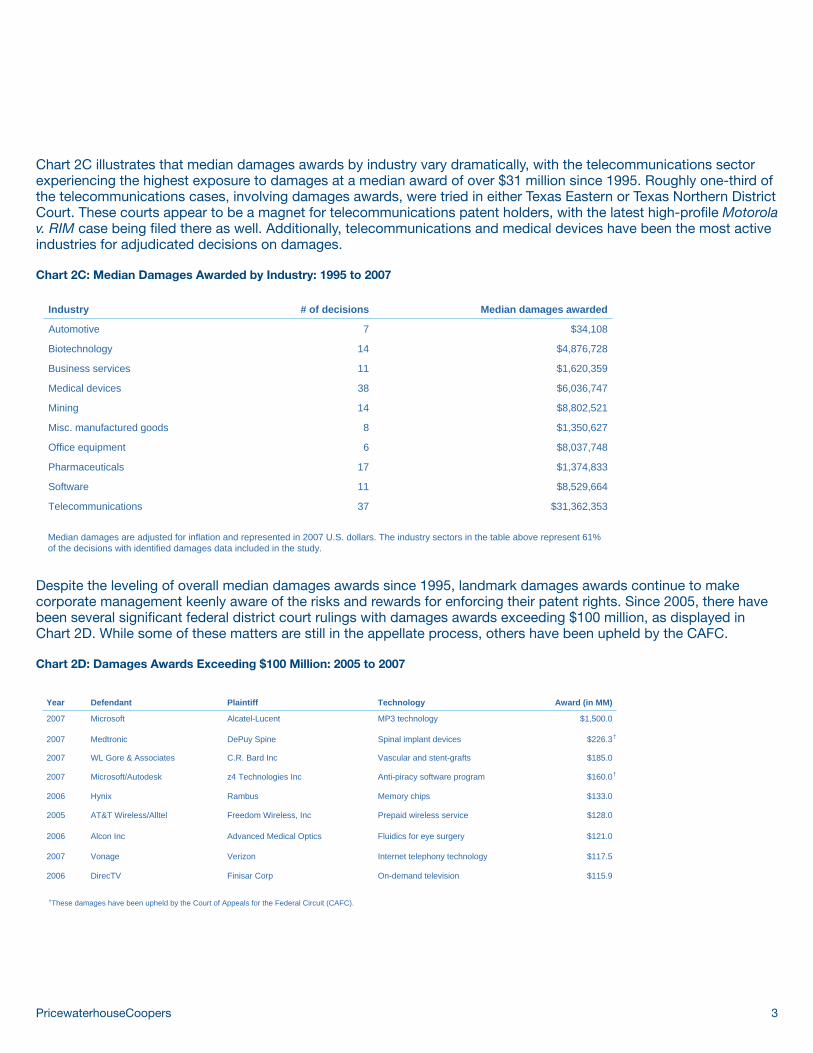
Chart 2C illustrates that median damages awards by industry vary dramatically, with the telecommunications sector experiencing the highest exposure to damages at a median award of over $31 million since 1995. Roughly one-third of the telecommunications cases, involving damages awards, were tried in either Texas Eastern or Texas Northern District Court. These courts appear to be a magnet for telecommunications patent holders, with the latest high-profi le Motorola v. RIM case being fi led there as well. Additionally, telecommunications and medical devices have been the most active industries for adjudicated decisions on damages.
Chart 2C: Median Damages Awarded by Industry: 1995 to 2007
37
11
17
6
8
14
38
11
14
7
# of decisions
$8,802,521Mining
$4,876,728Biotechnology
$1,620,359Business services
$6,036,747Medical devices
$1,350,627Misc. manufactured goods
$8,037,748Office equipment
$1,374,833Pharmaceuticals
$8,529,664Software
$31,362,353Telecommunications
$34,108Automotive
Median damages awardedIndustry
Median damages are adjusted for inflation and represented in 2007 U.S. dollars. The industry sectors in the table above represent 61% of the decisions with identified damages data included in the study.
Despite the leveling of overall median damages awards since 1995, landmark damages awards continue to make corporate management keenly aware of the risks and rewards for enforcing their patent rights. Since 2005, there have been several signifi cant federal district court rulings with damages awards exceeding $100 million, as displayed in Chart 2D. While some of these matters are still in the appellate process, others have been upheld by the CAFC.
Chart 2D: Damages Awards Exceeding $100 Million: 2005 to 2007
$115.9On-demand televisionFinisar CorpDirecTV2006
$117.5Internet telephony technologyVerizonVonage2007
$226.3Spinal implant devicesDePuy SpineMedtronic2007
$185.0Vascular and stent-graftsC.R. Bard IncWL Gore & Associates2007
$160.0Anti-piracy software programz4 Technologies IncMicrosoft/Autodesk2007
$133.0Memory chipsRambusHynix2006
$1,500.0MP3 technologyAlcatel-LucentMicrosoft2007
$121.0
$128.0
Award (in MM)
Alcon Inc
AT&T Wireless/Alltel
Defendant
Advanced Medical Optics
Freedom Wireless, Inc
Plaintiff
Fluidics for eye surgery2006
Prepaid wireless service2005
TechnologyYear
†These damages have been upheld by the Court of Appeals for the Federal Circuit (CAFC).
†
†

PricewaterhouseCoopers 4
In addition to these recent activities, other landmark damages awards over the last 20 years also include those listed in Chart 2E. Many of these cases serve as precedents in different industries, setting the bar at a high level for patent damages awards.
Chart 2E: Landmark Damages Awards: 1985 to 2007
$205.0Seal rings on drill bitsSmith International Hughes Tool Co1986
$178.4Disposable baby diapersProcter & Gamble CoParagon Trade Brands, Inc1997
$505.0ECL technologyIgen InternationalRoche Diagnostics2002
$260.0Video gamesAlpex ComputerNintendo1994
$521.0Internet browserEolas TechnologiesMicrosoft2003
$910.0Instant photo cameraPolaroidKodak1990
Award (in MM)Defendant Plaintiff TechnologyYear
†These damages have been upheld by the Court of Appeals for the Federal Circuit (CAFC).
†
†
†
†
The disparity between jury and bench awards has widened and is likely the contributing factor in the signifi cant increase in use of juries since 1995.
In 2007, the percent of jury trials (42%) versus bench trials (58%) was consistent with 2006 (jury trials 43% versus bench trials 57%). That said, there has been a marked increase in jury trials since the 1980s, with the shift becoming more evident since 1995. As shown in Chart 3A, prior to 2000, juries decided only 14% of the cases with damages awards during the 1980s and 22% during the 1990s. In this decade, juries have decided 43% of the cases with damages awards.
Chart 3A: Use of Bench v. Jury Trials by Decade
86%
78%
57%
14%
22%
43%
0%
10%
20%
30%
40%
50%
60%
70%
80%
90%
100%
1980s 1990s 2000s
Bench trials Jury trials

PricewaterhouseCoopers 5
Focusing on the time period since 1995, Chart 3B shows that jury decisions have increased from 16% to 42%, briefl y overtaking bench trials in 2002 as the preferred forum, before settling back in mid-40% range in the later 2000s.
Chart 3B: Use of Bench v. Jury Trials: 1995 to 2007
1995 1996 1997 1998 1999 2000 2001 2002 2003 2004 2005 2006 20070%
10%
20%
30%
40%
50%
60%
70%
80%
90%
100%
Bench trials Jury trials
There are a number of factors contributing to the increased use of juries as the preferred forum for patent cases. Trial success rates show stark contrasts when decided by juries compared to bench trials. Jury success rates have consistently outperformed their bench counterparts for every year since 1995, as shown in Chart 3C.
Chart 3C: Bench v. Jury Trials: Success Rates 1995 to 2007
1995 1996 1997 1998 1999 2000 2001 2002 2003 2004 2005 2006 20070%
80%
90%
Tria
l suc
cess
rate
100%
40%
30%
20%
10%
Bench trials Jury trials
50%
60%
70%

PricewaterhouseCoopers 6
In addition, as shown in Chart 3D, the median damages awarded by juries are signifi cantly larger than the median bench award.
Chart 3D: Bench v. Jury Trials: Median Damages Awarded by Decade
Med
ian
dam
ages
aw
arde
d ($
in M
M)
$0
$5
$6
$7
$4
$3
$2
$1
$8
$9
$10
Median damages are adjusted for inflation and represented in 2007 U.S. dollars.
$0.7
$2.1
$0.9$1.0
$2.6
$8.6
1980s 1990s 2000s
Bench trials Jury trials
Recent awards by juries have been running several multiples of the amounts awarded by judges. Chart 3E emphasizes the discrepancy in median awards since 2001. While jury awards have remained high, bench awards have decreased signifi cantly.
Chart 3E: Bench v. Jury Trials: Median Damages Awards 1995 to 2007
Bench trials Jury trials
1995 1996 1997 1998 1999 2000 2001 2002 2003 2004 2005 2006 2007$0
$5
$10
Med
ian
dam
ages
aw
arde
d ($
in M
M)
$15
$20
$25
Median damages are adjusted for inflation and represented in 2007 U.S. dollars.
PricewaterhouseCoopers 7
The increase in damages awarded by juries in patent cases may be due to several factors such as the increased volume of business at issue, increased research and development expenses invested in technology, greater risks involved in reaching commercial success, juries’ reduced sensitivity to large dollar awards with public disclosures of larger profi ts and net worth from major company defendants, and plaintiffs with larger envisioned damages believing juries will look more favorably upon them than judges. Additionally, global competitive pressures have forced the hand of many domestic companies to protect their ideas and processes at all costs. Accordingly, juries have been more willing than ever to reward innovation and ingenuity.
Reasonable royalties continue to be the predominant measure of damages awards.
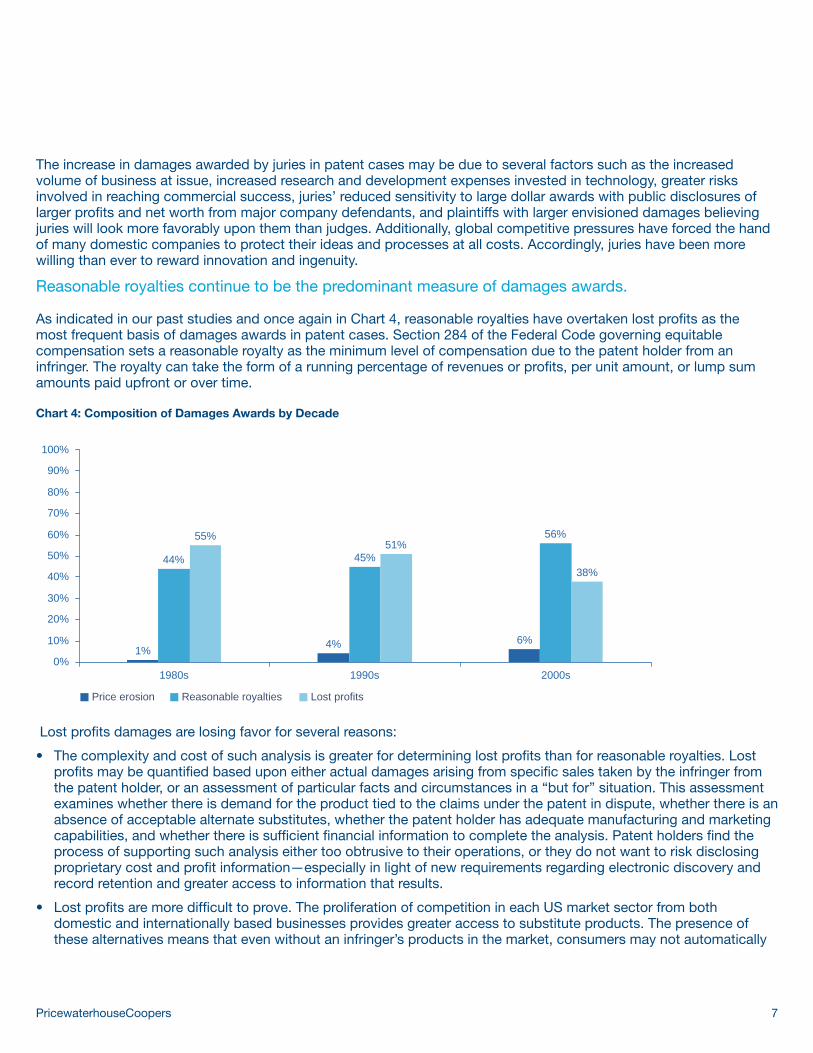
As indicated in our past studies and once again in Chart 4, reasonable royalties have overtaken lost profi ts as the most frequent basis of damages awards in patent cases. Section 284 of the Federal Code governing equitable compensation sets a reasonable royalty as the minimum level of compensation due to the patent holder from an infringer. The royalty can take the form of a running percentage of revenues or profi ts, per unit amount, or lump sum amounts paid upfront or over time.
Chart 4: Composition of Damages Awards by Decade
1% 4% 6%
44% 45%
56%55%51%
38%
0%
10%
20%
30%
40%
50%
60%
70%
80%
90%
100%
1980s 1990s 2000s
Price erosion Reasonable royalties Lost profits
Lost profi ts damages are losing favor for several reasons:
The complexity and cost of such analysis is greater for determining lost profi ts than for reasonable royalties. Lost • profi ts may be quantifi ed based upon either actual damages arising from specifi c sales taken by the infringer from the patent holder, or an assessment of particular facts and circumstances in a “but for” situation. This assessment examines whether there is demand for the product tied to the claims under the patent in dispute, whether there is an absence of acceptable alternate substitutes, whether the patent holder has adequate manufacturing and marketing capabilities, and whether there is suffi cient fi nancial information to complete the analysis. Patent holders fi nd the process of supporting such analysis either too obtrusive to their operations, or they do not want to risk disclosing proprietary cost and profi t information—especially in light of new requirements regarding electronic discovery and record retention and greater access to information that results.
Lost profi ts are more diffi cult to prove. The proliferation of competition in each US market sector from both • domestic and internationally based businesses provides greater access to substitute products. The presence of these alternatives means that even without an infringer’s products in the market, consumers may not automatically

PricewaterhouseCoopers 8
buy the patent holder’s products. Furthermore, the growing use of specialized distribution channels for reaching a specifi c consumer demographic increasingly supports an infringer’s contention that its customers are different from those of the patent holder.
More of these suits are brought by entities that own patent rights, but do not have any manufacturing or distribution • capabilities. These patent holders cannot show that the infringer actually took any sales away from them.
Patent holders have been successful 37% of the time overall, with a 19% win rate in summary judgments and a 57% win rate at trial.
To understand patent holder success rates since 1995, PwC studied 1,282 fi nal decisions issued at two stages of the litigation life cycle: summary judgment (666 decisions) and trial (616 decisions). PwC did not study the continuation rates of summary judgments or settlements taken place prior to or after trial.
In combining summary judgment and trial decisions, Chart 5A demonstrates that overall patent holders were successful 37% of the time. The success rate slightly improved over the last seven years of our study, at a 40% average success rate, compared to the fi rst six years, at an average of 32%.
Chart 5A: Patent Holder Overall Success Rates: 1995 to 2007
6 yr avg. 32%
7 yr avg. 40%
Suc
cess
rate
Success rate includes patent holder successes as both plaintiffs and defendants.
29%
41%37% 36%
30%
21%
41% 41%46% 45%
38%37%35%
0%
10%
20%
30%
40%
50%
60%
70%
80%
90%
100%
1995 1996 1997 1998 1999 2000 2001 2002 2003 2004 2005 2006 2007

PricewaterhouseCoopers 9
Studying success rates at summary judgment versus trial sheds further insight. Since 1995, Chart 5B illustrates that patent holders only succeeded in 19% of summary judgments versus a 57% success rate at trial.
Chart 5B: Patent Holder Success Rates: Case Stage Comparison
Suc
cess
rate
0%
50%
60%
70%
80%
90%
100%
40%
30%
20%
10%
Overall Summary Judgment Trial
37%
57%
19%
Success rate includes patent holder successes as both plaintiffs and defendants.
Chart 5C shows that trial success rates have also increased signifi cantly over the last seven years of our study, at an average of 63%, as compared to the fi rst six years of our study, with a 47% average success rate.
Chart 5C: Patent Holder Success Rates at Trial: 1995 to 2007
6 yr avg. 47%
7 yr avg. 63%
0%
50%
60%
70%
80%
90%
100%
40%
30%
20%
10%
1995 1996 1997 1998 1999 2000 2001 2002 2003 2004 2005 2006 2007
Tria
l suc
cess
rate
Success rate includes patent holder successes as both plaintiffs and defendants.

PricewaterhouseCoopers 10
Alleged infringers increase their trial success rates slightly when they are plaintiffs, but have not experienced the same increased success in summary judgments.
Declaratory judgments are not uncommon in patent litigation, representing 9% of all cases identifi ed. The most frequent claims made in declaratory actions are non-infringement and patent invalidity. Chart 6 suggests that since 1995, while alleged infringers slightly improve their trial success rates when they are plaintiffs (52% versus 42% as defendants), the same is not true when a fi nal decision is issued in summary judgment.
Chart 6: Alleged Infringer Success Rates: 1995 to 2007
Suc
cess
rate
85%
42%37%
52%
0%
10%
20%
30%
40%
50%
60%
70%
80%
90%
100%
Summary Judgment Trial
Infringer as defendant Infringer as plaintiff
While the median time-to-trial has remained fairly constant since 1995, signifi cant variations arise by jurisdiction and patent holder success rates tend to decrease with longer time-to-trial, up to a point.
Data for time-to-trial was obtained for 394 trials in 65 different districts, using the court dockets for each matter. Time-to-trial was calculated from the complaint date to the fi rst day of either the bench or jury trial for each case. In Chart 7A, the distribution of overall time-to-trial indicates that 66% of cases reached trial three years from the date the initial complaint was fi led.
Chart 7A: Time-to-Trial Distribution of Cases: 1995 to 2007
Num
ber o
f tria
l cas
es w
ith ti
me-
to-tr
ial d
ata
Time-to-trial
160
140
120
100
80
60
40
20
0<1 year 1-2 years 2-3 years 3-4 years 4-5 years >5 years
35
137
90
48
34
50
Cum
ulat
ive
% o
f tot
al
0%
50%
60%
70%
80%
90%
100%
40%
30%
20%
10%

PricewaterhouseCoopers 11
There have been no marked up-ticks or delays in trial start dates. Chart 7B shows that the median of time-to-trial has maintained a fairly steady pace at just over two years from the complaint date to trial, even as the volume of cases has increased substantially since 1995.
Chart 7B: Median Time-to-Trial: 1995 to 2007
1995 1996 1997 1998 1999 2000 2001 2002 2003 2004 2005 2006 20070.0
0.5
1.0
1.5
2.0
2.5
3.0
3.5
Median time-to-trial
Med
ian
time-
to-tr
ial (
in y
ears
)
1995 1996 1997 1998 1999 2000 2001 2002 2003 2004 2005 2006 2007
The industry sectors, mentioned previously, do not appear to vary widely regarding median of time-to-trial, with the differences between jurisdictions causing a more signifi cant impact.
Chart 7C: Median Time-to-Trial by Industry: 1995 to 2007
34
18
55
11
9
15
43
14
17
7
# of decisions
2.51Mining
2.00Biotechnology
2.39Business services
2.90Medical devices
2.20Misc. manufactured goods
1.85Office equipment
2.20Pharmaceuticals
1.65Software
2.00Telecommunications
1.65Automotive
Median time-to-trial (in years)Industry
The industry sectors in the table above represent 48% of the decisions with time-to-trial data included in the study.

PricewaterhouseCoopers 12
Indeed, since 1995, there are signifi cant variations in the median of time-to-trial across jurisdictions. To assess the lead time, PwC focused on the most active districts. Among the courts with the most activity, Chart 7D summarizes the median time-to-trial from 1995 to 2007. Based on the cases identifi ed, Virginia Eastern and Wisconsin Western districts have the shortest time-to-trial.
Chart 7D: Median Time-to-Trial by District: 1995 to 2007
1.89Kansas6
1.71California Central3
3.76Massachusetts19
2.99Colorado17
2.73New Jersey15
2.41Florida Southern13
2.32Minnesota122.10New York Southern11
1.99Texas Southern91.91Pennsylvania Eastern8
1.89Delaware6
4.66Connecticut20
3.42Illinois Northern18
2.87California Northern16
2.41Texas Northern14
2.03Michigan Eastern10
1.79Texas Eastern51.71Florida Middle3
0.91Wisconsin Western2
2.16Overall (all decisions identified)
1
Rank
0.88
Median time-to-trial (in years)
Virginia Eastern
District
The median time-to-trial for Wisconsin Western was based upon limited data.
PricewaterhouseCoopers 13
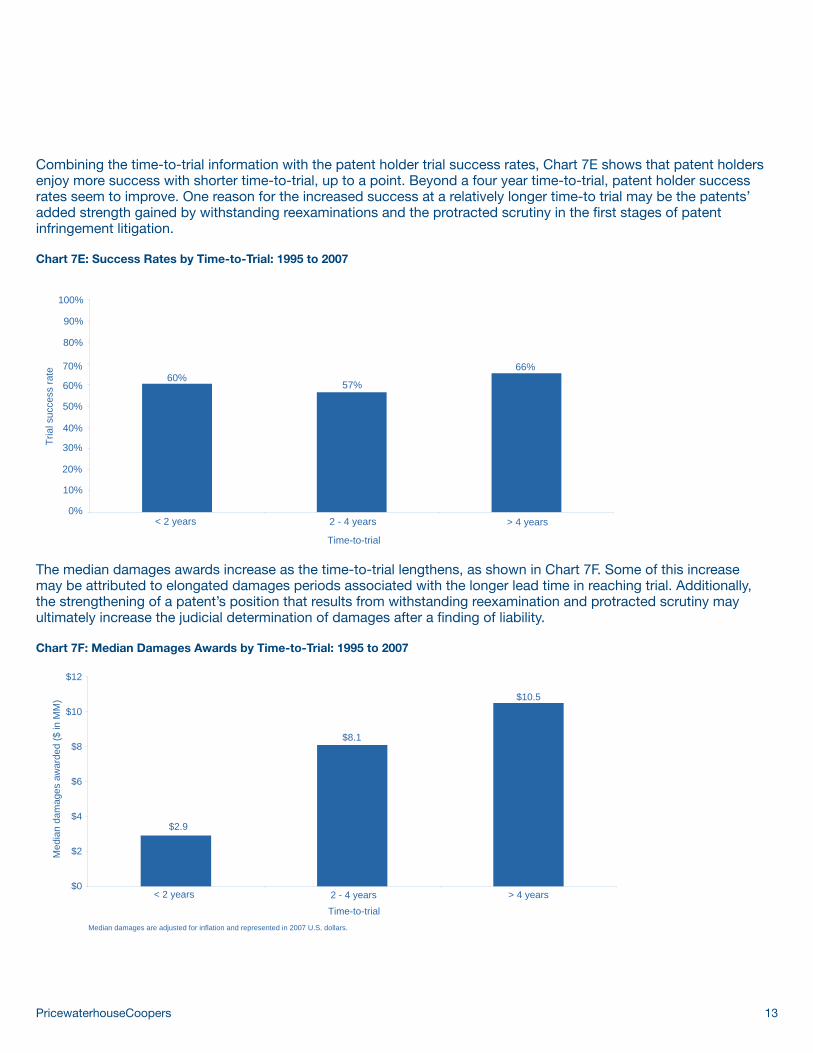
Combining the time-to-trial information with the patent holder trial success rates, Chart 7E shows that patent holders enjoy more success with shorter time-to-trial, up to a point. Beyond a four year time-to-trial, patent holder success rates seem to improve. One reason for the increased success at a relatively longer time-to trial may be the patents’ added strength gained by withstanding reexaminations and the protracted scrutiny in the fi rst stages of patent infringement litigation.
Chart 7E: Success Rates by Time-to-Trial: 1995 to 2007
Tria
l suc
cess
rate
< 2 years 2 - 4 years > 4 years 0%
50%
60%
70%
80%
90%
100%
40%
30%
20%
10%
60%57%
66%
Time-to-trial
The median damages awards increase as the time-to-trial lengthens, as shown in Chart 7F. Some of this increase may be attributed to elongated damages periods associated with the longer lead time in reaching trial. Additionally, the strengthening of a patent’s position that results from withstanding reexamination and protracted scrutiny may ultimately increase the judicial determination of damages after a fi nding of liability.
Chart 7F: Median Damages Awards by Time-to-Trial: 1995 to 2007
Med
ian
dam
ages
aw
arde
d ($
in M
M)
< 2 years 2 - 4 years > 4 years
$12
$10
$8
$6
$4
$2
$0
$2.9
$8.1
$10.5
Median damages are adjusted for inflation and represented in 2007 U.S. dollars.
Time-to-trial

PricewaterhouseCoopers 14
Certain federal district courts (particularly Virginia Eastern, California Central, and Pennsylvania Eastern) continue to be more favorable to patent holders, with shorter time-to-trial, higher success rates, and higher median damages awards.
After considering median time-to-trial, median damages awarded, summary judgment win rates and trial win rates, certain jurisdictions emerge as being more favorable venues for patent holders. The following charts focus on the districts with a minimum of 15 decisions issued from 1995 to 2007. Chart 8A presents the top 20 districts based on an average of their respective categorical rankings for each of the statistical measures mentioned above. Each categorical ranking was weighted equally, representing 25% of the overall rank.
Chart 8A: District Court Rankings: 1995 to 2007
168.3%1452.0%12$4,967,481102.10New York Southern15
1016.7%962.5%15$2,960,620183.76Massachusetts15
1112.5%766.7%18$1,432,659---------Indiana Southern12
200.0%1650.0%20$651,03492.03Michigan Eastern20
525.8%1650.0%5$21,634,708142.73New Jersey9
818.0%962.5%10$8,691,60061.89Delaware7
234.6%668.0%8$10,000,77731.71California Central2
1510.0%210.0%3$22,894,618---------U.S. Court of Federal Claims15
1112.5%1357.5%9$8,696,631152.87California Northern12
200.0%470.0%1$27,339.621162.99Colorado10
1112.5%1160.0%7$10,185,53481.99Texas Southern8
333.3%175.0%21$335,61231.71Florida Middle5
718.2%175.0%4$22,148,01971.91Pennsylvania Eastern2
917.4%1160.0%14$3,529,104112.32Minnesota11
136.4%766.7%11$5,682,74520.91Wisconsin Western4
18.9%57.0%$1,808,5782.16Overall (all decisions identified)
168.3%371.9%6$19,689,23751.79Texas Eastern6
623.7%1551.2%13$4,545,732173.42Illinois Northern14
19
18
1
Overall rank
$1,994,727
$1,620,359
$25,431,763
Mediandamagesawarded
16
17
2
Rank
2.41
2.41
0.88
MedianTime-to-trial
(in years)
12
12
1
Rank
426.4%568.4%Virginia Eastern
168.3%2041.7%Florida Southern
1411.1%1944.4%Texas Northern
RankRank
SJsuccess
rate
Trialsuccess
rateDistrict
Median damages are adjusted for inflation and represented in 2007 U.S. dollars. This study does not include time-to-trial information for Indiana Southern and the U.S. Court of Federal Claims. The ranking for these courts are based on their relative ranking for each of the remaining statistical measures. The median time-to-trial for Wisconsin Western was based upon limited data.

PricewaterhouseCoopers 15
In combining summary judgment and trial decisions, Charts 8B and 8C include those districts with a minimum of 15 cases and ranks them according to overall success rates.
Chart 8B: Top 5 Districts by Overall Success Rates: 1995 to 2007
37.2%
50.0%
50.0%
51.0%
54.6%
66.7%
Overall success rate
57.0%
66.7%
68.4%
68.0%
71.9%
75.0%
Trial success rate
18.9%
36.4%
26.7%
34.6%
8.3%
33.3%
SJ success rate
Overall (all decisions identified)
Wisconsin Western
Virginia Eastern
California Central
Texas Eastern
Florida Middle
Top 5 districts
5
4
3
2
1
Chart 8C: Bottom 5 Districts by Overall Success Rates: 1995 to 2007
37.2%
33.0%
30.6%
25.0%
18.5%
15.8%
Overall success rate
57.0%
57.5%
52.0%
41.7%
50.0%
50.0%
Trial success rate
18.9%
12.5%
8.3%
8.3%
0.0%
6.7%
SJ success rate
Overall (all decisions identified)
California Northern
New York Southern
Florida Southern
Michigan Eastern
Connecticut
Bottom 5 districts
5
4
3
2
1

PricewaterhouseCoopers 16
32% of summary judgment decisions are appealed, with 59% modifi ed or reversed; while 43% of trial decisions are appealed, with 67% modifi ed or reversed.
As the number of damages decisions in patent cases has increased over the last 25 years, so have the number of appeals decisions heard by the CAFC. Chart 9A illustrates that patent holders appeal their losses at much higher rates than alleged infringers after trials (57% versus 33%) and summary judgments (34% versus 23%). However, patent holders are more successful getting a modifi cation or complete reversal of decisions from their appeals after trial than after summary judgments. Meanwhile, alleged infringers are more successful getting a modifi cation or complete reversal of decisions after summary judgment than after trial. A modifi ed decision is defi ned as a case that has had an appellate outcome that does not completely affi rm or completely reverse the original decision. Affi rmed and reversed decisions include those appellate outcomes in which the original decision was either completely affi rmed or completely reversed.
Chart 9A: Appellate Breakdown by Case Stage and Decision Rates: 1995 to 2007
Decided at summary judgment(666)
Decided at trial(616)
Patent holder wins
Patent holder loses
Patent holder loses
Patent holder wins
553
263
353
113
21%46%33%43%266
41%
44%
19%
29%
39%
Affirmeddecision
rate
Of cases appealed
215
189
26
149
117
Appeals identified
14%45%32%
13%43%34%
19%62%23%
19%52%57%
23%38%33%
Reversed decision rate
Modified decision rate% appealed
Chart 9B shows the appellate breakdown of trial cases based upon the trial forum and the resulting appellate outcomes. Jury trials are much more likely to be appealed than bench trials by the patent holders, and the reverse is true for appellants who are alleged infringers. Meanwhile, patent holders are slightly more successful in appeals of jury trials than bench trials, and alleged infringers are slightly more successful in appeals of bench trials than jury trials.
Chart 9B: Appellate Breakdown by Trial Forum and Decision Rates: 1995 to 2007
Decided by bench(364)
Decided by jury(190)
Patent holder wins
Patent holder loses
Patent holder loses
Patent holder wins
196
39
151
170
17%47%36%35%68
31%
29%
34%
11%
53%
Affirmeddecision
rate
Of cases appealed
178
108
70
28
40
Appeals identified
14%55%49%
20%51%55%
6%60%41%
21%68%72%
15%32%26%
Reversed decision rate
Modified decision rate% appealed
554 cases were identified as either bench or jury cases. 62 cases were not identified as either bench or jury cases.

PricewaterhouseCoopers 17
Chart 9C focuses on the modifi ed and reversed decisions by exploring the leading reasons for a changed outcome.
Chart 9C: Leading Reasons for Modifi ed and Reversed Decisions: 1995 to 2007
Per
cent
age
of re
vers
als
49%
25% 26%
0%
20%
40%
60%
80%
100%
Claim construction changes Patent validity changes Other reasons
Chart 9D illustrates that among the districts with a minimum of 15 decisions issued from 1995 to 2007, Massachusetts, California Northern, and Illinois Northern have experienced the greatest percentage of trial and summary judgment cases appealed at 46%, 42%, and 41%. In addition, among all the districts, Illinois Northern has experienced the greatest percentage of cases being modifi ed or reversed at 71%.
Chart 9D: Districts with the Highest Appeal Rates: 1995 to 2007
24%40%36%34%3398New York Southern
10%36%54%35%39111Delaware
38%33%29%41%48117Illinois Northern
42%
46%
% appealed
88
54
# of decisions
35%
36%
Modified decision rate
27%38%37California Northern
25
# of appeals
36%
Affirmeddecision rate
28%Massachusetts
Reversed decision rateDistrict

PricewaterhouseCoopers 18
In light of the fi ndings in this study, patent litigation appears to continue to be an effective protection and monetization path for patent holders. Although legislation is to be put in place that may infl uence patenting activities and the litigation process, for now, the courts appear to be increasingly protecting those patent holders proving the validity, enforceability, and infringement of their patents. With trial success rates at their highest level in history, patent holders appear to be winning with considerable awards of damages. The forum and the venue of a case can have a substantial impact on the outcome and should be carefully considered. The likelihood of success and the amount of damages awarded to the patent holder have been shown to vary dramatically between jury and bench trials and among federal districts. A shorter time-to-trial typically benefi ts a patent holder, but the probability of a success declines slightly after two years. However, if the time-to-trial exceeds four years, the trend seems to reverse due to the strengthening of a patent’s position and the expansion of the damages period increasing the probability of success and a more signifi cant damages award. Also, time-to-trial and success rates by district seem to go hand in hand. Finally, appellate outcomes vary depending on the stage of the case at the time of the decision (summary judgment versus trial) and the forum issuing the district court decision (bench versus jury), with claim construction changes representing the most common reason for modifi ed and complete reversal of decisions.
What this means for your business

PricewaterhouseCoopers 19
Methodology
To study the trends related to patent decisions, PricewaterhouseCoopers identifi ed fi nal decisions at summary judgment and at trial recorded in two WestLaw databases, Federal Intellectual Property - Cases (FIP-CS) and Combined Jury Verdicts and Settlements (JV-ALL). The study focuses on 666 summary judgment, 616 trial, and 481 unique CAFC patent decisions issued since 1995. Key defi nitions for certain terms used throughout the study are listed below:
Cases decided at summary judgment included those district court patent infringement cases where a response to a • motion that could affect the fi nal decision on infringement (patent invalidity or non-infringement) was decided by a judge.
Cases decided at trial included those district court patent infringement cases where an opinion was rendered by a • judge or jury at trial.
Appeals included only those appeals for cases where a fi nal decision was made at summary judgment or at trial.•
A “Success” included instances where a liability and damages (if included) decision was made in favor of the • patent holder.
A “Loss” included instances where a liability and damages (if included) decision was made in favor of the • alleged infringer.
A “Modifi ed decision” included those appellate outcomes that do not completely affi rm or completely reverse the • original decision.
An “Affi rmed decision” and a “Reversed decision” included those appellate outcomes in which the original decision • was either completely affi rmed or completely reversed.
“Time-to-trial” was calculated from the complaint date to the fi rst day of either the bench or jury trial for each case.•

About the authors
Aron Levko is a partner in PricewaterhouseCoopers’ Chicago offi ce and is a leader in the Intellectual Asset Management Practice in the Americas. He has extensive experience working with trial lawyers, corporate management, and entrepreneurs in a broad range of industries for more than 35 years. Mr. Levko’s current work focuses on intellectual asset matters, as well as other complex business valuation analysis. He has extensive expert testimony experience on issues such as damages analysis, licensing practices, business valuations and commercial success. He has prior experience at Ford Motor Company as a car product planner and Rockwell International as a plant controller. Mr. Levko has an MBA in Finance from the University of Chicago and a BSE in Industrial & Operational Engineering from the University of Michigan. He is an Accredited Senior Appraiser, Certifi ed Management Consultant and a Certifi ed Production & Inventory Control Manager. Mr. Levko is also a candidate as a Certifi ed Licensing Professional.
Vincent Torres is a director in the Advisory Services practice of PricewaterhouseCoopers’ Chicago offi ce. Mr. Torres has over 10 years of management consulting experience advising clients on a broad range of strategy execution opportunities and challenges related to product and customer pricing and profi tability, competitive positioning, and emerging business models. He has particular expertise in matters involving new technologies and business models in the high technology and entertainment and media industries, and in assessing value drivers in decisions involving intellectual assets. Over the years Mr. Torres has also worked with corporate executives, entrepreneurs and lawyers in support of commercial transactions, assessing damages in commercial litigation disputes, and evaluating and monitoring risks with respect to intellectual asset management processes. Mr. Torres holds a BA in economics from Duke University and an MBA from the Fuqua School of Business at Duke University.
Joseph Teelucksingh is an associate in the Advisory Services practice within PricewaterhouseCoopers’ Chicago offi ce. Mr. Teelucksingh has particular business experience in dispute analysis, intellectual asset management and business analytics. Mr. Teelucksingh has worked with clients and attorneys in support of intellectual property litigation and price fi xing disputes in a wide variety of industries including telecommunications, consumer electronics, chemicals and medical devices. Mr. Teelucksingh has evaluated risks and market dynamics with respect to multiple intellectual property transactions. Mr. Teelucksingh graduated from the University of Notre Dame with an MSA and a BA in accounting with a minor in economics from Bethel College.
Special thanks to:
Alexander Hirsch
Diana Hwu
Ernest Fierro
Adam Fleming

pwc.com
© 2008 PricewaterhouseCoopers LLP. All rights reserved. “PricewaterhouseCoopers” refers to PricewaterhouseCoopers LLP (a Delaware limited liability partnership) or, as the context requires, other member fi rms of PricewaterhouseCoopers International Limited, each of which is a separate and independent legal entity. *connectedthinking is a trademark of PricewaterhouseCoopers LLP.CI-08-0529