(a case study of district peshawar) · (a case study of district peshawar) ... di = households...
TRANSCRIPT

(A Case Study of District Peshawar)(A Case Study of District Peshawar)
Iftikhar Ahmad, Mirajul Haq and Iftikhar Ahmad, Mirajul Haq and Abdul SattarAbdul Sattar

22
Introduction Introduction
Objectives of the studyObjectives of the study
Theoretical frameworkTheoretical framework
Situation analysis of Peshawar Situation analysis of Peshawar
Empirical ResultsEmpirical Results
Conclusion Conclusion

‘‘Safe drinking water is the basic need of Safe drinking water is the basic need of each human being. In the past 100 years each human being. In the past 100 years
the world population tripled, but water use the world population tripled, but water use for human purposes multiplied six fold for human purposes multiplied six fold
(World Water Council, 2000).(World Water Council, 2000).’’

Water is a basic need of human lifeWater is a basic need of human lifeOver the time, access to safe drinking Over the time, access to safe drinking water has become difficultwater has become difficultIn Pakistan, per capita water availability In Pakistan, per capita water availability in 1951 was 5000 cm/capita which fell to in 1951 was 5000 cm/capita which fell to 1100 cm/capita in 20051100 cm/capita in 2005Only 23.5% rural & 30% urban have Only 23.5% rural & 30% urban have access to safe drinking water in Pakistanaccess to safe drinking water in Pakistan

Inadequate drinking water not only results Inadequate drinking water not only results in more sickness and deaths but also in more sickness and deaths but also causes causes higher health cost, low work productivity, higher health cost, low work productivity, lower school enrolment, and induces lower school enrolment, and induces poverty poverty 88% of diarrheal diseases are due to unsafe 88% of diarrheal diseases are due to unsafe drinking waterdrinking waterIn Pakistan 0.2 million children die due to In Pakistan 0.2 million children die due to water borne diseases water borne diseases 1.8 m people in developing countries die 1.8 m people in developing countries die from waterfrom water--borne diseases per yearborne diseases per year

66
If improved water supply is achieved it can If improved water supply is achieved it can reduce the diarrhoea morbidity by 6 to 25% reduce the diarrhoea morbidity by 6 to 25% per annum per annum Chlorination at point of use can lead to a Chlorination at point of use can lead to a reduction of diarrhoea disease by 35 to 39 reduction of diarrhoea disease by 35 to 39 percent annually percent annually Hence, it is vital to understand why has Hence, it is vital to understand why has adoption of safe drinking water practices not adoption of safe drinking water practices not been universalbeen universalThis study would estimate and analyze the This study would estimate and analyze the magnitude of awareness, perception, practices, magnitude of awareness, perception, practices, and demand for safe drinking water. The study and demand for safe drinking water. The study elaborates households (HHs) Willingness to elaborates households (HHs) Willingness to Pay (WTP) for improved water quality and Pay (WTP) for improved water quality and services in district Peshawar, NWFP, Pakistanservices in district Peshawar, NWFP, Pakistan

To analyze the determinants of demand for To analyze the determinants of demand for safe drinking water.safe drinking water.To measure householdTo measure household’’s ability & s ability & willingness to pay (WTP) for improved willingness to pay (WTP) for improved water quality and services.water quality and services.To highlight issues and factors influencing To highlight issues and factors influencing WTP in different scenarios. WTP in different scenarios. Propose policy recommendations.Propose policy recommendations.

Two basic theoretical approaches used for Two basic theoretical approaches used for the estimation of WTPthe estimation of WTPDirect approach Direct approach –– Stated preferences of Stated preferences of consumers (CVM)consumers (CVM)Indirect approach Indirect approach –– Revealed preferences Revealed preferences of consumers (ABA)of consumers (ABA)

CV is a method of estimating the economic CV is a method of estimating the economic value of nonvalue of non--marketed environmental goodsmarketed environmental goods
Survey questions are used that bring out Survey questions are used that bring out individual preferences regarding such goodsindividual preferences regarding such goods
CV is a stated preference in which simply ask CV is a stated preference in which simply ask individual how much they are WTP for individual how much they are WTP for improved water improved water servicesservices
This method quantify the change in wellbeing This method quantify the change in wellbeing that individual obtain from the provision of a that individual obtain from the provision of a particular good/services, particular good/services, in monetary termin monetary term..

(ABM)(ABM)ABM takes into account the consumer WTP for ABM takes into account the consumer WTP for quality improvementquality improvement
Risk averting behaviors are quantified through Risk averting behaviors are quantified through the consumerthe consumer’’s coping cost for improved water s coping cost for improved water quality quality
Main assumption is that consumer makes choices Main assumption is that consumer makes choices in order to maximize their wellbeing when faced in order to maximize their wellbeing when faced with unsafe drinking water with unsafe drinking water
ABM suggests that WTP depends on any variable ABM suggests that WTP depends on any variable that affects the that affects the marginal productmarginal product of pollution, of pollution, mitigating activities and avoidance costmitigating activities and avoidance cost

ModelModel
WTPi = WTPi = ßß0 + 0 + ßß1 (Hi) + 1 (Hi) + ßß2 (Di) +2 (Di) +ßß3 (Mi) + ui3 (Mi) + ui
WTPi = HouseholdsWTPi = Households’’ willingness for continuous willingness for continuous and potable water suppliesand potable water supplies
Hi = Households characteristics (Education level Hi = Households characteristics (Education level of HH head, income/wealth level of the HH)of HH head, income/wealth level of the HH)
Di = Households demographic characteristics Di = Households demographic characteristics (urban, rural)(urban, rural)
Mi = Media exposure of HH head [television and Mi = Media exposure of HH head [television and newspaper habit of HH head]newspaper habit of HH head]

Total sample sizeTotal sample size–– 315 HH, 2455 HH 315 HH, 2455 HH members members 30 UC were selected out of 92 total30 UC were selected out of 92 total50% rural & 50% urban50% rural & 50% urban
Table 1. Sample Profile by Rural UrbanTable 1. Sample Profile by Rural UrbanNo. of UCsNo. of UCs Number of Number of
HouseholdsHouseholdsHH HH MembersMembers
Average Average HH SizeHH Size
RuralRural 1515 152152 1,2651,265 8.328.32
UrbanUrban 1515 163163 1,190 1,190 7.307.30
TotalTotal 3030 315315 2,4552,455 7.797.79

Educational disparity amongEducational disparity amongMale and FemaleMale and Female
Education Desparity
-
10.00
20.00
30.00
40.00
50.00
60.00
Illterate Underprimary
Primary Middle Metric F.A BA MA
Educational Levels
Per
cent
age
Male Female
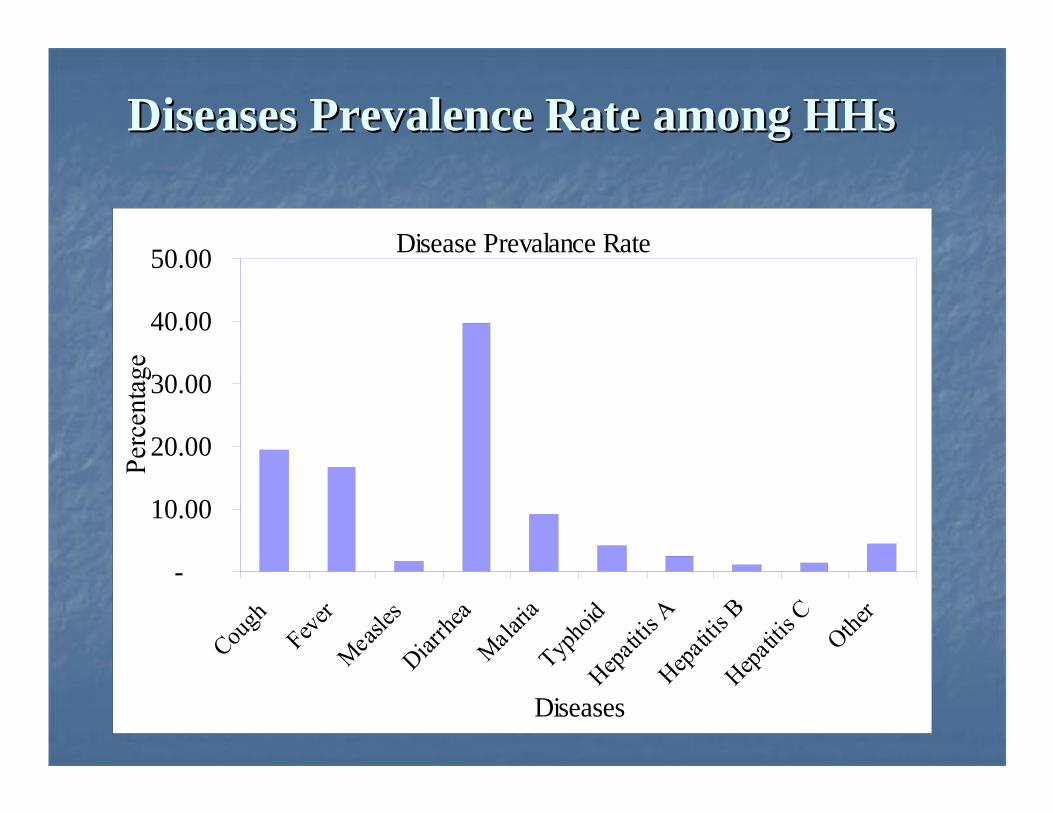
Diseases Prevalence Rate among HHsDiseases Prevalence Rate among HHs
Disease Prevalance Rate
-
10.00
20.00
30.00
40.00
50.00
Diseases

1515
Acceptance for Improved Water Supply Acceptance for Improved Water Supply
SystemSystem
Average WTP for MCAverage WTP for MC-- Rs. 101/month (241 Rs. 101/month (241 HHs)HHs)
Average WTP for PCAverage WTP for PC-- Rs. 82/month (175 Rs. 82/month (175 HHs)HHs)
Binary Logistic RegressionBinary Logistic Regression

1717

1818
Multinomial Logistic RegressionMultinomial Logistic Regression

1919

2020

2121

2222

2323

2424

For both services & quality For both services & quality improvement of drinking water, HH in improvement of drinking water, HH in Peshawar are willing to payPeshawar are willing to payThere are statistically significant and There are statistically significant and quantitatively nonquantitatively non--negligible effects of negligible effects of formal education on demand and formal education on demand and willingness to pay for improved water willingness to pay for improved water services. services. There is a strong effect of informal There is a strong effect of informal education like print media on the water education like print media on the water purification behaviour of HHs.purification behaviour of HHs.

2626
WTP of a more educated person is higher WTP of a more educated person is higher than an uneducated personthan an uneducated person
This study empirically proved the role of This study empirically proved the role of awareness besides the income constraint is awareness besides the income constraint is the key determinants of demand for safe the key determinants of demand for safe drinking water drinking water

2727
Education and awareness campaigns about Education and awareness campaigns about clean water are powerful tools for public clean water are powerful tools for public health interventions.health interventions.As water purification measures are mostly As water purification measures are mostly carried out by women at home therefore, carried out by women at home therefore, measures should be taken to educate and measures should be taken to educate and aware them about cheaper and easily aware them about cheaper and easily adoptable measures for water purification. adoptable measures for water purification. Print and electronic media can be used to Print and electronic media can be used to play a role in sensitizing and informing play a role in sensitizing and informing people about health hazards associated with people about health hazards associated with unsafe drinking water unsafe drinking water

2828