a black box identification in frequency domain
TRANSCRIPT
ETEP
A Black Box Identification in Frequency Domain P. Mercorelli, P. Terwiesch
Abstract
Harmonic oscillations as integer multiples of the fundamental frequency in a power system are caused by non- linear physical effects such as switching or saturation. Modelling and detection of these harmonics are cru- cial for power system control and protection. The present paper proposes the use of wavelet networks with smooth local trigonometric functions as activation functions. A new algorithm is proposed, together with the use of the Cross Entropy function as a tool for evaluating the model quality. The algorithm consists of recursive dual iter- ations with biorthogonal smooth local sine and cosine wavelet packets in order to calculate the adjustable pa- rameters related to the activation functions. The algorithm efficiently minimizes the Shannon Entropy function by adaptively choosing the best time-frequency cells on the wavelet packet tree. During every loop the Cross Entropy function between estimated outputs and target outputs is checked. A procedure by using trigonometric wavelet packets is proposed as an effective tool for disturbance detection, power quality analysis and non-li- near harmonic circuit modelling. Simulations of a converter bridge for traction drives are included to illus- trate the effectiveness of the algorithm and the choice of the activation function.
1 Introduction
Recent literature, e.g. [l], marks progress in the field of wavelet and wavelet packet approaches to power quality analysis and control. In our contribution a method for constructing estimators with non-ortho- gonal wavelets is presented, in particular for training with sparse data set. Such sparse data often occurs in classification problems and in the modelling of control systems, where the dimension of the available data is limited compared to the dimension of the input. Smooth trigonometric bases have a high degree of sim- ilarity with typical signals that occur in power systems, where the transient occurence of harmonics in phenom- ena such as transformer inrush current requires a com- bination of transient time-frequency analysis together with the steady-state qualities of the Fourier transform. Standard Fourier transform shows desirable behaviour under steady-state conditions, but is not suitable for tran- sients as it has no localization in the time dimension. The interest in smooth local trigonometric bases is due to the importance of the smoothness property, as emphasized in [2]. In short, local trigonometric bases have several disadvantages:
The Fourier series converge rapidly only when the function is smooth and periodic. The approximations are, in general, discontinuous because the time intervals are handled separately. It is not clear how to divide the time axis into inter- vals. These disadvantages are overcome by using smooth
local trigonometric bases as well shownin [2]:[3]. It is known that this approach solves the first two problems and in order to overcome the third it is possible to use adaptive algorithms where the splitting locations are allowed to depend on the analysed signal as for in- stance in [4]. Moreover, using wavelet packets numeri- cal efficient algorithms can be built running on the tree, in particular an algorithm which uses the Shannon Entropy function are proposed in order to split the time interval.
The importance of Shannon's Entropy function which represents a way to measure the decorrelation among subspaces or more in general among systems is already known in the ergodic theory and in the compression data problem. In other words, the Shannon Entropy function as in eq. (1 2) measures the flatness of the energy distri- bution for a given signal, so that, trying to minimize the Entropy function of this signal, useful indications for an efficient representation of the signal can be obtained. This means that this function is good for signal com- pression but is not of necessity good to evaluate the dis- tance between the target output and the estimated output and thus in general between the model and its relative observed real system. The Cross Entropy function which is a generalization of Shannon's Entropy to the input/out- put multipatern class as developed in recent literature, as in [5], [6], is a measure of the discrepancy among signals and can be efficiently used like a discriminant informa- tion functional. The present paper proposes a heuristic algorithm based on the minimization of the Shannon Entropy function during every step in order to choose the best compression data form. At the end of every loop in order to estimate the goodness of the model the Cross Entropy between estimated outputs and target outputs is checked. The chosen tool are wavelet packets in wavelet networks. They are essentially radial basis function net- works, see [7]. Networks that use wavelets as activation functions are new in the literature and therefore few re- sults were published in process identification. The wavelet networks provide flexible coordinate systems, their adaptive time-frequency cells are able to capture the features of the signals in reasonable computational calculations. More, the non-orthogonal libraries allow more elasticity in order to approximate the training sig- nals, see [7], even though the optimal expansion of a sig- nal in a redundant dictionary of waveforms is an NP-com- plete problem, thus suitable only for problems with small dimensions. The procedure is similar but simplier than the projection porsuit regression in [8] or stepwise selection by orthogonalization in [7] because the algorithm con-
ETEP Vol. 13, No. 1, January/February 2003 29
E T E D
siders every step again all the elements of the bases pre- viously selected without any elimination. In classifica- tion and in modelling problems, the experimental data is not uniformly distributed in the input/output space, fit- ting is improved by using localized functions and ap- proximating in different resolution levels. Although there is not yet any theoretical result about the represen- tation of this new structure, easy implementation and nice simulation results indicate this approach as agood model for non-linear systems particularly when physical insight is not available and a black box model has to be adopted [9]. In our case each neuron of the network is a smooth trigonometric wavelet in order to perform the non- linearity with harmonic signals. The output signal is the result of the activation function evaluation on the signal and an adjustable parameter. In other words, once se- lected the suitable activation function, like basis ele- ments of the approximating subspace, the identification of aprocess consists of selecting amodel through thepro- jection over this subspace with the model being a linear combination of the basis elements.
1.1 Non-parametric estimation
It is well known that non-parametric estimators are useful for black box non-linear system modelling. Nor- mally the design of such an estimator consists of two steps: choosing the class of the activation function and developing an algorithm for determining its parameters based on the observing data. Let x c where do is the number of samples for each signal and the diyensionality of the signal space x or pattern space which is a subset of the standard do-dimensional vector space which con- tains all signals under consideration. The dimensionality of the signal space is equivalent to the length of the sig- nals. It is worked with dyadic wavelet packets and thus it is assumed that do = 2"o for some no and in general for regression problems y = R, where y is the output signal space. Then an efficient black box identification problem could be briefly formulated in two steps:
Given a set n of observing data
as a sample of the input-output random variable pair (x,y) find a map called feature extractor g: { x + F ] c 3' with k (( do in order to extract relevant features.
Let a functionf: 3' + 3 such that: Y = f ( x ) + E (2)
where the functionfis assumed to be non-linear and belonging to functional continuous, square integrable, etc. space and E is a white noise independent of x. The final problem is to find a non-parametric estimator off based on 0.
It is worthwhile to pay attention to the dimensiona- lity problem in order to improve the efficiency of the algorithm. In fact, non-parametric estimators offered from the curse of dimensionality, grow the complexity of the estimators with the input dimensional do. The phe- nomenon is related to the fact that the sample length n is exponential related to the length do of the input sample x. In general when the input data training 0 is sparse in the input space and only parts of this space explored by
the sparce training data are of interest then the curse of dimensionality is not so heavy. This happens in classifi- cation problems and modelling of control systems where the functionfis estimated only on the same small portion of the input space. In order to overcome the curse of di- mensionality problem a good choice of the estimator is also useful. In fact when the estimator is close to the physical phenomenon under consideration then the in- formation is concentrated in few data, see section 3, for further details see [9]. In our case the reduction of the dimensionality is performed in two steps. Step 1:
Step 2:
Data shrinkage in order to reduce the number n of signals (the sample length). The subspaces are chosen using the Shannon Entropy function.
Step 1 allows to select the most important subspaces. In fact, given an approximating wavelet library not all the wavelet functions are useful but only a small number of these are important. In particular there are several sets of inputs which do not hit the wavelet support and they can beeliminated. Step 2 selects the subspaces where the level of information has the best time-frequency probability distribution. The proposed algorithm uses basically the best basis paradigm as in [4] or [6] which allows a rapid search among a large collection of bases. The complexity of the calculation is O(k(log(k))p), wherep is equal 1 or 2 depending on the basis type, wavelet dictionaries or trig- onometric wavelet dictionaries respectively.
The paper is organized as follows. In section 2 the smooth trigonometric wavelet packets theory is briefly discussed. In section 3 the analytic problem formulation and several issues are discussed. Section 4 is devoted to the description of the algorithm and at the end in sec- tion 5 two different possible applications are presented. In the appendix several technical aspects related to the biorthogonality of the trigonometric basis are reported.
2 Wavelet frames and biorthogonal smooth trigonometric wavelet packets
Wavelet transform and wavelet series are becoming popular in signal processing and numerical analysis. Loosely speaking, a functionflx) can be decomposed into
(3)
where ~ / o ~ , ( x ) are the wavelet functions, normally ob- tained by dilating and translating a mother function I@) and w ~ , ~ ) is the weight coefficient for ~ ~ , ~ ) ( x ) . The indi- ces j and n denote the dilation and translation, respec- tively. The most popular algorithms are related to the orthonomal wavelet bases [ 101 characterized from fast and elegant algorithms. There are besides these, less used, the wavelet frames, for which the computations of the coefficients are more complicated but which have certain advantages. As wavelet frames consist of non- orthogonal wavelet families, they are redundant bases. To be more formal:
Definition I : A family of functions {I,!/G,,,)(x); 0,n) E Z, x E 3} in a Hilbert space H is called a frame of H if for every elementffx) E H there are two positive con- stants A and B such that:
f (x) = C C w(j ,n)V( j ,n) (x) , i n
30 ETEP Vol. 13, No. 1, January/February 2003
ETEP
where with (a,.) the inner product and with 1141 the norm is indicated.
It is already known that, under the frame condition, f ( x ) can be recovered from ( f (x) ,u /~ . ,~) (x) ) with some iter- ative procedure [ 101. Hence, if the set of bases constitutes a frame, the reconstruction of the functionflx) in eq. (3) is ensured. For practical implementation infinite wavelet frames must be truncated into finite sets. By relaxing the orthogonality much more freedom on the choice of the wavelet functions is gained and elasticity for the choice of the basis in order to approximate signals with sparse data sets. Sparse data often occurs in classification prob- lems and in the modelling of the control system, an ex- haustive approach was given in [7 ] . Many applications in signal detection and image processing call for the use of basis functions that are local in time (or space) and fre- quency. The reason is that most signals have both tem- poral and spectral correlation and the use of basis func- tions that are local in time and frequency is a good idea in order to point out the characteristics of the signal. The biorthogonal smooth local trigonometric bases have bas- ically fast convergence and good approximation level. In particular the smoothness of the basis guarantees a con- tinuous approximation, see [ 2 ] . Normally when talking about the trigonometric wavelet functions it is not im-
I I I I I I I I p.u. 0.10
0.05
t h s o 3
-0.05
-0.10
p.u. 0.10
0.05
t h z o 3.
-0.05
-0.10
-0.15 I I I I I I I I I 0 0.02 0.04 0.06 0.08 0.10 0.12 s 0.14
ETEP t -
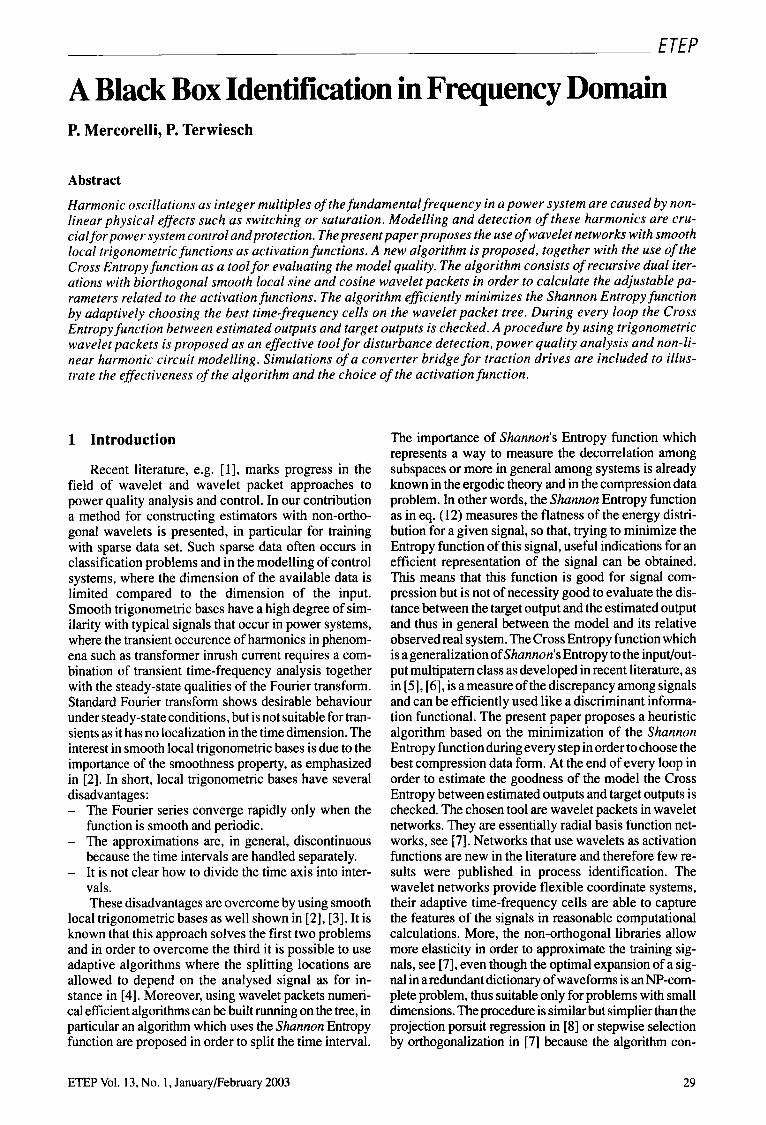
Fig. 1. a) Adjacent (orthogonal) cosine waveforms with smooth windows b) bi-orthogonal smooth local sine and cosine function
mediately clear how to divide in the best way the real axis into intervals. An adaptive algorithm is proposed based on the minimization of Shannon's Entropy func- tion which splits the time interval depending on the ana- lyzed signal [4].
Definition 2: Let a library of wavelet packets be the collection of functions of the form
W(d,j,n)(x) = W(j ) (2dx - n), ( 5 )
where (d,n) E 2 andj E N. It is already remarked that it is talked about truncated
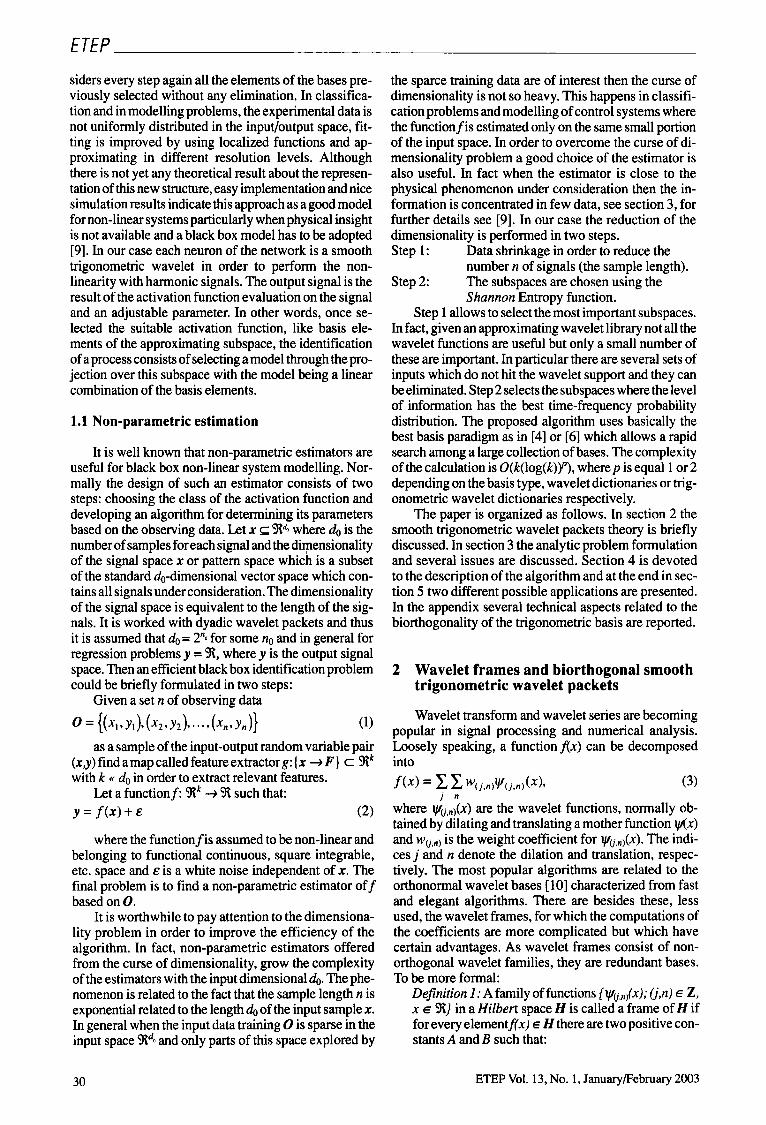
indices, thus finte libraries of wavelet packets. Here, the pyramidal packet is represented with the indices (dj ,n), d is the level of the tree (scaling parameter), j is the fre- quency cell (oscillation parameter) and n the time cell (lo- calization parameter). The function yqdj,&) = ~ ( 2 ~ x - n ) is roughly centered at 2dn , has support of size = 2'd and oscillates = j . Taking a basis with cells on different levels of the tree a non-orthogonal basis (frame) is obtained: the symmetry of the windows is lost but not their deri- vability, they are sums of the derivable functions. In other words, taking functions on different levels of the tree, superpositions of functions on different frequency cells are considered, the orthogonality is lost. Our algo- rithm will work transversally on the wavelet packet tree without any restriction in order to use all the possible combinations of the bases, all the possible frames. Fig. 1 and Fig. 2 are given in order to give an idea about the smooth trigonometric packets, for further details see [ll]. From Fig. 1 it is possible to see how the wavelet functions are time-supported and that they are adimen- sional. In fact, on the vertical axis no dimension is re- ported.
To go a little bit more in depth, it is supposed that the signal consists of N = 2' dyadic and equally spaced sam- ples and the library tree contains all the local trigonom- etric anal ses to level L of the frame, with windows of size 2L, 2 I , . . . , 1. The basis function will be indexed by the triplet (dj ,n): if N is the total number of samples then
E
ETEP
Fig. 2. Organization of local intervals into a binary tree for smooth local trigonometric wavelets a) adjacent orthogonal basis b) functions on different levels of the tree is a frame
ETEP Vol. 13, No. 1, January/February 2003 31
L l L l
the corresponding samples related to the dlevel with rel- ative desampling are Nd = 2d and 0 5 d I L, 0 I j < 2L-d, 0 I n < 2d. The scale parameter d gives the number of de- compositions of the original signal window into sub- windows and the position index n numbers the adjacent windows. Thus the information cell is drawn over the horizontal (time) interval I , = [2%, 2L-d(n+l)[. In gen- eral, the local trigonometric bases, for instance the cosine basis for the subspace over the time subinterval I , con- sists of the function with the associated information cell alongside the frequency intervalZj= [2$, 2d(j+l)[ on the vertical axis (frequency). The basis functions have the nominal frequencies in 2d(j+[ 1/21). Each subdivision halves the nominal window width and thus the resolution level, in particular the resolution level on the tree could be represented like a collection of rectangles: [2L-dn, 2L-d (n + 1 ) [ x [2dj, 2d (j + l ) [ ,
3 Analytic problem formulation
The first question is which function to use like ac- tivation function. This is a difficult decision, the collected experience on this sense does not help too much. All of the model structures are capable of approximating any 'reasonable function' [12] . Thus the question is to pick one that suits the application, in the sense that only few terms will be needed. A suitable criterion known in the literature is to select the basis which, once fixed a thresh- old level, has the minimum number of elements in the selected frame. Now, having chosen the best family how to choose the size of the frame subset? Finally, how to select the terms of the subset?
Selecting the best regressors from a finite set of re- gressor candidates is a typical problem in regression analysis. In our case the sets of regressor candidates are two truncated smooth trigonometric wavelet library frames {C(dj,n)(f), S(dj,nJ(t)} . The problem is to select a number of elements from (cfdj,,,(t), S(dj,,J(t)} based on the input/output training data
0 = {(~~(~),Yl(~)),(~Z(~),YZ(~)) ,...,( x ~ ( f ) , Y ~ ( f ) ) } , (6)
f (x) = c u ( d , j , n ) v ( d , j , n ) ( X ) * (7) in order to build the regression:
v(d.,a) E { C ( d . , . n ) ps (d . , .n) }
Once selected the family regressor, for instance the truncated sine/cosine wavelets, the (dj ,n) parameterized family:
(8)
(9) should contain a finite number of wavelets, as less as possible, so that the regressor selection procedure can be efficiently applied. Within a given approximating wave- let library not all the wavelet functions are useful, nor- mally only a small number of the coefficients is impor- tant, the others can be neglected. In order to explain the construction of the wavelet network let us start with a re- gular wavelet lattice. Many wavelets in the regular lattice do not contain any data point in their support because of
%' = { W i d , j , n ) ( t ) ; (d, n) E 2, j E N , t E %},
%s = {v;d,j,np); (4 n) E 2, j E N , t E %},
and
the sparseness of the data. The training data point does not provide any information for determining the coefficients of these empty wavelets, this means that they are super- fluous for the regression estimation and could be elimi- nated. In general the candidate library can be selected as follows:
and
where E is a chosen small positive number. In this way the 'empty' wavelets are eliminated from the wavelet frame. In other words it is started from a regular tree packet (library) and only those which support hitting our training data are selected. This method is called wavelet shrinkage by some authors [7]. It will be shown that with very few bases of the local trigonometric functions a good function detector can be obtained. Another impor- tant motivation that can generalize this criterion will be more obvious when the algorithm will be described. In fact one computational efficient way to minimize the function eq. (12) is to use biorthogonal frames. In mod- elling problems, for training wavelets, sometimes a cri- terion is used based on the Entropy, see [4,9]. The En- tropy function is defined as
where and P are the estimated and the true proba- bility, respectively for agiven signal 4 to belong tothe class C. Moreover, the Entropy function He is the measure of the information needed to locate a system in a certain state, in other words He is the measure of the ignorance about the system. In our problem this function plays a special role. In fact it is necessary to remember that the Entropy function He of the expansion can be seen as a distance which measures the efficiency of a particular basis for expanding a given function. Roughly speaking one basis is more efficient than another if its coefficients decrease to zero more rapidly. This means in fact that the probability to find the signal at the time tin this subspace is higher than another. At the end, to complete the ap- proximation, a measure of the goodness of the matching between real measured input/output and performed input/output is needed. More formally our problem could be formulated as follows:
Regressor selection: For a given set of output observing data
0 = ((XI @>, Y , ( t ) ) , (XZ(t), YZ(t))r * * * Y (Xk ( t ) . Y k ( t ) ) ) . (13) and for the truncated wavelet frames
ETEP Vol. 13, No. 1, January/February 2003 32

ETEP
,. P =
with the trigonometric functions as defined in [3] theele- ments belonging to the frame in eq. ( 14) have to be found in the weights U ( d j , n ) according to the index
2
C U ( d . j , n ) ( k ) W ( d . j , n ) ( X k ) . (16) Y ( d . i . n ) E { C ( d . , . , , ) , S ( d . i . n ) }
4 An algorithm for training wavelet networks
Black box models are referred to as statistical or em- pirical models because physical insights are not available. The main objective of network training is to build a sta- tistical model from the input-output data. Recent ap- proaches [5] have developed efficient training tech- niques using Cross Entropy function with a statistical point of view. Given the index as defined in eq. (15)
the coefficients C(d j ,n ) and S(dj ,n) belonging to the truncated cosine and sine frames have to be found. For minimizing He as defined in eq. ( 12) they are represented as follows:
/ \ - I
and \ - I
' c ~ ( Y k 7 W { d , j , n ) ( X k ) ) * (d , j ,n)EW
(19)
The goodness of the approximation has to be checked during every step, more details can be found in subsection 4.1.
It should be remarked that the coefficients C(d j ,n ) and S(d j ,n ) are constant on each interval, which is connected with Heisenberg's indetermination problem. It is known that given alibrary of bases the Entropy minimization cri- terion looks at the most equilibrated basis [4], now be- cause of the biorthogonality of the sine and cosine frames the optimum can be found separately, further details are given in the Appendix. It has to be remarked again that not only the element belonging to the same dilation but every- where on the tree is considered, thus forming frames.
The problem so presented suggests an interesting al- gorithm. In fact, because of the biorthogonality of our frames the minimum of the index defined in eq. (17) can be found separately for each frame (sine/cosine). This could be performed in a dual approximation in two steps: the first step consists of the approximation on the cosine subspaces looking for the most equilibrated basis (mini- mum for the Shannon function) on this frame; the second step with the residual of this approximation again on the sine subspaces and so on recursively. Likewise, in order to choose the best basis for Shannon's Entropy function the fast and efficient algorithm already available in [4] can be used. To conclude it is remarked again that the ex- pansion whose information cost and error cost is smal- lest can be found. The level of the approximation can be estimated using the Cross Entropy function as a tool for evaluating model, in other words the Cross Entropy is viewed as an error function. The Cross Entropy in mul- ticlass case, according to the definition in [5 ] . can be de- fined as follows:
where^(^,^) and Olk,rn, denote the rn-th target and net- work output of the k-th pattern class after training the network at the stage i. The Cross Entropy function is minimized if the distribution of the model outputp(O1x) and the distribution of the target valuesp(y1x) are equal, see [5 ] . Now, the output 0 depends on the vector ( C ( ~ , + S ( ~ , ~ , ) . This means that its distribution can be adap- ted to the distribution p@lx) of the target values. This multiclass case can be very useful in harmonic analysis
ETEP Vol. 13, No. 1, JanuaryFebruq 2003 33
ETEP representation, where suitable input/output classes could be the different input/output frequencies.
4.1 The proposed algorithm
The proposed algorithm can be mathematically rep-
For a given set of input/output observing data resented as follows:
0 = ((4 9 YI), (xz, Yz ), . . .* (4 1 Y n ) }
3' = { v t d , j , n ) ( t ) ; ( d , n) E z, j E N , t E 3},
3' = { v ; d , j , n ) ( f ) ; ( d , n) E z,j E N , t E S},
(2 1)
the algorithm can be mathematically represented as fol- lows:
Let
(22)
(23)
and
be the truncated cosine and sine packet frames respec- tively.
0. Define the initial residuals Xf@) = Ykr
Fix an index M and 6 a threshold level, setfo(x) = 0. k = 1 , 2 ,..., N.
Begin-loop
1. For i = 1,2, ..., M. Calculate the weights C(dj ,n)(k) on all cosine wavelet
packet tree according to the index:
where 'ycci-l)(k) (k = 1,2, . . ., N) are the residuals of the stage (i - 1).
2. Let
with (d j ,n) E (3'). This step selects the adaptive dilation on the cosine frames.
3. Updateflx) and y
k = 1 , 2 ,..., N.
4. calculate the weights S(dj,&) on all sine wavelet packet tree according the index:
this yields: / \ -1
5.
and the estimated probability is:
6. Updatefix) and y
ETEP Vol. 13, No. 1, JanuaryFebruary 2003 34
E TEP 7. For i= 1 define the matrix Ofk,m) =fl(xk),
k = 1,2, . . ., N, and El(y(;,,, O{k,m)) as in eq. (20). Else f o r b 1 define0 (k,m) =flxk) ,k = 1,2, .. ., N,and
if p(;-l) - Ei( < 8 , 6 i s a threshold level of approximation, thenfi=&i-l) and break the loop.
End Loop.
As already underlined the Cross Entropy function is minimized if the distribution of the model outputp(0lx) and the distribution of the target valuespblx) are equal. To guarantee the convergence of the adopted algorithm remain to remark that any technique which attempts to minimize the mean squared errors minimizes in the mean time the a-posteriori probability function of the trained classes, see [ 131.
5 System identification and simulations
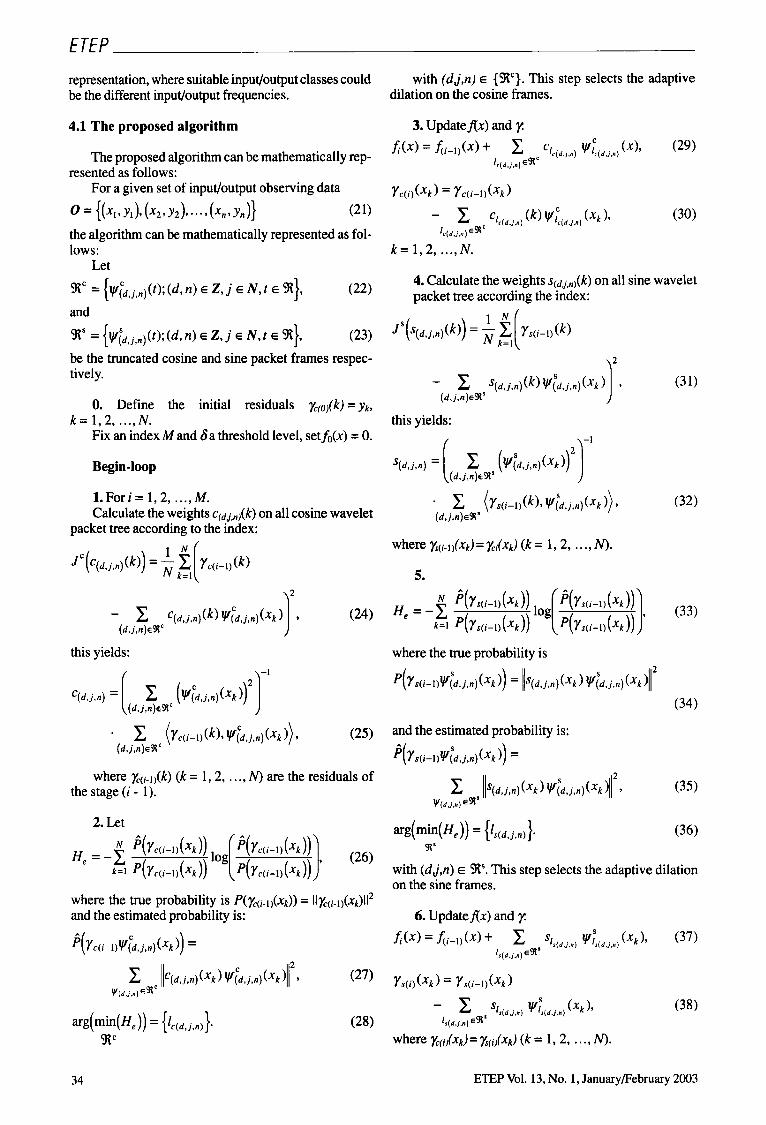
For a given sample of measurements (xk,yk), it is wanted to build a mathematical model of the electrical circuit essentially based on the data. This kind of mo-
Fig. 3. Circuit and diode characteristics a) equivalent circuit of the test setup b) diode characteristic
x ( t ) 1
Cosine Layer i ETEP I ___________.__......_________________.__ I
Fig. 4. Schematic representation of the wavelet network with its dual layer and the adjustable parameters
delling is known as black box modelling. The first ex- ample presented is a steady-state example, the model was performed with the Cross Entropy defined in eq. (20). The unique a priori knowledge about the sys- tem is that the system can be represented in the following form:
(39)
wherefis the unknown non-linear function and &k is the modelling error. The cases selected have strong non- linearities: a diode circuit and a four-quadrant converter (4QC) for an alternating current traction drive. The diode is a highly non-linear component since it allows a current to flow in only one direction. Roughly speaking it is enough to think that the input can have a very well localized frequency feature, for instance one frequency, while the output has a very wide spectrum. The circuit presented is depicted with the corresponding diode char- acteristic, Fig. 3. A non-linearity with saturation like in areal case is described. The non-linearity was performed with a polinominal non-linearity plus an arctan-function like saturation. In Fig. 4 is depicted the schematic rep- resentation of the static network, where it is possible to see the algorithm structure organized in a dual layer and the adjustable parameters A, and B,. 10 training signals with a frequency of 50 Hz and a nominal amplitude of 2 V with a variation of 200 mV are considered. The wave- let packet network has three levels and the frequencies
Y k = f(%) + Ek9
b) 2.0 V 1.5 1 .o
1 0.5 h
r O a -0.5 -1.0
-1.5
-2.0 0.092 0.096 0.100 0.104 0.108 s 0.112
ETEP t -
Fig. 5. Worst case with input signal belonging to the training signal; solid line: training input and desired outputs; dashed line: output of the wavelet network a) input and output of the wavelet network for the test circuit b) detail of a)
ETEP Vol. 13, No. 1, JanuaryFebruary 2003 35
ETEP
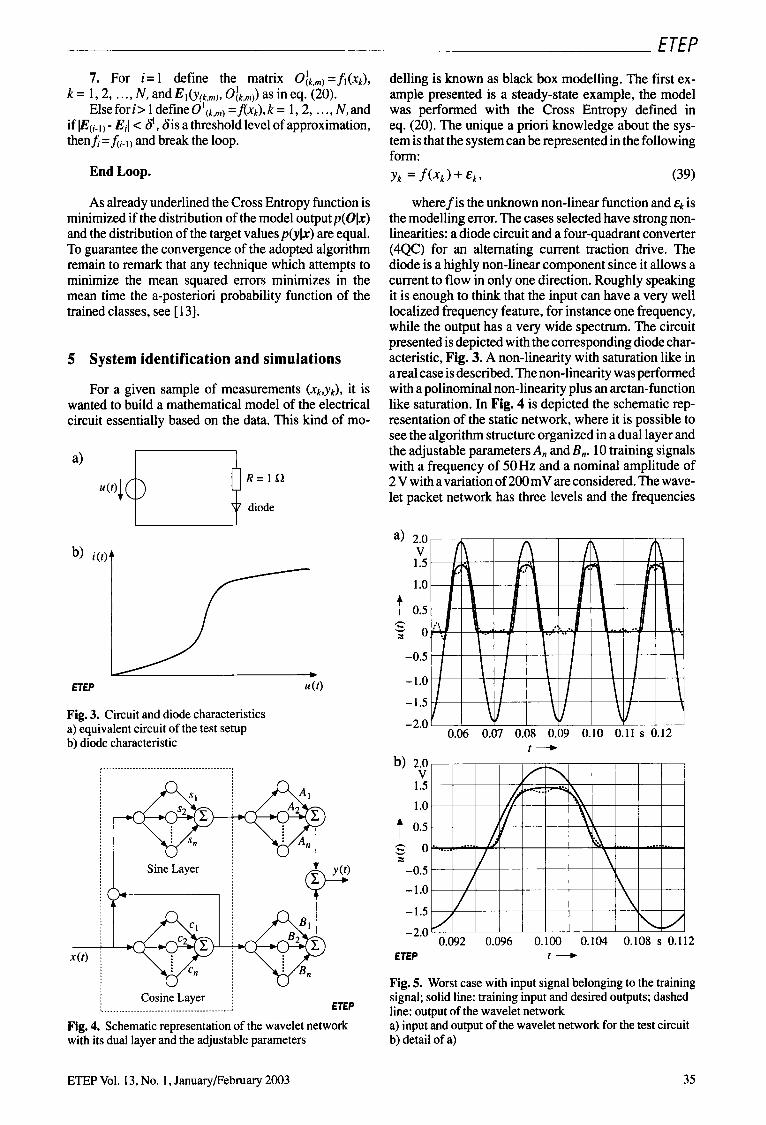
[0,50,100,150,200,250,300,350] Hz for every time- cell on the tree are considered. In other words, the wave- lets considered are at mximum 64 which correspond to the third level of the tree. Note that the true output volt- age has very high-frequency components which limits the ability to describe it with a truncated basis. Including more coefficients would improve the result drastically. Anyway, the example shows that the description is able to capture the non-linearity behavior with few training data and few subspaces. In Fig. 5 the worst case is printed with an input signal belonging to the training data. Fig. 6 reports the case where an input signal is considered which does not belong to the training data set (fresh signal). This input amplitude is equal to 2.5 V, the boundary am- plitude of the training data is 2.1 V and 1.9 V.
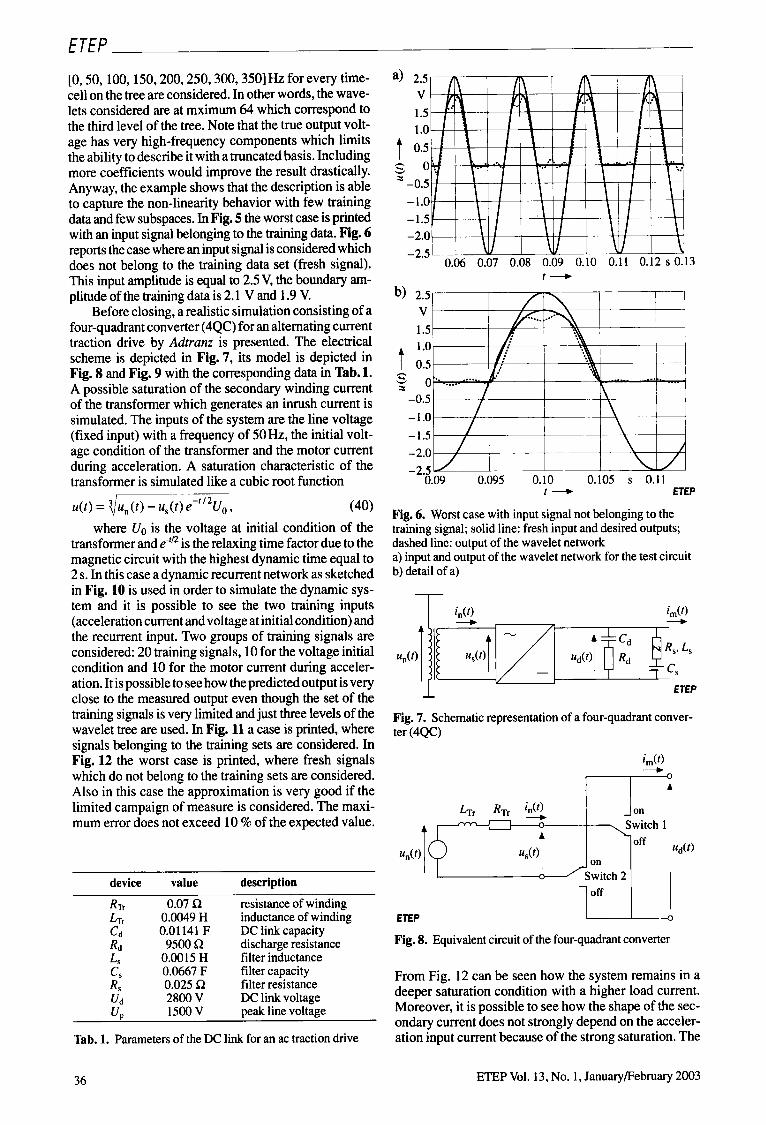
Before closing, a realistic simulation consisting of a four-quadrant converter (4QC) for an alternating current traction drive by Adtranz is presented. The electrical scheme is depicted in Fig. 7, its model is depicted in Fig. 8 and Fig. 9 with the corresponding data in Tab. 1. A possible saturation of the secondary winding current of the transformer which generates an inrush current is simulated. The inputs of the system are the line voltage (fixed input) with a frequency of 50Hz, the initial volt- age condition of the transformer and the motor current during acceleration. A saturation characteristic of the transformer is simulated like a cubic root function
u( t ) = du,(t) - u,(t> e-"*U0, (40) where Uo is the voltage at initial condition of the
transformer and e-rn is the relaxing time factor due to the magnetic circuit with the highest dynamic time equal to 2 s. In this case a dynamic recurrent network as sketched in Fig. 10 is used in order to simulate the dynamic sys- tem and it is possible to see the two training inputs (acceleration current and voltage at initial condition) and the recurrent input. Two groups of training signals are considered: 20 training signals, 10 for the voltage initial condition and 10 for the motor current during acceler- ation. It is possible to see how the predicted output is very close to the measured output even though the set of the training signals is very limited and just three levels of the wavelet tree are used. In Fig. 11 a case is printed, where signals belonging to the training sets are considered. In Fig. 12 the worst case is printed, where fresh signals which do not belong to the training sets are considered. Also in this case the approximation is very good if the limited campaign of measure is considered. The maxi- mum error does not exceed 10 % of the expected value.
device value description
RTr 0.07 R resistance of winding L r r 0.0049 H inductance of winding c d 0.01 141 F DC link capacity R d 9500 R discharge resistance LS 0.0015 H filter inductance c s 0.0667 F filter capacity RS 0.025 R filter resistance Ud 2800 V DC link voltage UP 1500 V peak line voltage
Tab. 1. Parameters of the DC link for an ac traction drive
a) 2.5 V 1.5 1 .o 0.5
- 0 -0.5 -1.0 -1.5 -2.0 -2.5
h
v Y
b) 2.5 V 1.5 1 .o t 0.5
c? ; o -0.5 -1.0 -1.5
-2.0 -2.5 u- 0.09 0.095 0.10 0.105 s 0.11
t - ETEP
Fig. 6. Worst case with input signal not belonging to the training signal; solid line: fresh input and desired outputs; dashed line: output of the wavelet network a) input and output c b) detail of a)
the wavelet network for the test circuit
Fig. 7. Schematic representation of a four-quadrant conver- ter (4QC)
I ( e ' Switch 2 I
loff I
From Fig. 12 can be seen how the system remains in a deeper saturation condition with a higher load current. Moreover, it is possible to see how the shape of the sec- ondary current does not strongly depend on the acceler- ation input current because of the strong saturation. The
36 ETEP Vol. 13, No. 1, JanuaryFebruary 2003
ETEP
uo - j ( k - 1 ) +
4
Wavelet Network . Y k
Saturation
uT7 Pulse pattern R,, C,
Fig. 9. Time domain calculation model for an AC traction drive (TDM)
Fig. 10. Dynamic network representation of the traction drive
a) 300 A
200
t c o z - 100
-200
- 300 0 0.02 0.04 0.06 0.08 s 0.1 t - b)
1 I I I I I I I A
t 200 h k
Y O
I
0.02 0.04 0.06 s 0.08 ETEP
0 I - - +
Fig. 11. Simulation with training signal and training initial transformer condition a) motor current during acceleration time b) expected output (solid line); output of the wavelet net- work (dashed line)
algorithms are programmed in Matlab [I41 where an autonomous platform is developed.
I I I 1 I I I I I A 400
200
h % t o z
-200
-400
I 1 I I 1 0.02 0.04 0.06 s 0.08
-600; f+
a) 400 A
300
t 200 h .r v
.- 100
0
I I I I I 1 - 1 v I W I k I I I I I I 1 - 1 -
0.02 0.04 0.06 0.08 s 0.1 -100; I
ETEP 1 -
Fig. 12. Worst case simulation: fresh signal and fresh initial condition of the transformer a) motor current during acceleration time b) expected output (solid line); output of the wavelet net- work (dashed line)
sight into the process. Non-parametric identification using wavelet packets are becoming popular and first applications of black box neural networks models have yielded encouraging results. An algorithm for neural net- work training based on recursive iterations over dual smooth trigonometric frames is proposed. The developed algorithm combines techniques in regression analysis and backpropagation procedures and consists of recur- sive dual iterations with biorthogonal smooth local sine and cosine wavelet packets in order to fit the training data signal set with the best Shannon basis and to choose the expansion whose information cost is smallest. Moreover, the algorithm uses the Cross Entropy function as a tool forevaluating the model quality. In order to consider and to use the non-orthogonality of the frames, which gener- ates an interaction between the elements of the bases, the algorithm considers during every step again all the ele- ments of the bases previously selected. The structural biorthogonality of the frames guarantees robustness and efficient numerical calculations. The algorithm is totally general, the proposed approaches by no means restricted to the wavelet network even though it is particularly ef- fective for narrow band signals or for harmonics detec- tion.
6 Conclusions 7 List of main symbols
One approach for non-parametric regression esti- mation using wavelet networks is presented.
Harmonic effects often need to be analysed purely based on input and output data without any physical in-
q d j , , ) ( x k ) wavelet coefficient decomposition for
C class of the signals the couple CyJxk)
ETEP Vol. 13, No. 1, JanuaryFebruary 2003 37
ETEP
Appendix
filter capacity capacitance of the DC link level index of the wavelet packet tree cross entropy approximated functon cosine wavelet analysing function sine wavelet analysing function feature extractor initial residual Hilbert space Entropy function current current of the secondary winding motor current current of the converter frequency index of the wavelet functions least mean square index index of the selected cosine wavelets index of the selected sine wavelets filter inductance equivalent transformer inductance integer number set time index of the wavelet functions set of observing data estimated probability true probability cosine frame sine frame discarge resistance filter resistance resistance of transformer winding sine wavelet coefficient decomposition for the couple ( y d x k )
voltage control voltage DC link voltage initial voltage of the transformer inductance line voltage peak line voltage switch voltage voltage on the secondary winding of the transformer input observing data output observing data relative number set four quadrant converter
the vectors in C(dj ,n) and S(dj ,n) which minimize the Shan- non Entropy function are searched.
Let
= (YO - c(d , j .n ) v [ d . j . n ) ( X ) - ' ( d . j . n ) v t d . j , n ) ( X ) ) l
*(YO - c(d , j ,n ) v { d , j , n ) ( X ) - ' ( d . j , n ) v ~ d . j , n ) ( X ) ) y
043) where
-1 T ' ( d . j , n ) = [ ( v s d . j , n ) (x)) v : d . j , n )
The equalities are due to the normality of the matri- ces. We remember in fact that v f d j , n ) ( . x ) and v / d j , n ) ( x ) are normalized, thus
and
T 2 Several vectorial considerations for the algorithm at v f d , j , n ) (x) - (( vc"d. j , n ) ( x ) ) Y O )
+ ( ( v : d , j , n ) ( x ) ) Y O ) ( v : d , j . n ) ( X ) )
* v : d , j , n ) ( X ) - (( @d, j , n ) YO) * (A8)
the stage i = 1 are described in order to understand bet- ter the biorthogonal aspect. At the end of the appendix T 2 T the steps of the algorithm are reported in compact form.
and k is the k-th input and the k-th output (k = 1,2, . . . , N) T 2 With the given signal xk(t) and y k ( x ) with ( t ~ , y ) E 93
the initial residual ~ ( k ) = y k ( x ) is defined and f l x ) is set: f l x ) = 0. Where the transposition property and
and Thus
ETEP Vol. 13, No. 1, January/February 2003 38
ETEP
Because of the biorthogonality the subspaces para- metrized by (d j ,n) which minimize the Shannon Entro- py function can be separately found in two steps. In [8] was proven that yTn monotonically decreases as i in- creases. In other words the algorithm could be organized as follows (stage i = 1):
Step 0: = y andflx) = 0.
Step 1: Calculate all possible coefficients C(dj,n) of the cosine wavelet packet library tree according to the least squares method:
Step 2:
lc = arg(min( He ( Y O ))) ( A m
with Wickerhauser's Algorithm (He according to eq. ( 12)). 31"
[2] Jawerth, B.; Sweldens, W.: Biorthogonal smooth local tri- gonometric bases. J. Fourier Anal. Appl. 2 (1995) no. 2,
[3] Auscher, P.; Weiss, G. ; Wickerhauser, M.V: Wavelet- A Tutorial in Theory and Applications. Local sine and co- sine bases of Coifman and Meyer and the construction of smooth wavelets. Boston/USA: Academic Press, 1992
[4] Coifman, R.R.; Wickerhauser, M.V: Entropy-based algo- rithms for best basis selection. IEEE Trans. on Inform. TheoryIT-38(1992)no.2,pp.713-718
[ 5 ] Joost, M.; Schi,fSmann, W.: Speeding up backpropagation algorithms by using cross-entropy combined with pattern normalization. Int. J. of Uncertainity, Fuzziness and Know- ledge-based Syst. (IJLJFKS) 6 (1999) no. 2, pp. 117- 126
[6] Saito, N . ; Coifman, R.R.: Local discriminant bases. Ma- thematical Imaging: Wavelet Applications in Signal and Image Processing I1 Conf. (SPIE), San Diego/Califor- niaAJSA 1994, proc. 2303 pp. 2-14
[7] Zhang, Q.: Using wavelet network in nonparametric esti- mation. IEEE Trans. on Neural Networks 8 (1997) no. 2,
[8] Mallat, S.; Zhang, Z . : Matching pursuit with time-fre- quency dictionaries. Computer Science Department: New York/USA 1993, Tech. Rep. 619
[9] Juditsky, A.; Hjalmursson, H.; Benveniste, A.; Delyon B.; Ljung, L.; Sjiiberg, J.; Zhang, Q.: Nonlinear black-box models in system identification: mathematical founda- tions. J. Automatica 3 1 (1995) no. 12, pp. 1 725 - 1 750
[ 101 Daubechies, I . : Ten Lectures on Wavelets. Phila- delphia/USA: Society for Industrial and Applied Mathe- matics, 1995
[ 1 1 1 Hess-Nielsen, N . ; Wickerhauser, M.V: Wavelets and time-frequency analysis. IEEE Proc. 84 (1996) no. 4, pp.
pp. 109- 133
pp. 227 - 236
523 - 540 [ 121 Daubechies, I . : The wavelet transform, time-frequency
localization and signal analysis. IEEE Trans. on Inform. Theory IT-36 (1990) no. 5, pp. 961 - 1 005
r131 Ruck. D.W.: Roaers. S.K.: Kabriskv. M.; Oxlev. M.E.: (A14)
~- r , . Sure; B.W.:'TheLultilaye; perceptron as an apirbxima- tion to a Bayes optimal discriminant function. IEEE Trans. on Neural Networks 1 (1990) no. 4, pp. 296 - 298
Step 4: Calculate all possible coefficients S(dj ,n) of the sine wavelet packet library tree according to the least squares method: [ 141 Donoho, D.: http://playfair.stanford.edu, 1996
Step 5: Acknowledgements
4 = arg( min( H e (75)))
with Wickerhauser's Algorithm (He according toeq. (12)).
The author acknowledges financial support from the European Commission through the Marie Curie Re- search Training Program and Mobility.
%S
Manuscript received on March 21,2000
(A171
Step 7: Check the value for Cross Entropy function E as defined in eq. (20).
It is easy to see how the Algorithm of Wickerhauser, of which the numerical effectiveness is known, is basi- cally used. Only few sums and subtractions have to be added, without any matrix inversion (all the matrices are unitary matrices (A-' =AT)) and without any orthogona- lization procedure because of the structural biorthogo- nality of the bases.
References [ 1 1 Terwiesch, P.; Menth, S . ; Schmidt, S . : Analysis of transi-
ents in electrical railway networks using wavelets. IEEE Trans. on Ind. Electron. 45 (1 998) 110.6, pp. 955 - 959
ETEP Vol. 13, No. 1, Januarypebruary 2003 39
ETEP The Authors
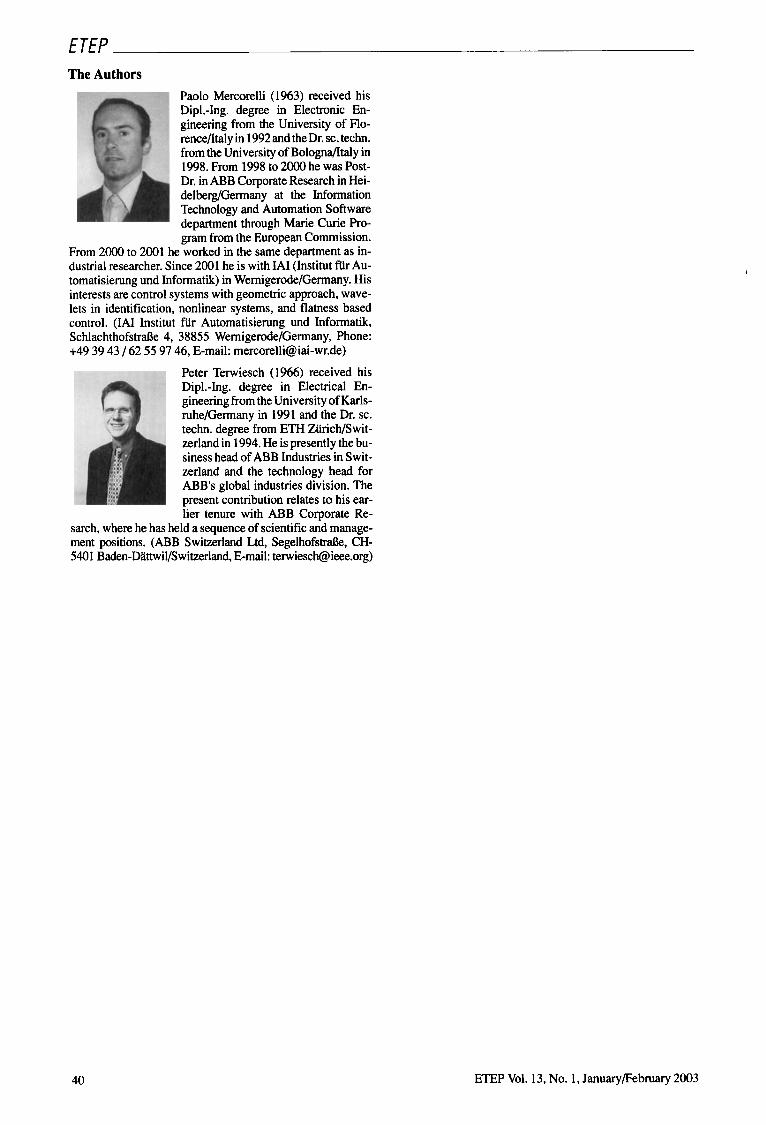
Paolo Mercorelli (1963) received his Dip1.-Ing. degree in Electronic En- gineering from the University of Flo- rence/Italy in 1992 and the Dr. sc. techn. from the University of Bologna/Italy in 1998. From 1998 to 2000 he was Post- Dr. in ABB Corporate Research in Hei- delberg/Germany at the Information Technology and Automation Software department through Marie Curie Pro- gram from the European Commission.
From 2000 to 2001 he worked in the same department as in- dustrial researcher. Since 2001 he is with IAI (Institut fur Au- tomatisiemng und Informatik) in Wemigerode/Germany. His interests are control systems with geometric approach, wave- lets in identification, nonlinear systems, and flatness based control. (IN Institut fur Automatisierung und Informatik, SchlachthofstraBe 4, 38855 Wemigerode/Germany, Phone: +49 39 43 / 62 55 97 46, E-mail: [email protected])
Peter Terwiesch (1966) received his Dip1.-Ing. degree in Electrical En- gineering from the University of Karls- ruhe/Germany in 1991 and the Dr. sc. techn. degree from ETH ZUrich/Swit- zerland in 1994. He is presently the bu- siness head of ABB Industries in Swit- zerland and the technology head for ABB's global industries division. The present contribution relates to his ear- lier tenure with ABB Corporate Re-
sarch, where he has held a sequence of scientific and manage- ment positions. (ABB Switzerland Ltd, SegelhofstraRe, CH- 540 1 Baden-DattwiVSwitzerland, E-mail: [email protected])
40 ETEP Vol. 13, No. 1 , Januarypebruary 2003