a biomimetic nanosponge that absorbs pore-forming toxins ......a biomimetic nanosponge that absorbs...
TRANSCRIPT
SUPPLEMENTARY INFORMATIONDOI: 10.1038/NNANO.2013.54
NATURE NANOTECHNOLOGY | www.nature.com/naturenanotechnology 11
A biomimetic nanosponge that absorbs pore-forming toxins
Che-Ming J. Hu, Ronnie H. Fang, Jonathan Copp, Brian T. Luk, Liangfang Zhang*
Supplementary Information
Supplementary Methods:
Preparation of toxin nanosponges: RBC membrane vesicles were prepared through an
extrusion approach using fresh RBCs collected from 6 week-old male ICR mice (Charles River
Laboratories). PLGA polymeric cores were prepared using 0.67 dL/g carboxy-terminated 50:50
PLGA polymer (LACTEL Absorbable Polymers) through a solvent displacement process. The
nanosponges were then prepared by fusing the RBC membrane vesicles onto the PLGA
nanoparticles following a published protocol. The size of the nanosponges was 85 nm as
obtained from three dynamic light scattering (DLS) measurements using a Malvern ZEN 3600
Zetasizer. The morphology of the toxin-bound nanosponges was visualized using transmission
electron microscopy (TEM). Briefly, 100 µg of nanosponges was incubated with 3 µg of
Staphylococcus aureus α-toxin (Sigma Aldrich) for 15 min. A drop of the nanosponge/toxin
solution (1 mg/mL) was deposited onto a glow-discharged carbon-coated grid, followed by
washing with 10 drops of distilled water and staining with 1% uranyl acetate. The sample was
then imaged using an FEI Sphera Microscope at 200kV. For preparation of human RBC
nanosponges, the RBCs were collected from whole human blood (Bioreclamation) and the
characterization results were shown in Fig. S9
For lyophilization, nanosponges were prepared in 5% sucrose solution. The samples were
subsequently frozen in a -80°C freezer. The frozen samples were then freeze-dried in a benchtop
© 2013 Macmillan Publishers Limited. All rights reserved.
2
freeze dryer (Laboconco) overnight. Reconstitution of the lyophilized samples was performed by
solubilizing the samples in water. Following reconstitution, the nanosponges were characterized
for particle size, particle morphology, and neutralization capacity using DLS, TEM, and an RBC
hemolysis assay, respectively. The results were included in Fig. S10.
Preparation of control nanoparticles: The PLGA nanoparticles, coated with
polyethylene glycol (PEG, Mw=2000), were prepared via a nanoprecipitaton method1. The
liposomes consisting of 80 wt% of Egg PC and 20 wt% of DSPE-PEG(2000)-COOH (Avanti
Polar Lipids) were prepared via an extrusion method2. The RBC membrane vesicles were
prepared following the aforementioned protocol. Measured by DLS, the diameters of the PLGA
nanoparticles, liposomes, and RBC membrane vesicles were 90, 105, and 120 nm, respectively.
In vitro toxin neutralization and retention study: 200 µL of PBS (1X, pH = 7.2)
solution containing 1 mg/mL of nanosponges (~7.5 nM), PLGA nanoparticles (~7.5 nM),
liposomes (~16 nM), RBC membrane vesicles (~7.5 nM), or 250 µg/mL of sheep anti-α-toxin
polyclonal antibodies (1.7 µM) (abcam) was prepared. 3 µg of α-toxin (450 nM) was then
incubated with the respective formulations for 30 min, followed by addition into 1.8 mL of 5%
purified mouse RBCs in PBS. After an additional 30 min of incubation, each sample was spun
down at 14,000 rpm in a Beckman Coulter Microfuge® 22R Centrifuge for 10 min. The
absorbance of hemoglobin in the supernatant was measured at 540 nm using a Tecan Infinite
M200 Multiplate Reader to determine the degree of RBC lysis. All experiments were performed
in triplicate. For the toxin retention study, the samples containing the nanoformulations and the
α-toxin were filtered through a Sepharose® CL-4B size-exclusion column to remove unbound
toxin, lyophilized and prepared in SDS sample buffer (Invitrogen), and then separated on a 4-
12% Bis-Tris 10-well minigel in MOPS running buffer using a Novex® XCell SureLock
© 2013 Macmillan Publishers Limited. All rights reserved.
3
Electrophoresis System (Invitrogen). The samples were run at 200 V for 50 min, and the
polyacrylamide gel was then stained in SimplyBlue (Invitrogen) overnight for visualization. To
quantify the retention of α-toxin, the band intensity at 34 kDa was analyzed by ImageJ and
compared to a standard curve consisting of 0.3, 1, 3, and 9 µg of pure α-toxin.
In vitro toxin absorption study: 200 µL of 1 mg/mL nanosponges in PBS was incubated
with different amounts of α-toxin, streptolysin-O, and melittin for 30 min followed by incubation
with 1.8 mL of 5% purified mouse RBCs for 30 min. Each sample was then spun down at 14,000
rpm for 10 min and the absorbance of the hemoglobin in the supernatant was measured at 540
nm. As controls, solutions containing the same concentrations of the respective toxins without
the nanosponges were tested in parallel. All experiments were performed in triplicate.
Cellular uptake of the nanosponges : 10 µg of DMPE-rhodamine B (Avanti Polar
Lipids) was incorporated into RBC ghosts collected from 1 mL of whole blood prior to preparing
RBC membrane vesicles and the nanosponges. For the fluorescence imaging studies, the
fluorescent nanosponges and RBC membrane vesicles were incubated with human umbilical
vein endothelial cells (HUVEC) (ATCC #CRL-1730) at a concentration of 300 µg/mL in
Medium 199 (Gibco) for 1 hr. The media was then aspirated and the cells were incubated in fresh
media for additional 1 hr. Following the second incubation period, the cells were washed with
PBS, fixed with 10% formalin (Millipore), mounted with DAPI-containing Vectashield®
(Invitrogen), and imaged using a 60X oil immersion objective on an Applied Precision
DeltaVision Deconvolution Scanning Fluorescence Microscope.
Cellular cytotoxicity of nanosponge-sequestered toxins: Human umbilical vein
endothelial cells (HUVECs) were seeded in a 96-well plate in Medium 199 at a density of 2x10⁴
© 2013 Macmillan Publishers Limited. All rights reserved.
4
cells per well. To prepare the samples, nanosponges of different concentrations were incubated
with varied amounts of α-toxin, streptolysin-O, and melittin for 30 min. The samples were then
added to the cells for 24 hr, following which the cells were washed and incubated in fresh media
for 48 hr. Cell viability was then assayed using an MTT kit (Invitrogen) following the
manufacturer’s instruction. In the conjoint mixture study, corresponding amounts of
nanosponges were first added to HUVECs and α-toxin was subsequently added to the cultures,
followed by a cell viability test (n=6).
In vivo toxin neutralization through subcutaneous route: 12 µg/mL of α-toxin was
incubated with 0.67 mg/mL of nanosponges, PEG-PLGA nanoparticles, or RBC membrane
vesicles in PBS for 15 min. A volume of 150 µL of the mixture was then injected subcutaneously
into the flank region of 6 week-old female nu/nu nude mice (Charles River Laboratories). At day
3 after the injections the mice were imaged. Skin and muscles samples were cut at 5 µm and
stained with hematoxylin and eosin (H&E) for histological analyses. On-site neutralization of α-
toxin by the nanosponges was conducted by subcutaneously injecting 50 µL of 36 µg/mL of α-
toxin solution, which was immediately followed by a 100 µL injection of 2 mg/mL nanosponges.
The mice were imaged 3 days later for visualization of skin lesion formation (Fig S11).
In vivo detoxification efficacy through systemic route: Nanosponges, RBC membrane
vesicles, and PEG-PLGA nanoparticles at a concentration 20 mg/mL and α-toxin at a
concentration of 60 µg/mL were prepared beforehand in deionized water. For the pre-inoculation
studies, 6 week-old male ICR mice were injected intravenously through the tail vein with 80
mg/kg (dose per body weight) of the nanoformulation followed by a 75 µg/kg injection of α-
toxin 2 min later. For the post-inoculation studies, the mice were injected first with 75 µg/kg of
α-toxin followed by 80 mg/kg of the nanoformulation 2 min later. The no treatment group was
© 2013 Macmillan Publishers Limited. All rights reserved.

5
injected with 75 µg/kg of α-toxin solution only. The sample size for each group was 9 mice. The
statistic p values were obtained using the log-rank test.
Biodistribution and hepatotoxicity of the nanosponge/α-toxin complex: 200 µg of
nanosponges containing 0.05% (w/w) DiD probe (Invitrogen) in the polymeric cores was
prepared and incubated with 3 µg of α-toxin. The mixture was subsequently filtered in a
Sepharose® CL-4B column to remove unbound toxin. For the biodistribution study, 6 week-old
male ICR mice were sacrificed 24 hr after intravenous injection of the fluorescent
nanosponge/toxin complex via the tail vein. The liver, spleen, kidneys, lung, heart and blood
were collected and homogenized. The fluorescence of the homogenate at 670 nm with an
excitation wavelength of 630 nm was read using a Tecan Infinite M200 Multiplate Reader. The
resulting signal was then multiplied by the corresponding organ weight to obtain the total organ
fluorescence and the relative distribution of the nanosponge/toxin complex in each organ was
calculated (n = 6). For the hepatotoxicity study, one group of mice was sacrificed on day 3
following the injection of the toxin-bound nanosponges and another group was sacrificed on day
7. The livers were collected, sectioned, and stained with H&E for histological analyses.
© 2013 Macmillan Publishers Limited. All rights reserved.
6
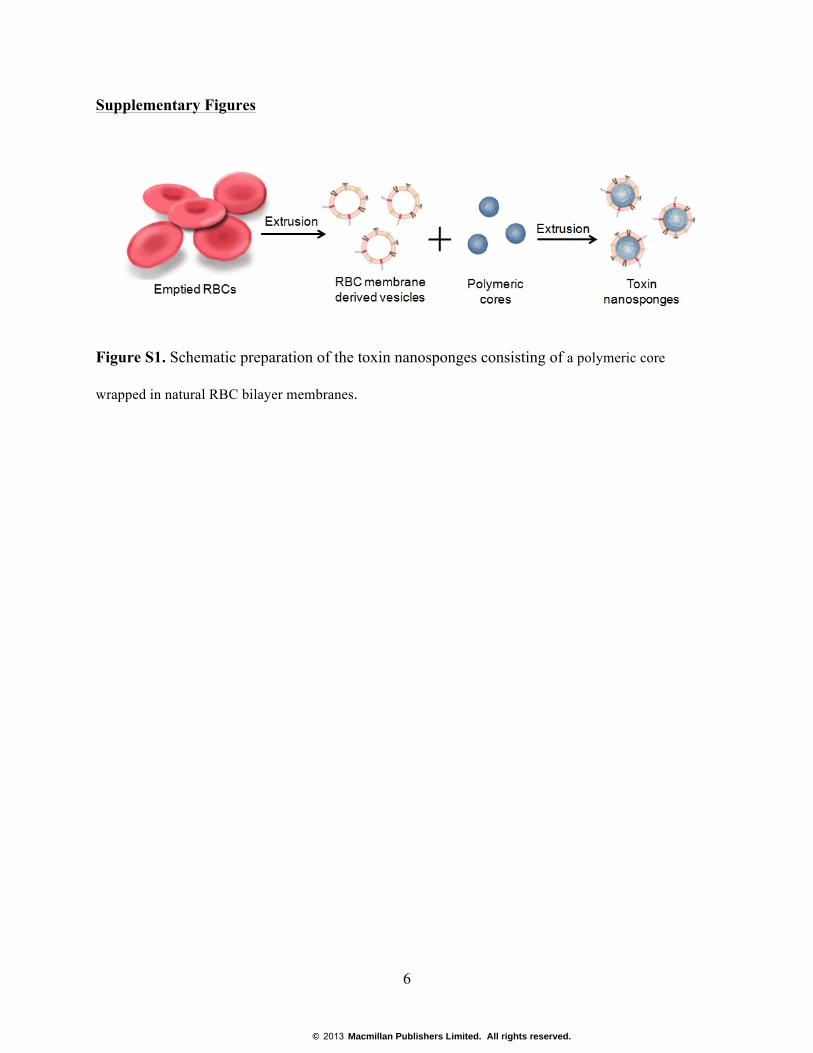
Supplementary Figures
Figure S1. Schematic preparation of the toxin nanosponges consisting of a polymeric core
wrapped in natural RBC bilayer membranes.
© 2013 Macmillan Publishers Limited. All rights reserved.
7
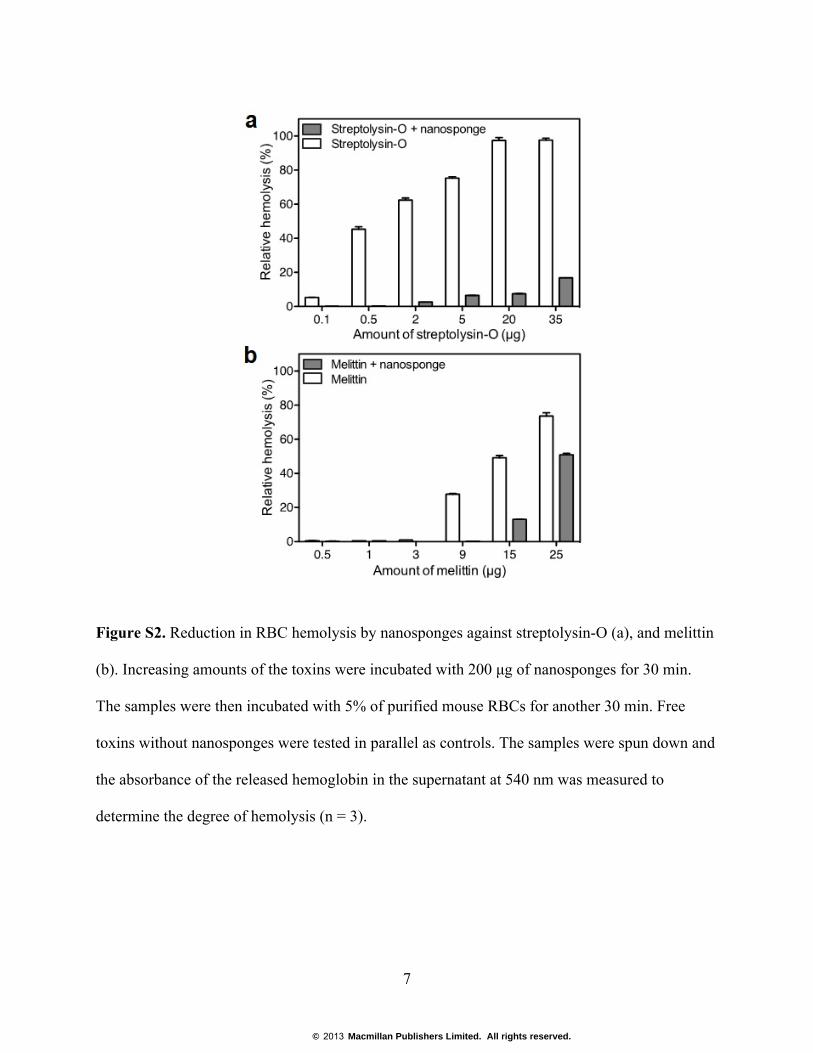
Figure S2. Reduction in RBC hemolysis by nanosponges against streptolysin-O (a), and melittin
(b). Increasing amounts of the toxins were incubated with 200 µg of nanosponges for 30 min.
The samples were then incubated with 5% of purified mouse RBCs for another 30 min. Free
toxins without nanosponges were tested in parallel as controls. The samples were spun down and
the absorbance of the released hemoglobin in the supernatant at 540 nm was measured to
determine the degree of hemolysis (n = 3).
© 2013 Macmillan Publishers Limited. All rights reserved.
8
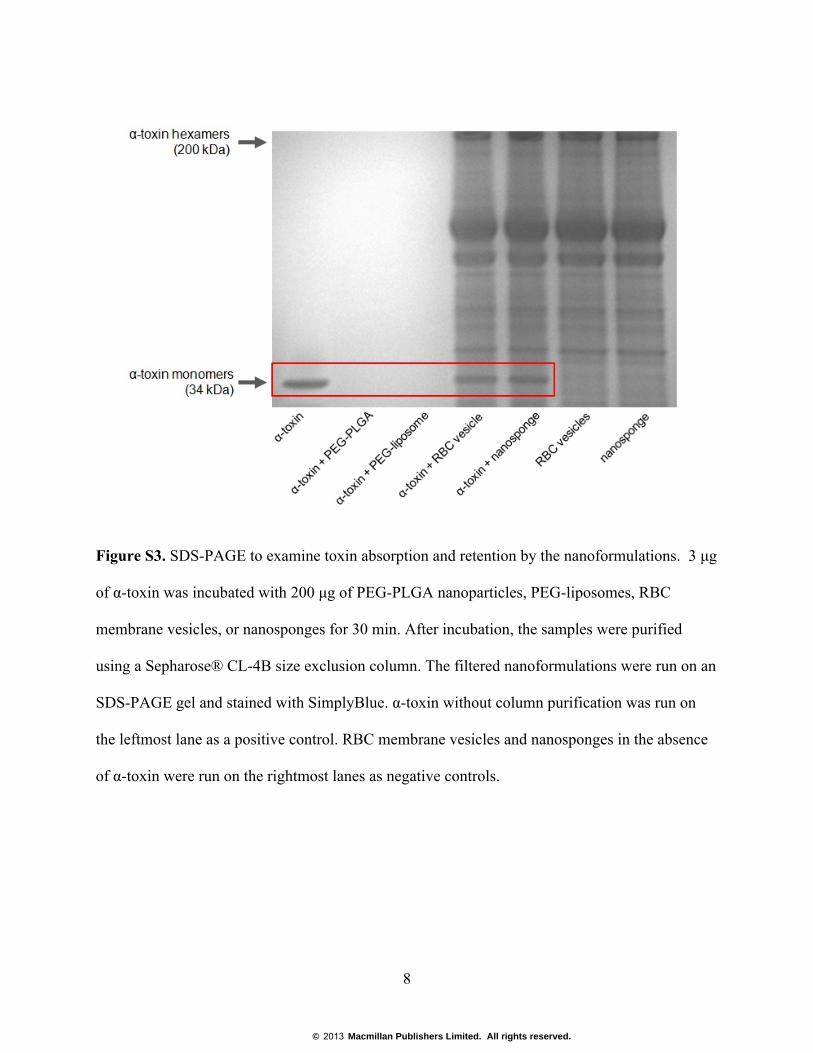
Figure S3. SDS-PAGE to examine toxin absorption and retention by the nanoformulations. 3 µg
of α-toxin was incubated with 200 µg of PEG-PLGA nanoparticles, PEG-liposomes, RBC
membrane vesicles, or nanosponges for 30 min. After incubation, the samples were purified
using a Sepharose® CL-4B size exclusion column. The filtered nanoformulations were run on an
SDS-PAGE gel and stained with SimplyBlue. α-toxin without column purification was run on
the leftmost lane as a positive control. RBC membrane vesicles and nanosponges in the absence
of α-toxin were run on the rightmost lanes as negative controls.
© 2013 Macmillan Publishers Limited. All rights reserved.
9
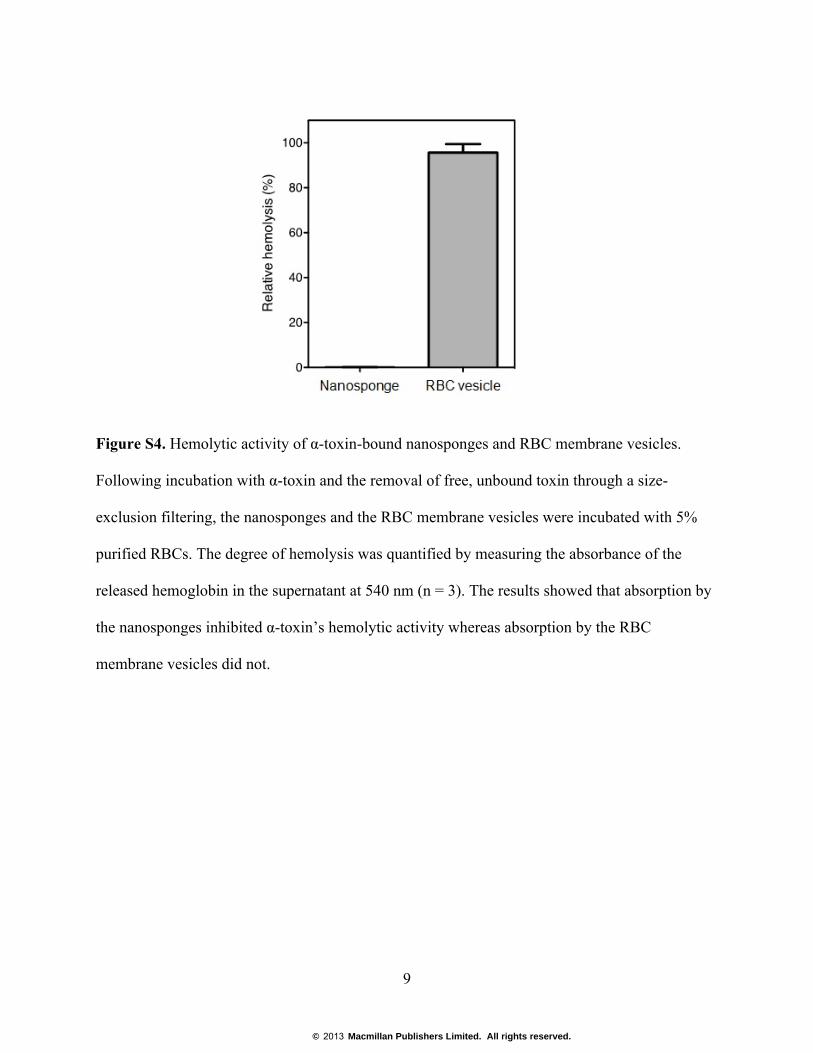
Figure S4. Hemolytic activity of α-toxin-bound nanosponges and RBC membrane vesicles.
Following incubation with α-toxin and the removal of free, unbound toxin through a size-
exclusion filtering, the nanosponges and the RBC membrane vesicles were incubated with 5%
purified RBCs. The degree of hemolysis was quantified by measuring the absorbance of the
released hemoglobin in the supernatant at 540 nm (n = 3). The results showed that absorption by
the nanosponges inhibited α-toxin’s hemolytic activity whereas absorption by the RBC
membrane vesicles did not.
© 2013 Macmillan Publishers Limited. All rights reserved.
10
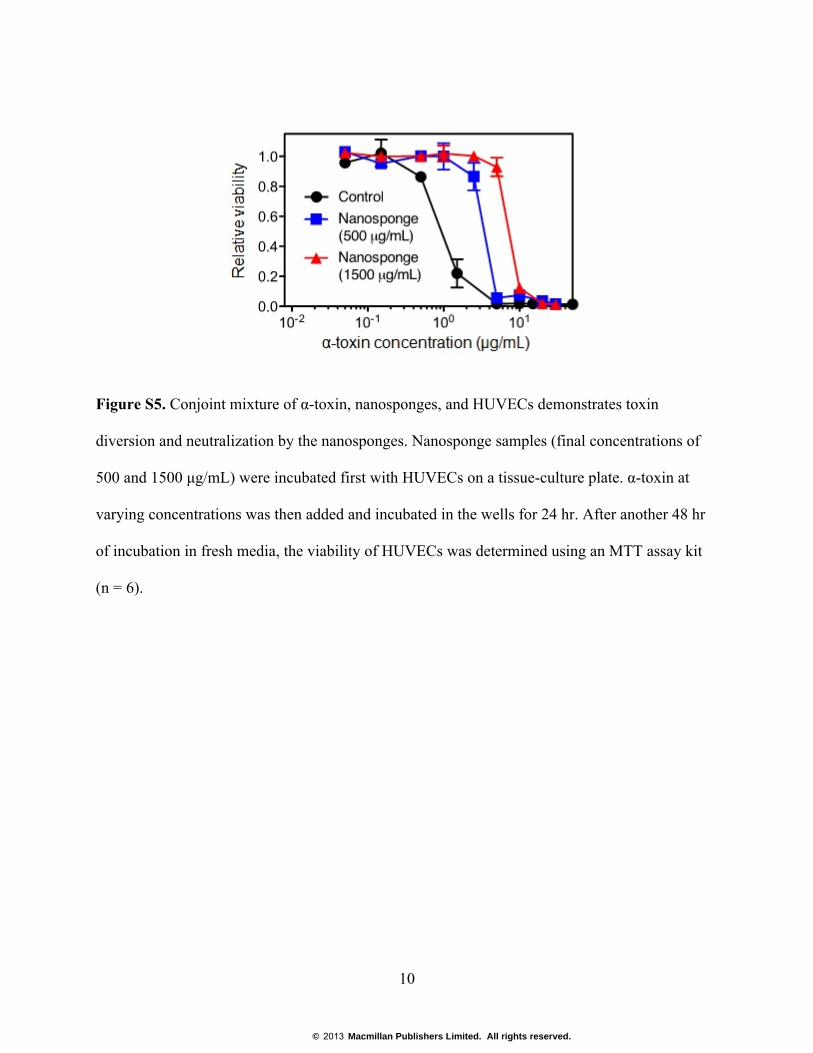
Figure S5. Conjoint mixture of α-toxin, nanosponges, and HUVECs demonstrates toxin
diversion and neutralization by the nanosponges. Nanosponge samples (final concentrations of
500 and 1500 µg/mL) were incubated first with HUVECs on a tissue-culture plate. α-toxin at
varying concentrations was then added and incubated in the wells for 24 hr. After another 48 hr
of incubation in fresh media, the viability of HUVECs was determined using an MTT assay kit
(n = 6).
© 2013 Macmillan Publishers Limited. All rights reserved.
11
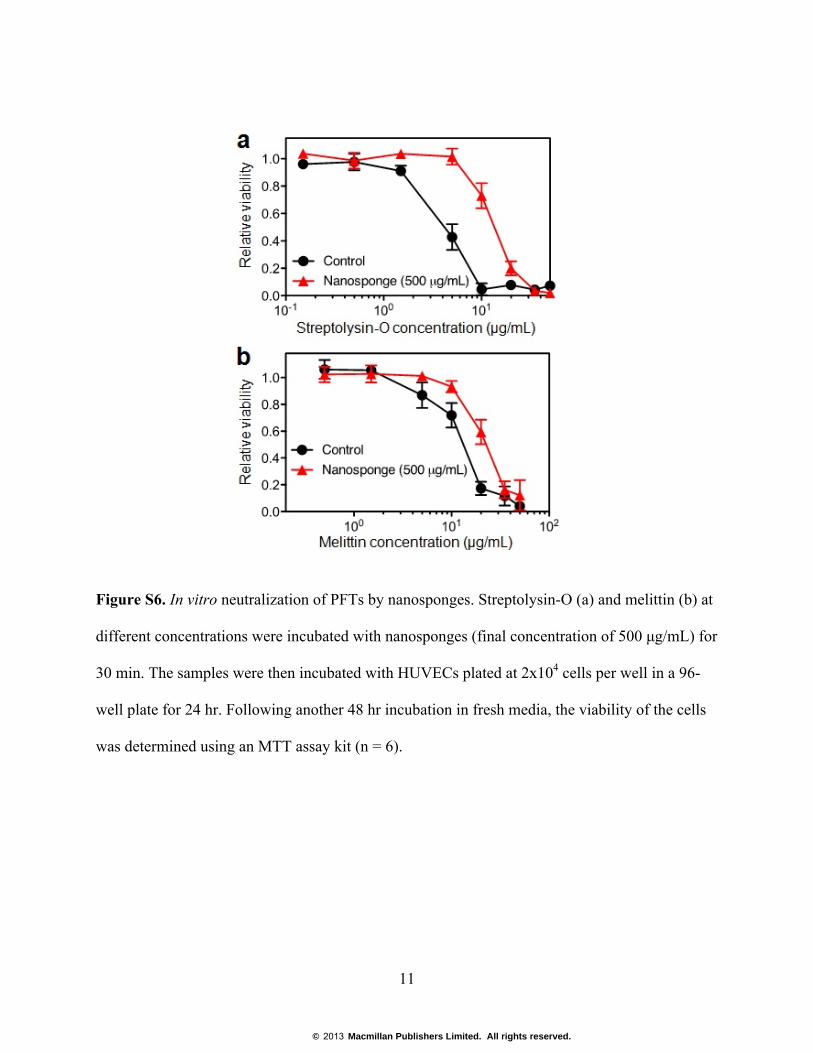
Figure S6. In vitro neutralization of PFTs by nanosponges. Streptolysin-O (a) and melittin (b) at
different concentrations were incubated with nanosponges (final concentration of 500 µg/mL) for
30 min. The samples were then incubated with HUVECs plated at 2x10⁴ cells per well in a 96-
well plate for 24 hr. Following another 48 hr incubation in fresh media, the viability of the cells
was determined using an MTT assay kit (n = 6).
© 2013 Macmillan Publishers Limited. All rights reserved.
12
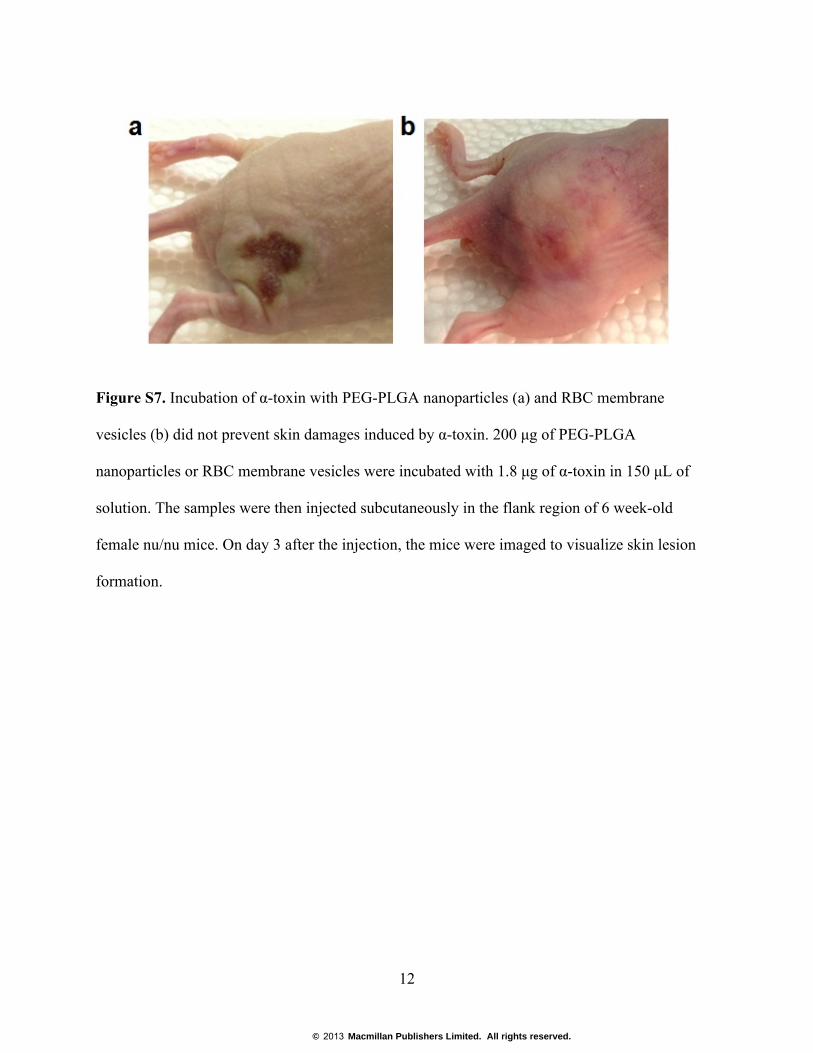
Figure S7. Incubation of α-toxin with PEG-PLGA nanoparticles (a) and RBC membrane
vesicles (b) did not prevent skin damages induced by α-toxin. 200 µg of PEG-PLGA
nanoparticles or RBC membrane vesicles were incubated with 1.8 µg of α-toxin in 150 µL of
solution. The samples were then injected subcutaneously in the flank region of 6 week-old
female nu/nu mice. On day 3 after the injection, the mice were imaged to visualize skin lesion
formation.
© 2013 Macmillan Publishers Limited. All rights reserved.
13
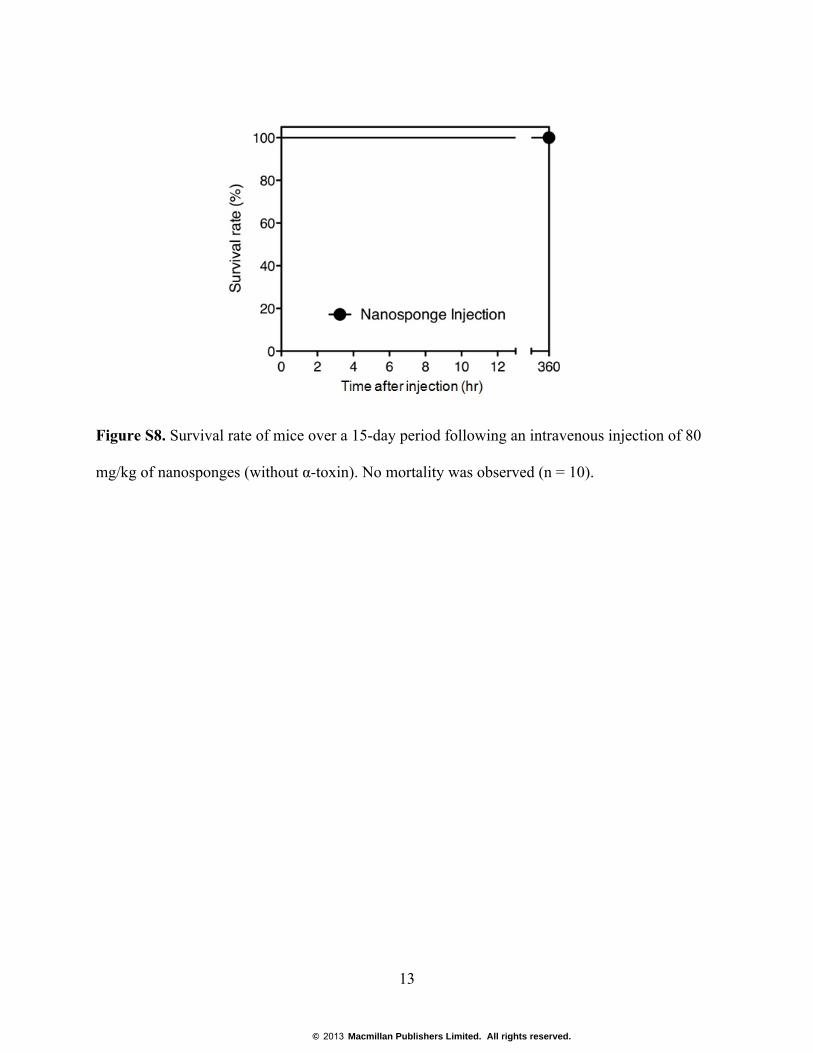
Figure S8. Survival rate of mice over a 15-day period following an intravenous injection of 80
mg/kg of nanosponges (without α-toxin). No mortality was observed (n = 10).
© 2013 Macmillan Publishers Limited. All rights reserved.
14
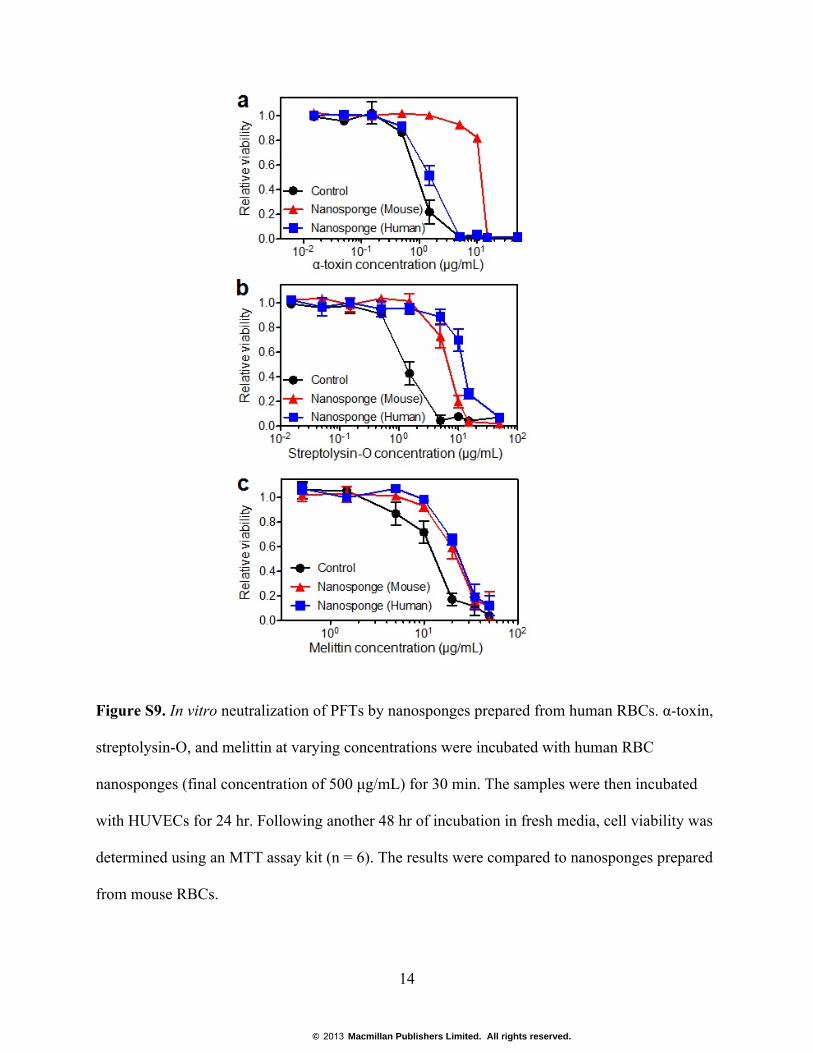
Figure S9. In vitro neutralization of PFTs by nanosponges prepared from human RBCs. α-toxin,
streptolysin-O, and melittin at varying concentrations were incubated with human RBC
nanosponges (final concentration of 500 µg/mL) for 30 min. The samples were then incubated
with HUVECs for 24 hr. Following another 48 hr of incubation in fresh media, cell viability was
determined using an MTT assay kit (n = 6). The results were compared to nanosponges prepared
from mouse RBCs.
© 2013 Macmillan Publishers Limited. All rights reserved.

15
Figure S10. Lyophilization of nanosponges. (a) Nanosponges were resuspended after
lyophilization in 5% sucrose solution. The size was then measured using DLS and compared to
that of fresh nanosponges (n = 3). (b) Transmission electron micrograph of reconstituted
nanosponges following lyophilization (scale bar = 50 nm). Uranyl acetate was used for negative
staining. (c) 5% purified RBCs was incubated with α-toxin, α-toxin pre-incubated with
lyophilized nanosponges, and PBS for 30 min. The RBCs were then spun down at 14,000 rpm in
a Beckman Coulter Microfuge® 22R and imaged. (d) The supernatants of the solutions from (c)
were measured at 540 nm to determine the degree of hemolysis (n = 3).
© 2013 Macmillan Publishers Limited. All rights reserved.
16
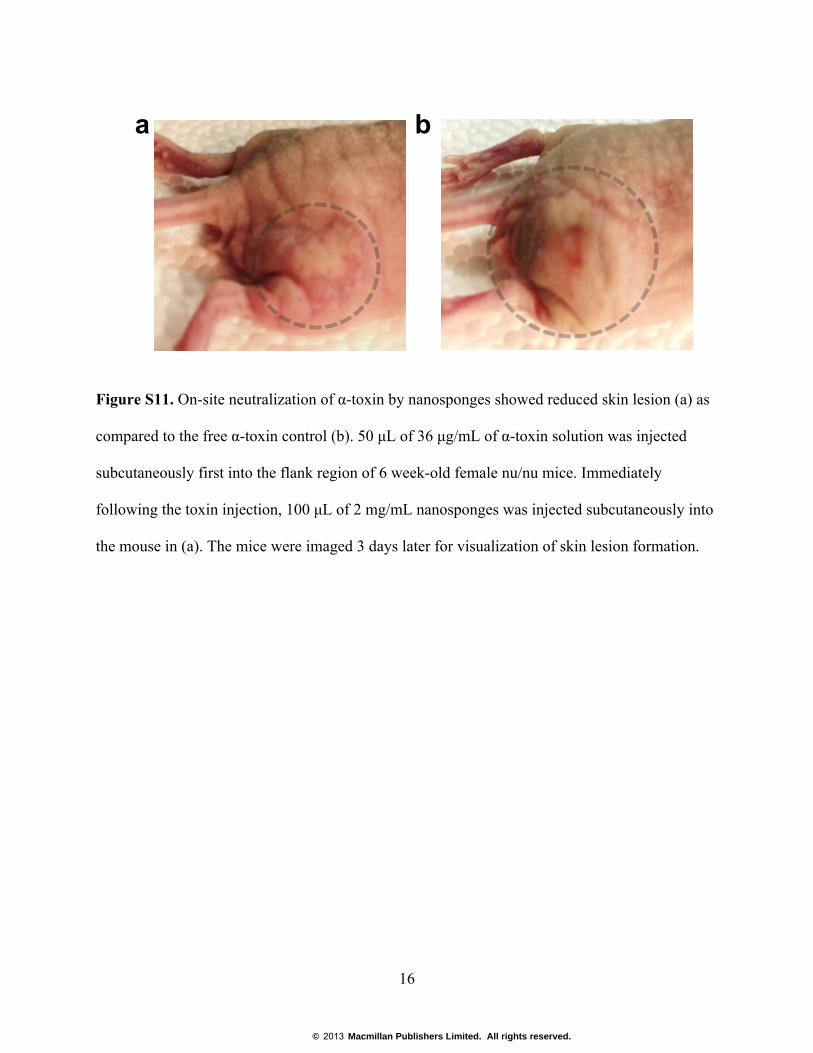
Figure S11. On-site neutralization of α-toxin by nanosponges showed reduced skin lesion (a) as
compared to the free α-toxin control (b). 50 µL of 36 µg/mL of α-toxin solution was injected
subcutaneously first into the flank region of 6 week-old female nu/nu mice. Immediately
following the toxin injection, 100 µL of 2 mg/mL nanosponges was injected subcutaneously into
the mouse in (a). The mice were imaged 3 days later for visualization of skin lesion formation.
ba
© 2013 Macmillan Publishers Limited. All rights reserved.

17
Supplementary Discussion
Estimated α-toxin neutralization capacity of the nanosponges
Density of PLGA: ρ = 1.2 g/mL
Radius of the polymer core: r = 35 nm
Mass of nanosponges: Mns = = 2.2 x10⁻¹⁶ g per particle = 1.3x10⁸ g per mole
Mass of α-toxin: Mt = 3.4x10⁴ g per mole
Based on the data in Fig. 2f, 11 µg of α-toxin can be neutralized by 500 µg of nanosponges
500 µg of nanosponges: ~3.8 x10⁻¹² mole
11 µg of α-toxin: ~ 3.2 x10⁻¹⁰ mole
α-toxin : nanosponge ≈ 85 : 1
Estimated streptolysin-O neutralization capacity of the nanosponges
Mass of streptolysin-O: Mt = 6.3x10⁴ g per mole
Based on the data in Fig. S6a, 7.2 µg of streptolysin-O can be neutralized by 500 µg of
nanosponges:
7.2 µg of streptolysin-O: ~ 1.1 x10⁻¹⁰ mole
streptolysin-O : nanosponge ≈ 30 : 1
Estimated melittin neutralization capacity of the nanosponges
Mass of melittin: Mt = 2846 g per mole
Based on the data in Fig. S6b, 9.1 µg of melittin can be neutralized by 500 µg of nanosponges:
9.1 µg of melittin: ~ 3.2x10⁻⁹ mole
melittin : nanosponge ≈ 850 : 1
© 2013 Macmillan Publishers Limited. All rights reserved.
18
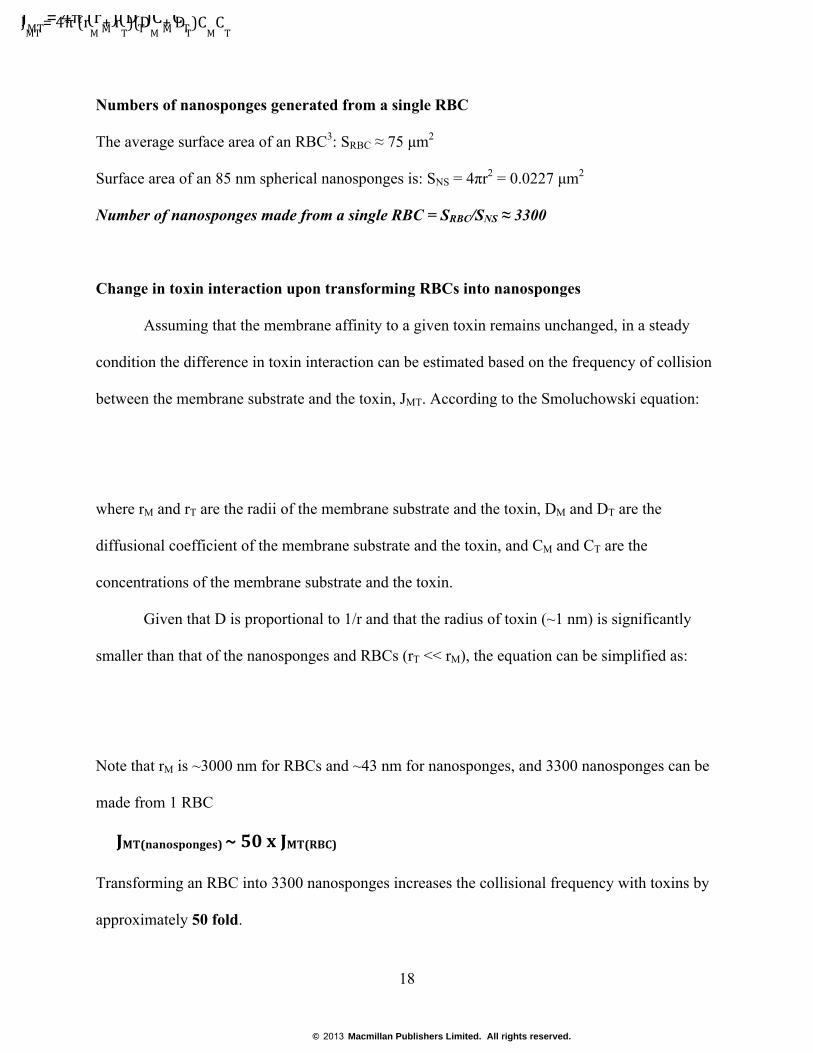
Numbers of nanosponges generated from a single RBC
The average surface area of an RBC3: SRBC ≈ 75 µm2
Surface area of an 85 nm spherical nanosponges is: SNS = 4πr2 = 0.0227 µm2
Number of nanosponges made from a single RBC = SRBC/SNS ≈ 3300
Change in toxin interaction upon transforming RBCs into nanosponges
Assuming that the membrane affinity to a given toxin remains unchanged, in a steady
condition the difference in toxin interaction can be estimated based on the frequency of collision
between the membrane substrate and the toxin, JMT. According to the Smoluchowski equation:
where rM and rT are the radii of the membrane substrate and the toxin, DM and DT are the
diffusional coefficient of the membrane substrate and the toxin, and CM and CT are the
concentrations of the membrane substrate and the toxin.
Given that D is proportional to 1/r and that the radius of toxin (~1 nm) is significantly
smaller than that of the nanosponges and RBCs (rT << rM), the equation can be simplified as:
Note that rM is ~3000 nm for RBCs and ~43 nm for nanosponges, and 3300 nanosponges can be
made from 1 RBC
JMT(nanosponges) ~ 50 x JMT(RBC)
Transforming an RBC into 3300 nanosponges increases the collisional frequency with toxins by
approximately 50 fold.
JMT = 4π (r
M + r
T)(D
M + D
T)C
MCT J
MT = 4π (r
M)(D
T)C
MCT
© 2013 Macmillan Publishers Limited. All rights reserved.
19
Change in surface area to volume ratio (S/V) upon turning RBCs into nanosponges
Volume of a nanosponge: VNS = 4πr3/3 = 1.8x10⁻¹⁶ cm3
Volume of an RBC4: VRBC = 50 fL
S/V of a nanosponge = SNS/VNS = 0.023 µm2/1.8x10-16 cm3 = 1.3x10⁸ m-1
S/V of an RBC = 75 µm2/50 fL = 7.5x10⁻¹³ m2/5.0x10-19 m3 = 1.5x10⁶ m-1
Given the same surface area, preparing a particle-supported membrane structure with the
same dimension as an RBC requires ~90 times the amount of polymer as compared to preparing
nanosponges.
Supplementary References
1. Cheng, J. et al. Formulation of functionalized PLGA-PEG nanoparticles for in vivo
targeted drug delivery. Biomaterials 28, 869-876 (2007).
2. Yang, D. et al. The antimicrobial activity of liposomal lauric acids against
Propionibacterium acnes. Biomaterials 30, 6035-6040 (2009).
3. Waugh, R.E. & Sarelius, I.H. Effects of lost surface area on red blood cells and red blood
cell survival in mice. Am. J. Physiol. 271, C1847-1852 (1996).
4. Kaleko, M., Garcia, J.V., Osborne, W.R. & Miller, A.D. Expression of human adenosine
deaminase in mice after transplantation of genetically-modified bone marrow. Blood 75,
1733-1741 (1990).
© 2013 Macmillan Publishers Limited. All rights reserved.