a best-in-class industrial growth enterprise
TRANSCRIPT

1
A Best-in-Class Industrial
Growth EnterpriseAugust 2021
2
The company’s guidance with respect to anticipated financial results for future periods, potential future growth and profitability, future business mix,
expectations regarding future market trends, future performance within specific markets and other statements herein or made on the conference call that are
not historical information are forward-looking statements within the meaning of Section 27A of the Securities Act of 1933 and Section 21E of the Securities
Exchange Act of 1934. Forward-looking statements are subject to known and unknown risks and uncertainties that could cause actual results to differ
materially from those expressed or implied by such statements. Such risks and uncertainties include, but are not limited to: (a) the effects of global
macroeconomic conditions upon demand for our products and services; (b) the volatility and cyclicality of the industries the company serves, particularly the
semiconductor industry; (c) delays in capital spending by end-users in our served markets; (d) the risks and uncertainties related to the integration of Artesyn
Embedded Power including the optimization and reduction of our global manufacturing sites; (e) the continuing spread of COVID-19 and its potential adverse
impact on our product manufacturing, research and development, supply chain, services and administrative operations; (f) supply chain disruptions and
component shortages that may impact the company’s ability to obtain in a timely manner the materials necessary to manufacture its products; (g) the
accuracy of the company’s estimates related to fulfilling solar inverter product warranty and post-warranty obligations; (h) the company’s ability to realize its
plan to avoid additional costs after the solar inverter wind-down; (i) the accuracy of the company’s assumptions on which its financial statement projections
are based; (j) the impact of product price changes, which may result from a variety of factors; (k) the timing of orders received from customers; (l) the
company’s ability to realize benefits from cost improvement efforts including avoided costs, restructuring plans and inorganic growth; (m) unanticipated
changes to management’s estimates, reserves or allowances; (n) changes and adjustments to the tax expense and benefits related to the U.S. tax reform
that was enacted in late 2017; and (o) the impact of political, economic and policy tensions and conflicts between China and the United States including, but
not limited to, trade wars and export restrictions between the two countries, China’s national security law for Hong Kong, and China’s expansion of control
over the South China Sea, any of which could negatively impact our customers’ and our presence, operations, and financial results. These and other risks are
described in Advanced Energy’s Form 10 K, Forms 10 Q and other reports and statements filed with the Securities and Exchange Commission (the “SEC”).
These reports and statements are available on the SEC’s website at www.sec.gov. Copies may also be obtained from Advanced Energy’s investor relations
page at ir.advanced-energy.com or by contacting Advanced Energy’s investor relations at 970 407 6555. Forward-looking statements are made and based on
information available to the company on the date of this presentation. Aspirational goals and targets discussed on the conference call or in the presentation
materials should not be interpreted in any respect as guidance. The company assumes no obligation to update the information in this presentation.
SAFE HARBOR
Copyright © 2021 Advanced Energy

3
Key Messages
POWERING THE 4TH INDUSTRIAL REVOLUTION
PURE PLAY POWER LEADER
Strategic focus on power ensures
sustainable advantages and scale
ACCELERATING EARNINGS
Target earnings growth at 3-Year CAGR of 13%,
>2X faster than revenue, and ROIC of >20%
4TH INDUSTRIAL REVOLUTION
Data economy and digitization drive
growth across our markets
OUTPERFORMING MARKETS
Track record of growing share, content
and increasing SAM
Copyright © 2021 Advanced Energy
4
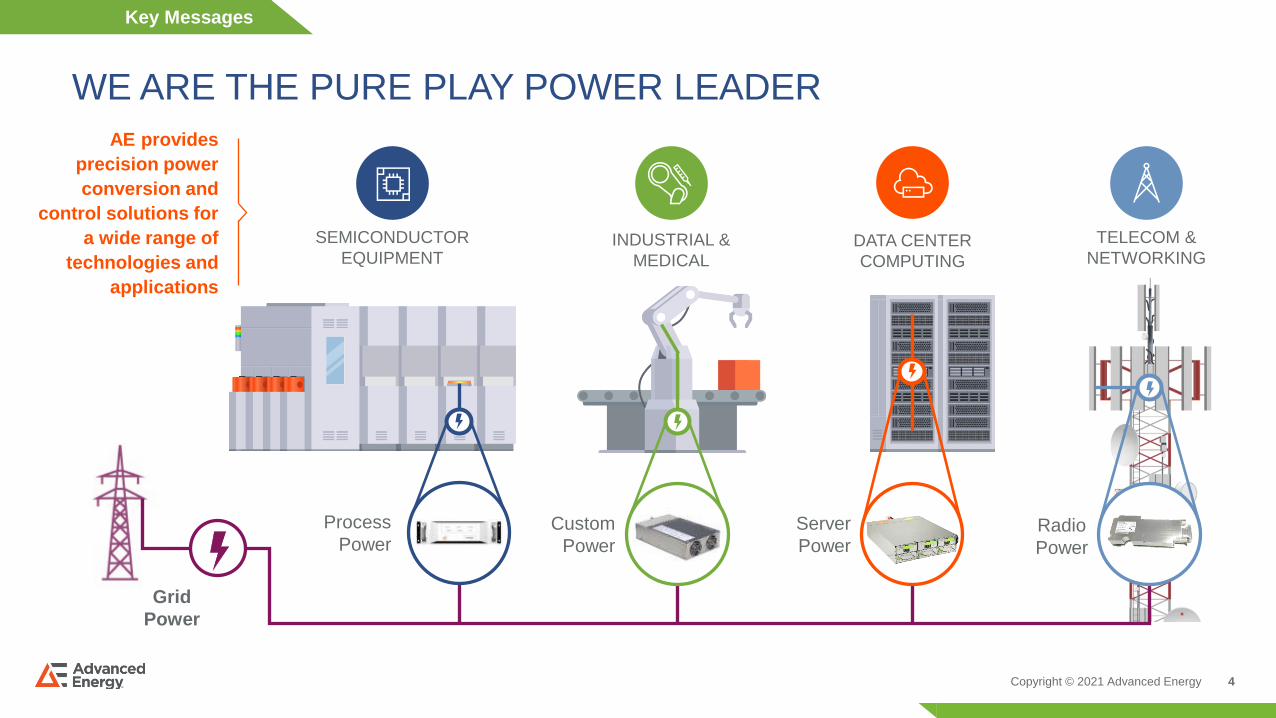
WE ARE THE PURE PLAY POWER LEADER
TELECOM &
NETWORKING
SEMICONDUCTOR
EQUIPMENTINDUSTRIAL &
MEDICALDATA CENTER
COMPUTING
Grid
Power
Radio
Power
AE provides
precision power
conversion and
control solutions for
a wide range of
technologies and
applications
Process
PowerCustom
Power
Server
Power
Key Messages
Copyright © 2021 Advanced Energy
5
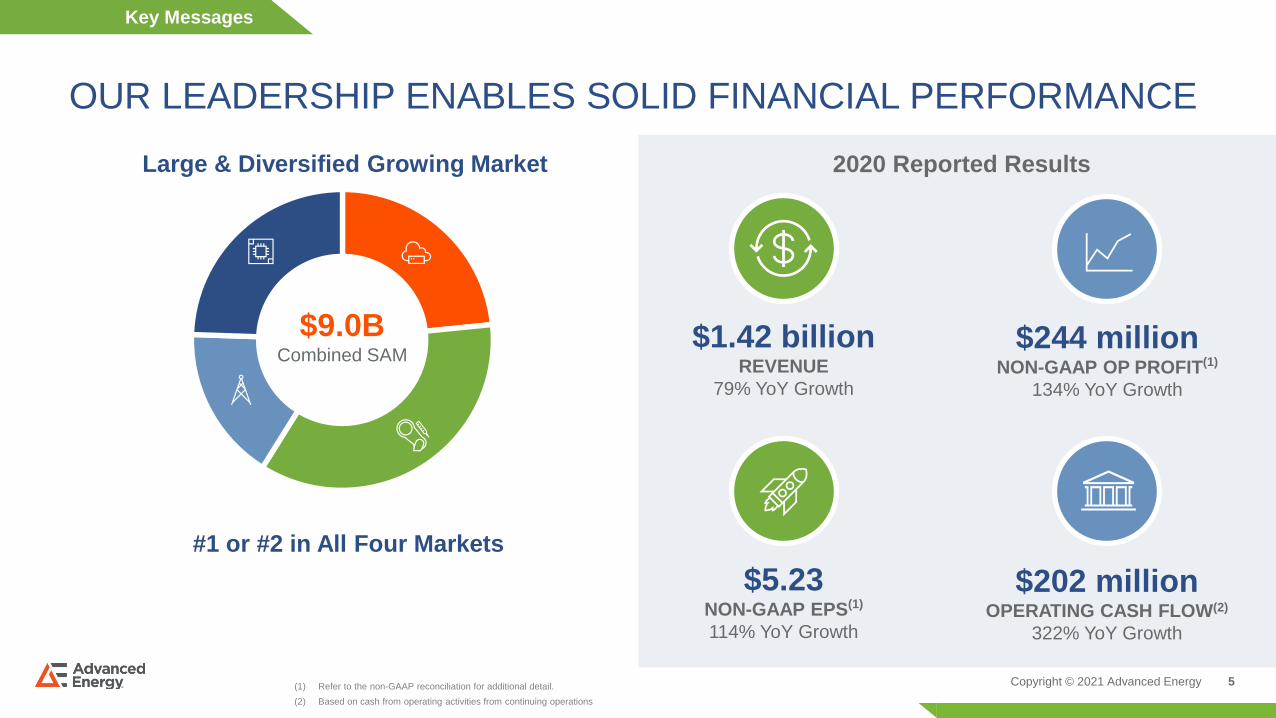
OUR LEADERSHIP ENABLES SOLID FINANCIAL PERFORMANCE
Large & Diversified Growing Market
#1 or #2 in All Four Markets
$1.42 billionREVENUE
79% YoY Growth
$5.23NON-GAAP EPS(1)
114% YoY Growth
$244 millionNON-GAAP OP PROFIT(1)
134% YoY Growth
Key Messages
$202 millionOPERATING CASH FLOW(2)
322% YoY Growth
2020 Reported Results
(1) Refer to the non-GAAP reconciliation for additional detail.
(2) Based on cash from operating activities from continuing operations
$9.0BCombined SAM
Copyright © 2021 Advanced Energy

6
4TH INDUSTRIAL REVOLUTION DRIVES GROWTH ACROSS OUR 4 VERTICALS
Secular Drivers
• Leading-edge capacity for
AI & 5G processors
• High density memory in
mobile devices & servers
• New device architectures
• 5G infrastructure requires
ruggedized power
• High-speed connectivity for
seamless data transmission
• Importance of Interconnectivity
• Accelerating adoption of
process automation
• Smart manufacturing
• Telemedicine, remote
diagnostics and treatment
• Mobile Edge Computing for 5G
• High Performance Computing
for analytics and automation
• Increased power density in
data center server racks
Copyright © 2021 Advanced Energy
5G
AI IoT
7Copyright © 2021 Advanced Energy
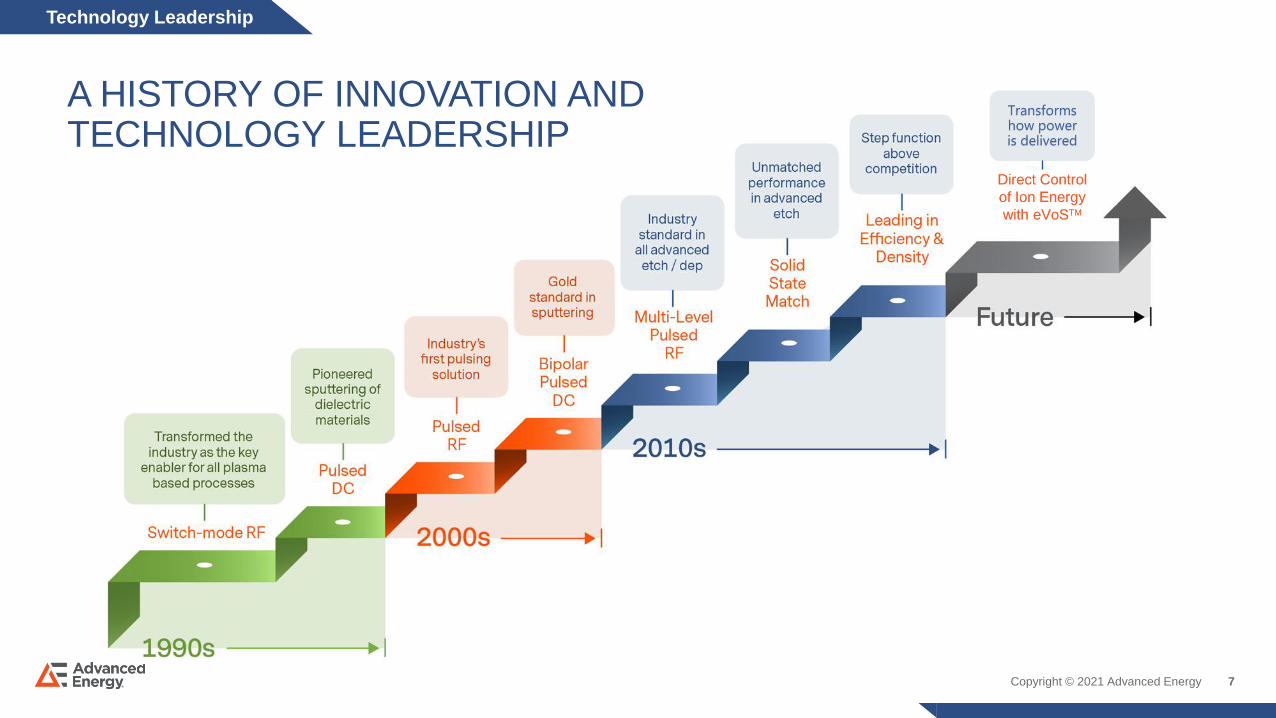
Technology Leadership
Direct Control
of Ion Energy
with eVoSTM
Transforms how power is delivered
A HISTORY OF INNOVATION AND TECHNOLOGY LEADERSHIP
8
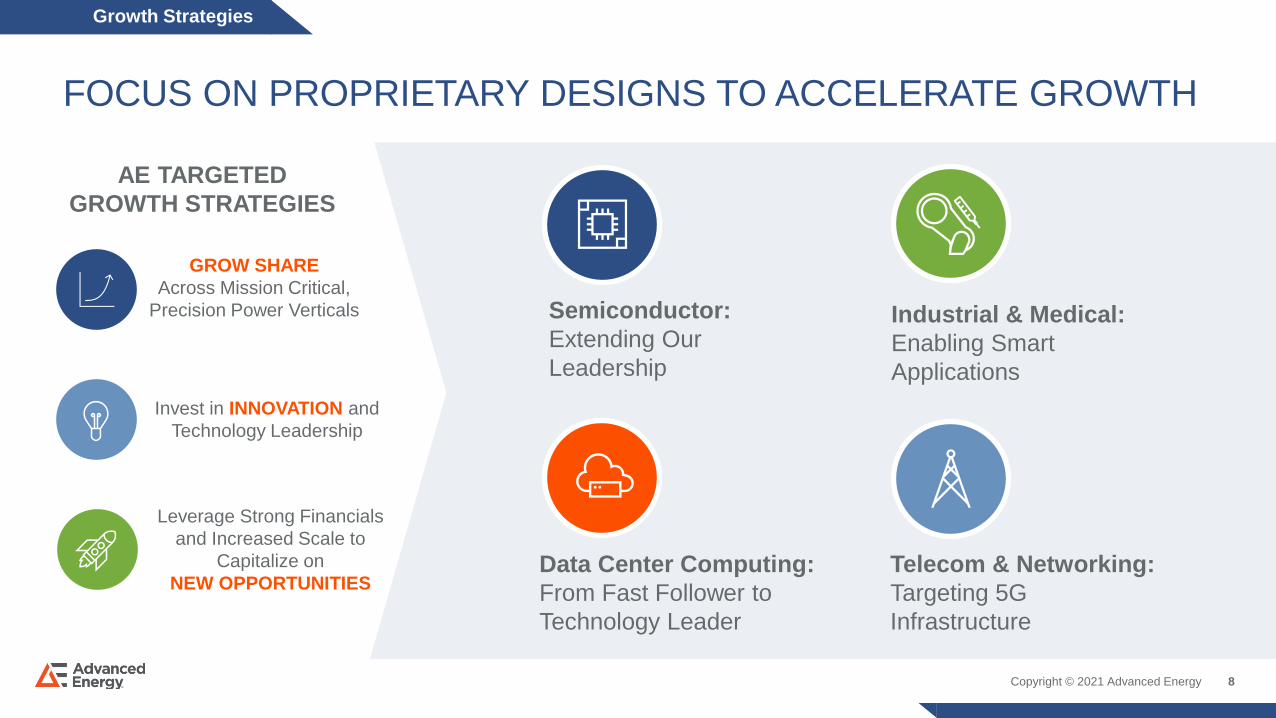
FOCUS ON PROPRIETARY DESIGNS TO ACCELERATE GROWTH
Growth Strategies
Semiconductor:
Extending Our
Leadership
Industrial & Medical:
Enabling Smart
Applications
Data Center Computing:
From Fast Follower to
Technology Leader
Telecom & Networking:
Targeting 5G
Infrastructure
GROW SHARE
Across Mission Critical,
Precision Power Verticals
Invest in INNOVATION and
Technology Leadership
Leverage Strong Financials
and Increased Scale to
Capitalize on
NEW OPPORTUNITIES
AE TARGETED
GROWTH STRATEGIES
Copyright © 2021 Advanced Energy
9
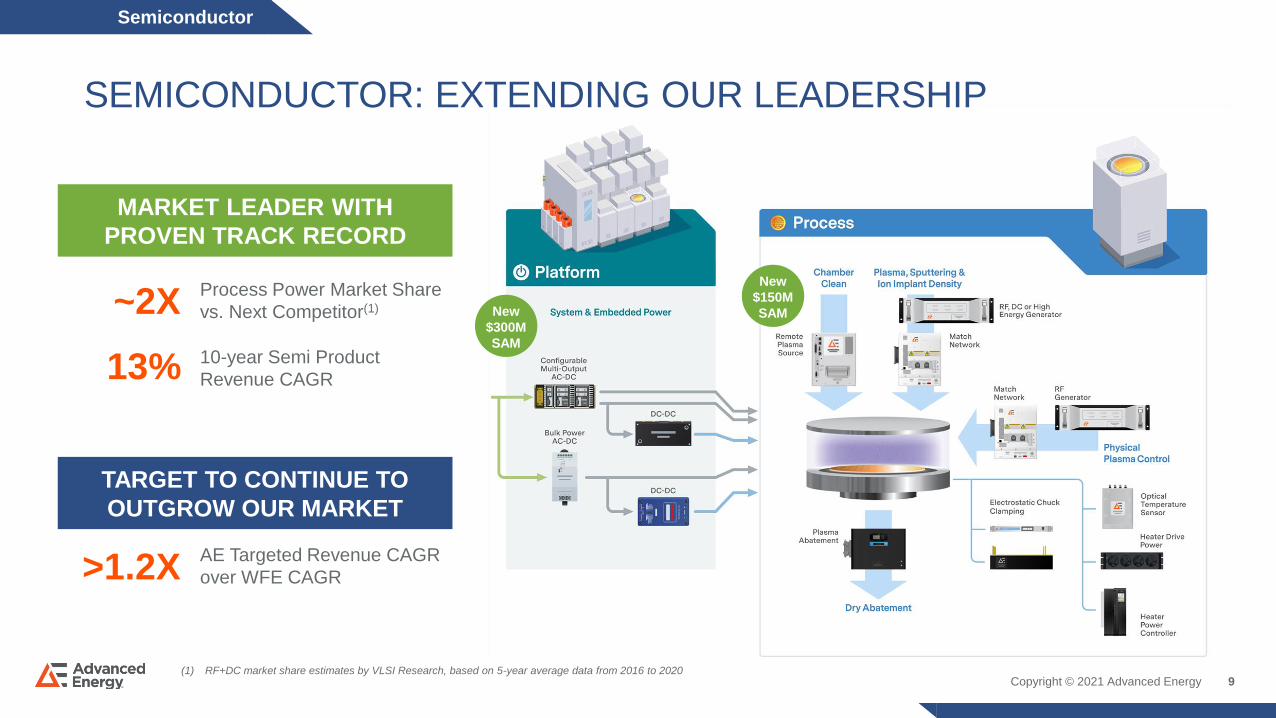
SEMICONDUCTOR: EXTENDING OUR LEADERSHIP
New
$300M
SAM
New
$150M
SAM
Semiconductor
Copyright © 2021 Advanced Energy
MARKET LEADER WITH
PROVEN TRACK RECORD
~2XProcess Power Market Share
vs. Next Competitor(1)
13% 10-year Semi Product
Revenue CAGR
TARGET TO CONTINUE TO
OUTGROW OUR MARKET
>1.2XAE Targeted Revenue CAGR
over WFE CAGR
(1) RF+DC market share estimates by VLSI Research, based on 5-year average data from 2016 to 2020

10
INDUSTRIAL & MEDICAL: ENABLING SMART APPLICATIONS
Copyright © 2021 Advanced Energy
FAVORABLE MARKET TREND
IN “SMART EVERYTHING”
LEADERSHIP IN
CONFIGURABLE
TARGET PROPIETARY DESIGNS
WITH AE’S GLOBAL CHANNEL
• Highly flexible platform using existing off the
shelf modules to create custom solutions
• Accelerates time to market by enabling quick
customization
• AE is the market leader in this SAM of
$140M with 35% share(2)
• Industry 4.0 related investments expected to
grow at a 16.9% 2019-24 CAGR(1)
• Digital transformation and smart everything
• AE leading with our highly engineered
precision power solutions with digital
functionalities and IoT integration
• Target leading customers with proprietary
opportunities across these markets
• Optimized global channel to drive scale in
coverage and increases efficiency
• Accelerate cross selling, grow design win
funnel and drive profitable revenue growth
Industrial & Medical
Key
Accounts
Named
Accounts
Regional
Accounts$0
$50
$100
$150
2016 2019 2022 2024
($ in billions)
Industry 4.0 Market(1)
(1) Source: Markets and Markets Industry 4.0 Market Report, December 2019
(2) Internal estimates

11
DATA CENTER COMPUTING: FROM FAST FOLLOWER TO TECHNOLOGY LEADER
OUR WINNING STRATEGIES
• Capture additional opportunities with 48V transition
• Win with system-level solutions
• Deliver best-in-class quality and customer relationships
• Develop Industry-leading and highly differentiated technologies
addressing the most difficult power delivery challenges
• Gain share at Tier-I and Tier-II hyperscale customers
($ in billions)
(1) Source: Company Reports, Morgan Stanley, Credit Suisse Research, RBC Capital Markets, Internal Estimates
Hyperscale CAPEX(1)
Copyright © 2021 Advanced Energy
Data Center Computing
GROWING INVESTMENTS MORE HIGH VALUE CONTENT AE TECHOLOGY LEADERSHIP
$0
$20
$40
$60
$80
$100
$120
$140
2017 2018 2019 2020 2021 2022 2023 Traditional
Server
AI & HPC
Server
2X Power Content
48V
Power ShelfPower Density
Leadership
Custom
Power System
94%
96%
98%
Mainstream
Good
Best
Industry-Leading
Power Conversion
Efficiency
12
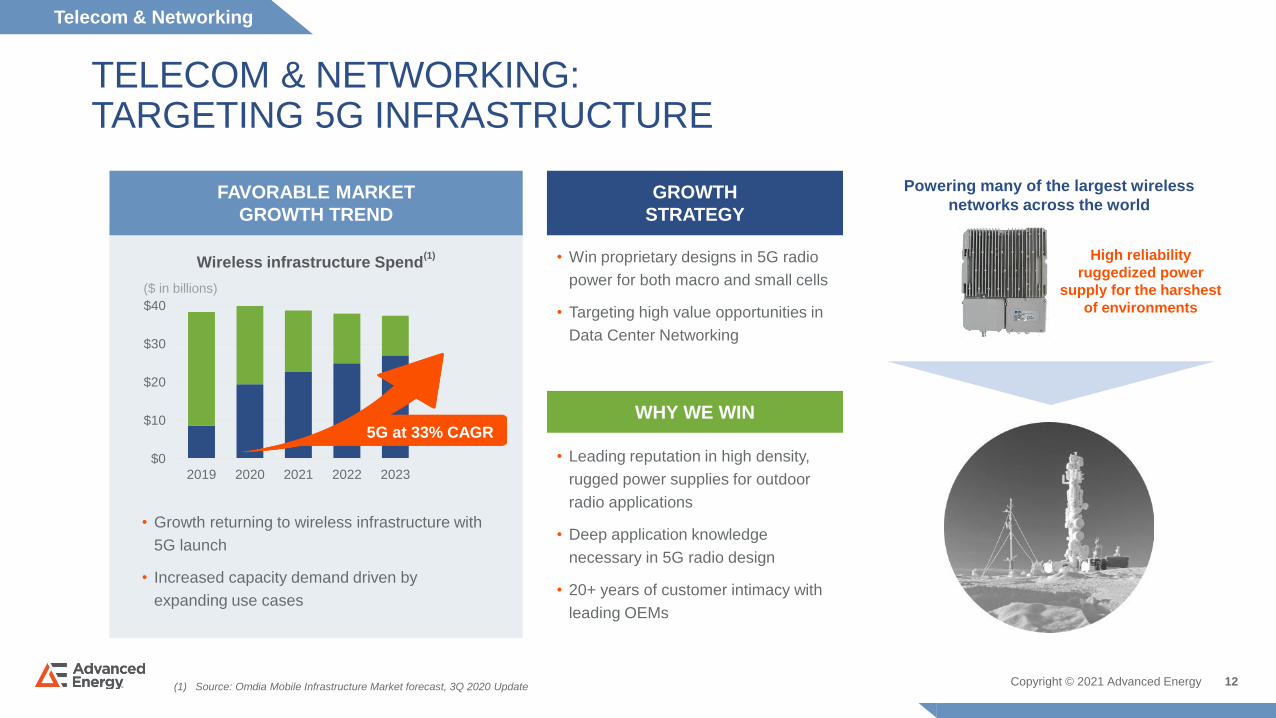
FAVORABLE MARKET
GROWTH TREND
TELECOM & NETWORKING: TARGETING 5G INFRASTRUCTURE
• Growth returning to wireless infrastructure with
5G launch
• Increased capacity demand driven by
expanding use cases
• Win proprietary designs in 5G radio
power for both macro and small cells
• Targeting high value opportunities in
Data Center Networking
• Leading reputation in high density,
rugged power supplies for outdoor
radio applications
• Deep application knowledge
necessary in 5G radio design
• 20+ years of customer intimacy with
leading OEMs
(1) Source: Omdia Mobile Infrastructure Market forecast, 3Q 2020 Update
$0
$10
$20
$30
$40
2019 2020 2021 2022 2023
($ in billions)
Wireless infrastructure Spend(1)
GROWTH
STRATEGY
5G at 33% CAGR
WHY WE WIN
Powering many of the largest wireless
networks across the world
High reliability
ruggedized power
supply for the harshest
of environments
Telecom & Networking
Copyright © 2021 Advanced Energy
13
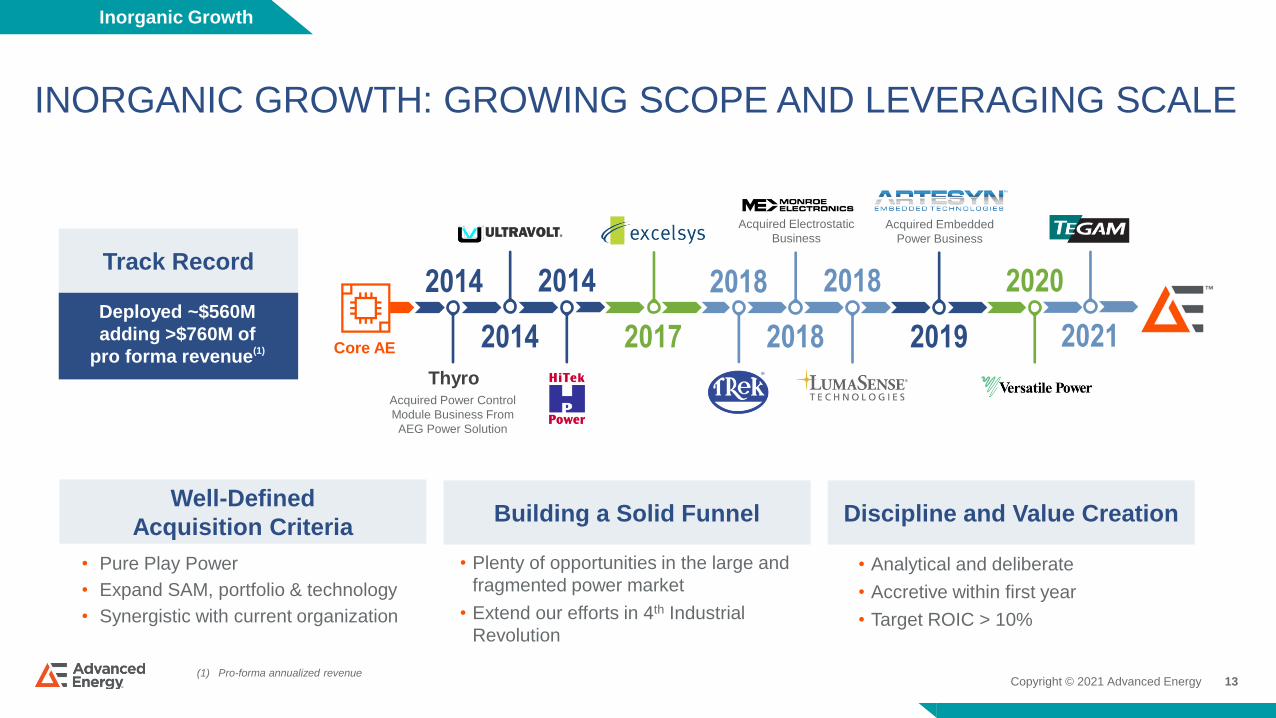
INORGANIC GROWTH: GROWING SCOPE AND LEVERAGING SCALE
Deployed ~$560M
adding >$760M of
pro forma revenue(1)
(1) Pro-forma annualized revenue
Inorganic Growth
Copyright © 2021 Advanced Energy
Well-Defined
Acquisition CriteriaBuilding a Solid Funnel Discipline and Value Creation
Track Record
• Pure Play Power
• Expand SAM, portfolio & technology
• Synergistic with current organization
• Plenty of opportunities in the large and
fragmented power market
• Extend our efforts in 4th Industrial
Revolution
• Analytical and deliberate
• Accretive within first year
• Target ROIC > 10%
Core AE
2014
2014
2014
2017
2018
2018
2018
2019
2020
Acquired Power Control
Module Business From
AEG Power Solution
Acquired Electrostatic
Business
Acquired Embedded
Power Business
Thyro
2021

14
DELIVERING STRONG FINANCIAL PERFORMANCE
14
REVENUE NON-GAAP OP INCOME NON-GAAP EPS
($ in millions) ($ per share)
NG GROSS PROFIT
($ in millions)
CASH FLOW
($ in millions)
Performance
($ in millions)
Copyright © 2021 Advanced Energy
$0.
$50.
$100.
$150.
$200.
$250.
$300.
$350.
$400.
Q3'1
9
Q4'1
9
Q1'2
0
Q2'2
0
Q3'2
0
Q4'2
0
Q1'2
1
Q2'2
1
$0.
$30.
$60.
$90.
$120.
$150.
Q3'1
9
Q4'1
9
Q1'2
0
Q2'2
0
Q3'2
0
Q4'2
0
Q1'2
1
Q2'2
1
$0.
$10.
$20.
$30.
$40.
$50.
$60.
$70.
$80.
Q3'1
9
Q4'1
9
Q1'2
0
Q2'2
0
Q3'2
0
Q4'2
0
Q1'2
1
Q2'2
1
$0.00
$0.20
$0.40
$0.60
$0.80
$1.00
$1.20
$1.40
$1.60
$1.80
Q3'1
9
Q4'1
9
Q1'2
0
Q2'2
0
Q3'2
0
Q4'2
0
Q1'2
1
Q2'2
1
$0.
$10.
$20.
$30.
$40.
$50.
$60.
$70.
Q3'1
9
Q4'1
9
Q1'2
0
Q2'2
0
Q3'2
0
Q4'2
0
Q1'2
1
Q2'2
1

15
TARGETING GROWTH ABOVE OUR MARKETS
Platform for growth
Copyright © 2021 Advanced Energy
SAM GROWTH
PROFILEAE REVENUE CAGR
TARGETS
GROWTH
DRIVERS
5-year SAM
CAGR OF 4-5%
AE Organic
CAGR of 8-9%
$2.2B
$1.5B
$2.1B
$3.2B
Combined SAM
$9.0 billion
Add >$100M Annual Revenue by 2023
2X Server TAM Growth
Win in Hyperscale
>2X GDP CAGRGDP+Smart
Applications
100 bps above market CAGR
Stable Growth
5G & DC Networking
>1.2X WFE CAGRFaster than
WFEExtend our Leadership
Portfolio Optimization
Net CAGR of 5-6%

16
ACCELERATING EARNINGS GROWTH
Copyright © 2021 Advanced Energy
Platform for growth
(1) 4 quarters combined non-GAAP EPS from Q4 2019 to Q3 2020 as presented during 2020 Investor Briefing on December 2020
(2) This figure represents our aspirational goal and is not to be treated as guidance
Baseline NON-
GAAP EPS(1)
Market
Growth
Remaining
Synergies
AE Growth
Strategies
3-Year
Aspirational
Non-GAAP
EPS Goal(2)Portfolio
Optimization
Target >50% earnings growth -
3-year EPS CAGR of 13%
or >2X revenue growth rate
+$0.20-$0.25
$4.62
$7.50
+$1.20-$1.30
+$1.15-$1.25
+$0.20-$0.25
17
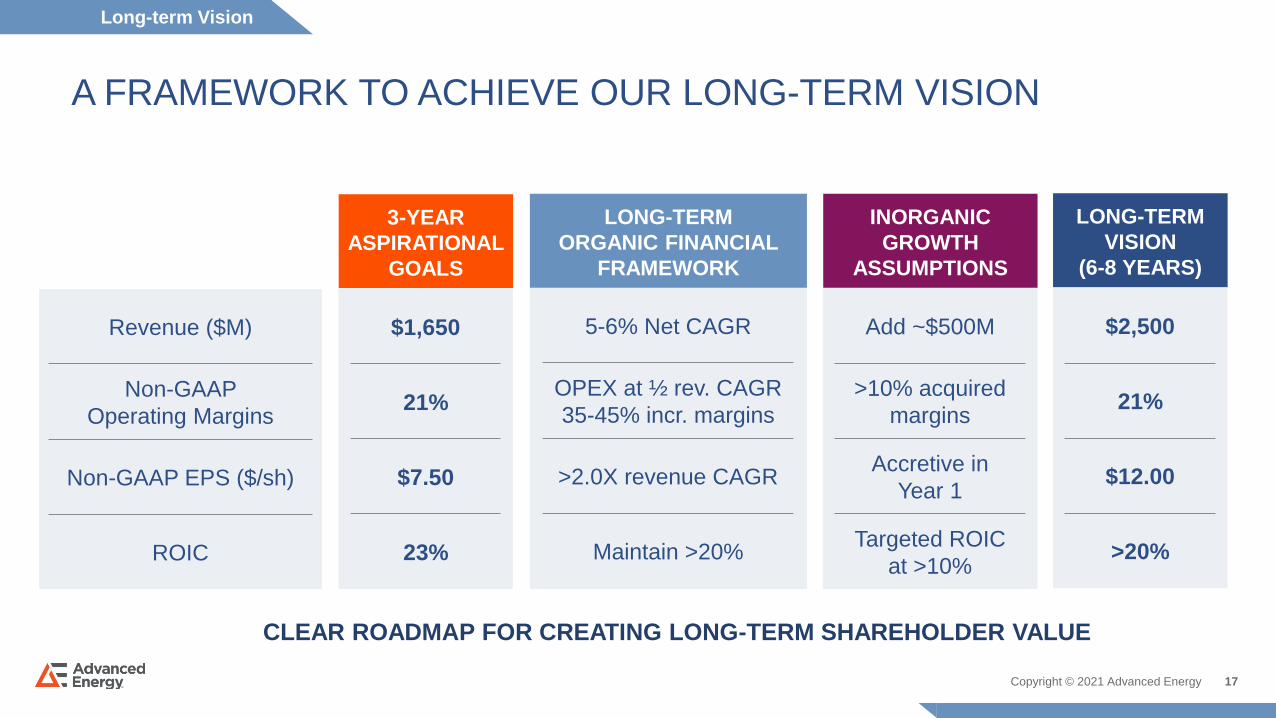
A FRAMEWORK TO ACHIEVE OUR LONG-TERM VISION
3-YEAR
ASPIRATIONAL
GOALS
$1,650
21%
$7.50
23%
LONG-TERM
ORGANIC FINANCIAL
FRAMEWORK
LONG-TERM
VISION
(6-8 YEARS)
$2,500
21%
$12.00
>20%
INORGANIC
GROWTH
ASSUMPTIONS
Add ~$500M
>10% acquired
margins
Accretive in
Year 1
Targeted ROIC
at >10%
Long-term Vision
Copyright © 2021 Advanced Energy
5-6% Net CAGR
OPEX at ½ rev. CAGR
35-45% incr. margins
>2.0X revenue CAGR
Maintain >20%
Revenue ($M)
Non-GAAP
Operating Margins
Non-GAAP EPS ($/sh)
ROIC
CLEAR ROADMAP FOR CREATING LONG-TERM SHAREHOLDER VALUE
18
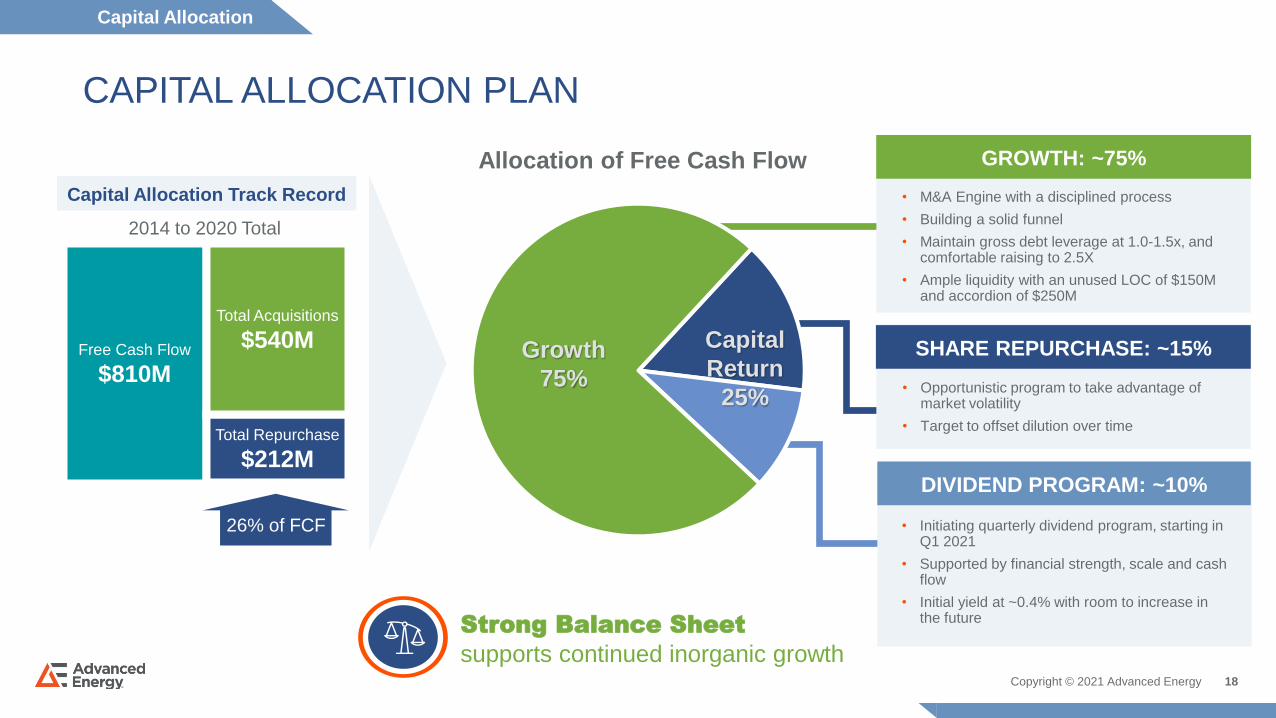
CAPITAL ALLOCATION PLAN
• M&A Engine with a disciplined process
• Building a solid funnel
• Maintain gross debt leverage at 1.0-1.5x, and comfortable raising to 2.5X
• Ample liquidity with an unused LOC of $150M and accordion of $250M
Strong Balance Sheet
supports continued inorganic growthCopyright © 2021 Advanced Energy
• Opportunistic program to take advantage of market volatility
• Target to offset dilution over time
Free Cash Flow
$810M
Total Repurchase
$212M
Total Acquisitions
$540M
2014 to 2020 Total
Capital Allocation Track Record
26% of FCF
Capital Allocation
Allocation of Free Cash Flow
• Initiating quarterly dividend program, starting in Q1 2021
• Supported by financial strength, scale and cash flow
• Initial yield at ~0.4% with room to increase in the future
Growth
75%
Capital
Return
25%
DIVIDEND PROGRAM: ~10%
SHARE REPURCHASE: ~15%
GROWTH: ~75%

19
Key Messages
POWERING THE 4TH INDUSTRIAL REVOLUTION
PURE PLAY POWER LEADER
Strategic focus on power ensuring
sustainable advantages and scale
ACCELERATING EARNINGS
Target earnings growth at 3-Year CAGR of 13%,
>2X faster than revenue, and ROIC of >20%
4TH INDUSTRIAL REVOLUTION
Data economy and digitization drive
growth across our markets
OUTPERFORMING MARKETS
Track record of growing share, content
and increasing SAM
Copyright © 2021 Advanced Energy
20
THANK YOU
Copyright © 2021 Advanced Energy
21
• Advanced Energy’s non-GAAP measures exclude the impact of non-cash related charges such as stock-based compensation and
amortization of intangible assets, as well as discontinued operations, minority interest, and non-recurring items such as acquisition-
related costs and restructuring expenses. The non-GAAP measures are not in accordance with, or an alternative for, similar
measures calculated under generally accepted accounting principles and may be different from non-GAAP measures used by other
companies. In addition, these non-GAAP measures are not based on any comprehensive set of accounting rules or principles.
Advanced Energy believes that these non-GAAP measures provide useful information to management and investors to evaluate
business performance without the impacts of certain non-cash charges and other charges which are not part of the company’s usual
operations. The company uses these non-GAAP measures to assess performance against business objectives, make business
decisions, develop budgets, forecast future periods, assess trends and evaluate financial impacts of various scenarios. In addition,
management's incentive plans include these non-GAAP measures as criteria for achievements. Additionally, the company believes
that these non-GAAP measures, in combination with its financial results calculated in accordance with GAAP, provide investors with
additional perspective. While some of the excluded items may be incurred and reflected in the company’s GAAP financial results in
the foreseeable future, the company believes that the items excluded from certain non-GAAP measures do not accurately reflect the
underlying performance of its continuing operations for the period in which they are incurred. The use of non-GAAP measures has
limitations in that such measures do not reflect all of the amounts associated with the company’s results of operations as determined
in accordance with GAAP, and these measures should only be used to evaluate the company’s results of operations in conjunction
with the corresponding GAAP measures. Please refer to the Form 8-K regarding this presentation furnished today to the Securities
and Exchange Commission.
NON-GAAP MEASURES
Copyright © 2021 Advanced Energy
22
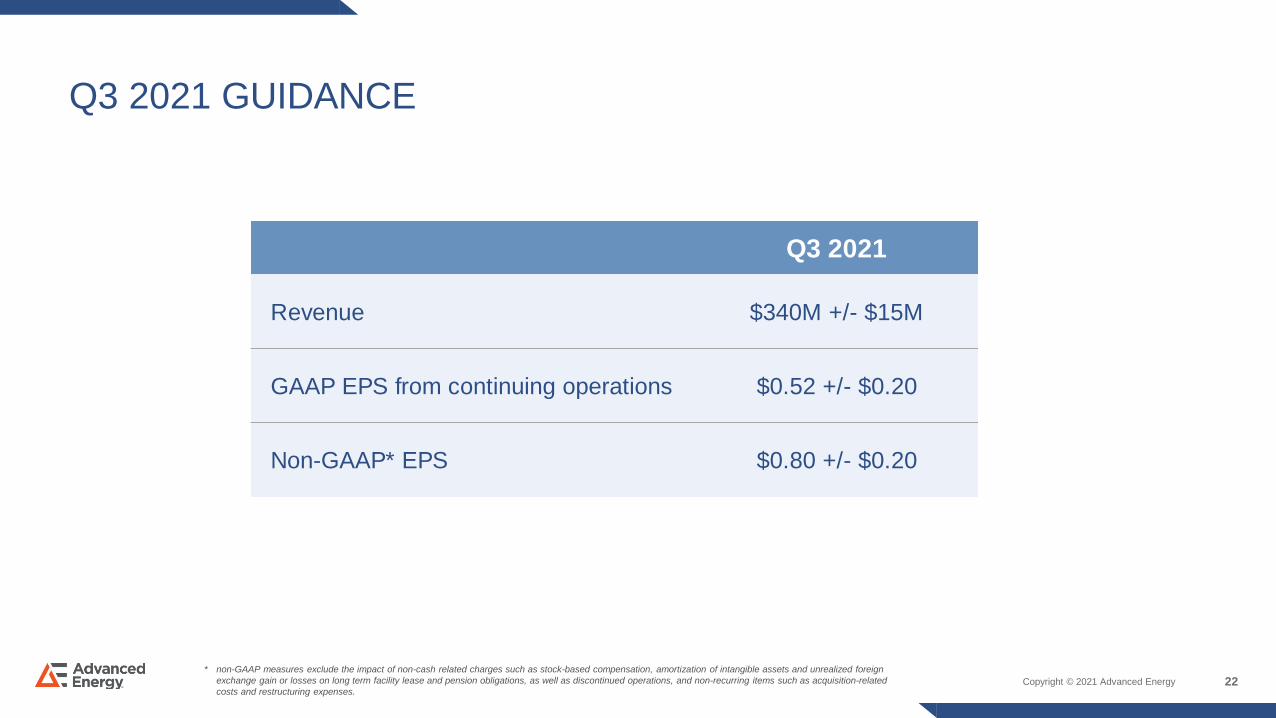
Q3 2021 GUIDANCE
Copyright © 2021 Advanced Energy
* non-GAAP measures exclude the impact of non-cash related charges such as stock-based compensation, amortization of intangible assets and unrealized foreign
exchange gain or losses on long term facility lease and pension obligations, as well as discontinued operations, and non-recurring items such as acquisition-related
costs and restructuring expenses.
Q3 2021
Revenue $340M +/- $15M
GAAP EPS from continuing operations $0.52 +/- $0.20
Non-GAAP* EPS $0.80 +/- $0.20
23
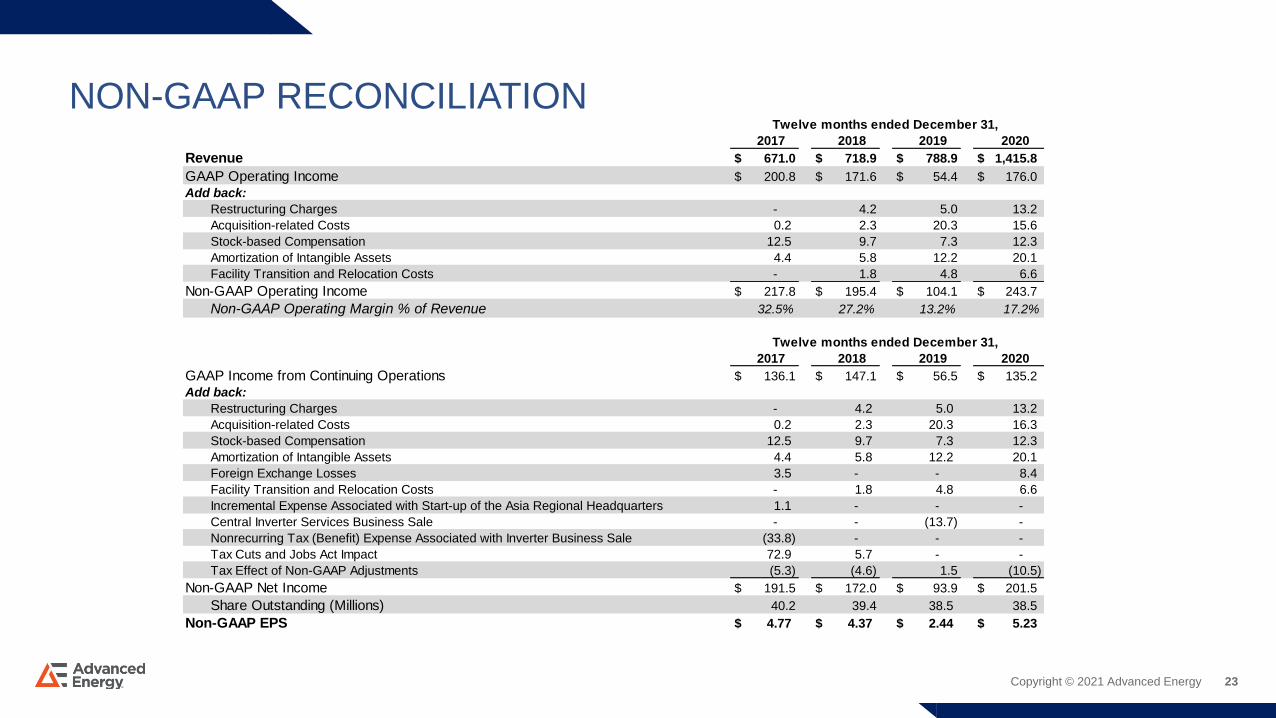
NON-GAAP RECONCILIATION
Copyright © 2021 Advanced Energy
Twelve months ended December 31,
2017 2018 2019 2020
Revenue $ 671.0 $ 718.9 $ 788.9 $ 1,415.8
GAAP Operating Income $ 200.8 $ 171.6 $ 54.4 $ 176.0
Add back:
Restructuring Charges - 4.2 5.0 13.2
Acquisition-related Costs 0.2 2.3 20.3 15.6
Stock-based Compensation 12.5 9.7 7.3 12.3
Amortization of Intangible Assets 4.4 5.8 12.2 20.1
Facility Transition and Relocation Costs - 1.8 4.8 6.6
Non-GAAP Operating Income $ 217.8 $ 195.4 $ 104.1 $ 243.7
Non-GAAP Operating Margin % of Revenue 32.5% 27.2% 13.2% 17.2%
Twelve months ended December 31,
2017 2018 2019 2020
GAAP Income from Continuing Operations $ 136.1 $ 147.1 $ 56.5 $ 135.2
Add back:
Restructuring Charges - 4.2 5.0 13.2
Acquisition-related Costs 0.2 2.3 20.3 16.3
Stock-based Compensation 12.5 9.7 7.3 12.3
Amortization of Intangible Assets 4.4 5.8 12.2 20.1
Foreign Exchange Losses 3.5 - - 8.4
Facility Transition and Relocation Costs - 1.8 4.8 6.6
Incremental Expense Associated with Start-up of the Asia Regional Headquarters 1.1 - - -
Central Inverter Services Business Sale - - (13.7) -
Nonrecurring Tax (Benefit) Expense Associated with Inverter Business Sale (33.8) - - -
Tax Cuts and Jobs Act Impact 72.9 5.7 - -
Tax Effect of Non-GAAP Adjustments (5.3) (4.6) 1.5 (10.5)
Non-GAAP Net Income $ 191.5 $ 172.0 $ 93.9 $ 201.5
Share Outstanding (Millions) 40.2 39.4 38.5 38.5
Non-GAAP EPS $ 4.77 $ 4.37 $ 2.44 $ 5.23
24
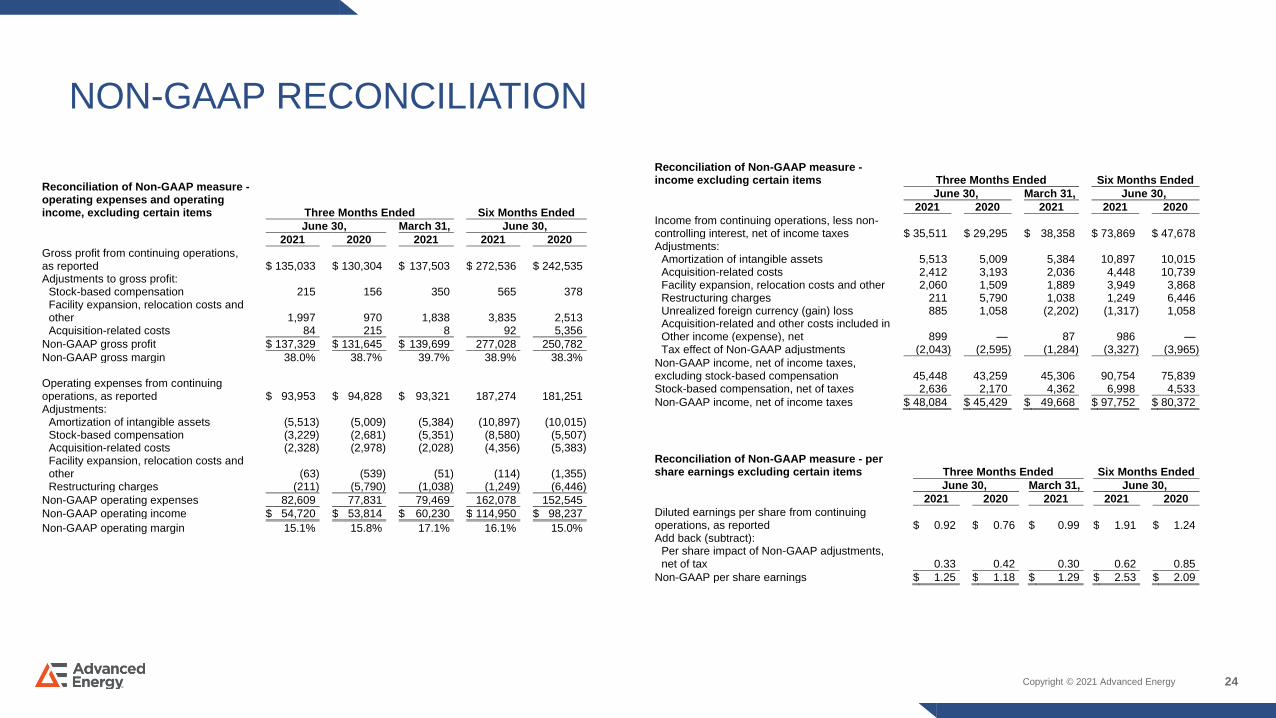
NON-GAAP RECONCILIATION
Copyright © 2021 Advanced Energy
Reconciliation of Non-GAAP measure - operating expenses and operating income, excluding certain items Three Months Ended Six Months Ended
June 30, March 31, June 30,
2021 2020 2021 2021 2020
Gross profit from continuing operations, as reported $ 135,033 $ 130,304 $ 137,503 $ 272,536 $ 242,535 Adjustments to gross profit:
Stock-based compensation 215 156 350 565 378 Facility expansion, relocation costs and other 1,997 970 1,838 3,835 2,513 Acquisition-related costs 84 215 8 92 5,356
Non-GAAP gross profit $ 137,329 $ 131,645 $ 139,699 277,028 250,782
Non-GAAP gross margin 38.0% 38.7% 39.7% 38.9% 38.3% Operating expenses from continuing operations, as reported $ 93,953 $ 94,828 $ 93,321 187,274 181,251 Adjustments:
Amortization of intangible assets (5,513) (5,009) (5,384) (10,897) (10,015) Stock-based compensation (3,229) (2,681) (5,351) (8,580) (5,507) Acquisition-related costs (2,328) (2,978) (2,028) (4,356) (5,383) Facility expansion, relocation costs and other (63) (539) (51) (114) (1,355) Restructuring charges (211) (5,790) (1,038) (1,249) (6,446)
Non-GAAP operating expenses 82,609 77,831 79,469 162,078 152,545
Non-GAAP operating income $ 54,720 $ 53,814 $ 60,230 $ 114,950 $ 98,237
Non-GAAP operating margin 15.1% 15.8% 17.1% 16.1% 15.0%
Reconciliation of Non-GAAP measure - income excluding certain items Three Months Ended Six Months Ended
June 30, March 31, June 30,
2021 2020 2021 2021 2020
Income from continuing operations, less non-controlling interest, net of income taxes $ 35,511 $ 29,295 $ 38,358 $ 73,869 $ 47,678 Adjustments:
Amortization of intangible assets 5,513 5,009 5,384 10,897 10,015 Acquisition-related costs 2,412 3,193 2,036 4,448 10,739 Facility expansion, relocation costs and other 2,060 1,509 1,889 3,949 3,868 Restructuring charges 211 5,790 1,038 1,249 6,446 Unrealized foreign currency (gain) loss 885 1,058 (2,202) (1,317) 1,058 Acquisition-related and other costs included in Other income (expense), net 899 — 87 986 — Tax effect of Non-GAAP adjustments (2,043) (2,595) (1,284) (3,327) (3,965)
Non-GAAP income, net of income taxes, excluding stock-based compensation 45,448 43,259 45,306 90,754 75,839 Stock-based compensation, net of taxes 2,636 2,170 4,362 6,998 4,533
Non-GAAP income, net of income taxes $ 48,084 $ 45,429 $ 49,668 $ 97,752 $ 80,372
Reconciliation of Non-GAAP measure - per share earnings excluding certain items Three Months Ended Six Months Ended
June 30, March 31, June 30,
2021 2020 2021 2021 2020
Diluted earnings per share from continuing operations, as reported $ 0.92 $ 0.76 $ 0.99 $ 1.91 $ 1.24 Add back (subtract):
Per share impact of Non-GAAP adjustments, net of tax 0.33 0.42 0.30 0.62 0.85
Non-GAAP per share earnings $ 1.25 $ 1.18 $ 1.29 $ 2.53 $ 2.09
25
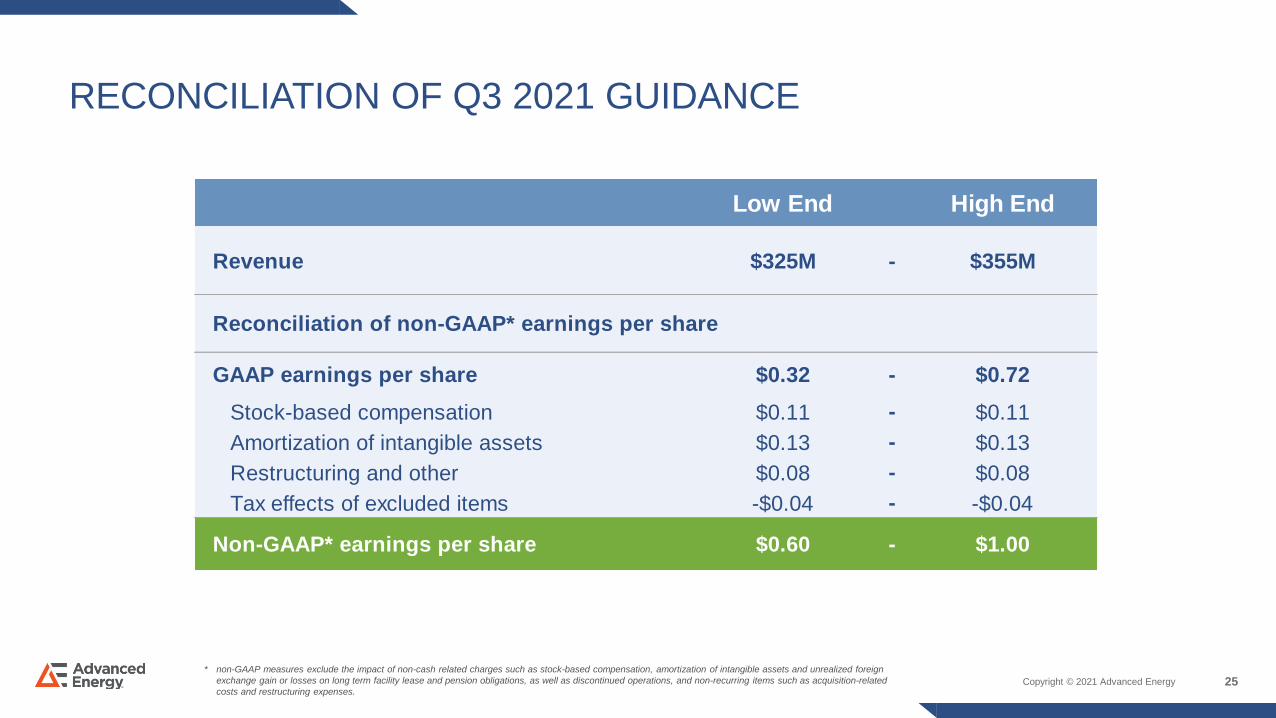
RECONCILIATION OF Q3 2021 GUIDANCE
Copyright © 2021 Advanced Energy
* non-GAAP measures exclude the impact of non-cash related charges such as stock-based compensation, amortization of intangible assets and unrealized foreign
exchange gain or losses on long term facility lease and pension obligations, as well as discontinued operations, and non-recurring items such as acquisition-related
costs and restructuring expenses.
Low End High End
Revenue $325M - $355M
Reconciliation of non-GAAP* earnings per share
GAAP earnings per share $0.32 - $0.72
Stock-based compensation $0.11 - $0.11
Amortization of intangible assets $0.13 - $0.13
Restructuring and other $0.08 - $0.08
Tax effects of excluded items -$0.04 - -$0.04
Non-GAAP* earnings per share $0.60 - $1.00