a benchmark to select data mining based …
TRANSCRIPT

International Journal of Data Mining & Knowledge Management Process (IJDKP) Vol.2, No.5, September 2012
DOI : 10.5121/ijdkp.2012.2503 25
A BENCHMARK TO SELECT DATA MINING BASED
CLASSIFICATION ALGORITHMS FOR BUSINESS
INTELLIGENCE AND DECISION SUPPORT SYSTEMS
Pardeep Kumar1 , Nitin
1 and Vivek Kumar Sehgal
1 and Durg Singh Chauhan
2
1Department of Computer Science & Engineering and Information Technology,
Jaypee University of Information Technology, Waknaghat, Solan, Himachal Pradesh, India [email protected],{delnitin,vivekseh}@ieee.org
2Institute of Technology , Banaras Hindu University, Banaras, U.P., India
Currently with Uttarakhand Technical University, Deharadun, Uttarakhand, India [email protected]
ABSTRACT
In today’s business scenario, we percept major changes in how managers use computerized support in
making decisions. As more number of decision-makers use computerized support in decision making,
decision support systems (DSS) is developing from its starting as a personal support tool and is becoming
the common resource in an organization. DSS serve the management, operations, and planning levels of an
organization and help to make decisions, which may be rapidly changing and not easily specified in
advance. Data mining has a vital role to extract important information to help in decision making of a
decision support system. It has been the active field of research in the last two-three decades. Integration of
data mining and decision support systems (DSS) can lead to the improved performance and can enable the
tackling of new types of problems. Artificial Intelligence methods are improving the quality of decision
support, and have become embedded in many applications ranges from ant locking automobile brakes to
these days interactive search engines. It provides various machine learning techniques to support data
mining. The classification is one of the main and valuable tasks of data mining. Several types of
classification algorithms have been suggested, tested and compared to determine the future trends based on
unseen data. There has been no single algorithm found to be superior over all others for all data sets.
Various issues such as predictive accuracy, training time to build the model, robustness and scalability
must be considered and can have tradeoffs, further complex the quest for an overall superior method. The
objective of this paper is to compare various classification algorithms that have been frequently used in
data mining for decision support systems. Three decision trees based algorithms, one artificial neural
network, one statistical, one support vector machines with and without adaboost and one clustering
algorithm are tested and compared on four datasets from different domains in terms of predictive accuracy,
error rate, classification index, comprehensibility and training time. Experimental results demonstrate that
Genetic Algorithm (GA) and support vector machines based algorithms are better in terms of predictive
accuracy. Former shows highest comprehensibility but is slower than later. From the decision tree based
algorithms, QUEST produces trees with lesser breadth and depth showing more comprehensibility. This
research work shows that GA based algorithm is more powerful algorithm and shall be the first choice of
organizations for their decision support systems. SVM without adaboost shall be the first choice in context
of speed and predictive accuracy. Adaboost improves the accuracy of SVM but on the cost of large training
time.
KEYWORDS
Artificial Intelligence, Decision Support System, Data Mining, KDD, Classification Algorithms, Predictive
Accuracy, Comprehensibility, Genetic Algorithm

International Journal of Data Mining & Knowledge Management Process (IJDKP) Vol.2, No.5, September 2012
26
1. INTRODUCTION
Despite successes in recent years in the area of large scale database design, we are still challenged
by the difficulties associated with unlocking the data we need and removing it from the cavernous
databases in which it resides. In addition, we are becoming increasingly aware of the hidden
treasure trove of new knowledge quietly residing in our data and face considerable frustrations
when we attempt to get it. Such a never ending cycle of data creation, storage and problem in its
access and analysis has resulted in the implementation of new and efficient tools to help us in
handling such challenge. There is adequate amount of observed evidence that human judgment
and decision making can be too far from the best, and it becomes worst even further with
complexity and stress. Various areas like statistics theory, economics and operations research
have different methods for selecting choices. In the last decades, such methods, with a variety of
techniques coming from information theory, psychology, and artificial intelligence, have been
developed in the form of computer software or programs, either as independent tools or as
combined computing environments for complex decision making. Such programs are named as
decision support systems (DSSs). According to Gorry and Morton , “A DSS is an interactive
computer based system that helps decision makers utilizes data and models to solve unstructured
problems”[1]. It is a computer-based support system for management decision makers who deal
with semi structured problems. The idea of DSS is wide, and its definitions may vary from
author’s perception in literature.
Data mining is defined as the extraction of hidden knowledge, exceptional patterns and new
findings from huge databases. Data mining is considered as the key step of a detailed process
called Knowledge Discovery in Databases (KDD) which is defined as the non – trivial process of
identifying valid, novel, and ultimately understandable patterns in large databases [2].
The bridging of data mining and decision support has a significant impact on the developments of
both fields, largely by improving approaches for problem solving in real settings, enabling the
fusion of knowledge from experts and knowledge extracted from data, and consequently enabling
the successful solution of new types of problems[3]. Mladenic, D. and Lavrac,N have done
excellent work for the integration of these two research areas in SolEuNet project[4-5].
Classification is one of the important tasks of data mining. There is lot of research going in the
machine learning and statistics communities on algorithms for classification algorithms. The
conventional models used for classification are decision trees, neural network, statistical and
clustering techniques. SVM is the recent development and widely used these days for
classification.
There is a project, called the STATLOG project, tests and compares the predictive accuracy of
various decision tree classification algorithms against some non-decision tree classification
algorithms on a huge number of datasets [6]. This project discovers that no classification
algorithm is exactly most accurate over the datasets tested and various algorithms possess
sufficient accuracy. Earlier comparative studies put emphasis on the predictive accuracy of
classification algorithms; other factors like comprehensibility are also becoming important.
Breslow and Aha have surveyed methods of decision tree simplification to improve their
comprehensibility [7]. Brodley and Utgoff , Brown, Corruble, and Pittard, Curram and Mingers,
and Shavlik, Mooney and Towell have also tested and compared various classification algorithms
on the datasets from varying domains[8-11]. Roger J Marshall, P Baladi, S Brunak, Y Chauvin ,
C.A Anderson have done latest work in the selection of classification algorithms based on various
important parameters like misclassification rates and types of attributes at hand[27-28, 30]. Saroj
and K.K Bhardwaj have done excellent work to exploit the capability of genetic algorithms to
discover information from huge data repositories [31]. Bikash Kanti Sarkar, Shib Sankar

International Journal of Data Mining & Knowledge Management Process (IJDKP) Vol.2, No.5, September 2012
27
Sana, and Kripasindhu Chaudhuri have made accuracy based learning classification system where
C4.5 and GA capabilities has been expored in classification domain [32].
This paper compares three decision trees (CHAID, QUEST and C4.5), one neural network (Back
Propagation), one statistical (Logistic regression), one support vector machine(LibSVM and
AdaboostM1-SVM) with and without boosting and one clustering algorithm (k-means). These
algorithms are tested on four datasets (Mushroom,Vote,Nursery and Credit) that are taken from
the University of California, Irvine, Repository of Machine Learning Databases (UCI) [14].
Further, genetic algorithm is tested on all the data sets. Here, section 2 briefly describes the
algorithms and section 3 describes some background to the datasets and experimental setup, and
Section 4 shows the result. Conclusion is given in section 5.
2. THE ALGORITHMS
2.1. Decision Trees
2.1.1. CHAID
Such a decision tree based algorithm is based on a statistical approach called chi square test.
CHAID acronym expansion is chi square automatic interaction detection. It is different from
other decision tree algorithms in the sense of attribute selection measure for tree formation. It
uses chi square test to choose best split instead of information gain (reduction in entropy) as in C
4.5 during tree generation. It is having automatically constructing a contingency table, and
checking out statistical importance of the proportions. The most important correlations among
attributes are used to form the shape of a tree. It includes (i) computing the expected frequencies
(ii) application of the chi square formula (iii) calculate the degree of freedom and (iv) using the
chi square table. Attributes that are not statistically significant are merged during tree formation
and those attributes that are statistical significant become nodes in the tree. More detail can be
found at [7, 16].
2.1.2. QUEST
The acronym QUEST stands for Quick, Unbiased, Efficient Statistical Tree. It is a binary
classification algorithm for constructing decision trees. A major motivation in its development
was to reduce the processing time required for large C&RT (classification & regression tree)
analyses with either many variables or many cases. Secondly QUEST was to decrease the trend
found in classification tree algorithms to give priority to attributes that permit more splits; i.e.
continuous attributes or those with multiple categories. QUEST uses a sequence of rules, based
on significance tests, to evaluate the predictor variables at a node. For selection purposes, as little
as a single test may need to be performed on each predictor at a node. Unlike C&RT, all splits are
not examined, and unlike C&RT and CHAID, category combinations are not tested when
evaluating a predictor for selection. This speeds the analysis. Splits are determined by running
quadratic discriminate analysis using the selected predictor on groups formed by the target
categories. This method again results in a speed improvement over exhaustive search (C&RT) to
determine the optimal split [6, 17].
2.1.3. C 4.5
C 4.5 algorithm uses information gain measure to select the test attribute at each node in the tree.
Such a parameter is termed as an attribute selection measure or a measure of goodness of split.
The attribute having largest information gain (or maximum entropy reduction) is selected as the
test attribute for the current node. Such attribute reduces the randomness or information required
to classify the tuples in the generated partitions and represents the least randomness or impurity in
terms of classification in such partitions. Such an approach based on information theory reduces
the expected number of comparisons or tests required to classify an object and assure that a tuple

International Journal of Data Mining & Knowledge Management Process (IJDKP) Vol.2, No.5, September 2012
28
(but not necessarily the simplest) tree is found. More detail of the algorithm can be found at [7,
16].
2.2. Neural Network
Back Propagation: It is an example of artificial neural network. It learns by recursively
processing a set of training tuples, comparing the network’s observed output for each tuple with
the actual known class attribute value. For each training tuple, the weights are edited so as to
reduce the mean squared error between the network’s output and the actual class label or value.
These changes are propagated in backward direction, i.e. from the output layer, through each
hidden layer down to the first hidden layer. After running the process repetitively, the weights
will finally converge, and the training process stops. More detail of this algorithm can be found at
[9-13, 15].
2.3. Statistical Techniques
Logistic regression: It is a technique from statistics for classifying tuples by considering values
of input fields. It is applicable for categorical as well as numerical class attributes whereas linear
regression requires only numerical class attributes. In this technique, set of equations are
generated that link the input field values to the probabilities related with each of the output field
categories or classes. Once the model is built, it can be used to calculate probabilities for new
tuples. For each tuple, a probability of membership is calculated for each possible output category
or class label. The class category or value with the maximum probability is assigned as the
predicted output value for that tuple. Probabilities calculation is carried out in this technique by a
logistic model equation. More detail of the algorithms can be found at [15,18-21].
2.4. Clustering Techniques
k-means: The k-means provides a method of cluster analysis. It is used to categorize the tuples
of a dataset in different groups based on the similarities. It is an example of supervised machine
learning. The class label of the tuples is not known while training. Instead of trying to predict an
outcome, k-means tries to uncover patterns in the set of input fields. Tuples are arranged in
groups so that tuples of a group or cluster seem to be similar to each other, but tuples in different
groups are dissimilar. k-means works by initializing a set of initial cluster centers generated from
dataset. The tuples are put in a cluster to which they are most similar. Similarity is calculated by
Euclidean formula. Such formula considers the tuple’s input field values. After all tuples have
been put in clusters, the cluster centers are modified to show the new set of tuples assigned to
each cluster. The tuples are then tested again to check whether they should be re located to a
different cluster, and the tuple assignment/group repetition process goes until either the highest
number of iterations is achieved, or the change between one repetition and the next fails to exceed
a predefined threshold. More details of the algorithm can be found at [6,15].
2.5. Evolutionary Techniques
Genetic Algorithm: Genetic Algorithm (GA) is based on Darwinian natural selection and
Mendelian genetics, in which each point in the search space is a string called a chromosome that
represents a possible solution. In this approach there is a requirement of a population of
chromosomes used to represent a combination of features from the set of features and a function
that computes each chromosome’s fitness (such a function is called evaluation function or fitness
function in literature). The algorithm does an optimization by editing a finite population of
chromosomes. In each generation, the GA generates a set of new chromosomes by three core
operation known as crossover, inversion and mutation [22-25-26]. The pseudo code for genetic
algorithm used in data mining is given below. In this pseudo code, initial population represents

International Journal of Data Mining & Knowledge Management Process (IJDKP) Vol.2, No.5, September 2012
29
encoded production rules. Fitness function is defined in terms of predictive accuracy and
comprehensibility given by formula as Fitness function is given by the formula as
Pseudo Code-Genetic Algorithm in Data Mining
{
1. Create initial population;
2. Compute fitness of individuals(binary encoded rules);
3. REPEAT
4. Sort rules in decreasing order of Fitness;
5. Select individuals based on fitness;
6. Store the sorted rules into CandidateRuleList;
7. WHILE (CandidateRuleList is not empty) AND (TrainingSet is not empty)
8. Remove from the TrainingSet the data instances correctly covered by the first rule in
CandidateRuleList ;
9. Remove the first rule from CandidateRuleList and insert it into SelectedRuleList;
10. ENDWHILE
11. Apply genetic operators to selected individuals, creating offspring;
12. Compute fitness of offspring;
13. Update the current population;
14. UNTILL (stopping criteria)
}
2.6. Support Vector Machines
LibSVM: A Support Vector Machines (SVM) is an algorithm for the classification of both linear
and non-linear data. It maps the original data in large dimensions, from where it can find a hyper
plane for division of the data using important training samples referred as support vectors.
Support vector machines are based on a principle from computational learning theory which is
called as structural risk minimization principle. The concept of this principle is to search a
hypothesis h for which we can assure the lowest true error. Such error of h is the probability that
h will make an error on an unseen and arbitrarily selected test example. A maximum limit can be
used to link the true error of a hypothesis h with the error of h on the training set and the difficulty
of H (measured by VC-Dimension), the hypothesis space having h. Support vector machines find
the hypothesis h which (nearly) reduces this limit on the true error by properly handling the VC-
Dimension of H. SVM are global learners. Basically SVM learn linear threshold function. With
selection of a proper kernel function, they can learn polynomial classifiers, radial basic function
(RBF) networks, and 3 layer sigmoid neural networks. One vital characteristic of SVM is the
capacity to learn can be independent of the dimensions of the feature space. SVM calculates the
difficulty of hypotheses based on the margin with which they separate the data, not the number of
features. So we can say that even in the presence of different features, if data is separable with a
large margin using functions from the hypothesis space. The same margin also suggests a
heuristic for selecting good parameter settings for the learner. The same margin argument also
provides a heuristic for selecting better parameter settings for the learner as the kernel width in an
RBF network [15, 33, 36-38].
LibSVM in WEKA tool[34] simulation environment to illustrate Support Vector Machines [35].

International Journal of Data Mining & Knowledge Management Process (IJDKP) Vol.2, No.5, September 2012
30
2.7. Boosting
Adaboost: Adaboost is a popular ensemble boosting algorithm. Let us assume that we would like
to increase the accuracy of classification algorithm. From a dataset D, a data set of d class-
labeled samples, (X1, y1), (X2, y2),…, (Xd, yd), where yi is the class label of sample Xi. In its start
Adaboost put each training samples an equal weight of . Creating k classifiers for the
ensemble needs k cycles in the rest of the algorithm. In cycle i, the samples from D are sampled
to form a training set, Di, of size d. Sampling with replacement is used i.e. the same sample may
be considered more than once. Each sample’s of being selected is dependent on its weight. A
classifier model, Mi, is generated from the training samples of Di. Its error is computed using Di
as a test set. The weights of the training samples are modified as how they were identified with
class values. If a sample was correctly classified, its weight is adjusted to a large value. If a
sample was incorrectly classified, its weight is adjusted to a small value. A sample’s weight
shows how difficult it is to classify. We can say that higher the weight, the more often it has been
incorrectly classified. Such weights will be used to create the training samples for the classifier in
the next round. The basic concept is that when we make a classifier, focus should be more on the
misclassified tuples of the previous round. Finally we create a sequence of classifiers
complementing each other [39].
AdaboostM1 with LibSVM is used in WEKA [34] simulation environment to illustrate the
performance enhancement using boosting.
3. EXPERIMENTAL SETUP
3.1. Data Sets
There are four datasets used in this research work from real domain. All the datasets are available
in UCI machine learning repository [14].
Mushroom: It includes details of hypothetical samples related to 23 species of gilled mushrooms
in the Agaricus and Lepiota family. Every species is categories as edible or poisonous.
Vote: This data set includes votes for each of the U.S. House of Representatives Congressmen on
the 16 key votes identified by the CQA. The CQA includes nine different variety of votes: voted
for, paired for, and announced for , voted against, paired against, and announced against (these
three simplified to nay), voted present, voted present to avoid conflict of interest, and did not vote
or otherwise make a position known. Democrat and Republic are the two distinct class attribute
values.
Nursery: This data set was originally developed to rank applications for nursery schools. It was
exercised in the 1980’s when there was huge enrollment to the schools in Ljubljana,Slovenia, and
the rejected application frequently needed an detailed explanation. This data set is used to predict
whether application is rejected or accepted. The final decision depends on occupation of parents
and child’s nursery,family structure and financial standing, and social and health picture of the
family. The class attribute contains five values: not_recom, recommend, very_recom, priority and
spec_prior.
Credit: This data set concerns credit card application. Based on the survey on individuals at a
Japanese company that grants credit created the dataset. The class field represents positive and
negative instances of people who were and were not granted credit. The class attribute is
represented by +(Credit granted) and –(credit not granted). All field names and their values have
been modified to meaningless representations to maintain privacy of the data. The table for above
four data sets is shown below:
International Journal of Data Mining & Knowledge Management Process (IJDKP) Vol.2, No.5, September 2012
31
Table1. Composition of Data Sets
S.
No
Set Total
Size
Missing
Value
Effective
Size
Class Total Attributes
1. Mushroom 8124 2115 5609 2 23(Nominal valued)
2. Vote 435 204 231 2 1(Nominal)+16(Boolean
valued)
3. Nursery 12960 0 12960 5 9(Nominal valued)
4. Credit 690 39 651 2 1(Boolean)+
6(Continuous)+
9(Nominal)Valued
3.2. Parameters for Comparison
1. Predictive accuracy: It is defined as the percentage of correct prediction made by a
classification algorithm [2, 15, 25].
2. Error rate: It is defined as the percentage of wrong prediction made by a classification
algorithm [6, 17].
3. Training time: It is defined as the time that an algorithm takes to build a model on
datasets. Minimum training time is desirable [15, 17].
4. Classification index: It is a term that describes the degree of amount of information (in
bits) required to classify class attribute on datasets. Minimum classification is desirable
[15].
5. Comprehensibility: It shows degree of simplicity in rule sets obtained after classification.
Higher degree of comprehensibility is required. Greater the number of leaf nodes and
depth of tree, lesser will be the comprehensibility [11, 15-16].
3.3. Implementation
All the non evolutionary approach based algorithms excluding support vector machines and
adaboost have been applied to test data sets using Clementine 10.1[40] on a Pentium IV machine
with Window XP platform. SVM with and without boosting have been applied to test data sets
using WEKA [34] on the same machine. LibSVM and AdaboostM1 are used as SVM and
boosting. In case of LibSVM, kernel function is radial basis function and SVM type is C-SVM
while rest of the parameters remains default. AdaboostM1 is used as boosting method on
LibSVM classifier. Entropy evaluation measure based K & B information statistics measure is
used as classification index for LibSVM and AdaboostM1.Evolutionary approach based
algorithm have been applied to test data set using GALIB 245 simulator [41] on same machine
with Linux platform. All the data mining algorithms have been run 10 times with 10 fold cross
validation and average outcome is recorded.
4. RESULT
4.1. Predictive Accuracy
Table 2 and Figures (1-2) show the predictive accuracy on Mushroom, Vote, Nursery and Credit
data sets for different classification algorithms.

International Journal of Data Mining & Knowledge Management Process (IJDKP) Vol.2, No.5, September 2012
32
Table 2. Predictive accuracy on Mushroom, Vote, Nursery and Credit data sets.
Figure1. Predictive Accuracy on Mushroom and Vote data sets.
Figure1 describes the performance of classification algorithms on Mushroom and Vote data sets
in terms of predictive accuracy. SVM, Genetic algorithm, neural network and logistic regression
show good predictive accuracy. CHAID and C4.5 occupy the second position but the later shows
excellent performance on Vote data set. QUEST and k-means occupy the last position. The
former is on the better position in case of Vote data set. Predictive accuracy of SVM increases by
applying ABoostM1.
Figure 2 describes the performance of classification algorithms on Nursery and Credit data sets in
terms of predictive accuracy. k-means algorithm shows excellent performance on Nursery data
set. This might be due to the larger number of distinct values of class attribute. Genetic algorithm
shows the excellent performance on both of the data sets. Neural network and CHAID occupy the
third position.
Data Set Mushroom Vote Nursery Credit
Classifier
CHAID 98.36 % 99.69% 91.02 % 86.78%
QUEST 86.57% 99.39% 86.88% 86.57%
C4.5 96.0% 100% 94.3% 88.55%
Neural N/W 100% 92.21% 92.34% 86.68%
Logistic
Regression
99.9% 90.93% 69.0% 80.44%
k-means 85.29% 80% 100% 52%
Genetic
Algorithm 98% 94% 97.3% 96.2%
SVM 100% 96% 55% 86%
SVM-
ABoostM1 100% 97% 60% 95%

International Journal of Data Mining & Knowledge Management Process (IJDKP) Vol.2, No.5, September 2012
33
Figure2. Predictive Accuracy on Nursery and Credit data sets.
QUEST occupies the position ahead of k-means in case of Credit data set. The later occupies the
last position on Credit data set. SVM performs worst on Nursery data set. This may be due to
large number of plane formations required for classification as the large number of class attributes
distinct values. Again its performance is enhanced with ABoostM1. It shows accuracy of the
order of decision trees on Credit data set. Its performance increases with ABoostM1 and
approximately becomes equal to GA on the same data set.
4.2. Error Rate
Table 3 shows the error rate on Mushroom, Vote, Nursery and Credit data sets for all classifiers.
Table3. Error Rate on Mushroom, Vote, Nursery and Credit data sets.
Error rate table is self explanatory as it is equal to 100-predictive accuracy.
Data Set Mushroom Vote Nursery Credit
Classifier
CHAID 1.6 % 0.31% 8.98 % 13.22%
QUEST 13.13% 0.61% 13.12% 13.43%
C4.5 4.0% 0% 5.7% 11.45%
Neural N/W 0% 7.79% 7.66% 13.12%
Logistic
Regression
0.1% 9.07% 31% 19.56%
k-means 14.71% 20% 0% 48%
Genetic Algorithm 2% 6% 2.7% 3.8%
SVM 0% 4% 45% 14%
SVM-ABoostM1 0% 3% 40% 5%

International Journal of Data Mining & Knowledge Management Process (IJDKP) Vol.2, No.5, September 2012
34
4.3. Training Time
Table 4 and Figure 3 show the training time (in seconds) on Mushroom, Vote, Nursery and Credit
data sets.
Table 4. Training Time on Mushroom, Vote, Nursery and Credit datasets.
Data Set Mushroom Vote Nursery Credit
Classifier
CHAID 60 60 60 60
QUEST 60 60 60 60
C4.5 60 60 60 60
Neural N/W 240 60 60 120
Logistic
Regression
120 60 60 60
k-means 60 60 60 60
Genetic
Algorithm 180 60 120 180
SVM 32 2 300 2
SVM-
ABoostM1 300 20 350 42
Figure3. Training time on Mushroom, Vote, Nursery and Credit data set.
Figure 3 describes the training time on Mushroom, Vote, Nursery and Credit data sets. Genetic
algorithm and neural network are the slowest algorithms on Mushroom and Credit data sets. The
former continues the same performance on other data set also. Logistic regression shows the
second worst performance. SVM is fastest one among all the algorithms on all the data sets
except nursery. On this data set it is slowest among all algorithms due to large number of distinct
values of class attribute present. SVM-ABoostM1 always takes large time due to boosting process
behavior on all the data sets. Rests of the algorithms are fast on both the data sets.

International Journal of Data Mining & Knowledge Management Process (IJDKP) Vol.2, No.5, September 2012
35
4.4. Classification Index
Table 5 and figure (4-7) show the classification index on Mushroom, Vote, Nursery and Credit
data sets for all classification algorithms except genetic algorithm.
Table5. Classification Index on Mushroom, Vote, Nursery and Credit datasets.
classification algorithms except genetic algorithm. K & B information statistics measure is used
as an indicator of classification index for SVM and SVM-ABoostM1. This parameter is not
included in the graph but its value is used for comparison from the table directly.
Note: From figure (4-7), all symbols represent class attribute values of all the datasets.
e=edible, p=poisonous, d=democratic, r=republic, N_R=not recommended, P=priority,
S_P=special_priority,S_P=special priority, V_R=very recommended,+=credit granted, -=credit
not granted.
Data Set Mushroom Vote Nursery Credit
Classifier
CHAID e=0.481
p=0.955
d=0.635
r=0.681
N_R=1.095
P=0.964
S_P=1.046
V_R=3.148
+=0.563
-=0.541
QUEST e=0.476
p=0.954
d=0.502
r=0.752
N_R=1.094
P=0.862
S_P=0.985
V_R=
+=0.537
-=0.574
C4.5 e=0.474
p=0.974
d=0.631
r=0.706
N_R=1.098
P=1.032
S_P=1.067
V_R=3.407
+=0.647
-=0.503
Neural N/W e=0.481
p=0.962
d=0.494
r=0.733
N_R=1.089
P=1.032
S_P=1.04
V_R=2.997
+=0.594
-=0.515
Logistic
Regression
e=0.475
p=0.972
d=0.597
r=0.717
N_R=1.102
P=0.986
S_P=1.041
V_R=3.379
+=0.593
-=0.41
K-Mean Nil Nil NIL Nil
SVM 0.9 0.8 1.5 0.8
SVMAdaboost
M1
0.9 0.9 2 0.9

International Journal of Data Mining & Knowledge Management Process (IJDKP) Vol.2, No.5, September 2012
36
Figure4. Classification Index on Mushroom data set.
Figure5. Classification Index on Vote data set.
Figure (4-5) describes the classification index on Mushroom and Vote data sets for different
classifiers. In these figures, neural network shows the highest classification index. Logistic
regression is next to neural network. Decision tree based algorithms occupy the third position.
SVM and SVM-ABoostM1 classification index is of the order of decision trees.
Figure6. Classification Index on Nursery data set.
In figure 6, algorithms show the variable classification index due to large distinct value of
class attribute in nursery data set.

International Journal of Data Mining & Knowledge Management Process (IJDKP) Vol.2, No.5, September 2012
37
Figure7. Classification Index on Credit data set.
In figure 7, C4.5 shows the highest classification index. SVM and SVM-ABoostM1 classification
index is of the order of decision trees. Other algorithms show their classification index with little
differences.
4.5. Comprehensibility
Table 6 and figure (8-11) show the comprehensibility on Mushroom, Vote, Nursery and Credit
data sets for all algorithms.
Table6. Comprehensibility on Mushroom, Vote, Nursery and Credit datasets.
Data Set Mushroom Vote Nursery Credit
Classifier
Leaf
Node Depth
Leaf
Node Depth
Leaf
Node Depth
Leaf
Node Depth
CHAID 5 2 5 3 21 5 9 5
QUEST 4 3 3 2 15 4 2 1
C4.5 13 5 2 1 50 7 6 4
Neural N/W Nil Nil Nil Nil Nil Nil Nil Nil
Logistic
Regression
Nil Nil Nil Nil Nil Nil Nil Nil
k-means Nil Nil Nil Nil Nil Nil Nil Nil
Genetic
Algorithm 6 4 8 6 4 2 5 3
SVM Nil Nil Nil Nil Nil Nil Nil Nil
SVM-
ABoostM1
Nil Nil Nil Nil Nil Nil Nil Nil
Figure 8 given below describes the comprehensibility on Mushroom data set. Genetic algorithm
and QUEST show the highest comprehensibility due to lesser number of leaf nodes and
depth. k-means, logistic regression, neural network SVM and SVM-ABoostM1 show nil
comprehensibility.

International Journal of Data Mining & Knowledge Management Process (IJDKP) Vol.2, No.5, September 2012
38
Figure8. Comprehensibility on Mushroom data set.
Figure9. Comprehensibility on Vote data set.
In figure 9, QUEST shows highest comprehensibility. k-means, logistic regression, SVM, SVM-
ABoostM1 and neural network show nil comprehensibility. C4.5 and genetic algorithm show
almost same comprehensibility.
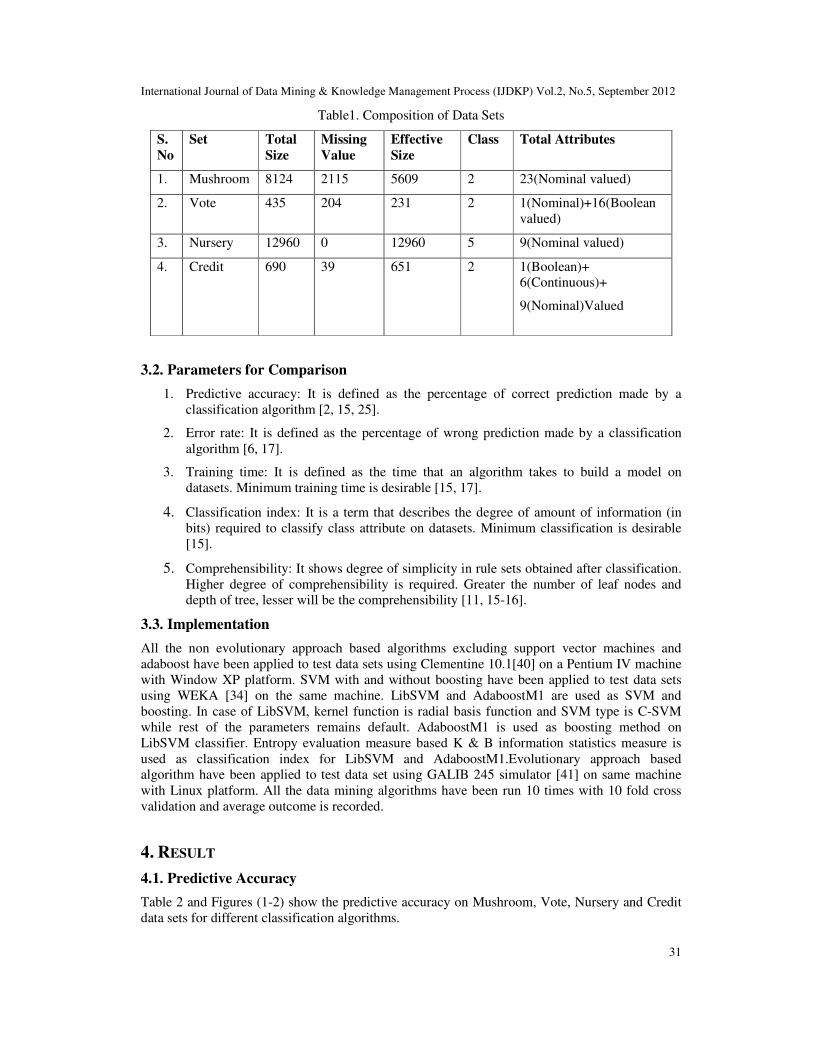
In figure 10 given below, QUEST and Genetic algorithm show the highest predictive accuracy.
k-means, logistic regression, neural network, SVM and SVM-ABoostM1 show nil
comprehensibility. C4.5 is on the second last position and CHAID is on the last one.
International Journal of Data Mining & Knowledge Management Process (IJDKP) Vol.2, No.5, September 2012
39
Figure10. Comprehensibility on Nursery data set.
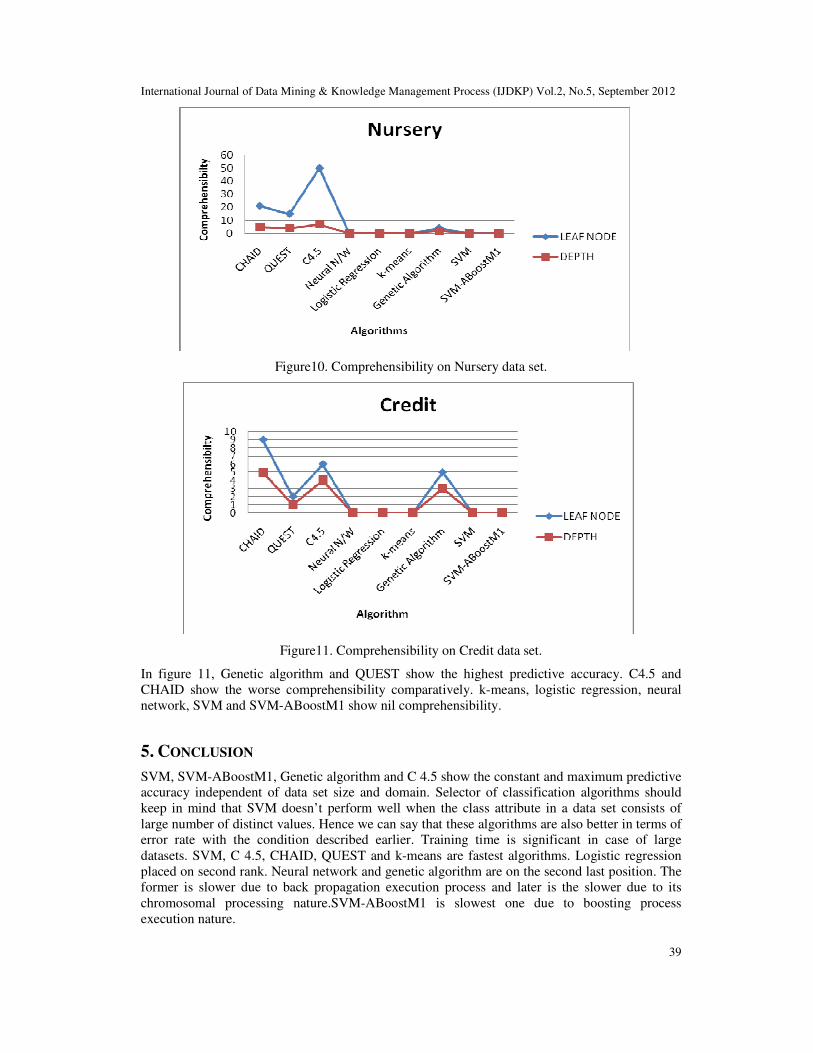
Figure11. Comprehensibility on Credit data set.
In figure 11, Genetic algorithm and QUEST show the highest predictive accuracy. C4.5 and
CHAID show the worse comprehensibility comparatively. k-means, logistic regression, neural
network, SVM and SVM-ABoostM1 show nil comprehensibility.
5. CONCLUSION
SVM, SVM-ABoostM1, Genetic algorithm and C 4.5 show the constant and maximum predictive
accuracy independent of data set size and domain. Selector of classification algorithms should
keep in mind that SVM doesn’t perform well when the class attribute in a data set consists of
large number of distinct values. Hence we can say that these algorithms are also better in terms of
error rate with the condition described earlier. Training time is significant in case of large
datasets. SVM, C 4.5, CHAID, QUEST and k-means are fastest algorithms. Logistic regression
placed on second rank. Neural network and genetic algorithm are on the second last position. The
former is slower due to back propagation execution process and later is the slower due to its
chromosomal processing nature.SVM-ABoostM1 is slowest one due to boosting process
execution nature.

International Journal of Data Mining & Knowledge Management Process (IJDKP) Vol.2, No.5, September 2012
40
Genetic algorithm is better in terms of comprehensibility as it is independent of data set size. K-
Mean, neural network learning and logistic regression have no comprehensibility. Decision Tree
(QUEST) is better in term of comprehensibility as like genetic algorithm, it is also independent of
dataset size. QUEST is better in terms of classification index. k-means, neural network, logistic
regression, SVM and SVMABoostM1 show nil comprehensibility.
Genetic algorithm is the first choice when predictive accuracy and comprehensibility are the
selection criterion and decision tree(C 5.0) is the first choice when training time is a selection
criterion. SVM is the first choice in terms of predictive accuracy and training time. Boosting for
all algorithms is suggested but time required is too much large.
Decision makers should make tradeoff between various parameters and conditions described in
this work to purchase data mining product for their decision support systems.
REFERENCES
[1] Efrain Turban,Jay E. Aronson and Ting-Peng Liang(2006), Decision Support Systems and Intelligent
Systems, Low Price Edition, Pearson education.
[2] U.M. Fayyad, G. P. Shapiro and P. Smyth(1996), The KDD process for extracting useful knowledge
from volumes from data. Communication of ACM, Vol. 39(11), pp 27 – 34.
[3] Dunja Mladenic, Nada Lavrac, Marko Bohanec and Steve Moyle (2003), Data Mining and Decision
Support-Integration and Collaboration, Kluwer Academic Publishers.
[4] Nada Lavrac, (2001), Data Mining and Decision Support: A note on the issues of their integration and
their relation to Expert Systems, Workshop on IDDM.
[5] Mladenic, D. and Lavrac,N.(eds.). Data mining and decision support for business competitiveness: A
European Virtual Enterprise. http://soleunet.ijs.si
[6] R. D. King, C. Feng, and A. Sutherland(1995), STATLOG-Comparison of classification algorithms
on large real-world problems, Applied Artificial Intelligence, Vol.9(3), pp 289-333.
[7] Breslow, L. A. & Aha, D. W (1997), Simplifying decision trees: A survey. Knowledge engineering
Review, Vol 12, pp 1–40.
[8] Brodley, C. E. & Utgoff, P. E. (1992), Multivariate versus univariate decision trees. Department of
Computer Science, University of Massachusetts, Amherst, MA. Technical Report 92-8.
[9] Brown, D. E., Corruble, V., & Pittard, C. L. (1993), A comparison of decision tree classifiers with
back propagation neural networks for multimodal classification problems, Pattern Recognition, Vol.
26,p. 953–961, 1993.
[10] Curram, S. P. & Mingers (1994), Neural networks, decision tree induction and discriminant analysis:
An empirical comparison, Journal of the Operational Research Society, Vol 45, pp 440–450.
[11] Shavlik, J. W., Mooney, R. J., & Towell G. G. (1991), Symbolic and neural learning algorithms: an
empirical comparison, Machine Learning,Vol 6, pp 111–144.
[12] Ana Gonzalez-Marcos, Fernando Alba-Elias, Manuel Castejon-Limas and Joaquin Ordieres- Mere
(2011), Development of neural network-based models to predict mechanical properties of hot dip
galvanized steel coils, International Journal of Data Mining, Modelling and Management, Vol. 3,
No.4 pp 389 – 405.
[13] S.M. Monzurur Rahman and Xinghuo Yu (2011) , An unsupervised neural network approach to
predictive data mining, Int. J. Data Mining, Modelling and Management, Vol. 3, No. 1,pp 18-41.
[14] UCI Repository of Machine Learning Databases, Department of Information and Computer Science,
University of California http://www.ics.uci.edu/~mlearn/MLRepositry.html
[15] Jiawei Han and Micheline Kamber (2001), Data Mining: Concepts and Techniques: Book
(Illustrated), Morgan Kaufmann Publishers.
[16] J.R. Quinlan (2003), Induction in decision trees, Journal of Machine Learning, Vol.1, Issue 1, pp 81 –
106.
[17] T.S. Lim, W.Y.Loh, Y.S.Shih (2000), A Comparison of Prediction Accuracy, Complexity, and
Training Time of Thirty-Three Old and New Classification Algorithms, Journal of Machine
Learning,Vol 40, pp 203–228.
[18] Kooperberg, C., Bose, S., & Stone, C. J.(1997), Polychotomous regression, Journal of the American
Statistical Association, Vol 92, pp 117–127.

International Journal of Data Mining & Knowledge Management Process (IJDKP) Vol.2, No.5, September 2012
41
[19] Maher Maalouf (2011), Logistic regression in data analysis: an overview, International Journal of
Data Analysis Techniques and Strategies, Vol. 3, No.3, pp 281 – 299.
[20] Lev V. Utkin (2010), Regression analysis using the imprecise Bayesian normal mode, International
Journal of Data Analysis Techniques and Strategies,Vol. 2, No.4 pp 356 – 372.
[21] Z.A. Al-Hemyari and I.H. Hussain (2012), Improved shrinkage testimators for the simple linear
regression model, International Journal of Information and Decision Sciences, Vol. 4, No.1 pp 87 –
103.
[22] Kalyanmoy Deb (1993), Genetic Algorithm in search and optimization: The techniques and
Applications, Proceeding of Advanced Study Institute on Computational Methods for Engineering
Analysis and Design, pp 12.1—12.25.
[23] Saroj (2002), Genetic Algorithm: A technique to search complex space, Proceedings of National
Seminar on Emerging Dimension in Information Technology, G.J.U S&T, Hisaar, pp 100-105.
[24] Alex A. Frietas (2003), A survey of evolutionary algorithms for data mining and knowledge
discovery, Springer-Verlag, New York, p. 819-845.
[25] Alex A. Frietas (2002), Data mining and knowledge discovery with evolutionary algorithms, Natural
Computing Series.
[26] Laura Nunez-Letamendia,Joaquin Pacheco and Silvia Casado (2011), Applying genetic algorithms to
Wall Street, International Journal of Data Mining, Modelling and Management,Vol. 3, No.4 pp 319
– 340.
[27] Roger J. Marshall (2006), Comparison of misclassification rates of search partition analysis and
other classification methods, Statistics in Medicine, pp 3787-3797.
[28] P Baladi, S Brunak, Y Chauvin, C.A Anderson, H Nielsen (2000), Assessing the accuracy of
prediction algorithms for classification: an overview, Biological Sciences, Volume: 16, Issue: 5, pp
412-424.
[29] Mohd Fauzi Bin Othman and Thomas Moh Shan Yau (2007), Comparison of Different Classification
Techniques using WEKA for Breast Cancer.3rd
Kuala Lumpur International Conference on
Biomedical Engineering, pp 520-523.
[30] Haung,Shuqing (2007), A Comparative Study of Clustering and Classification Algorithms Ph.D
Thesis, Tulane University School of Science and Engineering.
[31] Saroj and K.K Bhardwaj(2007), A parallel genetic algorithm approach for automated discovery of
censored production rules. AIAP’07 Proceedings of the 25th
conference on Proceedings of the 25th
IASTED International Multi-Conference: artificial intelligence and applications, pp 435-441.
[32] Bikash Kanti Sarkar, Shib Sankar Sana and Kripasindhu Chaudhuri (2010), Accuracy-based learning
classification system, International Journal of Information and Decision Sciences- Vol. 2, No.1
pp. 68 – 86.
[33] Vladimir N. Vapnik (1995), The nature of statistical learning theory,Springer-Verlag New York,
Inc. New York, NY, USA.
[34] www.cs.waikato.ac.nz/ml/weka/
[35] Chih-Chung Chang and Chih-Jen Lin (2011), LIBSVM: A Library for Support Vector
Machines,ACM Transaction on Intelligent System and Technology, Vol.2,No.3,Article 27.
[36] Devulapalli Karthik Chandra, Vadlamani Ravi and Pediredla Ravisankar (2010), Support vector
machine and wavelet neural network hybrid: application to bankruptcy prediction in banks,
International Journal of Data Mining, Modelling and Management,Vol. 2, No.1 pp 1 – 21.
[37] Yaquan Xu and Haibo Wang (2011), A new feature selection method based on support vector
machines for text categorization, Int. J. Data Analysis Techniques and Strategies, Vol. 3, No. 1,pp 1-
20.
[38] Kerry Poitier and Sohyung Cho(2011), Estimation of true efficient frontier of organizational
performance using data envelopment analysis and support vector machine learning, International
Journal of Information and Decision Sciences,Vol. 3, No.2 pp 148 – 172.
[39] Schapire, R & Singer, Y (1999), Improved boosting algorithms using confidence-rated prediction,
Machine Learning , 37(3), pp 297–336
[40] http:\\www.spss.com\products\clementine
[41] http:\\ lancet.mit.edu/ga.

International Journal of Data Mining & Knowledge Management Process (IJDKP) Vol.2, No.5, September 2012
42
AUTHORS
Pardeep Kumar received his M.Tech (CSE) degree from Guru Jambheshwar
University of Science & Technology, Hisar, Haryana, India. He received his
B.Tech (IT) degree from Kurukshetra University, Haryana, India. Presently he
is working as Senior Lecturer in department of CSE & IT at Jaypee University
of Information Technology, at, Solan (H.P), India. His areas of interest include
Machine Learning, Data Mining, Artificial Intelligence, Decision Support
Systems and fusion of Data Mining with Image Processing
Dr. Nitin received his Ph.D. (Computer Science & Engineering) degree from Jaypee
University of Information Technology, Waknaghat, Solan (H.P), India
Currently he is working as Associate Professor in the department of CSE & IT,
Jaypee University of Information Technology, Waknaghat, Solan (H.P), India.
He was Visiting Professor, University of Nebraska at Omaha, Omaha, USA
(August 2010 to November 2010). His areas of interest include Parallel, Grid
and Distributed Computing, Parallel Computing Algorithms, Super Computing
etc. Currently he is the active reviewer of various international journals of repute published by IEEE,
Springer, Elsevier and many more.
Dr Vivek Kumar Sehgal received his Ph.D. (Computer Science & Engineering)
degree from Uttarakhand Technical University, Dehradun, India. Currently he
is working as Assistant Professor in CSE & IT department at Jaypee University
of Information Technology, Waknaghat Solan (H.P), India. His areas of interest
are Embedded Processor Architecture, Hardware Software Co-design, Smart
Sensors and Systems-on-Chip and Networks-on-Chip, Machine learning etc.
Prof. Durg Singh Chauhan received his B.Sc Engg.(1972) in electrical engineering
at I.T. B.H.U., M.E. (1978) at R.E.C. Tiruchirapalli (Madras University ) and
Ph.D. (1986) at IIT/Delhi. He did his post doctoral work at Goddard space
Flight Centre, Greenbelf Maryland. USA (1988- 91).His brilliant career
brought him to teaching profession at Banaras Hindu University where he was
Lecturer, Reader and then has been Professor till today. He has been director
KNIT Sultanpur in 1999-2000 and founder vice Chancellor of U.P.Tech.
University (2000- 2003-2006). Later on, he has served as Vice-Chancellor of Lovely Profession
University (2006-07) and Jaypee University of Information Technology (2007-2009). Currently he
has been serving as Vice- Chancellor of Uttarakhand Technical University for (2009-12) Tenure.