environmentclearance.nic.inenvironmentclearance.nic.in › ... › online › eds › 0_0_16... ·...
TRANSCRIPT

Date: 15th April, 2020
To, The Director & Member Secretary (Industry-1) Ministry of Environment, Forest & Climate Change, Govt. of India, Indira Paryavaran Bhawan, Ali Ganj, Jor Bagh Road, New Delhi – 110 003 Subject: Reply to A.D.S. for getting Environmental Clearance of Proposed Expansion of
the Steel Plant by installation of Pellet Plant with Grinding Facility (2x0.85 MTPA), Sponge Iron Plant (1x350 TPD Kiln), Induction Furnaces (3x25T), Capacity revision from 600 TPD to 1000 TPD of Rolling Mill along with 7 MW capacity Captive Power Plant (WHRB based, utilizing waste heat from the proposed sponge plant) and Producer Gas Plant (12x4000 Nm3/hr) at Village Mahuda, P.O. Rukni, P.S. Para, District Purulia in West Bengal by M/s Bravo Sponge Iron Pvt. Ltd.
Refer : File No. J-11011/758/2009 - IA.II (I)
Sir, This has reference to the 14th meetings of Reconstituted Expert Appraisal Committee (Industry-1)
of Ministry of Environment, Forest and Climate Change (MoEF&CC), Govt. of India dated 23rd
December 2019. In the said meeting, the honorable committee raised some additional queries for
further consideration of our proposal for the appraisal to grant Environmental Clearance.
We are giving under our reply against the respective queries, as raised by the Honorable
committee members.
Point 1: Closure report from Regional Office on the observed non-compliances regarding Effluent Treatment Plant, concreting of internal roads, green belt development and noise quality monitoring shall be furnished. Reply: Enclosed as Annexure-I. Point 2: Fresh assessment of surface water quality for all the parameters shall be carried out
and report submitted.
Reply: Enclosed as Annexure-II. Point 3: Hazard Identification and Risk Assessment (HIRA) report specific to the project activity shall be prepared and submitted. Reply: Enclosed as Annexure-III. Point 4: Traffic assessment study report shall be carried out and submitted.
Reply: Enclosed as Annexure-IV. Point 5: Existing road conditions to be used for transportation of raw materials and finished products inter-alia including its dimensions along with photographs shall be submitted. Reply: Enclosed as Annexure-V.
Contd…

Point 6: Quantity of raw materials and products to be transported by different modes such as road and rail respectively shall be furnished. Reply: Enclosed as Annexure-VI. Point 7: Line source modelling shall be carried out based on the quantity of raw materials and products to be transported different modes such as road and rail respectively and report shall be furnished. Reply: Enclosed as Annexure-VII. Point 8: Reasons for higher level of presence of Particulate matter in the Ambient Air and NOx in the source shall be furnished. Reply: Enclosed as Annexure-VIII. Point 9: Corporate Environmental Policy envisaging sharing of responsibility in case of accident/failures shall be furnished. Reply: Enclosed as Annexure-IX.
Point 10: Time bound action plan for green belt development covering 33% of the plant with a tree density of 2500/ha shall be prepared and submitted. Reply: Enclosed as Annexure-X. Point 11: Details of the producer gas plant along with the pollution control systems envisaged shall be furnished. Reply: Enclosed as Annexure-XI. We hope this will serve your purpose.
We hereby request you to take the necessary action so that an early Environmental Clearance
could be issued for our proposed expansion project.
Thanking you,
Yours faithfully,
for Bravo Sponge Iron Pvt. Ltd.
Deepak Kumar Agarwal
Director Enclosure:
Minutes of Meeting of 14th EAC Meeting dated 23rd December, 2019 Eleven Annexures.

Minutes of Meeting of 14th Meeting of the
Re-constituted EAC (Industry-I)
dated 23rd December 2019
for M/s Bravo Sponge Iron Pvt. Ltd.

MoM of 14th meeting of the Re-constituted EAC (Industry-I) held during 23-24th December, 2019
Page 22 of 61
Observations of the Committee
14.4.24 The Committee noted that there are several deficiencies in the EIA report inter-alia
including the following:
i. Details sought in Form-2 have not been adequately addressed.
ii. Action plan for the green belt development plan has not been furnished.
iii. Compliance to the ToR conditions is not specific.
iv. Overburden management due to the lime stone mining activity has not been
addressed in the report.
v. Corporate Environmental Policy does not elaborate the sharing of responsibility
in case of accident/failures.
vi. Bio-diversity conservation plan has not been submitted.
vii. Scientific assessment of issues related to sea water ingress has not been
adequately addressed with proper supporting documentation.
viii. Commitment to the issues raised during public consultation along with action
plan for implementation with budget has not been furnished.
ix. Status of CRZ clearance for the captive jetty has not been furnished.
x. Status of Forest land diversion has not been furnished.
xi. Cost earmarked towards CER is not as per the slabs stated in the Ministry’s
O.M. dated 1/05/2018.
xii. Lay out drawing is not specific and not to the scale.
14.4.25 In addition to the above, the Committee members expressed that they have not
received the copies of the EIA report on time for perusal. Further, it was opined that
the project proponent has not uploaded the entire EIA report on PARIVESH.
Recommendations of the Committee
14.4.26 In view of the foregoing and after detailed deliberations, the committee recommended
to return the proposal in present form.
14.5 Proposed Expansion of the Steel Plant by installation of Pellet Plant with Grinding
Facility (2x0.85 MTPA), Sponge Iron Plant (1x350 TPD Kiln), Induction Furnaces
(3x25T), Capacity revision from 600 TPD to 1000 TPD of Rolling Mill along with 7
MW capacity Captive Power Plant (WHRB based, utilizing waste heat from the
proposed sponge plant) and Producer Gas Plant (12x4000 Nm3/hr) by M/s. Bravo
Sponge Iron Pvt. Ltd., located at Village Mahuda, P.O. Rukni, P.S. Para, District
Purulia, West Bengal. -[Online Proposal No. IA/WB/IND/125425/2015; File No. J-
11011/758/2009-IAII(I)] – Environment Clearance – regarding.
14.5.1 M/s. Bravo Sponge Iron Pvt. Ltd has made online application vide proposal no.
IA/WB/IND/125425/2015 dated 7/12/2019 along with copy of EIA/EMP report and

MoM of 14th meeting of the Re-constituted EAC (Industry-I) held during 23-24th December, 2019
Page 23 of 61
Form – 2 seeking Environmental Clearance (EC) under the provisions of the EIA
Notification, 2006 for the project mentioned above. The proposed project activity is
listed at Sl. No. 3(a) Metallurgical Industries (Ferrous and Non-ferrous) under Category
“A” EIA Notification, 2006 and the project is appraised at the Central level.
Details submitted by the project proponent
14.5.2 The proposed expansion of Steel Plant for ultimate production of 1.7 MTPA Pellets,
745 TPD Sponge Iron, 1350 TPD Billets, 1000 TPD Rolled products, 25 MW Captive
Power Plant (15 MW WHRB + 10 MW AFBC) &48,000 Nm3/hr producer gas is
located at Village Mahuda, P.O. Rukni, P.S: Para, District: Purulia in West Bengal by
M/s Bravo Sponge Iron Pvt. Limited. Application was made on the MoEF&CC portal
on 16/11/2018 for obtaining Terms of Reference (ToR) as per EIA Notification, 2006.
The proposal was considered in the second meeting of the Re-constituted Expert
Appraisal Committee (EAC), Industry-1 held during 10-12th December, 2018 to
determine the Terms of Reference (TOR) for undertaking detailed EIA study for
obtaining Environmental Clearance in accordance with the provisions of the EIA
Notification 2006. Terms of Reference (ToR) was received vide letter No. J-
11011/758/2009-IA. II(I) dated 18/12/2018. Public Hearing was conducted on
22/07/2019.
14.5.3 Based on the ToRs prescribed to the project, the project proponent submitted an
application for environmental clearance to the Ministry online on 7/12/2019 vide online
proposal No. IA/WB/IND/125425/2015.
14.5.4 The project of M/s Bravo Sponge Iron Pvt. Ltd. is located in Village Mahuda, P.O.
Rukni, P.S: Para, District: Purulia, West Bengal State is for expansion of Steel Plant for
ultimate production of 1.7 MTPA Pellets, 745 TPD Sponge Iron, 1350 TPD Billets,
1000 TPD Rolled products, 25 MW Captive Power Plant (15 MW WHRB + 10 MW
AFBC) &48,000 Nm3/hr producer gas.
14.5.5 The existing and proposed capacity for different units and products is as below:
S.N
o Unit
Units
as per
State
Clear
ance
Units as
per
MoEF&C
C EC
dated
18.04.17
Total
Units
under
operation
Balance units
Proposed
expansion
Final
config
uratio
n
Under
impleme
ntation
To be
impleme
nted
1
Pellet
Plant
with
Grindi
ng
Facilit
y
- - - - - -
2 X
0.85
MTPA
1.7
MTPA
2
Spong
e Iron
Plant
1X100
TPD
(as per
NOC
dated
5.12.2
002) +
1x95
TPD
(as per
State
2X100
TPD
1X100
TPD +
1x95
TPD +
2X100
TPD
1X100
TPD +
1x95
TPD +
2X100
TPD
- - 1 X 350
TPD
745
TPD
(1X100
TPD +
1x95
TPD +
2X100
TPD +
1X350
TPD)

MoM of 14th meeting of the Re-constituted EAC (Industry-I) held during 23-24th December, 2019
Page 24 of 61
S.N
o Unit
Units
as per
State
Clear
ance
Units as
per
MoEF&C
C EC
dated
18.04.17
Total
Units
under
operation
Balance units
Proposed
expansion
Final
config
uratio
n
Under
impleme
ntation
To be
impleme
nted
EC
dated
24.03.
2008)
3
SMS
(Induc
tion
Furnac
e with
CCM)
-
600 TPD
(4 x 15
T)
600
TPD
(4 x 15
T)
300
TPD
(2 x 15
T)
150 TPD
(1 x 15
T)
150 TPD
(1 X
15T)
750
TPD
(3 x
25T)
1350
TPD
(4 x 15
T +
3 x
25T)
4 Rollin
g Mill - 600 TPD
600
TPD - -
600
TPD*
Capaci
ty
revisio
n from
approv
ed 600
TPD*
to 1000
TPD
1000
TPD
5
Captiv
e
Power
Plant
-
18 MW
(8 MW
WHRB
+ 10
MW
AFBC)
18 MW
(8 MW
WHRB
+ 10
MW
AFBC)
10 MW
(4x10
TPH
WHRB
+ 1X20
TPH
AFBC*
)
-
8 MW
(1X20
TPH
Proposed
AFBC +
*Balance
12 TPH
Steam
from
existing
AFBC)
7 MW
WHRB
25 MW
(15
MW
WHRB
+ 10
MW
AFBC)
6
Produc
er Gas
Plant - - - - - -
12 x
4000
Nm3/hr
48,000
Nm3/hr
14.5.6 The Status of compliance of existing EC was obtained from Regional Office
Bhubaneshwar vide File No. 102-577/16/EPE/2389 dated 28/10/2019 wherein several
non-compliances have been reported. Subsequently, PP has submitted Action Taken
Report to the Regional Office on 20/11/2019 which have been examined and the report
was furnished on 5/12/2019. As per the report, following non-compliances have been
reported.
i. Project proponent is yet to install the Effluent Treatment Plant and zero
liquid discharge is not maintained.
ii. Concreting of internal roads within the plant site is yet to be completed.
iii. Green belt development all along the plant boundary covering 33% of the
plant area is not satisfactory.
iv. Noise monitoring report is not being submitted along with the six-monthly
compliance report.

MoM of 14th meeting of the Re-constituted EAC (Industry-I) held during 23-24th December, 2019
Page 25 of 61
14.5.7 The proposed project will be installed on the available land of total 78.37 acres (31.73
hectares) within the existing plant premises. Land is already in possession of the
Company. The river Damodar passes at a distance of 9 km towards North, from the
project site. Modification / diversion in the existing natural drainage pattern at any stage
has not been proposed.
14.5.8 The topography of the area is flat and reported to lie between Latitude - 23°32’48.67"N
to 23°33’9.42"N and Longitude - 86°32’32.55"E to 86°32’59.22"E and at an elevation
of 190 m AMSL.
14.5.9 No national park / wildlife sanctuary / biosphere reserve/tiger reserve / elephant reserve,
etc. is reported to be located in the core and buffer zones of the project. The area also
does not report to form corridor for Schedule-I fauna.
14.5.10 The raw material requirement for the existing and the proposed expansion are
furnished as below:
Raw
Material
Existing Units +
Units under
Implementation
Proposed
Plant
Total Mode of
Transpor
t
Source
Sponge Iron Plant:
Pellet 223680 198198 421879 Internal
Coal 140778 124740 265518 Rail /
Road Imported /
West Bengal
& through e-
auction
Dolomite 76646 67914 144560 Rail /
Road
SMS (IF route) :
Pig Iron 37915 47394 85309 Rail /
Road
Sponge Iron 173250 216563 389813 Internal /
Road
Ferro Alloys 387 484 872 Road
Scrap 25011 31263 56274 Internal /
Road
Rolling Mill :
Billets 207900 138600 346500 Internal
Power Plant-AFBC :
Coal 44355 44355 Rail West Bengal
& through e-
auction
Dolochar 53104 53104 Internal
Pellet Plant :
Iron Ore
Fines
- 1793400 1793400 Rail Orissa/Jhark
hand
Bentonite - 11956 11956 Rail /
Road Kutch,
Gujarat
Limestone - 17080 17080 Rail /
Road Birmitrapur,
Orissa
Coal - 68320 68320 Rail /
Road West Bengal
& through e-
auction.
Producer Gas Plant :
Coal - 118800 118800 Rail / West Bengal

MoM of 14th meeting of the Re-constituted EAC (Industry-I) held during 23-24th December, 2019
Page 26 of 61
Raw
Material
Existing Units +
Units under
Implementation
Proposed
Plant
Total Mode of
Transpor
t
Source
Road & through e-
auction.
14.5.11 The targeted production capacity of the Steel Plant after expansion is 1.7 MTPA
Pellets, 745 TPD Sponge Iron, 1350 TPD Billets, 1000 TPD Rolled products, 25 MW
Captive Power Plant (15 MW WHRB + 10 MW AFBC) & 48,000 Nm3/hr producer
gas. The major raw materials, which will be handled, consist of Iron Ore, Coal,
Dolomite, Limestone, Ferro Alloys, Scrap, etc. The raw materials will be purchased
from mines located in Orissa, West Bengal, Jharkhand, Gujarat (depending upon
availability). Coal will be imported. Raw materials will be received though railways
/ roadways.
14.5.12 The daily make up water requirement for the entire project is estimated as 2284
m3/day (Existing Units: 400 m3/day, Units under implementation / to be implemented:
277 m3/day, Proposed Units: 1607 m3/day). The raw water will be sourced from DVC
supply and project proponent has already made an agreement with Damodar Valley
Corporation on 11/04/2018.
14.5.13 The power requirement of the project is estimated as 67.5 MW (Existing: 12.5 MW
+ Unit under implementation / to be implemented: 11.3 MW + Proposed: 43.7 MW),
which will be sourced from existing and proposed 25 MW capacity Captive Power
Plant and the remaining power will be obtained from DVC.
14.5.14 Baseline Environmental Studies were conducted during post-monsoon season, i.e.
from 1st Oct, 2018 to 31stDec, 2018. Ambient air quality monitoring has been carried
out at 8 locations and the data submitted indicated: PM10 (50g/m3 to 95 g/m3),
PM2.5 (18g/m3 to 45g/m3), SO2 (4g/m3 to 18 g/m3) and NOx (10 g/m3 to 38
μg/m3). The results of the modeling study indicate that the maximum increase of GLC
for the proposed & existing units is 5.808μg/m3 (ESE direction), 5.808 µg/m3 (ESE
direction) and 6.061 µg/m3(ENE direction), with respect to the SO2, NOx and PM
respectively.
14.5.15 Ground water quality has been monitored at 9 locations in the study area and
analyzed. pH: 6.7 to 7.4, Total Hardness: 108 to 176 mg/l, Chloride: 68 to 140 mg/l,
Sulphate: 22 to 52 mg/l, Nitrate: 3.6 to 12.5 mg/l . Heavy metals are within the limits.
14.5.16 Surface water samples were analysed from 10 locations – 1 Damodarriver water
sample, 1 canal water and 8 pond water samples. For flowing water body, pH: 6.8
and 6.9; DO: 6.8 mg/l and 7.1 mg/l and BOD: 3 and 5 mg/l. For 8 pond water samples,
pH: 6.4 to 7.4; DO: 5.7 to 6.3 mg/l and BOD: 4 and 8 mg/l.
14.5.17 Noise levels are in the range of 55.7 - 69.9 dBA for day time and 45.2 – 55.1dBA for
night time.
14.5.18 The solid waste generation and its utilization details are furnished as below:
Sl.
No.
Type Quantity in
Tons/Year
Utilization
1. Dolochar from 1x350 TPD DRI
Kiln
25,000 To be used in FBC Boiler.
2. Slag & Dust from IFs 33,500 Slag to be used for Land
filling / Road Construction
purpose.
MoM of 14th meeting of the Re-constituted EAC (Industry-I) held during 23-24th December, 2019
Page 27 of 61
Sl.
No.
Type Quantity in
Tons/Year
Utilization
3. End Cuts, Scale & Scrap from
CCM
5,000 To be used as raw materials in
IFs.
4. End cuts and missed rolls from
Rolling Mill
16,500 To be used as raw materials in
IFs.
5. Tar generated from Producer
Gas Plant
3,564 To be disposed as per
MoEF&CC Guideline.
14.5.19 The Public hearing for the project was held on 22/07/2019 at Para Community Hall,
Para Block, District Purulia in West Bengal under the chairmanship of Shri. Mufti
Samim Sawkat, Additional District Magistrate (Gen.), Purulia. The issues raised
during the public consultation are skill development to the unemployed youth, safety
measures for labors, CSR programme for women, pollution control measures and
utilization of ground water which have been addressed in the EIA report.
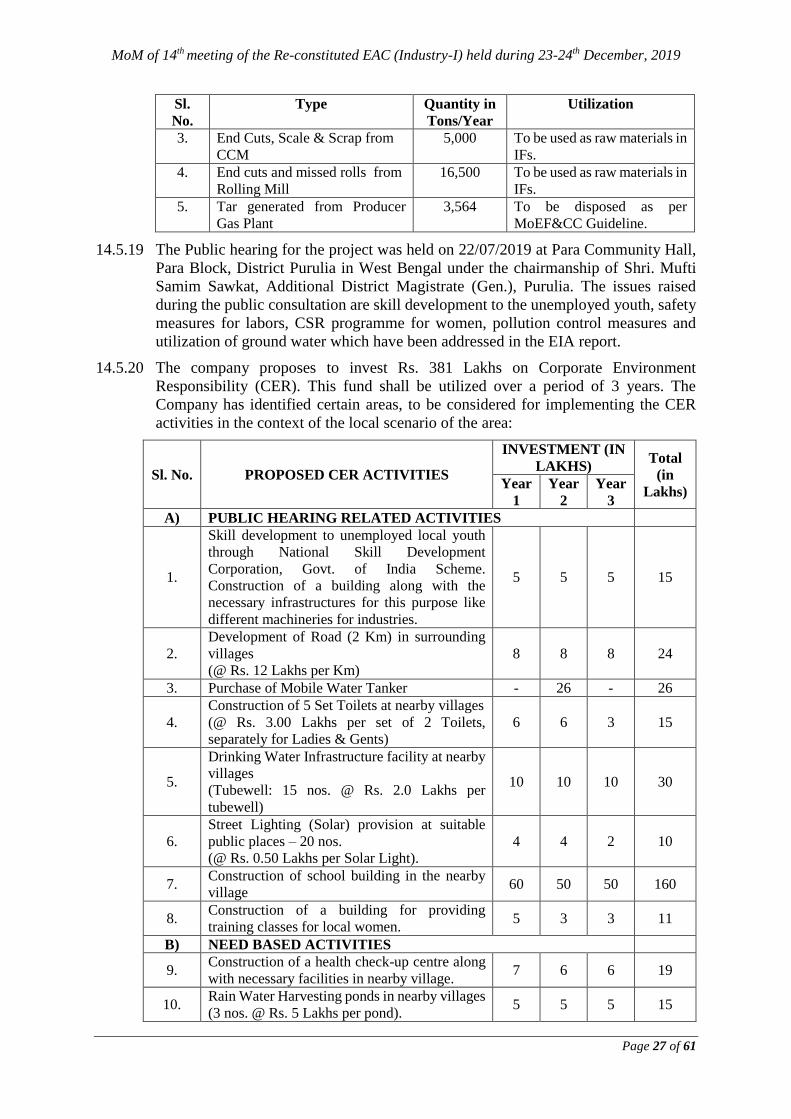
14.5.20 The company proposes to invest Rs. 381 Lakhs on Corporate Environment
Responsibility (CER). This fund shall be utilized over a period of 3 years. The
Company has identified certain areas, to be considered for implementing the CER
activities in the context of the local scenario of the area:
Sl. No. PROPOSED CER ACTIVITIES
INVESTMENT (IN
LAKHS) Total
(in
Lakhs) Year
1
Year
2
Year
3
A) PUBLIC HEARING RELATED ACTIVITIES
1.
Skill development to unemployed local youth
through National Skill Development
Corporation, Govt. of India Scheme.
Construction of a building along with the
necessary infrastructures for this purpose like
different machineries for industries.
5 5 5 15
2.
Development of Road (2 Km) in surrounding
villages
(@ Rs. 12 Lakhs per Km)
8 8 8 24
3. Purchase of Mobile Water Tanker - 26 - 26
4.
Construction of 5 Set Toilets at nearby villages
(@ Rs. 3.00 Lakhs per set of 2 Toilets,
separately for Ladies & Gents)
6 6 3 15
5.
Drinking Water Infrastructure facility at nearby
villages
(Tubewell: 15 nos. @ Rs. 2.0 Lakhs per
tubewell)
10 10 10 30
6.
Street Lighting (Solar) provision at suitable
public places – 20 nos.
(@ Rs. 0.50 Lakhs per Solar Light).
4 4 2 10
7. Construction of school building in the nearby
village 60 50 50 160
8. Construction of a building for providing
training classes for local women. 5 3 3 11
B) NEED BASED ACTIVITIES
9. Construction of a health check-up centre along
with necessary facilities in nearby village. 7 6 6 19
10. Rain Water Harvesting ponds in nearby villages
(3 nos. @ Rs. 5 Lakhs per pond). 5 5 5 15

MoM of 14th meeting of the Re-constituted EAC (Industry-I) held during 23-24th December, 2019
Page 28 of 61
Sl. No. PROPOSED CER ACTIVITIES
INVESTMENT (IN
LAKHS) Total
(in
Lakhs) Year
1
Year
2
Year
3
11.
Construction of 14 nos. of ground water
Recharging system for rainwater in nearby
villages (@2.5 lakhs per system)
15 10 10 35
12. Development of parks, plantation of trees in the
nearby areas. 5 4 4 13
13. Development of Community Hall 4 2 2 8
Sub-Total 134 139 108 381
GRAND TOTAL
14.5.21 The capital cost of the project is Rs 475.0 Crores and the capital cost for
environmental protection measures is proposed as Rs 27.0 Crores. The annual
recurring cost towards the environmental protection measures is proposed as Rs 2.70
Crores. Additional 1000 persons apart from the existing 670 persons (total 1670
persons) will get employment during operational phase. The details of capital cost for
environmental protection measures and annual recurring cost towards the
environmental protection measures is as follows:
Item Cost
(in Crores)
Cost
(in Crores)
Cost of Air Pollution Control Systems 17.00 1.70
Cost of Water conservation & Pollution Control 2.00 0.20
Cost of Solid Waste Management System 0.50 0.05
Green belt development 1.50 0.15
Noise Reduction Systems 0.50 0.05
Occupational Health Management 0.50 0.05
Risk Mitigation & Safety Plan 2.50 0.25
Environmental Management Department 2.50 0.25
GRAND TOTAL 27.00 2.70
14.5.22 Greenbelt will be developed in 10.47 Ha which is about 33% of the total plant area.
Local and native species will be planted with a density of 1500 trees per hectare. Total
no. of 15,700 saplings will be planted and nurtured in 10.47 Hectares.
14.5.23 There is no court case or violation under EIA Notification to the project or related
activity.
14.5.24 Name of the Consultant: M/s. Envirotech East Pvt. Ltd. (Sl. No. 55 in the List of
Accredited Consultant Organizations (Alphabetically) Rev. 82, Dec. 05, 2019).
Observations of the Committee
14.5.25 The Committee noted the following deficiencies in the EIA report submitted to the
Ministry.
i. Closure report from Regional Office on the observed non-compliances have not
been furnished.
ii. High level of Particulate matter in the Ambient Air has been reported and NOx
in the source and the reasons for such high level reporting has not been
mentioned.

MoM of 14th meeting of the Re-constituted EAC (Industry-I) held during 23-24th December, 2019
Page 29 of 61
iii. COD parameter in the surface water sample has not been monitored. Hence,
fresh assessment of surface water quality for all the parameters is required.
iv. Hazard Identification and Risk Assessment (HIRA) report submitted is not
satisfactory. Rules and Regulations pertaining to the HIRA has been wrongly
mentioned in the report.
v. Traffic assessment study has not been carried out.
Recommendations of the Committee
14.5.26 In view of the foregoing and after detailed deliberations, the committee deferred the
consideration of the proposal cited above and sought following additional information
for further consideration of the proposal:
i. Closure report from Regional Office on the observed non-compliances
regarding Effluent Treatment Plant, concreting of internal roads, green belt
development and noise quality monitoring shall be furnished.
ii. Fresh assessment of surface water quality for all the parameters shall be carried
out and report submitted.
iii. Hazard Identification and Risk Assessment (HIRA) report specific to the project
activity shall be prepared and submitted.
iv. Traffic assessment study report shall be carried out and submitted.
v. Existing road conditions to be used for transportation of raw materials and
finished products inter-alia including its dimensions along with photographs
shall be submitted.
vi. Quantity of raw materials and products to be transported by different modes
such as road and rail respectively shall be furnished.
vii. Line source modelling shall be carried out based on the quantity of raw materials
and products to be transported different modes such as road and rail respectively
and report shall be furnished.
viii. Reasons for higher level of presence of Particulate matter in the Ambient Air
and NOx in the source shall be furnished.
ix. Corporate Environmental Policy envisaging sharing of responsibility in case of
accident/failures shall be furnished.
x. Time bound action plan for green belt development covering 33% of the plant
with a tree density of 2500/ha shall be prepared and submitted.
xi. Details of the producer gas plant along with the pollution control systems
envisaged shall be furnished.
14.6 Cement Plant of M/s Reliance Cement Company Pvt. Ltd. (RCCPL) located at
Village Mukutban&Adegoan, Taluka Zari Zamni, District Yavatmal, Maharashtra
[Online Proposal No. IA/MH/IND/113541/2019; MoEF&CC File No. J-
11011/145/2009-IAII(I)] – Validity Extension of Environment Clearance-reg.
14.6.1 M/s Reliance Cement Company Pvt. Ltd, has made online application vide proposal
no. IA/MH/IND/113541/2019 dated 4th December 2019 along with prescribed Form-

All Eleven (11) Annexures

ADS POINT - I
Closure report from Regional Office on the observed non-compliances regarding Effluent Treatment Plant, concreting of internal roads,
green belt development and noise quality monitoring shall be furnished.
ANNEXURE-I
P a g e - 1
During 14th EAC meeting dated 23.12.2019, the Honorable Committee observed
that following four points are “in being complied status” and asked for the
complete closure.
Abstract of MoM of 14th meeting of the Re-constituted EAC (Industry-
I) held during 23-24th December, 2019 for agenda no 14.4.24 for
“ADS point no i” is presented herewith
Subsequently, “ADS point no i” was raised to submit the complete closure
report for the following four points from Eastern regional office, Bhubaneshwar
1. Effluent Treatment Plant (ETP),
2. Concreting of internal roads,
3. Green Belt Development and
4. Noise Quality Monitoring
In submission to above ADS, Closure Report (File no 102-577/16/EPE/428
dtd. 26.02.2020) from Eastern Regional Office (RO), Bhubaneswar, Ministry
of Environment, Forest and Climate Change (MoEF&CC) is enclosed
herewith as Appendix 1.1
Highlights of the Closure Report (File no 102-577/16/EPE/428 dtd.
26.02.2020 are enclosed as Appendix 1.2
Eastern Regional office (RO), Bhubaneswar visits in Chronological order
for compliance of EC conditions (F.No J-11011/758/2009-IA.II(I) dated
18.04.2017) are enclosed as Appendix 1.3

ADS POINT - I
Closure report from Regional Office on the observed non-compliances regarding Effluent Treatment Plant, concreting of internal roads,
green belt development and noise quality monitoring shall be furnished.
ANNEXURE-I
P a g e - 2
Appendix 1.1 Closure Report (File no 102-577/16/EPE/427 dtd. 26.02.2020) from Eastern
Regional Office (RO), Bhubaneswar, Ministry of Environment, Forest and
Climate Change (MoEF&CC )

ADS POINT - I
Closure report from Regional Office on the observed non-compliances regarding Effluent Treatment Plant, concreting of internal roads,
green belt development and noise quality monitoring shall be furnished.
ANNEXURE-I
P a g e - 3

ADS POINT - I
Closure report from Regional Office on the observed non-compliances regarding Effluent Treatment Plant, concreting of internal roads,
green belt development and noise quality monitoring shall be furnished.
ANNEXURE-I
P a g e - 4

ADS POINT - I
Closure report from Regional Office on the observed non-compliances regarding Effluent Treatment Plant, concreting of internal roads,
green belt development and noise quality monitoring shall be furnished.
ANNEXURE-I
P a g e - 5

ADS POINT - I
Closure report from Regional Office on the observed non-compliances regarding Effluent Treatment Plant, concreting of internal roads,
green belt development and noise quality monitoring shall be furnished.
ANNEXURE-I
P a g e - 6

ADS POINT - I
Closure report from Regional Office on the observed non-compliances regarding Effluent Treatment Plant, concreting of internal roads,
green belt development and noise quality monitoring shall be furnished.
ANNEXURE-I
P a g e - 7
Appendix 1.2 Highlights of the Closure Report (File no 102-577/16/EPE/427 dtd. 26.02.2020
1. Effluent Treatment Plant (ETP),
An ETP of 60 KLD capacity has been installed to treat the effluent
generated from the existing plant. Please refer Figure no 1.1 (Water
Balance diagram for Existing project), The Effluent generation from the
existing plant is around 70 KLD, out of which around 50 KLD are used for
Slag quenching, Dust suppression, Ash handling etc. Balance 20 KLD is
treated in ETP and treated effluent is being used for Green Belt
Development.
Figure no 1.1 (Water Balance diagram for Existing project)
Please refer Figure no 1.2 (Water Balance diagram for Overall Project after
expansion). After implementation of the proposed expansion project, the
maximum effluent (200KLD) shall be used in the proposed pellet plant and
the balance i.e., only 37 KLD shall be used in dust suppression and Ash
handling purposes.

ADS POINT - I
Closure report from Regional Office on the observed non-compliances regarding Effluent Treatment Plant, concreting of internal roads,
green belt development and noise quality monitoring shall be furnished.
ANNEXURE-I
P a g e - 8
Figure no 1.2 (Water Balance diagram for Overall Project after expansion).
2. Concreting of internal roads
M/s Bravo Sponge Iron Pvt. Ltd has completed the concreting of all
internal roads (around 1650 meters), which are being used for material
handling along with work area platform, where movement of heavy
vehicles movement exercised.
3. Green Belt Development.
As per closure report of RO, Bhubaneswar, MoEF&CC, the green belt was
developed on 12 acres (90.25%) out of the required 13.30 acres as on 15.02.2020.
Subsequently, the Balance 1.30 acres (9.75%) land was also developed to
comply with total requirement (i.e., 33% of total existing plant area of 40.29 Acres). Photographs of the same are also presented below.
Further, it is relevant to mention that as per specific condition (xv) of the Ministry’s EC No. J-11011175812O09-IA.II (I) dated 18.04.2017, the plantation should be completed in three years.
Hence, this has been well complied.

ADS POINT - I
Closure report from Regional Office on the observed non-compliances regarding Effluent Treatment Plant, concreting of internal roads,
green belt development and noise quality monitoring shall be furnished.
ANNEXURE-I
P a g e - 9
Photographs for remaining 9.75% area

ADS POINT - I
Closure report from Regional Office on the observed non-compliances regarding Effluent Treatment Plant, concreting of internal roads,
green belt development and noise quality monitoring shall be furnished.
ANNEXURE-I
P a g e - 10
Noise Quality Monitoring
M/s Bravo Sponge Iron Pvt. Ltd is getting ambient noise and work zone
noise monitoring, conducted at various locations by M/s Envirocheck,
which is MoEF&CC and NABL accredited laboratory.
As per the latest submitted monitoring reports dated 21.01.2020, it has
been observed that the noise levels are within the prescribed limits.

ADS POINT - I
Closure report from Regional Office on the observed non-compliances regarding Effluent Treatment Plant, concreting of internal roads,
green belt development and noise quality monitoring shall be furnished.
ANNEXURE-I
P a g e - 11
Appendix 1.3
Eastern Regional office (RO), Bhubaneswar visits in Chronological order for
compliance of EC conditions
(F.No J-11011/758/2009-IA.II(I) dated 18.04.2017)
1) Eastern Regional Office (RO) had visited the plant site of M/s Bravo on
20.09.2019 to monitor EC conditions for six monthly compliance report for
the existing project. Certified compliance report (File no 102-577/16/EPE)
was issued on 27.10.2019 wherein direction was given to take corrective
measures for 12 points which were minor in nature.
Abstract for certified compliance report dated 28.10.2019 (File
no 102-577/16/EPE) is presented below
2) Subsequently, EC application was uploaded online on 14.11.2019 on the
MoEF&CC website. EDS was sought by the Member Secretary (Industry-
1), MoEF&CC on dated 18.11.2011, wherein some essential documents
were sought along with Closure report from Regional Office (RO),
MoEF&CC.

ADS POINT - I
Closure report from Regional Office on the observed non-compliances regarding Effluent Treatment Plant, concreting of internal roads,
green belt development and noise quality monitoring shall be furnished.
ANNEXURE-I
P a g e - 12
3) Accordingly, closure report dated 05.12.2019 (File no 102-
577/16/EPE/2389) was issued by Eastern Regional office, Bhubaneswar,
MoEF&CC, which was uploaded as submission to EDS sought by the
Ministry. Thereafter, the project was placed in the 14th meetings of
Reconstituted Expert Appraisal Committee (Industry-1) of Ministry of
Environment, Forest and Climate Change (MoEF&CC), Govt. of India on
23rd December 2019.
Abstract of closure report dated 05.12.2019 is presented
herewith.
4) Final Closure Report (File no 102-577/16/EPE/427 dtd. 26.02.2020)
from Eastern Regional Office (RO), Bhubaneswar, Ministry of
Environment, Forest and Climate Change (MoEF&CC ) is enclosed
herewith as Appendix 1.1

ADS
POINT - II
Fresh assessment of surface water quality for all the parameters needs to be
done and report shall be furnished
ANNEXURE-II
P a g e - 1
During the 14th meeting of Reconstituted Expert Appraisal Committee (Industry-
1) of Ministry of Environment, Forest and Climate Change (MoEF&CC), Govt. of
India dated 23rd December 2019, the Honorable committee observed that “COD
parameter in the surface water sample has not been monitored. Hence,
fresh assessment of surface water quality for all the parameters is
required”.
Accordingly, a fresh surface water sampling has been done on 6th February, 2020
and the analysis report is presented in Table-2.2 & 2.3.
2.0 SURFACE WATER ENVIRONMENT
WATER SAMPLING
Surface water samples were collected and analyzed from total ten (10)
locations, including two (2) different locations from flowing water bodies
viz., Damodar River (SW1) and Canal near Chak Kamakuri (SW2) and
from eight (8) different ponds of different locations (SW3 to SW10) to
assess the baseline status of the surface water quality in the study area.
All the samples were analyzed with respect to physical, chemical and
biological parameters including toxic organics and metals, adopting
Standard methods. Sampling and analysis of surface water were carried
out following the analysis techniques and methodology described in
relevant Indian Standards and as per 23rd edition of "Standard Methods
for the Examination of Water and Waste Water" published by American
Public Health Association (APHA), 2017. Analysis results of all surface
water samples were compared with CPCB Water Quality Criteria for
Surface Water.
The locations of the sampling points for surface water are mentioned in
Table-2.1 and shown in Figure 2.1
Fresh Surface water quality report is presented in Tables 2.2 & 2.3.

ADS
POINT - II
Fresh assessment of surface water quality for all the parameters needs to be
done and report shall be furnished
ANNEXURE-II
P a g e - 2
TABLE-2.1
Surface Water Quality Monitoring Locations in the study area
Sample Code
Locations
Direction & Distance
from centre of project site (km)
Latitude Longitude Date of Sampling
SW1 Damodar River (Near Kargali) N, 9.12 KM 23°37'52.19"N 86°32'5.64"E 06.02.2020
SW2 Canal Water Near Chak Kamakuri NNW, 8.3 KM 23°36'58.35"N 86°30'29.33"E 06.02.2020
SW3 Near Kashiberia (Pond Water) S, 0.67 KM 23°32'35.35"N 86°32'46.78"E 06.02.2020
SW4 Near Dubra (Pond Water) WSW, 2.07 KM 23°32'40.13"N 86°31'31.47"E 06.02.2020
SW5 Near Ketlapur (Pond Water) WNW, 2.52 KM 23°33'42.39"N 86°31'26.89"E 06.02.2020
SW6 Near Barkhanali (Pond Water) N, 2.85 KM 23°34'30.42"N 86°32'40.59"E 06.02.2020
SW7 Near Dhanara (Pond Water) NE, 3.3 KM 23°34'14.50"N 86°34'2.48"E 06.02.2020
SW8 Near Toldi (Pond Water) ENE, 3.35 KM 23°33'20.95"N 86°34'36.98"E 06.02.2020
SW9 Near Dhulabad (Pond Water) ESE, 2.50 KM 23°32'32.56"N 86°34'5.40"E 06.02.2020
SW10 Near Dheria (Pond Water) S, 1.8 KM 23°32'0.53"N 86°32'36.24"E 06.02.2020
Figire-2.1
Surface Water Quality Monitoring Locations in the study area

ADS
POINT - II
Fresh assessment of surface water quality for all the parameters needs to be
done and report shall be furnished
ANNEXURE-II
P a g e - 3
TABLE-2.2
SURFACE WATER QUALITY
Unobj. – Unobjectionable
Sl. No.
Parameters Unit
SAMPLE CODES
SW1 Damodar
River (Near
Kargali)
SW2 Canal Water (Near Chak
Kamakuri)
SW3 Kashiberia
(Pond Water)
SW4 Dubra (Pond Water)
SW5 Ketlapur
(Pond Water)
1 Colour Hazen Unit Colourless Colourless Colourless Colourless Colourless
2 Odour - Unobj. Unobj. Unobj. Unobj. Unobj.
3 pH - 7.1 7.3 7.5 6.8 6.9
4 Conductivity µmhos/cm 335 512 625 515 481
5 Dissolved Oxygen mg/L 7.5 6.5 6.5 6.8 6.3
6 Biochemical Oxygen Demand (3 days at 27°C)
mg/L 2 6 7 5 8
7 Chemical Oxygen Demand
mg/L 4 31 27 19 35
8 Total Coliforms MPN/100 ml 750 1663 995 838 779
9 Total Dissolved Solids mg/L 188 296 353 292 288
10 Oil & Grease mg/L <1.4 <1.4 <1.4 <1.4 <1.4
11 Cyanide ( as CN ) mg/L <0.05 <0.05 <0.05 <0.05 <0.05
12 Phenol ( as C6H5OH ) mg/L <0.001 <0.001 <0.001 <0.001 <0.001
13 Total Hardness ( as CaCO3 )
mg/L 104 168 185 164 174
14 Chloride ( as Cl ) mg/L 41 66 98 66 68
15 Sulphate ( as SO4 ) mg/L 13 27 24 22 17
16 Nitrate ( as NO3 ) mg/L 3.5 5.8 4.5 5.3 4.8
17 Fluoride ( as F ) mg/L 0.38 0.42 0.39 0.35 0.38
18 Calcium ( as Ca ) mg/L 32 49 51 53 55
19 Magnesium ( as Mg ) mg/L 6 11 14 8 9
20 Copper ( as Cu ) mg/L <0.05 <0.05 <0.05 <0.05 <0.05
21 Iron ( as Fe ) mg/L 0.15 0.38 0.46 0.25 0.38
22 Manganese ( as Mn ) mg/L <0.05 <0.05 <0.05 <0.05 <0.05
23 Zinc ( as Zn ) mg/L <0.05 <0.05 <0.05 <0.05 <0.05
24 Boron ( as B ) mg/L <0.02 <0.02 <0.02 <0.02 <0.02
25 Arsenic ( as As ) mg/L <0.002 <0.002 <0.002 <0.002 <0.002
26 Mercury ( as Hg ) mg/L <0.001 <0.001 <0.001 <0.001 <0.001
27 Lead ( as Pb ) mg/L <0.05 <0.05 <0.05 <0.05 <0.05
28 Alkalinity ( as CaCO3 ) mg/L 106 142 164 152 156
29 Cadmium ( as Cd ) mg/L <0.01 <0.01 <0.01 <0.01 <0.01
30 Hexavalent Chromium ( as Cr+6 )
mg/L <0.05 <0.05 <0.05 <0.05 <0.05
31 Free Ammonia mg/L <0.05 <0.05 <0.05 <0.05 <0.05
32 Sodium Absorption Ratio - 5.7 6.4 8.8 6.3 5.3

ADS
POINT - II
Fresh assessment of surface water quality for all the parameters needs to be
done and report shall be furnished
ANNEXURE-II
P a g e - 4
TABLE-2.3
SURFACE WATER QUALITY
Unobj. – Unobjectionable
Sl. No.
Parameters Unit
SAMPLE CODES
SW6 Barkhanali (Pond Water)
SW7 Dhanara
(Pond Water)
SW8 Toldi (Pond Water)
SW9 Dhulabad
(Pond Water)
SW10 Dheria (Pond Water)
1 Colour Hazen Unit Colourless Colourless Colourless Colourless Colourless
2 Odour - Unobj. Unobj. Unobj. Unobj. Unobj.
3 pH - 6.6 7.7 6.9 6.6 7.3
4 Conductivity µmhos/cm 473 633 392 646 497
5 Dissolved Oxygen mg/L 6.7 6.1 6.4 6.7 6.6
6 Biochemical Oxygen Demand (3 days at 27°C)
mg/L 7 8 6 5 4
7 Chemical Oxygen Demand mg/L 23 31 27 19 16
8 Total Coliforms MPN/100 ml 885 1470 1233 929 1134
9 Total Dissolved Solids mg/L 284 365 226 375 286
10 Oil & Grease mg/L <1.4 <1.4 <1.4 <1.4 <1.4
11 Cyanide ( as CN ) mg/L <0.05 <0.05 <0.05 <0.05 <0.05
12 Phenol ( as C6H5OH ) mg/L <0.001 <0.001 <0.001 <0.001 <0.001
13 Total Hardness ( as CaCO3 )
mg/L 150 182 122 186 148
14 Chloride ( as Cl ) mg/L 64 84 55 88 72
15 Sulphate ( as SO4 ) mg/L 21 35 12 26 10
16 Nitrate ( as NO3 ) mg/L 3.9 3.9 3.6 5.3 4.2
17 Fluoride ( as F ) mg/L 0.32 0.42 0.31 0.41 0.25
18 Calcium ( as Ca ) mg/L 42 60 40 58 49
19 Magnesium ( as Mg ) mg/L 11 8 5 10 6
20 Copper ( as Cu ) mg/L <0.05 <0.05 <0.05 <0.05 <0.05
21 Iron ( as Fe ) mg/L 0.28 0.35 0.16 0.41 0.22
22 Manganese ( as Mn ) mg/L <0.05 <0.05 <0.05 <0.05 <0.05
23 Zinc ( as Zn ) mg/L <0.05 <0.05 <0.05 <0.05 <0.05
24 Boron ( as B ) mg/L <0.02 <0.02 <0.02 <0.02 <0.02
25 Arsenic ( as As ) mg/L <0.002 <0.002 <0.002 <0.002 <0.002
26 Mercury ( as Hg ) mg/L <0.001 <0.001 <0.001 <0.001 <0.001
27 Lead ( as Pb ) mg/L <0.05 <0.05 <0.05 <0.05 <0.05
28 Alkalinity ( as CaCO3 ) mg/L 148 174 116 185 150
29 Cadmium ( as Cd ) mg/L <0.01 <0.01 <0.01 <0.01 <0.01
30 Hexavalent Chromium ( as Cr+6 )
mg/L <0.05 <0.05 <0.05 <0.05 <0.05
31 Free Ammonia <0.05 <0.05 <0.05 <0.05 <0.05
32 Sodium Absorption Ratio - 7.8 8.6 6.3 9.4 7.6

ADS
POINT - II
Fresh assessment of surface water quality for all the parameters needs to be
done and report shall be furnished
ANNEXURE-II
P a g e - 5
Table-2.4 : Central Pollution Control Board (CPCB) Surface Water Quality
Criteria
Sl.
No.
Parameters Class
A
Class
B
Class
C
Class
D
Class
E
1 pH 6.5–8.5 6.5–8.5 6.0–9.0 6.5–8.5 6.0–8.5
2 Dissolved Oxygen (as O2), mg/l, min 6 5 4 4 -
3 BOD, 5 days at 20°C, max 2 3 3 - -
4 Total Coliform organism, MPN/100 ml, max 50 500 5000 - -
5 Free ammonia (as N), mg/l, max - - - 1.2 -
6 Electrical Conductivity, µmhos/cm, max - - - - 2250
7 Sodium Absorption Ratio, max - - - - 26
8 Boron (as B), mg/l, max - - - - 2
Class A: Drinking water source without conventional treatment but after disinfection
Class B: Outdoor bathing (organised)
Class C: Drinking water source after conventional treatment and after disinfection
Class D: Propagation of Wild life and Fisheries
Class E: Irrigation, Industrial Cooling, and Controlled Waste Disposal
Below E: Not meeting A, B, C, D & E Criteria
Source: https://cpcb.nic.in/wqm/Designated_Best_Use_Water_Quality_Criteria.pdf

ADS
POINT - II
Fresh assessment of surface water quality for all the parameters needs to be
done and report shall be furnished
ANNEXURE-II
P a g e - 6
RESULTS OF SURFACE WATER QUALITY ANALYSIS
The result of analysis of Surface Water are given in Tables 2.2 & 2.3. The
surface water quality was compared with CPCB water quality criteria for
surface water, for total 8 parameters for surface water, as given in Table 2.4.
River Water Quality:
The river water quality (SW1) parameters are within the standard for Class C
i.e., Drinking water source after conventional treatment and after disinfection.
Canal Water Quality:
The Canal Water Near Chak Kamakuri (SW2) parameters are within the
standard for Class C except for BOD level, which is more than the standard (3
mg/l). Hence, this water is suitable for only “Propagation of Wildlife &
Fisheries” (i.e., Class D) and “Irrigation, Industrial Cooling, and Controlled
Waste Disposal” (i.e., Class E).
Ponds Water Quality:
The Pond water quality (SW3 to SW10) parameters are within the standard for
Class C except for BOD level, which is more than the standard (3 mg/l).
Hence, this water is suitable for only “Propagation of Wildlife & Fisheries” (i.e.,
Class D) and “Irrigation, Industrial Cooling, and Controlled Waste Disposal”
(i.e.. Class E).

ADS
POINT - II
Fresh assessment of surface water quality for all the parameters needs to be
done and report shall be furnished
ANNEXURE-II
P a g e - 7
6-2-2020
6-2-2020
6-2-2020
POND WATER
SAMPLING
POND WATER
SAMPLING
DAMODAR RIVER
WATER SAMPLING

ADS POINT - III
Hazard Identification and Risk Assessment (HIRA) report specific to the project activity
shall be prepared and submitted
ANNEXURE-III
P a g e - 1
HAZARD IDENTIFICATION & RISK ASSESSMENT (HIRA)
During 14th EAC meeting dated 23.12.2019, the Honorable Committee observed that “Hazard
Identification and Risk Assessment (HIRA) report submitted is not satisfactory. Rules and
Regulations pertaining to the HIRA has been wrongly mentioned in the report”
In submission to above ADS point no iii, the assessment has been made in a systematic
manner covering the requirements of the above mentioned rules. Accordingly
subsequent sections have been divided as follows:
1) Introduction
2) Brief Process description (on page 3)
3) Description of hazardous substances (on page 4)
4) Applicability of the rule (on page 5)
5) Hazard Identification (on page 6)
6) Hazard Assessment (& hazard scenarios) (on page 7)
7) Consequence analysis (on page 25)
8) Summary & Conclusions of Risk Assessment (on page 26)
9) On site emergency plan (on page 27)
1) INTRODUCTION
M/s Bravo Sponge Iron Pvt. Ltd. has planned for expansion of the Steel Plant by
installation of Pellet Plant with Grinding Facility (2x0.85 MTPA), Sponge Iron Plant
(1x350 TPD Kiln), Induction Furnaces (3x25 T), Capacity revision of Rolling Mill from
approved 600 TPD to 1000 TPD along with 7 MW capacity Captive Power Plant
(WHRB based, utilising waste heat from the proposed sponge iron plant) and
Producer Gas Plant (12x4000 Nm3/hr) at Village Mahuda, P.O. Rukni, P.S: Para,
District: Purulia, West Bengal.
The Plant has lower risk potential than those industries dealing with toxic and
flammable chemicals. Off-site people are not exposed to any dangers, hence the
societal risk is insignificant.

ADS POINT - III
Hazard Identification and Risk Assessment (HIRA) report specific to the project activity
shall be prepared and submitted
ANNEXURE-III
P a g e - 2
This chapter deals with identification of hazard. The proposed project may face certain types
of hazards which can disrupt normal activities abruptly and lead to disaster like fires,
inundation, failure of machinery, hot metal spill, electrocution to name a few.
Industrial activities, which produce, treat, store and handle hazardous substances, have a
high hazard potential to safety of man and environment at work place and outside.
Recognizing the need to control and minimize the risks posed by such activities, the Ministry
of Environment Forest and Climate Change have has notified the “Manufacture Storage &
Import of Hazardous Chemicals Rules” in the year 2008 (In super session of
the Hazardous Wastes (Management and Handling Rules, 1989) and subsequently modified,
inserted and added different clauses in the said rule to make it more stringent. For effective
implementation of the rule, Ministry of Environment, Forest and Climate Change has
provided a set of guidelines. The guidelines, in addition to other aspects, set out the duties
required to be performed by the occupier along with the procedure. The rule also lists out
the industrial activities and chemicals, which are required to be considered as hazardous.
In view of this, BRAVO’s existing and proposed activities are scrutinized in line of the above referred“Manufacture, storage and import of hazardous chemicals rules” and observations / findings are presented in this document.
An elaborate and well-documented Disaster Management Plan covering existing risk and hazard is already in place. The same shall be upgraded and extended to the units under the expansion program of BRAVO.
Hazard is a source or situation that has the potential for harm in terms of human injury, ill health, damage to property or the environment, or a combination of these factors. It has got a short term or a long term effect on the work environment with considerable human and economic costs. A hazard can have a potential to create an emergency like situation at the work place. Hazard is a potential cause to generate a disaster.
Hazards exist in every workplace in different forms and are required to be identified, assessed and controlled regarding the work processes, plant or substances. They arise from
(i) workplace environment,
(ii) use of plant and equipment
(iii) use of substances and materials,
(iv) poor work and/or plant design,
(v) inappropriate management systems and work procedures, and
(vi) Human behavior.
Steel plant has many hazardous processes and operations which can cause
considerable environmental, health and safety risk to the workforce. These
hazards may cause potential risk to the work environment which include work
force and work place and hence need proper assessment.

ADS POINT - III
Hazard Identification and Risk Assessment (HIRA) report specific to the project activity
shall be prepared and submitted
ANNEXURE-III
P a g e - 3
During the process of manufacturing and other associated activities hazardous
wastes are generated which are stored and used within the plant process. The
major chemicals handled / stored by the plant include HSD, FO etc. In view of
this, proposed activities are being scrutinized in line of the above referred
“manufacture, storage and import of hazardous chemicals rules” and
observations / findings are presented in this chapter.
The major substances handled / stored by BRAVO include Iron ore, Coal, etc and
fluxes such as limestone, dolomite etc along with binder such as bentonite. Apart
from above Hot metal in SMS, hot flue gas in DRI and steam in Power plant shall
be handled.
2) BRIEF PROCESS DESCRIPTION
BRAVO is producing steel products via DRI-Induction Furnace Route of steel
making. The major steps in the manufacturing process are as follows:
Raw material handling system
Pellet Making in Pellet Plant
Sponge Iron production in DRI Kiln
Steel production in Induction Furnace with LRF and continuous casting
Rolling Mill.
Power Plant for Utilization of Waste heat from DRI unit
Producer gas Plant to provide gaseous fuel
Electrical Systems
Utility Systems
The detailed process of each of the aforementioned major activities is already
elaborated in Chapter-2 of EIA report
ADS POINT - III
Hazard Identification and Risk Assessment (HIRA) report specific to the project activity
shall be prepared and submitted
ANNEXURE-III
P a g e - 4
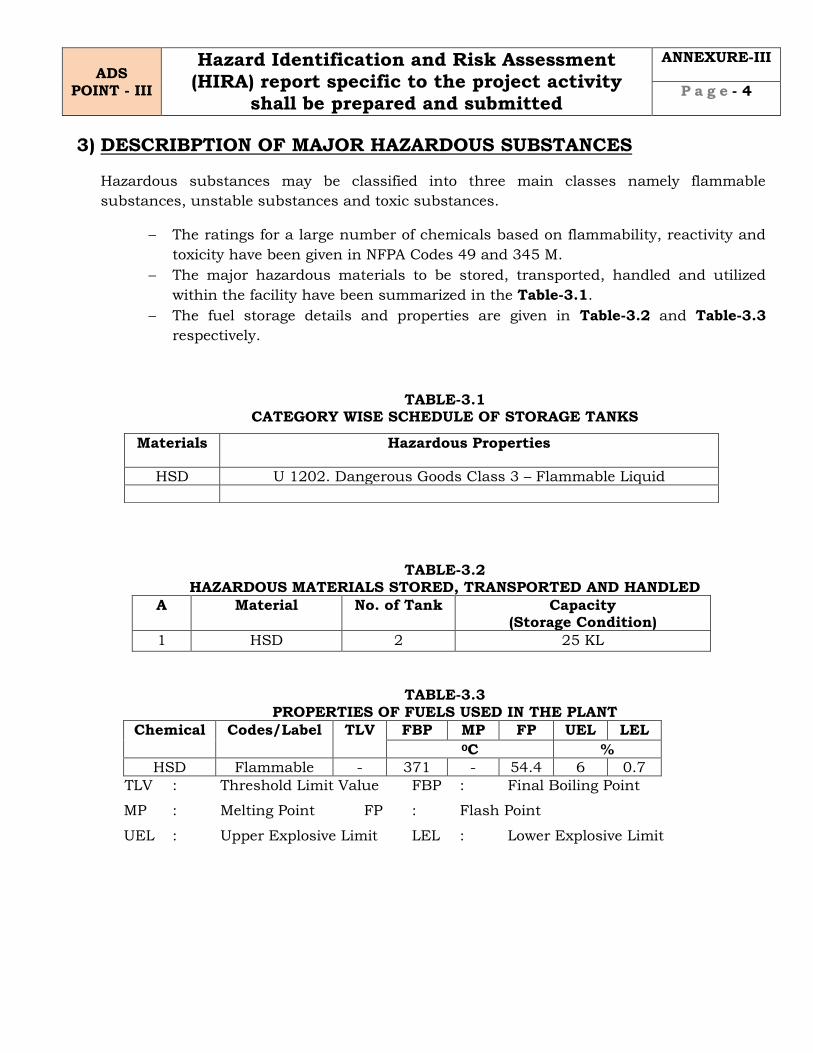
3) DESCRIBPTION OF MAJOR HAZARDOUS SUBSTANCES
Hazardous substances may be classified into three main classes namely flammable
substances, unstable substances and toxic substances.
The ratings for a large number of chemicals based on flammability, reactivity and
toxicity have been given in NFPA Codes 49 and 345 M.
The major hazardous materials to be stored, transported, handled and utilized
within the facility have been summarized in the Table-3.1.
The fuel storage details and properties are given in Table-3.2 and Table-3.3
respectively.
TABLE-3.1 CATEGORY WISE SCHEDULE OF STORAGE TANKS
TABLE-3.2
HAZARDOUS MATERIALS STORED, TRANSPORTED AND HANDLED
A Material No. of Tank Capacity (Storage Condition)
1 HSD 2 25 KL
TABLE-3.3 PROPERTIES OF FUELS USED IN THE PLANT
Chemical
Codes/Label TLV FBP MP FP UEL LEL 0C %
HSD Flammable - 371 - 54.4 6 0.7
TLV : Threshold Limit Value FBP : Final Boiling Point
MP : Melting Point FP : Flash Point
UEL : Upper Explosive Limit LEL : Lower Explosive Limit
Materials Hazardous Properties
HSD U 1202. Dangerous Goods Class 3 – Flammable Liquid

ADS POINT - III
Hazard Identification and Risk Assessment (HIRA) report specific to the project activity
shall be prepared and submitted
ANNEXURE-III
P a g e - 5
4) APPLICABILITY OF THE RULE
As per MSIHC Rules, 1989 with subsequent amendments, the Steel making process is
classified as an “industrial activity” storing/handling hazardous substances. To decide
whether the above mentioned industrial activities/substances are likely to come within
the scope of the above mentioned “Manufacture Storage and Import of Hazardous
Chemicals Rules, 1989 & subsequent amendments”, the threshold quantities mentioned
in the rules are used for comparison, as given in Table 3.4
“Manufacture Storage and Import of Hazardous Chemicals Rules, 1989 &
subsequent amendments”
Hazardous and Other Wastes (Management & Transboundary Movement) Rules,
2016
IDENTIFICATION OF MAJOR HAZARD INSTALLATIONS BASED ON GOI RULES,
2008
Following accidents in the chemical industry in India over a few decades, a specific
legislation covering major hazard activities has been enforced by Govt. of India in 2008
(In suppression of 1989) in conjunction with Environment Protection Act, 1986. This is
referred here as GOI Rules 2008. For the purpose of identifying major hazard
installations, the rules employ certain criteria based on toxic, flammable and explosive
properties of chemicals.
A systematic analysis of the fuels/chemicals and their quantities of storage has been
carried out, to determine threshold quantities as notified by GOI Rules, 2008 and the
applicable rules are identified. Applicability of storage rules are summarized in Table-
1.5.
TABLE-3.4
APPLICABILITY OF GOI RULES TO FUEL STORAGE
Sr.
No.
Chemical/Fuel Listed in
Schedule
Total
Quantity
Threshold Quantity (T)
for Application of
Rules
4, 5, 7-9,
13-15
10-12
1 HSD 3(PART II) 2 x 25 KL 10,000 MT 10,000 MT

ADS POINT - III
Hazard Identification and Risk Assessment (HIRA) report specific to the project activity
shall be prepared and submitted
ANNEXURE-III
P a g e - 6
5) HAZARD IDENTIFICATION
This is an early check of major hazards, which are having risk potential - including the
potential for disastrous interactions of the various plant operational activities. The
identification of hazards anticipation for the proposed project activities are presented below in
Table-3.5
TABLE 3.5 HAZARD IDENTIFICATION OF THE PROJECT Item Nature of Hazard Hazard Potential
Raw Material Handling:
Iron Ore Fines, Limestone,
Dolomite etc.
Dust Minor
Coal Heat, Fire & Dust Moderate
HSD/ FO /Lube Oils / Greases Heat & Fire Major
Production Units:
Pellet Plant Heat & Dust Moderate
Sponge Iron Plant Fire, Heat & Dust Moderate
Steel Making Facilities -Induction Furnaces
Heat & Fire by Hot
Metal & Slag Handling
Major
Hot Rolling Mill Heat Moderate
Captive Power Plant Fire, Heat & Dust Moderate
Producer Gas Plant Heat & Dust Moderate
Utilities:
Fuel (Gas/Liquid) Heat & Fire Major
Electric Power Supply Heat & Fire Major

ADS POINT - III
Hazard Identification and Risk Assessment (HIRA) report specific to the project activity
shall be prepared and submitted
ANNEXURE-III
P a g e - 7
6) HAZARD ASSESSMENT AND EVALUATION
PRELIMINARY HAZARD ANALYSIS (PHA)
An assessment of the conceptual design is conducted for the purpose of identifying and
examining hazards related to feed stock materials, major process components, utility
and support systems, environmental factors, proposed operations, facilities, and
safeguards.
In the proposed project, large amounts of material will be processed, transported and
conveyed by massive equipment. The major chemicals handled / stored by the plant
includes HSD, FO etc. Due to massive equipment and movement of large masses of
materials, workers will be exposed to the heat of molten metal and slag at temperatures
up to 1,800°C, toxic or corrosive substances, respirable air-borne contaminants and
noise.
Burns may occur at many points in the steel-making process: at the front of the furnace
during tapping from molten metal or slag; from spills, spatters or eruptions of hot metal
from ladles or vessels during processing, teeming (pouring) or transporting; and from
contact with hot metal as it is being formed into a final product.
Water entrapped by molten metal or slag may generate explosive forces that launch hot
metal or material over a wide area. Inserting a damp implement into molten metal may
also cause violent eruptions.
Mechanical transport exposes workers to potential struck-by and caught- between
hazards. Overhead travelling cranes are found in almost all areas of steel works. Most
large works also rely heavily on the use of fixed-rail equipment and large industrial
tractors for transporting materials.
Large quantities of greases, oils and lubricants are used and if spilled can easily become
a slipping hazard on walking or working surfaces.
Sharp engines or burrs on steel products or metal bands pose laceration and puncture
hazards to workers involved in finishing, shipping and scrap-handling operations.
Foreign-body eye hazards are prevalent in most areas, especially in raw material
handling and steel finishing, where grinding, welding and burning are conducted

ADS POINT - III
Hazard Identification and Risk Assessment (HIRA) report specific to the project activity
shall be prepared and submitted
ANNEXURE-III
P a g e - 8
In any operation, hazardous situation arises due to:
o Failure in the monitoring of crucial process parameters e.g. pressure, temperature, flow
quantityetc.
o Failure in the utilities e.g. cooling water
o Failure of control instruments e.g. pressure, temperature level, flow controllers etc.
o Failure of components such as pumps, compressor etc.
o Failure of safety systems, safety valves / relief valves, sprinkler systems, alarm etc.
o Mechanical failure of vessels or pipe work due to excessive stress, over pressure, corrosion etc.
o Wrong operation, failing to adhere to the safety norms etc.
Therefore a Preliminary Hazard Analysis (PHA) is carried out first for assessment of hazard.
Effects of the above Hazards:
The effect of accidents in these areas will be confined to the facilities only and can be controlled
within the areas by the operating personnel themselves. At the extreme, it may require the
resources of the whole facility to control the effects but these are not at all expected to spill over
to the community. Primary Hazard Analysis is given in Table 3.5.
A preliminary hazard analysis is carried out initially to identify the major hazards
associated with storages and the processes of the plant. This is followed by consequence
analysis to quantify these hazards. Finally, the vulnerable zones are plotted for which
risk reducing measures are deduced and implemented. Preliminary hazard analysis for
fuel storage area and whole plant is given in Table-3.6 and Table-3.7.
TABLE-3.6
PRELIMINARY HAZARD ANALYSIS FOR STORAGE AREAS
Unit Capacity Hazard Identified
HSD 2x25 KL Tank Fire, Pool Fire
ADS POINT - III
Hazard Identification and Risk Assessment (HIRA) report specific to the project activity
shall be prepared and submitted
ANNEXURE-III
P a g e - 9
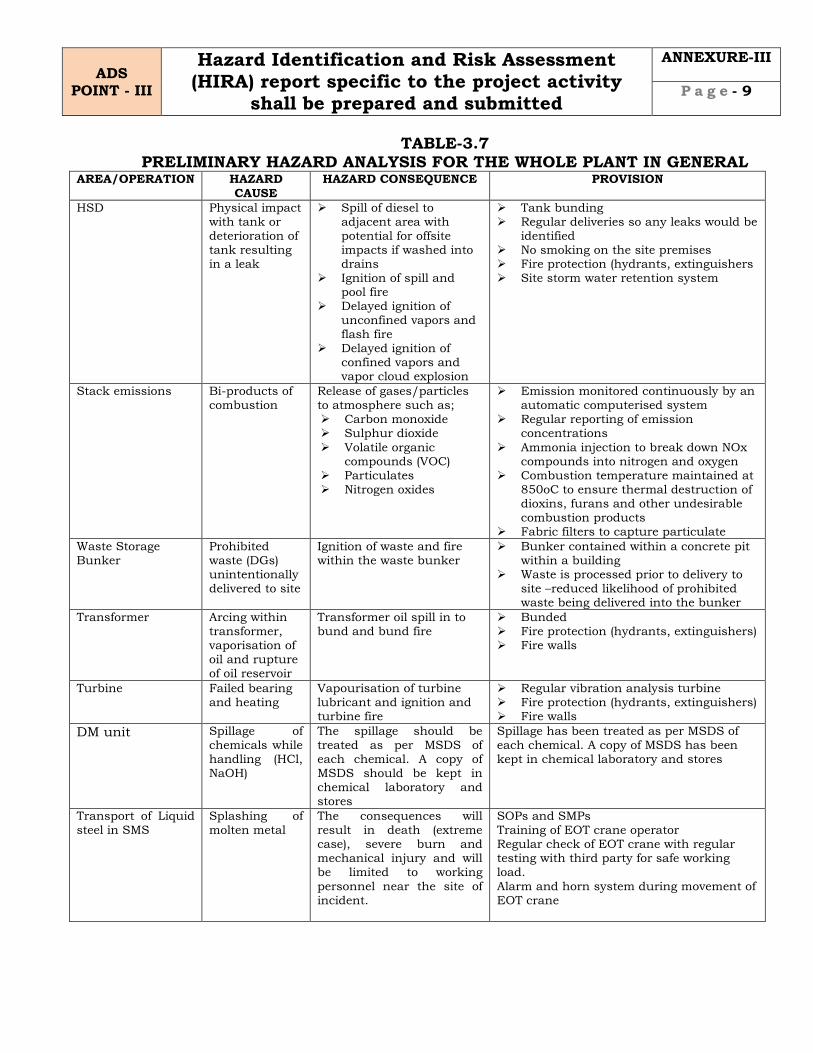
TABLE-3.7 PRELIMINARY HAZARD ANALYSIS FOR THE WHOLE PLANT IN GENERAL
AREA/OPERATION HAZARD
CAUSE
HAZARD CONSEQUENCE PROVISION
HSD Physical impact with tank or deterioration of tank resulting in a leak
Spill of diesel to adjacent area with potential for offsite impacts if washed into drains
Ignition of spill and pool fire
Delayed ignition of unconfined vapors and
flash fire Delayed ignition of
confined vapors and vapor cloud explosion
Tank bunding Regular deliveries so any leaks would be
identified No smoking on the site premises Fire protection (hydrants, extinguishers Site storm water retention system
Stack emissions Bi-products of combustion
Release of gases/particles to atmosphere such as; Carbon monoxide Sulphur dioxide
Volatile organic compounds (VOC)
Particulates Nitrogen oxides
Emission monitored continuously by an automatic computerised system
Regular reporting of emission concentrations
Ammonia injection to break down NOx compounds into nitrogen and oxygen
Combustion temperature maintained at 850oC to ensure thermal destruction of dioxins, furans and other undesirable combustion products
Fabric filters to capture particulate
Waste Storage Bunker
Prohibited waste (DGs) unintentionally delivered to site
Ignition of waste and fire within the waste bunker
Bunker contained within a concrete pit within a building
Waste is processed prior to delivery to site –reduced likelihood of prohibited waste being delivered into the bunker
Transformer Arcing within transformer, vaporisation of oil and rupture of oil reservoir
Transformer oil spill in to bund and bund fire
Bunded Fire protection (hydrants, extinguishers) Fire walls
Turbine Failed bearing and heating
Vapourisation of turbine lubricant and ignition and turbine fire
Regular vibration analysis turbine Fire protection (hydrants, extinguishers) Fire walls
DM unit Spillage of chemicals while handling (HCl,
NaOH)
The spillage should be treated as per MSDS of each chemical. A copy of
MSDS should be kept in chemical laboratory and stores
Spillage has been treated as per MSDS of each chemical. A copy of MSDS has been kept in chemical laboratory and stores
Transport of Liquid steel in SMS
Splashing of molten metal
The consequences will result in death (extreme case), severe burn and mechanical injury and will be limited to working
personnel near the site of incident.
SOPs and SMPs Training of EOT crane operator Regular check of EOT crane with regular testing with third party for safe working load.
Alarm and horn system during movement of EOT crane

ADS POINT - III
Hazard Identification and Risk Assessment (HIRA) report specific to the project activity
shall be prepared and submitted
ANNEXURE-III
P a g e - 10
FIRE EXPLOSION AND TOXICITY INDEX (FE&TI) FOR STORAGE UNIT
Dow's Fire and Explosion Index (F and E) is a product of Material Factor (MF) and
hazard factor (F3) while MF represents the flammability and reactivity of the
substances, the hazard factor (F3), is itself a product of General Process Hazards
(GPH) and Special Process Hazards (SPH). The application of FE & TI would help to
make a quick assessment of the nature and quantification of the hazard in these
areas. However, this does not provide precise information.
The degree of hazard potential is identified based on the numerical value of F&EI
as per the criteria given below:
F&EI Range Degree of Hazard
0-60 Light 61-96 Moderate 97-127 Intermediate 128-158 Heavy 159-up Severe
By comparing the indices F&EI and TI, the unit in question is classified into one of
the following three categories established for the purpose (Table-3.8).
TABLE-3.8 FIRE EXPLOSION AND TOXICITY INDEX
Category Fire and Explosion Index (F&EI) Toxicity Index (TI)
I F&EI < 65 TI < 6
II 65 < or = F&EI < 95 6 < or = TI < 10
III F&EI > or = 95 TI > or = 10
Certain basic minimum preventive and protective measures are recommended for the
three hazard categories.

ADS POINT - III
Hazard Identification and Risk Assessment (HIRA) report specific to the project activity
shall be prepared and submitted
ANNEXURE-III
P a g e - 11
RESULTS OF FE AND TI FOR STORAGE UNIT
Based on the GOI Rules 2008, the hazardous fuel used by the proposed project is
identified. Fire and explosion are the likely hazards, which may occur due to the
fuel storage. Hence, fire and explosion index has been calculated for in plant
storage.
The Health (Nh), Flammability (Nf), Reactivity (Nr), and MF (Material Factor) for all
the materials under consideration was derived from NFPA (National Fire Protection
Association) codes. The GPH (General Process Hazard Factor) and SPH (Specific
Process Hazard Factor) was calculated accordingly. Based on F&EI (Fire and
Explosion Index), the HSD will come in light degree of hazard and nil toxicity. Thus
Risk Assessment and Hazard analysis has been carried out due to fire hazard for
HSD tanks by carrying out MCA (Maximum Credible Accident) analysis for the
same. Estimates of FE&TI are given in Table-3.9.
TABLE-3.9
FIRE EXPLOSION AND TOXICITY INDEX
Fuel Total
Capacity
NFPA
Classification
GPH SPH F&EI F & E
Categor
y
**TI Toxicity
Categor
y Nh Nf Nr MF
HSD 2x25 KL 0 2 0 10 2 2.2 43.2 Light NIL -
Results of FE&TI analysis show that the storage of HSD falls into Light category of fire
and explosion index.
Damage distance computations for MCA (Maximum Credible Accident) analysis
The major hazards scenarios identified for the possibility of occurrence are mainly
concerned with HSD tanks.
A storage tanks of HSD with a capacity of 1x25 KL, Molecular Weight 135 kg/kg mol,
Boiling Point 350°C, density 900 kg/m3 is considered. Tank fire would occur if the
radiation intensity is high on the peripheral surface of tanks leading to increase in
internal tank pressure. Pool fire would occur when fuel oil collected in the dyke due to
leakage gets ignited. As the tanks are provided within the dyke the fire will be confined
within the dyke wall.

ADS POINT - III
Hazard Identification and Risk Assessment (HIRA) report specific to the project activity
shall be prepared and submitted
ANNEXURE-III
P a g e - 12
SOURCE STRENGTH:
Burning Puddle / Pool Fire Puddle Diameter: 2.5 meters Puddle Volume: 5 cubic meters Flame Length: 8 meters Burn Duration: ALOHA limited the duration to 1 hour Burn Rate: 25.3 kilograms/min Total Amount Burned: 1,516 kilograms
THREAT ZONE:
Sr. No.
Incident Radiation (kW/m2)
Type of Damage Intensity
Damage to Equipment
Damage to People
1 37.5 Damage to process equipment
100% lethality in 1 min. 1% lethality in 10 sec
2 12.5 Minimum energy to ignite with a flame; melts plastic tubing
1% lethality in 1 min.
3
4.5
Causes pain if duration is longer than 20 sec, however blistering is un-likely (First degree burns)
4 2 Causes no discomfort on long exposures
Source: Techniques for Assessing Industrial Hazards by World Bank
The maximum capacity of storage of HSD is 25 KL. The most credible failure is the
rupture/hole of the storage tank. As a worst case, it is assumed that the entire
contents leak out into the dyke forming a pool, which may catch fire on finding a
source of ignition. The radiation intensities for rupture of HSD storage tank is given
in Table-3.10.
TABLE-3.10 THERMAL RADIATION DUE TO FAILURE OF HSD TANKS
Scenario Thermal radiation kW/m2 distance in m
37.5 12.5 4.5 2.0
Failure of HSD Storage tank
0.69 1.5 2.23 3.81

ADS POINT - III
Hazard Identification and Risk Assessment (HIRA) report specific to the project activity
shall be prepared and submitted
ANNEXURE-III
P a g e - 13
RISK ASSESSMENT
Risk assessment is the determination of quantitative and qualitative value of risk related to a concrete situation and a recognized threat. Activities requiring assessment of risk due to occurrence of most probable instances of hazard and accident are both onsite
The risk management measures for the proposed project activities will be adopted as required
for best safety practice within the works boundary. In addition, the design and engineering of
the proposed activities will take into consideration of the proposed protection measures towards
maintaining environmental norms.
5 x 5 Matrix for Risk Assessment
Likelihood Severity
5. Almost Certain 4. Probable 3. Possible 2.Possible(under unfortunate circumstances) 1. Rare
5. Fatality
4. Major Injury, resulting in disability 3. Injury Requires, Hospital attendance 2. Minor Injury, 1st Aid required 1. Minor Injury, 1st Aid not required
Com
mun
icate
& R
espond
Mon
itor
and r
evie
w
Ris
k A
ssessm
en
t
Establish the context
Identify the risks
Analyze risks
Evaluate risks
Treat risks

ADS POINT - III
Hazard Identification and Risk Assessment (HIRA) report specific to the project activity
shall be prepared and submitted
ANNEXURE-III
P a g e - 14
Risk Rating
Risk Rating is calculated by multiplying the likelihood against the consequences,
e.g. taking a likelihood of 4, which is classified as Probable, and multiplying this
against a consequence of 2, which is classified as a Minor Injury1st aid required,
would give you and overall risk rating of 8, which would be risk rated as a low
risk
Risk Value = Likelihood X Severity
Probability Score(Likelihood)
Impact score (severity)
1
2
3
4
5
1
1
(Low)
2
(Low)
3
(Low)
4
(Low)
5
(Med)
2
2 (Low)
4 (Low)
6 (Med)
8 (Med)
10 (High)
3
3
(Low)
6
(Med)
9
(Med)
12
(High)
15
(High)
4
4 (Low)
8 (Med)
12 (High)
16 (High)
20
(Very High)
5
5 (Med)
10 (High)
15 (High)
20
(Very High)
25
(Very High)

ADS POINT - III
Hazard Identification and Risk Assessment (HIRA) report specific to the project activity
shall be prepared and submitted
ANNEXURE-III
P a g e - 15
Maximum Credible Accident Analysis (MCAA)
A Maximum Credible Accident (MCA) can be characterized, as an accident with a
maximum damagepotential, this is still believed to be probable. The selection of
accident scenarios representative for aMCA-Analysis has been done on the basis of
engineering judgement and expertise in the field of riskanalysis studies, especially
accident analysis.
In the proposed expansion programme of BRAVO, which is also identified as an
“Industrial activity”handling hazardous substances as per MSIHC Rules, 1989 and
subsequent amendments, hazardoussubstances may be released as a result of failures
or catastrophes, causing possible damage to thesurrounding area. .As mentioned above,
the hazardous substances identified of posing major threats to the facility and people
working at the facility are listed in Table 3.3 above.
MCA Analysis assists in identifying the potential major accidents arising due to
flammable and/or toxicstorages or handling facilities and estimate the maximum
consequent effects on the surroundingenvironment in terms of damage distances of
heat, radiation, toxic release, vapor cloud explosion etc.depending upon the effective
hazardous attributes and the impact of the event, in the worst possiblehazard
situations.
The visualization of MCA scenarios has been done considering the chemical inventory
to be handled at the proposed plant, various loss of containment scenarios and
subsequent accident scenarios andanalysis of incident history of similar nature to
establish credibility of the identified accident scenarios.Based on the above, the
identified credible accident scenarios having maximum damage effects(worst case) along
with their Risk Potential, Mitigation Measures and the Proposed Facility/Infrastructure
to take the necessary mitigation measures are given in below table separately for each
of the following facilities:
1) Raw material Handling System
2) Pellet Plant
3) Producer Gas Plant
4) Sponge Iron Plant (DRI)
5) Captive Power Plant (CPP
6) Steel Melting Shop (SMS)
7) Rolling Mill
8) Electrical System
9) Utility System

ADS
POINT - III
Hazard Identification and Risk Assessment (HIRA) report specific to the project activity
shall be prepared and submitted
ANNEXURE-III
P a g e - 16
1 Raw material Handling System
Risk Potential Likelihood- “L” Severity – “S”
Risk Rating “RR=LxS”
Mitigation Measures
Facility / infrastructure Proposed
SL Activity Hazard Risk L S RR
1.1 Unloading of material from trucks
Dust emission, collision of trucks
Respiratory problems and injury to personnel
2
3 Moderate
1) Preparation of SOP and SMP and Training manuals
2) Provide adequate training to Operators
3) Guarding of all rotating parts of conveyor system
4) Pull chord in conveyors.
5) Emergency switch. 6) Conduct regular safety
audits and rectify safety issue and monitor compliancesof reports.
7) Ensure use of PPEs 8) Fire fighting & Hydrant
system
1) SOP and SMP training manual is in practice
2) Periodic training is being conducted to the operator
3) Guard installed on all rotating parts
4) Safety Monitoring and Audits are being done on regular basis
5) Use of PPEs is strictly followed as per nature of job.
6) Pull cord and Emergency switch on conveyor
7) Fire Fighting System. 8) Installation of Fire Hydrant
system
1.2 Shifting of material by mobile equipment
Dust emission , collision,
Injury to personnel 2 3 Moderate
1.3 Transportation of material in conveyors
Dustemission, Respiratory problem 2 1 Light
1.4 Storage of materials
such as coal.
Fire Personnel injury 4 4 High
1.5 Running of conveyor belt
Loose clothing of worker can get stuck in the moving parts
Catches on conveyer belt
2 2 Light
1.6 During work on conveyer belt, conveyer control room etc
Fallen structure, slippery surface, avoidance of PPE, imbalance of object or feet of worker
Fall from the height
2 2 Light
1.7 Moving conveyor
belt
Rotating parts
of conveyor
system, like
head pulley,
tail pulley
Personnel
injury 3 2 Moderate
1.8 All operational area Struck by falling object
Tools, material pieces can fall from height
2 2 Light

ADS
POINT - III
Hazard Identification and Risk Assessment (HIRA) report specific to the project activity
shall be prepared and submitted
ANNEXURE-III
P a g e - 17
2 Pellet Plant
Risk Potential Likelihood- “L” Severity – “S”
Risk Rating “RR=LxS”
Mitigation Measures
Facility / infrastructure proposed
SL Activity Hazard Risk L S RR
2.1 Pellet making
in Rotary Kiln
Heat Personnel
injury & fire 3 2 Moderate
1) Preparation of SOP and SMP and Training manuals
2) Provide adequate training to Operators
3) Conduct regular safety audits and rectify safety issue and monitor safety compliances reports
4) Ensure use of PPEs 5) Fire Hydrant system 6) On line process
monitoring system
7) CO detector
1) SOP and training manual will be prepared.
2) Periodic training to the operators 3) Safety Monitoring and Audits on
regular basis 4) Use of PPEs as per nature of job. 5) Fire Fighting System. 6) Fire Hydrant system
2.2 PCI Dust emission,
Fire
Personnel
injury 1 3 Moderate
2.3 Furnace oil
Firing system Fire Personnel
injury 2 4 Moderate
2.4 Maintenance
on ball mill Mishandling of balls & tools
Physical injury
1 3 Light
2.5 Jute storage
and jute firing in kiln
Fire Personnel injury
4 2 Moderate
2.6 Producer Gas
Firing system Fire Personnel
injury 3 3 Moderate

ADS
POINT - III
Hazard Identification and Risk Assessment (HIRA) report specific to the project activity
shall be prepared and submitted
ANNEXURE-III
P a g e - 18
3 Producer Gas Plant
Risk Potential Likelihood- “L” Severity – “S”
Risk Rating “RR=LxS”
Mitigation Measures
Facility / infrastructure Proposed
SL Activity Hazard Risk L S RR
3.1
Coal Storage and conveying
Fire due to auto combustion
Fire in coal storage
3 2 Moderate 1) Fire Hydrant system 2) Hand rail guard with
toe guard 3) Provide adequate
training to Operators
4) For high dust levels, wear: a Full-face Class P3 (Particulate) mask or an Air-line respirator.
5) For inhalation risk exists, wear: a Class P1 (Particulate) respirator.
1) Fire Hydrant system shall be installed
2) Hand rail & Toe guard will be provided
3) Availability of PPE in sufficient quantity of full-face class P3, P1 and air line respirator for high dust levels.
3.2 Slip and trip during handling
Personnel injury 2 1 Light
3.3 Coal dust emission
Respiratory problem
3 2
Moderate
3.4 Conveying of Producer Gas Fire
Personnel injury
4 3 High
3.5 Ash handling system
Ash spreading Respiratory problem due to Fly Ash
3 2 Moderate

ADS
POINT - III
Hazard Identification and Risk Assessment (HIRA) report specific to the project activity
shall be prepared and submitted
ANNEXURE-III
P a g e - 19
4 Sponge Iron Plant (DRI) Risk Potential
Likelihood- “L” Severity – “S”
Risk Rating “RR=LxS”
Mitigation Measures
Facility / infrastructure proposed
SL Activity Hazard Risk L S RR
4.1 Reduction of Iron Ore
Falling of objects Injury 1 3 Light
1) Preparation of SOP and SMP and Training manuals
2) Provide adequate training to Operators
3) Conduct regular safety audits and rectify safety issue and monitor safety compliance reports
4) Ensure use of PPEs 5) Fire Hydrant system 6) On line process
monitoring system
1) SOP and training manual shall be made
2) Periodic training shall be conducted for the operator
3) Guard shall be installed on all rotating parts
4) Safety Monitoring and Audits shall be done on regular basis
5) Use of PPEs strictly to be followed as per nature of job.
6) Fire Fighting System is placed at all strategic points and the same shall be placed accordingly for the expansion project Fire Hydrant system is placed at all strategic points and the same shall be placed accordingly for the expansion project
4.2 Failure of Conveyer Belt
Material spillage Injuries may occur
1 2 Light
4.3 Handling of Waste Gas
Fire Burn injury 2 3
Moderate

ADS
POINT - III
Hazard Identification and Risk Assessment (HIRA) report specific to the project activity
shall be prepared and submitted
ANNEXURE-III
P a g e - 20
5 Captive Power Plant (CPP) Risk Potential
Likelihood- “L” Severity – “S”
Risk Rating “RR=LxS” Mitigation Measures
Facility / infrastructure Proposed
SL Activity Hazard Risk L S RR
5.1 Boiler operation Exposure to High temperatures & Blast overpressure
Burn injury 4 4 High 1. Insulating clothing, body suits, aprons etc. of appropriate materials
2. Preparation of SOP and SMP and Training manuals
3. Firefighting system in operation
4. For high dust levels, wear: a Full-face Class P3 (Particulate) or an Air-line respirator.
5. For inhalation risk exists, wear: a Class P1 (Particulate) respirator.
6. Provide Onsite rescue equipment
7. Safety inter locking system should be provided
8. Provide sprinkler
system in turbine
generator build
9. High velocity spray system/ Automatic
Nitrogen gas flooding
system
1. Work to be done wearing a
hot protection suit and mask
SOP and training manual
shall be in practice
2. Fire Extinguisher is placed at all strategic points and the same shall be placed accordingly for the expansion project Availability of PPE in sufficient quantity of full-face class P3, P1 and airline respirator for high dust levels
3. Safety interlock system is foreseen for safe working
5.2 Steam Leakage Pipe Leakage / joint failure
Burn injury, 2 3 Moderate
5.3 Drain Fine Hot Dust
Hot dust Spillage
Burn injury 2 4 Moderate
5.4 Work in
confined spaces
Exposure to
hot dust
Burn injury 4 4 High
5.5 Operation activity of
Turbine and Generator
Fire in lube oil,
Short circuit in
control
room/switch
gear, cable galleries &
oil drum
storage
Personnel
injury and fire
4 4 High
5.6 Conveying at Ash handling plant:
Fire hazard
fire risk due to electrical short circuit or failure, overheating, ignition in accumulated coal dust
2 3 Moderate

ADS
POINT - III
Hazard Identification and Risk Assessment (HIRA) report specific to the project activity
shall be prepared and submitted
ANNEXURE-III
P a g e - 21
6 6 Steel Melting Shop (SMS) Risk Potential
Likelihood- “L” Severity – “S”
Risk Rating “RR=LxS” Mitigation Measures
Facility /
infrastructure Proposed
SL Activity Hazard Risk L S RR
6.1 Tapping of
hot metal
Contact with
hot metal
Burn injury 4 4 High 1. Follow work permit, SOP
and SMP. 2. Wear gas masks during
working in gas line
3. Firefighting system in
operation
4. Conduct regular safety audits and rectify safety
issue and monitor safety
compliance reports
5. Vital connections e.g.
water, gas, compressed
air, oxygen etc., would be cut off or regulated as per
requirement
6. Ensure personnel wear
PPE and wear hot metal
protection suit. 7. Provide adequate training
to operators
1. SOP and training manual
shall be made
2. Periodic training shall be conducted for the operator
3. Workers work on the
gas line by wearing face masks, this is also
inspected on a regular
basis. 4. Fire Extinguisher is placed
at all strategic points and the same shall be placed accordingly for the expansion project.
6.2 Working in gas pipeline
Gas leakage Gas poison , gas explosion
3 3 Moderate
6.3 Operation of
Electrical
Penal room
Electrical
Hazard
Body injury 2 2 Light
6.4 Transfer of
hot metal to
CCM
Fall of hot
metal
Burn injury 4 4 High
6.5 Operation of E.O.T crane
Hoist rope breakage in
E.O.T crane
Personal injury
3 2 Moderate
6.6 Hot metal come in
contact with
water
Spillage of hot metal
Explosion 3 4 High

ADS
POINT - III
Hazard Identification and Risk Assessment (HIRA) report specific to the project activity
shall be prepared and submitted
ANNEXURE-III
P a g e - 22
7 Rolling Mill Risk Potential
Likelihood- “L” Severity – “S”
Risk Rating “RR=LxS” Mitigation Measures
Facility / infrastructure Proposed
SL Activity Hazard Risk L S RR
7.1 Trapping
between the
rolls
Contact with
hot metal
Burn injury 3 4 High 1. Nip of rolls must be
guarded and Machine
part must be guarded
2. Lock out/tag out must be
planned
3. PPE must be provided
4. Earthing should be flame
proof
5. Energy isolation as per Work Permit.
6. High velocity spray
system/ Automatic
Nitrogen gas flooding system
7. Fire extinguisher at site.
1) Guard installed on all
rotating parts
2) Lock Out and Tag Out
is done on regular
basis.
3) Work is done wearing PPEs
4) Electrical earthing has
been done and it is also
inspected by the third
party every 3 months. 5) Energy isolation is done
as per the permit 6) .Fire Extinguisher is
placed at all strategic points and the same shall be placed accordingly for the expansion project
7.2 Electrical
power supply
Fire Injury 2 4 Moderate
7.3 Rotating
Machineries
Rotating parts Injury 2 3 Moderate

ADS
POINT - III
Hazard Identification and Risk Assessment (HIRA) report specific to the project activity
shall be prepared and submitted
ANNEXURE-III
P a g e - 23
8 Electrical System
Risk Potential Likelihood- “L” Severity – “S”
Risk Rating “RR=LxS”
Mitigation Measures
Facility / infrastructure Proposed
SL Activity Hazard Risk L S RR
8.1
Transformer and
switch yard
Fire on
transformer
Explosion of
transformer /
Pneumatic actuator
cylinders installed
nearby,Transformer
oil may splash up to
long distance if
transformer gets
exploded due to fire.
4 4 High
1) High velocity spray
system/ Automatic
Nitrogen gas flooding
system
2) Fire extinguisher at site. 3) Earthing should be flame
proof 4) PPE must be provided 5) Hand rail guard with toe
guard
1) 1.Guard installed on all
rotating parts 2) Work is done wearing a
PPE,s
3) Electrical earthing has
been done and it is also
inspected by the third party every 3 months.
4) Energy isolation is done
as per the permit 5) Fire Extinguisher is placed
at all strategic points and the same shall be placed accordingly for the expansion project
8.2 Electric shock
and
electric burn
routine work,
maintenance or
inspection of
electrical panels in
switch yard
2 3 Moderate
8.3 Slip , trip and
from the
height
during routine work,
maintenance on
switch yard
2 1 Light
8.4 Cable room fire
hazard
fire risk due to
electrical short
circuit or failure,
over heating of
cables,
2 3 Moderate
8.5 Improper ducting of
cables
electrocution causing burns
Fire 2 3 Moderate

ADS
POINT - III
Hazard Identification and Risk Assessment (HIRA) report specific to the project activity
shall be prepared and submitted
ANNEXURE-III
P a g e - 24
9 Utility System
Risk Potential Likelihood- “L”
Severity – “S” Risk Rating “RR=LxS”
Mitigation Measures
Facility / infrastructure Proposed
SL Activity Hazard Risk L S RR
9.1 Fuel Storage in Tank
Spillage or drain
is risky because
it may result in to
back fire and
consequent
damage to plant
Personnel injury
and fire
2 4 Moderate 1) 1.Fire Hydrant system
2) 2.Chemical Spillage kit
3) 3.Fire Suit
4) 4.Foam monitor with trolley
5) Follow work permit, SOP
and SMP 6) Conduct regular safety
audits and rectify safety issue and monitor safety compliance reports
7) PPE must be provided
8) Provide adequate training to Operators
9) MSDS
1) Fire Hydrant system shall be installed
2) Chemical spillage kit placed
3) .Fire Suit Placed
4) .Foam monitor Placed 5) SOP and SMP training
manual is in practice 6) Safety Monitoring and
Audits are being done on regular basis
7) Use of PPEs is strictly followed as per nature of job.
8) Periodic training is being conducted for the operator
9) Display of MSDS
9.2 Storage and
Handling of
HSD
Fire Personnel injury
and fire 2 4 Moderate
9.3 D.M. plant Fire hazard Electric Motor Short Circuit / Fire in electrical panel
2 3 Moderate
9.4 Chemical loading unloading
Chemical burn
by Spillage of sulphuric acid and caustic soda lye during unloading, overflow, Damage on storage tank or pipe line
2 3 Moderate

ADS POINT - III
Hazard Identification and Risk Assessment (HIRA) report specific to the project activity
shall be prepared and submitted
ANNEXURE-III
P a g e - 25
7) CONSEQUENCE ANALYSIS
As discussed in above sections, adequate risk assessment measures for process shall be considered to say that the Proposed expansion New Project Activity is not likely to cause any significant risk to onsite & environment.
Suitable Mitigation Measures will be taken by Bravo Sponge iron pvt Ltd. to ensure safety.
In the event of disaster onsite and all the emergency planning procedures are to be followed so as to minimize the impact on working personnel, plant surrounding and environment.
The hazardous event scenarios likely to make the significant contribution to the risk of potential fatalities are enlisted in Table 3.11. The risks to people at plant site are categorized as “On-site” risks while the risks to communities outside the plant premises is categorized as “Off-site” risks.
Table 3.11: Hazardous Events Contributing to Risk and their Risk Ranking Consequence
of
significant
damage
(A) (B) C = A*B
SL Hazardous event Severity*
(1=least severe; 5=most severe)
Likelihood* (1=least likely; 5=most likely)
RISK
RANK
1. Onsite vehicle impact on
personnel Potential for
single
fatalities,
onsite impact only
4 1 4
2. Entrapment/struck by Machinery
4 1 4
3. Fall from heights 5 1 5
4. Electrocution 2 2 4
5. Hot metal splashing in SMS Potential for
multiple
fatalities, onsite impact
only
4 2 8
6. Breakage of Wire rope of EOT crane
4 1 4
7. HSD/FO storage tank explosion 3 1 3
8. Bursting of pressure parts containing steam
5 1 5
*based on Historical survey of similar facilities
The above risk ranking indicates that although the most severe consequences will be
due to Hot metal splashing in SMS and bursting of pressure parts in power plant,
their chances of occurrences are low due to implementation of better safety features
in the installations and constant monitoring of vessel/pipework with regular repair
and maintenance, and hence proposed project facilities have low levels of risk..

ADS POINT - III
Hazard Identification and Risk Assessment (HIRA) report specific to the project activity
shall be prepared and submitted
ANNEXURE-III
P a g e - 26
8) SUMMARY & CONCLUSIONS OF RISK ASSESSMENT
I. The Plant has lower risk potential than those industries dealing with toxic and flammable
chemicals. Off-site people are not exposed to any dangers; hence the societal risk is insignificant.
II. The safety interlocks and concerned instruments will be essential part of process equipment
during engineering and procurement of facilities.
III. The plant structures shall be designed for cyclone floods and seismic events to prevent structural
collapse and integrity of weather (water) proofing for storage of dangerous goods.
IV. With proper Standard Operating Practice (SOP) and Standard Maintenance Procedure (SMP) along
with use of adequate PPEs will mitigate almost all the risk. However the most severe consequences
will be due to Hot metal splashing in SMS and bursting of pressure parts in power plant, their chances of occurrences are low due to implementation of better safety features in the installations
and constant monitoring of vessel/pipework with regular repair and maintenance, and hence
proposed project facilities have low levels of risk.
V. Portable gas detectors shall be provided within the site in order to facilitate manual gas leak
monitoring and regular leakage checks. Monitoring of gas leak shall be ensured for immediate identification of leaks and subsequent implementation of action plan to prevent development of
any hazardous situation.
VI. Further, all major units / equipment shall be provided with the following safety facilities:.
Smoke /fire detection and alarm system
Fire hydrant system
Fire extinguisher - Foam/DCP/ABC/CO2
Water fog and sprinkler system
Mobile fire-fighting equipment
First-aid appliances
VII. Personal Protective Equipment (PPEs) shall be provided for additional protection to workers
exposed to workplace hazards in conjunction with other facility controls and safety systems.
VIII. Restricted access to unauthorized person to those area which is prone to hazard such as Switch
yard, Electrical control rooms, Turbine Generator building etc. Isolate people from load
carrying/mechanical handling systems, vehicle traffic and storage and
stacking locations.
IX. The onsite Emergency Plan will be integrated with the district’s Offsite Emergency Plan for
comprehensive management of emergencies in minimum response time and maximum rescue
results in an event of a disaster /emergency.
X. Co-ordination with nearby industries will also be maintained for creating unified Disaster
management resource pool to be utilized in case of any disaster occurrence.
XI. Security of facility to prevent unauthorized access to plant, entry of prohibited items and
control of onsite traffic; and Development of emergency response management systems
commensurate with site specific hazards and risks (fire, explosion, rescue and first aid).
XII. Regular safety audits shall be undertaken to ensure that hazards are clearly identified and
risk-control measures are maintained.
XIII. On the basis of the preliminary assessment, rupees 479 lacs have been foreseen for disaster
management plan at project stage.

ADS POINT - III
Hazard Identification and Risk Assessment (HIRA) report specific to the project activity
shall be prepared and submitted
ANNEXURE-III
P a g e - 27
9) ON SITE EMERGENCY PLAN
The on-site emergency plan relates to the laid-down and well-practiced procedure after taking care of all design based precautionary measures for risk control. This plan is aimed for tackling any emergency situation, if arises.
An elaborate and well-documented Disaster Management Plan covering existing risk and hazard is already in place and the same is presented as Appendix 3.1. This shall be upgraded and extended to the units under the expansion program of BRAVO.

M/s Bravo Sponge iron Pvt. Limited,
Vill: Mahuda, P.O: Raghunathpur, District: Purulia, (West Bengal) Page No
1
Disaster Management Plan
Appendix 3.1
Introduction:
The project site of M/s Bravo Sponge Iron Pvt. Limited (BSIPL) is located at Village-Mahuda, PO-Rukni, District-Purulia in the state of West Bengal having Latitude: 23° 32’ 53.25’’ N & Longitude: 86° 32’ 49.45’’ E.
Project site of BSIPL is well connected by road and rail. The nearest railway station is Rukni which about 1 km from project site
The last two decades have seen many technological innovations that have contributed
to automated, more reliable and cost effective safety management techniques, equipment and systems. Responsiveness & competence needs to be created among the Indian industry about tools & methodologies of safety techniques to understand and mitigate the hazards they are dealing with on a day-to-day basis, and create a safe working environment, for its own machinery, employees and community around. The code of practice on safety management system will be very useful for engineering industries in order to eliminate hazards and for providing safe work environment to employees.
The safety and protection of people, equipment and the environment is a serious concern in the Engineering industries. Many industries have recognized the advantages of Safe Work Environment and are progressively adopting Safety Management System to prevent hazardous events, avoid production & manpower losses and other fallouts associated with industrial accidents. Safety management system also assists industries to enhance employee knowledge of operations, improve technical procedures, maintain accurate process safety information and increase overall facility productivity.
GENERAL INFORMATION ABOUT THE FACTORY:
M/s. Bravo Sponge Iron Private Limited (BSIPL) Ltd. was originally incorporated on 14th February 1997 and started making sponge iron since 2003. In June 2015 it has been taken over by Shakambhari Group who is having a vast experience in the line of steel manufacturing.
Presently, the company is having following facilities in operation:
• 3 x 100 TPD DRI kilns
• 1 x 95 TPD DRI Kiln
• 2 x 15 T Induction Furnace with CCM
• 10 MW capacity power Plant
Some more units are under implementation, for which necessary Environmental Clearance is already available. Besides, the company has proposed to install some new units on the available land within the existing plant premises.
The overall project scenario is presented in the following table.

M/s Bravo Sponge iron Pvt. Limited,
Vill: Mahuda, P.O: Raghunathpur, District: Purulia, (West Bengal) Page No
2 Disaster Management Plan
Appendix 3.1
OVERALL PROJECT SCENARIO
SL. No.
UNIT UNITS AS PER
STATE CLEARANCE
UNITS AS PER EC FROM
MoEF&CC DATED
18.04.2017
TOTAL UNITS
UNITS UNDER OPERATION
BALANCE UNITS AS PER EC
PROPOSED UNITS
FINAL CONFIGURATION
(STATE + MoEF&CC
CLEARANCE)
UNDER IMPLEMENTION
TO BE IMPLEMENTED
1
Pellet Plant with Grinding Facility
- - - - - - 2 X 0.85 MTPA
1.7 MTPA
2 Sponge Iron Plant
1X100 TPD (as per NOC dated
5.12.2002) + 1x95 TPD (as per State EC dated 24.03.2008)
2X100 TPD 1X100 TPD + 1x95 TPD + 2X100 TPD
1X100 TPD + 1x95 TPD + 2X100 TPD
- - 1 X 350 TPD
745 TPD (1X100 TPD + 1x95 TPD + 2X100 TPD
+ 1X350 TPD)
3
SMS (Induction Furnace with CCM)
- 600 TPD (4 x 15 T)
600 TPD (4 x 15 T)
300 TPD (2 x 15 T)
150 TPD (1 x 15 T)
150 TPD (1 X 15T)
750 TPD (3 x 25T)
1350 TPD (4 x 15 T +
3 x 25T)
4 Rolling Mill - 600 TPD 600 TPD - - 600 TPD*
Capacity revision
from approved
600 TPD* to 1000 TPD
1000 TPD

M/s Bravo Sponge iron Pvt. Limited,
Vill: Mahuda, P.O: Raghunathpur, District: Purulia, (West Bengal) Page No
3 Disaster Management Plan
Appendix 3.1
5 Captive Power Plant
-
18 MW (8 MW
WHRB + 10 MW AFBC)
18 MW (8 MW WHRB + 10 MW AFBC)
10 MW (4x10 TPH
WHRB + 1X20 TPH AFBC #)
-
8 MW (1X20 TPH
Proposed AFBC + #Balance 12 TPH
Steam from existing AFBC)
7 MW WHRB 25 MW
(15 MW WHRB + 10 MW AFBC)
6 Producer Gas Plant
- - - - - - 12 x 4000 Nm3/hr
48,000 Nm3/hr

M/s Bravo Sponge iron Pvt. Limited,
Vill: Mahuda, P.O: Raghunathpur, District: Purulia, (West Bengal) Page No
4
Disaster Management Plan
Appendix 3.1
The company has already prepared a full-fledged Disaster Management Plant (DMP) for its existing plant, which is elaborated in the following sections. The existing DMP will be further extended to take care of the future requirement after the implementation of the proposed project. A budget for the DMP for the proposed project has been prepared, which has been presented at the end of this annexure.
The overall organizational structure of the company is presented below:
Organizational Structure:
CMD
VP-Technical
ED-Corporate
DGM-DRI
GM-CPP
AGM-SMS
GM-Commercial
GM-Civil
GM-HR & Admin
Mgr-HR &
Admin
I/c-RMP
Mgr-Operation
Excise &
Taxation
Mgr-CPP
Quality Control
Mgr-IR & Admin
AGM-EHS
Mgr-Elect.
Welfare
CSR/CER
AGM-
A/c
Mgr-Maint.
In-charge-Maint.
In-charge-Elect.
Shift-In-charge
Operators & Tech.
Mgr-Operation
Surveyor
Drawing -Design
GM-Engineering
Tech, & Others
In-charge DM Plant
In-charge-Maint
.
In-charge-Elect.
Shift-In-charge
Operators & Tech.
AGM-Civil
Engineer-Civil
Supervisor
Purchase & Stores
Sr. Mgr-Store
Officer-Stor
Purchase Officer
Inventory
Issue Section
Store Staffs
IT Engineer
Structural
Survey
Fire & Safety Officers
Officer-Horticulture
Medical Staffs
Security
Liasion
Supervisor/staffs

M/s Bravo Sponge iron Pvt. Limited,
Vill: Mahuda, P.O: Raghunathpur, District: Purulia, (West Bengal) Page No
5
Disaster Management Plan
Appendix 3.1
Man Power
Maximum number of persons available in the plant at any point of time is as follows:
Persons working under various shifts
SL. NO. SHIFT PERIOD AVERAGE EMPLOYMENT/DAY
1. A 06:00-14:00 Hrs 75
2. B 14:00-22:00 Hrs 75
3. C 22:00-06:00 Hrs 75
4. R 75
5. G 09:00-18:00 Hrs
(Lunch Break: 13:00-14:00 Hrs) 50
Total 350
Depending on requirements employees are called in different shifts and few employees are called on duty during national/festival holidays and off days.
Nature of Hazards in BSIPL
A steel industry is hazardous by its very nature. The nature of various hazards in BSIPL Plant is detailed below:
Hazards Source
Fire Hazard Spillage of Fuel Oil,
Explosion due to spillage of hot metal
coming in contact with water
Spillage/Transfer of hot metal, or liquid steel
Heat radiation due to hot metal
handling
Spillage of liquid metal, hot steel and hot slag
Accidents due to failure of Material
Handling (lifting & carrying)
Equipment
Connected with all Material Handling Equipments
through EOT cranes
Accidents due to failure of high pressure steam, water or oil lines
AFBC and WHR Boilers

M/s Bravo Sponge iron Pvt. Limited,
Vill: Mahuda, P.O: Raghunathpur, District: Purulia, (West Bengal) Page No
6
Disaster Management Plan
Appendix 3.1
PROCESS DESCRIPTION (in brief)
DRI
Sponge iron is manufactured through the coal-based route in which iron ore in converted into Sponge Iron or directly reduced iron in a rotary kiln using coal both as reductant and fuel.
Rotary kiln unit comprises of raw materials storage bins, rotary kiln, rotary cooler, product screening and magnetic separation units, After Burning Chamber and
in-plant dedusting system.
Iron ore and coal, after proper sizing in the respective crushing and screening stations as well as sized dolomites are fed to the raw material day bins for kiln.
With the rotation of the kiln, the charge moves down the slope and the surface of material is exposed to heat and reducing atmosphere. The reduction from iron oxide to iron occurs by a gradual removal of oxygen at various temperatures under the controlled reducing atmosphere giving rise to various intermediate oxides.
Hot sponge iron is discharged from the kiln-discharge end and taken into the rotary cooler. The sponge iron after cooling is discharged through the cooler discharged chute into a heat resistant belt conveyor and carried into the product processing building. The product (Magnetic in nature) is screened and separated from char, which is not magnetic.
The gas generated, during the process, contains fine carbon particles, carbon monoxide ash dust which are separated and waste heat associated with gas is recovered in WHRB from which power is generated.
STEEL MELTING SHOP (SMS):
In the SMS section scrap and pig iron are charged in Induction Furnace along with DRI in which heat is applied by induction heating and melted by electrical eddy current in a crucible placed in a water cooled alternating current solenoid coil. After achieving the desired composition and temperature, slag is scooped out from the top of hot metal and hot metal is poured into transfer ladle crucible and sent to CCM after addition of requisite amount of Ferro alloys. Induction furnaces are provided with
matching billet casters.
In CCM liquid steel is casted to billets.
ATMOSPHERIC FLUIDIZED BED COMBUSTION BOILER:
In AFBC boiler coal is crushed to a size of 1 — 10 mm depending on the rank of coal, type of fuel feed and fed into the combustion chamber. The atmospheric air, which acts as both the fluidization air and combustion air, is delivered at a pressure and flows through the bed after being preheated by the exhaust flue gases. The velocity of fluidizing air is in the range of 1.2 to 3.7 m /sec. The rate at which air is blown through the bed determines the amount of fuel that can take part in reaction.

M/s Bravo Sponge iron Pvt. Limited,
Vill: Mahuda, P.O: Raghunathpur, District: Purulia, (West Bengal) Page No
7
Disaster Management Plan
Appendix 3.1
Almost in all AFBC bubbling bed boilers use in -bed evaporator tubes in the bed of limestone, sand and fuel for extracting the heat from the bed to maintain the bed temperature. The bed depth is usually 0.9 m to 1.5 m deep and the pressure drop averages about 10mm of water per cm of bed depth.
Very little material leaves the bubbling bed — only about 2 to 4 kg of solid is recycled per ton of fuel burned (AFBC). The combustion gases pass over the super heater sections of the boiler, flow past the economizer, the dust collectors and the air pre heaters before being exhausted to atmosphere. The main special feature of atmospheric fluidized bed combustion is the constraint imposed by the relatively narrow temperature range within which the bed must be operated. With coal, there is risk of clinker formation in the bed if the temperature exceeds 950°C and loss of combustion efficiency if the temperature falls below 800°C. For efficient sulphur retention, the temperature should be in the range of 800°C to 850 °C.
AFBC at Bravo generates super-heated steam at 110 kg/cm² and 540 °C
WASTE HEAT RECOVERY BOILER:
Production of sponge iron in DRI kiln generates huge quantities of hot flue gases carrying considerable sensible heat. The energy content of these gases are effectively used to generate electric power as well as steam for meeting various process requirements. Thus a WHRB (Waste Heat Recovery Boiler) power plant is an ideally suited proposition to effectively make use of this waste gas. This WHRB Power plant not only make the plant independent of external source of electric power to some extent but also result in energy conservation and environment protection. The waste heat from 04 nos. DRI Kilns bearing temperature approx. 950ْc taken in to WHRB attached with respective kilns for heat
recovery and steam generation. These 04 nos. of WHRB generate approx. 32 ton heat and 08 MW power for further use in plant operation.
INVENTORY OF RAW MATERIALS
The inventories of raw materials used in the process are listed in the table below, which gives details of material stored. It contains maximum one month storage for each substance in process and transferred to day tanks to meet daily consumption, it is because day tanks are connected to unit where it is consumed.
Maximum storage of capacity of raw materials
SL. NO.
Operating Unit
RAW MATERIALS MAX. STORAGE CAPACITY (Metric Tons/Month)
1.
Sponge Iron Plant
Iron Ore 15,016
Coal 12,427
Lime Stone 621

M/s Bravo Sponge iron Pvt. Limited,
Vill: Mahuda, P.O: Raghunathpur, District: Purulia, (West Bengal) Page No
8
Disaster Management Plan
Appendix 3.1
2.
Induction Furnace
Sponge Iron 10356
Pig iron 1643
Scrap 821
Ferro Alloy 180
3.
Captive Power Plant (WHRB based)
Waste heat recovery type boilers are installed for electrical power generation, No raw material required.
4.
Captive Power Plant (AFBC boiler based)
Char @ 22% ash 2485
coal fines @25% ash 16782
INVENTORY OF HAZARDOUS SUBSTANCES:
The inventory of Hazardous materials is mentioned below:
Sl No. Name Of Hazardous Substances Maximum Storage Capacity
1 HSD for AFBC and DRI kiln cold start up (Above Ground, fenced as per norms of explosive Authority)
1 X 12 KL
ONSITE EMERGENCY PLAN
Onsite and Offsite disaster preparedness and emergency management plan including risk assessment and damage control.
In a steel plant, the steel making process involves a number of hazardous processes starting from raw material handling, melting of iron ore, and converting iron into steel till the finished products. Also, the by-product plants, captive power plant, utilities & other
auxiliary plants use considerable amount of combustible materials and these materials are stored in bulk storages like tanks, cylinders, drums, and gas holders etc., installed in the plant posing major risks.
Bursting of high pressure steam lines or BFW lines can also cause series of accidents and to prevent that periodic NDT and maintaining record timely action is necessary.
The detailed study with concern to various possible hazards and their associated processes & equipment’s has been identified. The list of these identified hazardous equipment in the plant is given in the following pages. The potential hazards from the above identified equipment and from the various hazardous operations/processes in the plant have been analyzed and the possible causes for occurrence of such hazards, likely consequences and the remedial action required are recommended.

M/s Bravo Sponge iron Pvt. Limited,
Vill: Mahuda, P.O: Raghunathpur, District: Purulia, (West Bengal) Page No
9
Disaster Management Plan
Appendix 3.1
Emergency Action Plan:
Emergency Planning begins with the identification and assessment of the principal hazards which are normally fire, explosion and toxic release. With the growing complexity of the process plants, more systematic and searching methods for risk identification and quantification have been developed over the years. Generally the emergencies that occur in process plants are classified into two categories. The one whose effects remain within the boundary limits of the plant is known as On-Site Emergency and the one where the effects go beyond the boundary limits is known as Off-Site Emergency. In BSIPL, the requirements of the On -Site Emergency Plan are addressed due to fire hazard only.
This On-Site Emergency Plan is prepared for Bravo Sponge Iron Pvt. Ltd in accordance with the guidelines provided by the Ministry of Environment & Forests & Climate Change (MoEF & CC), Govt. of India, covering the various hazardous processes and the bulk storages of hazardous materials, toxic gases etc., in different departments.
HAZARD IDENTIFICATION AND DETAILS OF PROPOSED SAFETY SYSTEMS
Identification of Hazards
Hazard is in fact the characteristics of a system/plant/storage that presents potential for an accident and risk is the probability of occurrence of hazard. Hence hazard identification is of prime significance for the quantification of risk and for cost -effective control of accidents in any industrial installation. Various techniques of predictive hazard evaluation and quantitative risk analysis suggest identification of hazard has very important role in estimation of probability of an undesired event and its consequences on the basis of risk quantification in terms
of damage to personnel, property and environment.
Hazards are mostly manifested in the form of fire/ explosion/ toxic release. Each anticipated hazard scenario associated in the unit is described along with its assessment of impact on plant and locality in the following table:

M/s Bravo Sponge iron Pvt. Limited,
Vill: Mahuda, P.O: Raghunathpur, District: Purulia, (West Bengal) Page No
10
Disaster Management Plan
Appendix 3.1
ANTICIPATED HAZARD SCENARIO:
IDENTIFICATION OF MOST CREDIBLE HAZARD SCENARIOS
All the anticipated hazard scenarios associated with the factory (as listed above) are critically analyzed and identified credible scenario is pool fire/ball fire if the HSD comes in contact with flame or it may auto ignite at 225 deg. C temperature. Flash point of HSD is 660C and it is not a flammable liquid. Tank fire spreads vertically taking a conical shape due to rush of air from all directions,
Since the suitable firefighting system are provided to control emergency situations. On the basis of above consideration, the pool fire due to fire hazard in the storage tank is not considered as most credible scenario.
Type of Hazard
Areas Preventive / Mitigation measures
Pool fire/ ball fire
HSD Storage Tank
Dyke wall is provided around the HSD tank. Regular monitoring being done to check out the leakage/spillage if any. Fire protection measures (Foam Trolley, DCP cylinder and hydrant system) are provided. Area is as “No Smoking Zone”.
Dust Raw material handling & storage yard
Raw materials are transported in the trucks with tarpaulin covers. Raw materials are kept on concreted land with tarpaulin cover. Water sprinkling facility is provided for dust suppression during material handling in the yard. Conveyor belts used for raw material feeding and carrying finished goods are properly covered. PPEs like nose mask, safety helmet, safety shoes and safety goggles are provided to persons, deployed for working in this area.
Noise Turbine Generator hall, Blower house, Air compressor house, DG & Pump houses.
Equipment’s are suitably covered in building with adequate ventilation to attenuate the noise level against outside exposure and area keeps generally unmanned, however working personnel are provided with ear plugs and ear muffs during inspections
Heat Exposure
DRI, SMS & CCP
Providing proper PPE like leg guards with shoes, Face shield, leather hand gloves, Leather Aprons, helmets etc. Thermal insulation for steam line. Providing fans, air blower and showers etc.
Acid exposure
DM Plant/ Laboratory
Acid and Base used are being kept on isolated place with proper leveling. Personnel handling these chemical being well equipped with PPEs like rubber hand gloves, apron, nose mask, face shield/safety goggles, safety shoes etc. Once any person gets exposed to acid or base the affected parts are thoroughly washed with cold water and necessary first/medical aid is given to the victim.

M/s Bravo Sponge iron Pvt. Limited,
Vill: Mahuda, P.O: Raghunathpur, District: Purulia, (West Bengal) Page No
11
Disaster Management Plan
Appendix 3.1
Tank fire may be caused by lightening, but when tank leaks or overflows due to mal operation of instruments or negligence of operator and liquid gets ignited by chance; then this may be treated as a large pool fire and dealt as a common fire.
But in case of disaster due to natural calamities a disaster management team will come to action.
KEY PERSONNEL Key personnel are the directed and nominated people, each having specified responsibilities as a part of a coordinated plan. The main key personnel are:
Works Incident Controller.
Site Incident Controller.
Works Main Controller.
Other key personnel who have the key Role to play are senior personnel from all sections e.g. production, maintenance, laboratory, medical, transport, safety, security etc.
Role of Key Persons
Works Incident Controller (WIC) The Works Incident Controllers are the departmental heads of respective divisions for DRI, CPP and SMS whose duties include the direction of the efforts and lead to onsite emergency response team to control the situation. Since in the initial stages of emergency, the Works Incident Controller may be called on to take decisions involving the operations of other plants, it is necessary for the person selected to have a thorough knowledge of the overall works situation.
The person working as shift in-charge/manager i. e., an individual having overall control of the works processes for a shift shall work in the authority of WIC when the Works Incident Controller (WIC) may be off-site or affected by the emergency. Site Incident Controller (SIC)
He will be available at the factory or in the colony nearby. At any point of time and on being informed about an accident, he has to:
Intimate the Works Main Controller (WMC) and proceed to the emergency site.
Take the necessary information from Combat Team Leader (CTL), assess the situation and call Rescue Team Leader (RTL) and Auxiliary Team Leader (ATL).
Inform Works Main Controller (WMC) regarding the situation.

M/s Bravo Sponge iron Pvt. Limited,
Vill: Mahuda, P.O: Raghunathpur, District: Purulia, (West Bengal) Page No
12
Disaster Management Plan
Appendix 3.1
Take necessary steps and provide guidance to Combat Team, Rescue Team, and Auxiliary Team Leaders to mitigate the emergency situation.
Examine for major emergency shutdown operation activities, decide safe escape route and announce for evacuation to Assembly Point.
Inform Works Main Controller (WMC) about the status of the situation at regular intervals.
Works Main Controller (WMC)
The Works Main Controller is the Vice President of the unit and is generally available in the factory or reside in the nearby except on tours. On emergency, he can reach work site at any odd hour within 45 minutes time. In his absence, GM at Plant shall take up his charge as Works Main Controller (WMC)
In the major situation, decisions will have to be taken by Works Main Controller (WMC) by collaboration with the senior managers at works which may affect the whole or a substantial part of the works and senior officers of the outside services as per site situation. After getting informed of an emergency situation WMC will rush to the emergency site,
collect all information from SIC and
Decide if emergency is to be declared and advise Site Incident Controller (SIC) accordingly and reach Emergency Control Room (ECR).
Take decision to shut-down the plant if necessary to take up repair and other combating measures.
Advise Rescue Team Leader (RTL)/Security Gate to blow the siren with appropriate code for declaration of emergency.
Emergency Siren
Twenty Seconds with a pause of Five Seconds for 5 times
Advice (Auxiliary Team Leader) ATL for communication to statutory authorities and for mutual aid as required.
Through Auxiliary Team Leader (ATL) shall ensure constant communication to statutory authorities and to mutual aid partners as required.
Maintain continuous communication with Site Incident Controller (SIC) to review the situation and assess the possible course of action for emergency operations.
To declare normalcy at the end of operation and advise Rescue Team Leader (RTL)/Security Gate to blow “all clear siren”
All Clear Siren will be blown for 1 minute continuously.
Ensure the record keeping of emergency operations chronologically.

M/s Bravo Sponge iron Pvt. Limited,
Vill: Mahuda, P.O: Raghunathpur, District: Purulia, (West Bengal) Page No
13
Disaster Management Plan
Appendix 3.1
Essential Personnel The Works Incident Controller/Main Controller will be supported by a Task Force of suitably trained people. The nature of essential works to be performed is:
Shutdown of Plants
Isolation, repairing of the affected equipment /pipeline etc.
First Aid, and removal of the injured persons to hospital.
COMBAT TEAM LEADER
He is the leader to attend to the emergency and is available in the factory or in the colony at any instant.
On being informed about an accident, he has to:
Immediately rush to the site and lead the rescue team to control the situation.
Inform Site incident controller (SIC) about the incident and request him to rush to the spot.
Give the necessary instructions to the rescue team to combat the situation
Co-ordinate the activities of team members and combat the emergency, so as to eliminate the root cause of the hazard.
To arrest the leakage and spillage from various equipment, shut down the concerned equipment.
Take necessary action to remove unwanted persons from the site of the incident.
Keep informed about the developments to Site Incident Controller (SIC).
RESCUE TEAM LEADER
He is the person who conducts rescue operations and should be available at any
instant. On receiving the information about the incident he has to:
Rush to site of emergency through safe route.
Ensure presence of all his team members, availability of firefighting facilities and take necessary action to arrest the fires/leakage of gas.
Arrange for safe escape of entrapped persons.
Make necessary arrangements to send the affected persons for immediately medical attention through the medical officer.
Search for the missing persons on the basis of role call taken by Auxiliary team leader (ATL).
Give the feedback to the site incident controller (SIC) about the developments.

M/s Bravo Sponge iron Pvt. Limited,
Vill: Mahuda, P.O: Raghunathpur, District: Purulia, (West Bengal) Page No
14
Disaster Management Plan
Appendix 3.1
AUXILIARY TEAM LEADER
He is the communication manager for the crisis management. On being informed of the emergency, he should proceed to Emergency Control Room (ECR) and:
Keep in constant touch with works main controller (WMC) and Site Incident Controller (SIC).
Inform the Statutory Authorities and District Administration.
Communicate to mutual Aid Partners, Fire service stations at Raghunathpur.
Send communications to District Hospital Purulia for rendering services.
Inform the relatives of causalities and send them to their residence or hospital as the case may be.
Take care of visit of the authorities to the Emergency site.
Give feed back to work main controller (WMC) about the status with respect to his areas of activities.
Action Plan for Risk and Disaster Management
STEP
NO INITIATOR ACTION TO TAKE
1. The person noticing the emergency
Inform the Security Gate and concerned Shift-in —charge immediately. Shift-in-charge will inform immediately to Combat Team Leader of concerned area.
2. Combat team Leader (CTL)
Inform Site Incident Controller (SIC) and rush to spot and organize his team.
Take charge of the situation, arrange for firefighting and medical first-aid available at site.
To start combating, shut-down equipments, arrest the leakage of gas/fire.
3. Site Incident
Controller (SIC)
Inform works Main Controller (WMC) and rush to emergency site.
Discuss with Combat Team Leader (CTL), assesses the situation and call the Rescue Team Leader (RTL) & Auxiliary Team Leader (ATL).
Organize the Rescue Team and Auxiliary Team and send the rescue Team to site.
Arrange to evacuate the unwanted persons and call for additional help.
Pass information to the works main controller (WMC) periodically about the position at site.

M/s Bravo Sponge iron Pvt. Limited,
Vill: Mahuda, P.O: Raghunathpur, District: Purulia, (West Bengal) Page No
15
Disaster Management Plan
Appendix 3.1
4. Works main Controller
(WMC)
Rush to emergency site and observe the ongoing activities.
Take stock of the situation in consultation with the SIC.
Move to Emergency Control Room.
Take decision on declaration of emergency.
Advise Auxiliary Team Leader to inform the statutory authorities and seek help of mutual aid from partners as required.
Decide on declaration of cessation of emergency.
Ensure that the emergency operations are recorded chronologically.
5. Rescue Team Leader (RTL)
Consult with Site incident controller (SIC) and organize his team with amenities to arrest firefighting and medical treatment.
Rush to Emergency Site through safe route along with the team members.
Arrange to set off the fire by firefighting equipments and hydrant points to arrest the fire or to evacuate the area.
Shift the injured persons to hospital by ambulance after providing necessary first aid.
To inform the auxiliary team Leader for necessary help from mutual aid Partners.
6. Auxiliary Team
(ATL)
On being directed by works main Controller (WMC) informs about the emergency to statutory authorities.
Seek help of Mutual Aid partners and Coordinate with Mutual Aid partners to render their services.
Arrange to inform the relatives of casualties.
Take care of visit of the authorities to the Emergency site.
7. Team members Each of the team members should follow the instruction of
concerned team leader to mitigate the emergency.
Salient Hour Command Structure
The Senior Officers/ Key Persons of the plant remain during day time i.e. 8A.M. to 8 P.M.. Hence the timing of 8P.M. to 8A.M. is considered as silent hour that to
10P.M. to 8A.M. is the crucial time. Still each and every unit/section of the plant is headed by shift in charge in the rank of Officer, Engineer or Sr. Engineer or Asst. Manager, who shall be responsible for handling the emergency. The other supporting/services and emergency sections like Fire Service, Ambulance, Security, Personnel, Water Supply, Transport departments etc. are also running for 24 hours shift wise with shift in charge and crew to handle emergency during the silent hour till main command personnel arrives. However, most of the key persons of the main command structure reside in nearby area and can reach within minimum time.
The command structure of the silent hour shall be same as during normal hour, however, during the silent hour, the operation Shift-in charge of the concerned area where the fire or leakage of gas has taken place, shall act as SIC-in —charge, till the arrival of actual designation members.

M/s Bravo Sponge iron Pvt. Limited,
Vill: Mahuda, P.O: Raghunathpur, District: Purulia, (West Bengal) Page No
16
Disaster Management Plan
Appendix 3.1
ACTIVATION & CLOSING PROCEDURE FOR ON-SITE EMERGENCY ACTIVATION
PROCEDURE
The person noticing the incident of fire or leakage of gas, shall inform about the location & nature of fire to the combat team Leader (CTL), security Gate and concerned Shift-in-charge.
Combat team Leader (CTL) shall inform site incident controller (SIC) and shall rush to the site immediately. He shall arrange for firefighting and first aid available at site. He shall arrange to take necessary steps to eliminate the root cause of fire.
Site incident controller (SIC) on getting information shall inform the WMC and reach the site at the earliest. He shall take over the charge and shall direct Rescue Team Leader (RTL)) to carry out rescue operations including firefighting and medical attention. Site incident controller (SIC) shall co-ordinate with Combat team leader (CTL) to eliminate the root cause of fire
Work main controller (WMC), on arrival at site shall take stock of the situation from site incident controller (SIC) and then rush to emergency control room (ECR) to declare emergency on the basis of assessment made by (Site incident controller (SIC). He shall give direction to the security gate/ (Rescue Team Leader) RTL to activate siren.
Two Minutes with a pause of five seconds for 3 times for fire Accident.
Three Minutes with a pause of five seconds for 5 times for leakage of gas.
Rescue Team Leader (RTL) shall mobilize fire-fighting and medical resources to site and shall assist (Site incident Controller) SIC.
Auxiliary Team Leader (ATL) shall take charge of Emergency Control Room (ECR), shall ensure smooth operation of ECR and shall inform relatives of casualties. Informs mutual Aid partners and ensures their arrival at site if required.
Auxiliary Team Leader (ATL) informs statutory authorities and district administration regarding emergency suitably and coordinates their visit at site.
Works main controller (WMC) coordinates and keeps the track of all the activities at site and off the site and arranges the recording of the activities in a chronological manner for review of the Onsite emergency Plan.
Facilities Available For On-Site Emergency Plan:
Assembly Point
In any emergency it will be necessary to evacuate people from affected zones or the zones likely to be affected, to a safer place. Safer places are identified and designated as Assembly Points. Taking the area and hazard zones into consideration four assembly points have been marked in four different areas these are:
1- Near Administrative Building (Assembly Point-1)
2- Near DRI & RMP Area (Assembly Point-2)
3- Near SMS Area (Assembly Point-3)

M/s Bravo Sponge iron Pvt. Limited,
Vill: Mahuda, P.O: Raghunathpur, District: Purulia, (West Bengal) Page No
17
Disaster Management Plan
Appendix 3.1
4- Near Power Plant Area (Assembly Point-4)
Above the points are well connectable to the plant road and facilities like drinking water, temporary shelter and first aid is available there. These points are displayed at different places inside plant and near administrative building.
(a) Escape routes:
Escape routes are those that, allow reasonably safe passage of persons from the work area to assembly point during emergency situation. These routes would be different depending on wind direction, Fire and explosion scenario. Escape routes are ear marked on the drawings as well as on the routes, which will facilitate all for safe
evacuation.
(b) Emergency Control Room (ECR):
The emergency Control Room is a place from which all emergency management operation are directed and coordinated. Also it is the place from where all communication will be established, with outside agencies and district authority also.
Facilities Available at ECR:
• Plant general Layout, ear marked with hazard zone, Assembly points and escape routes.
• List of working personnel in various shifts and general shift.
• Mobile telephone Nos., of emergency command structure personnel.
• Emergency command structure.
• Rhythmical siren code for different emergency situation.
• Relevant material safety data sheet.
• Emergency Control Room Register.
• First Aid Box with antidotes.
• Required personal protective equipment’s with self-carrying breathing apparatus.
Facilities Available
Fire Hydrant System
Fire hydrant system is in place connected with fire pumps to maintain the pressure of 7Kg/cm². In case of power failure, fire pumps are operated through DG set connection. Diesel pump is also in place to operate hydrant system as per requirement. Fire pumps are connected with water storage tank of 2800M³ capacity to mitigate the water requirement for firefighting. Fire Extinguishers Required types of fire extinguishers are provided at different locations of the plant.
Fire Buckets
Fire buckets filled with dry sand are provided in different locations of the plant.

M/s Bravo Sponge iron Pvt. Limited,
Vill: Mahuda, P.O: Raghunathpur, District: Purulia, (West Bengal) Page No
18
Disaster Management Plan
Appendix 3.1
Siren Company Has Siren/ hooter arrangement, which can be activated manually during fire related emergency. Communication Public address system and EPABX telephone are available for effective communication inside the plant. Telephone directory is available in all the departments. Dispensary An organized First-aid centre with ambulance, stretchers, oxygen cylinder etc. is
placed inside the factory. The First-aid centre is manned by one Doctor/pharmacists, and one attendant. An external Ambulance service is hired to meet emergency situation. The first-aid center is manned round the clock. In the case of emergency, affected employees are being referred to nearby Govt. hospital at Salka or Raghunathpur as required and in serious case to the hospital tied up with the company.
First Aid Box Company has provided First Aid boxes with required first aid medicines at different locations inside the plant to address minor injuries. First aid boxes are checked by the pharmacists once in a month & and medicines are filled/replaced. The first aid boxes are provided in the following locations:
DRI, Power Plant, DG room, Administrative building, SMS and Security Office.
DISASTER MANAGENENT PLAN
Introduction:
Disaster may be defined as a sudden occurrence of incidence in such a magnitude as to affect the normal pattern of life inside or in the vicinity of plant which has the potential of causing extensive injury of loss of life or damage to property and tend to cause disruption inside/outside the site.
Hazardous substances are being handled, generated and stored in increasing quantities a various manufacturing facilities in recent years. This has posed a serious
risk for the plant, persons and the environment encompassing thereof. The disasters following incidents in some industrial units handling hazardous substances in the last 2 to 3 decades has made it imperative for all concerned to device measures and implement them immediately and effectively to mitigate their adverse effects, if not, to totally eliminate them. The need to protect human being, the flora and fauna as well as our bio-diversity against these potential dangers has prompted the government for promulgation of various statutory provisions for preparation of hazard mitigation plans based on their risk impacts.
The Factories (Amendment) Act 1987 and manufacture storage and Import of Hazardous Chemical Rules- 1989 has provided regulation making mandatory for all owners of hazardous undertakings to prepare for their Onsite Emergency Plan in a pragmatic way and keep those well re-harassed for rapid action in actual crisis

M/s Bravo Sponge iron Pvt. Limited,
Vill: Mahuda, P.O: Raghunathpur, District: Purulia, (West Bengal) Page No
19
Disaster Management Plan
Appendix 3.1
situation.
The goal of DMP is the effective containment of the emergency situation by proper mitigative action at the place of occurrence, cautioning people in adjoining affected localities; prompt rescue and provisions of medical aid to affected persons and communication to civil authorities for rushing in help from outside.
This objective being achieved by defining the functions and responsibilities of all concerned managerial, operational and supporting services department personnel with respect to detection and effective implementation of emergency action plan.
Objectives of Disaster Management Plan (DMP):
The objectives of DMP is to describe and spell out industry’s emergency response actions that requires to be initiated to deal with various emergencies that could occur at the facility, with the response organization structure deployed in the shortest possible time. Thus the objective of emergency response plan can be summarized as:
Rapid control and containment of the hazardous situation.
Minimization of the risk and impact of event / accident.
Effective rehabilitation of the affected persons and prevention of damage to property.
Elements of DMP:
In order to effectively achieve the above mentioned objectives, the critical elements of the DMP are:
Reliable and early detection of an emergency and careful planning.
The command, co-ordination, and response organization structure along with
clearly demarcated line and staff function.
The availability of resources for handling emergencies.
Appropriate emergency response actions forecasted with least margin of error.
Effective notification and communication facilities.
Proper training of the concerned personnel.
Regular review and updating of the DMP.
The DMP has been opened up with a foreword duly signed by the plant-in-charge.
Responsibility of Implementation of DMP:
Responsibility for establishing and maintaining an Emergency Preparedness Plan/DMP belongs to the Plant-in-charge. He is responsible for the control of the plan, and for ensuring that the plan is applicable and implementing procedures are operated during emergency situation and are reviewed and revised annually.
As a member of top management he is responsible for the training of personnel to ensure that adequate emergency response capabilities are maintained in accordance with the plan. He is also responsible for ensuring the regular conduct of drills and

M/s Bravo Sponge iron Pvt. Limited,
Vill: Mahuda, P.O: Raghunathpur, District: Purulia, (West Bengal) Page No
20
Disaster Management Plan
Appendix 3.1
other measures, as outlined in the DMP.
EMERGENCY COMMAND STRUCTURE
Works Main Controller (WMC) Mr. Sanjay Kumar Singh - Vice President
Site Incident Controller (SIC) Mr. T. K. Chakraborty(GM-CPP)
Mr. R. R. Pathak (GM-SID) Mr. V. Raman (AGM-SMS)
Auxiliary Team Leader (ATL) 1. Mr. M. Chattopadhaya
(HR & Admin) 2. Mr. S.K. Tiwari (GM-
Comm) 3. Mr. P. K. Neogy (DGM,
HR & Admin) 4. R. K. Mishra (AGM-EHS)
5. Mr. S. P. Paul (Safety Advisor)
Combat Team Leader (CTL) 1. Mr. Harendra Singh (In-
charge-CPP) 2. Manuranjan Sigh (Dy. Mgr-
CPP) 3. Mr. R. K. Singh(Mgr-Maint.
DRI ) 4. Mr. Sumant Nandi (Mgr-
Maint. SMS) 5. Mr. Baljeet Singh (In-charge-
RMP)
Rescue Team Leader (RTL) 1. Mr. Srikant Mondal
(Mgr-Admin 2. Mr. C. S. Paswan (Fire &
Safety Officer ) 3. Mr. Abani Mahata (Fire
& Safety Officer ) 4. P. S. Dubey (ASO)
Members 1. Mr. Debashish Tiwari -
(Admin ) 2. Mr. A. K. Sigh (Mgr-RMD )
3. Mr. (CPP) 4. Mr. Sanjeev Shaw (Sr.
Officer 5. Mr. Sandeep Paul )Time
Office)
Members 1. Mr. Md. Rizwan(GM-Civil) 2. Mr. K. N. Singh-(AGM-A/C) 3. Mr. Rajiv Kr.(AGM_Civil) 4. Mr. K.J. Lawrence (Sr. Mgr.
Store ) 5. Mr. Chandan Singh (Engg.
CPP)
Members 1. Mr. P. Bhattacharya-
(DM Plant ) 2. Mr. Rajeev Mukherjee
(Elect) 3. Mr Rajiv Bauri 4. Mr. Rajesh Mondal
(Medical)
5. Ranjit Bauri (Medical)

M/s Bravo Sponge iron Pvt. Limited,
Vill: Mahuda, P.O: Raghunathpur, District: Purulia, (West Bengal) Page No
21
Disaster Management Plan
Appendix 3.1
TELEPHONE NUMBERS OF EMERGENCY COMMAND TEAM
Sl No.
Name Position in Team Mob. Number PAX. No.
1 Mr. Sanjay Kumar Singh Works Main Controller (WMC) 8695605669 3002
2 Mr. T. K. Chakraborty Site Incident Controller (SIC)
8900632315 3009
3 Mr. R. R. Pathak 8695621895 3005
4 Mr. V. Raman 8436613061 3011
5 Mr. M. Chattopadhaya Auxiliary Team Leader (ATL)
7076999731
6 Mr. S.K. Tiwari 8695605668 3004
7 Mr. P. K. Neogy 8697982324
8 Mr. R. K. Mishra 8695621900
9 Mr. S. P. Paul 8373055304
10 Mr. Harendra Singh Combat Team Leader (CTL) 8695605661
11 Manuranjan Sigh 7992411688
12 Mr. R. K. Singh 7870161993
13 Mr. Sumant Nandi 7076999775
14 Mr. Baljeet Singh 7903010796
15 Mr. Srikant Mondal Rescue Team Leader (RTL) 7719356455 3029
16 Mr. C. S. Paswan 9593191099
17 Mr. Abani Mahata 8420242216
18 Mr. P. S. Dubey 7076999742
EMERGENCY CONTACT NUMBERS:
Sl No. Name Mob. Number PAX. No.
1 Factory Main Gate 7547907800 3019
2 Factory Security In-charge 7076999742 3020
3 Factory Medical Unit/Ambulance 7076999741 3030
4 Ambulance Service 101
5 Factory Safety officer 9593191099, 8420242216
6 District Magistrate Purulia 8373068601 03252-222 302
7 Superintendent of Police 8145500325 03252-222 304
8 Chief Medical Officer 9434147957 03252-222480
9 ADM (G), 8373068602 03252-222120
10 OC Disaster Management 7872488802 -
11 Dy. Chief Inspector of Factories 9433649808 0341-2252644
12 Dist. Controller F & S Purulia 8373068710 03252-222213
13 SDO, Raghunathpur 8373068608 02351-255255
14 Fire Station Raghnathpur 8584027313/314 03251-203550
15 Fire Station Santaldih 8584027312 03251-260238
16 Govt. Hospital Salka - 03251-255208
17 Police Station Para 8145500375 03251-266330

M/s Bravo Sponge iron Pvt. Limited,
Vill: Mahuda, P.O: Raghunathpur, District: Purulia, (West Bengal) Page No
22
Disaster Management Plan
Appendix 3.1
BUDGET ALLOCATION FOR DMP FOR PROPOSED PROJECT The company has allocated Rs. 479 lacs as an expenditure for Disaster Management Plan for its proposed project. The detail of the expenditure on the different heads along with its year-wise allocation has been presented in the following table.
BUDGET ALLOCATION FOR DISASTER MANAGEMENT PLAN FOR PROPOSED PROJECT
All amount in INR Lakhs
SL Proposal to Mitigate
Potential Risk Pellet Plant
PGP DRI
Plant CPP SMS
Rolling Mill
Budget 1st Year
2nd Year
3rd Year
1 Mobile fire-fighting equipment 70 70 - -
2 Fire extinguisher -
Foam/DCP/ABC/CO2 24 8 8 8
3 Installation of New Fire
Hydrant system - - - 170 120 - 50
4
Modifcation/
Upgradation of
Existing Fire Hydrant system
- - - 80 - 40 40
5 Water fog and
sprinkler system - - 65 10 25 30
6 Electrical earthing
system 60 15 20 25
7 Portable gas detectors
and alarm system - - - - 10 - 10 -
Total 479 223 103 153

ADS POINT -
IV
Traffic assessment study report shall be carried out and submitted
ANNEXURE-IV
P a g e - 1
4.1 Present Traffic Load
The project site of M/s Bravo Sponge Iron Private Limited is surrounded
by two roads i.e.,
a) Chandankiyari-Dubra-Raghunathpur Road is passing through
south direction at Rukni more. This road originates at Raghunathpur
on SH-05 at around 12 kms and terminates at Chandankiyari on
SH-12 at around 13 km from Rukni More.
b) A local road Mahuda-Dendua-Chelyama Road is passing through
west direction. This road connects SH-08 and
Chandankiyari-Dubra-Raghunathpur road at Rukni more.
Traffic density was monitored on following two locations
1. Chandankiyari-Dubra-Raghunathpur Road at Rukni More
2. Mahuda-Dendua-Chelyama Road near Bravo plant gate
Traffic density was monitored under four different vehicle categories
i.e., Heavy, Medium, Light and two wheelers. The heavy vehicles
included trucks, buses, cranes etc. The medium vehicles included mini
buses, matadors etc. while cars, jeeps, auto rickshaws and trekkers
were considered under the light vehicles category.
The data were recorded once for a day in the month of February, 2020,
for continuous 24 hours in a day. The relevant account has been
gathered in Tables-4.1 & 4.2 respectively.
4.2 Future Traffic Load due to Project
The additional traffic load due to material as well as manpower
movement during operation of overall project of M/s Bravo Sponge Iron
Private Limited after expansion has been added to the existing traffic
load at both the above mentioned points in Tables-4.1 & 4.2
respectively
4.3 Comparison of overall Traffic load with IRC: 64 – 1990
The same has been compared with Indian Roads Congress code for
Guidelines for Capacity of Roads in Rural Areas (IRC: 64 – 1990).
Relevant abstract of the same is presented in Table- 4.3.

ADS POINT -
IV
Traffic assessment study report shall be carried out and submitted
ANNEXURE-IV
P a g e - 2
TABLE-4.1
NAME OF THE LOCATION : ON CHANDANKIYARI-DUBRA-RAGHUNATHPUR ROAD
NEAR PROJECT SITE (AT RUKNI MORE)
DATE OF SAMPLING : 04.02.2020
HOUR HEAVY MEDIUM LIGHT TWO
WHEELERS TOTAL
0700 - 0800 5 4 7 13 29
0800 - 0900 7 5 9 14 35
0900 - 1000 8 5 9 15 37
1000 - 1100 6 6 15 15 42
1100 - 1200 5 5 11 11 32
1200 - 1300 7 6 14 16 43
1300 - 1400 5 5 16 18 44
1400 - 1500 4 5 13 15 37
1500 - 1600 3 4 11 13 31
1600 - 1700 6 6 14 15 41
1700 - 1800 5 5 19 9 38
1800 - 1900 7 5 18 15 45
1900 - 2000 5 5 14 14 38
2000 - 2100 5 5 10 11 31
2100 - 2200 9 4 8 11 32
2200 - 2300 8 5 7 10 30
2300 - 0000 9 3 5 8 25
0000 - 0100 8 2 3 6 19
0100 - 0200 6 3 3 3 15
0200 - 0300 6 2 2 4 14
0300 - 0400 4 2 3 3 12
0400 - 0500 7 3 3 2 15
0500 - 0600 7 3 6 3 19
0600 - 0700 6 3 8 7 24
Total 148 101 228 251 728
Addition for material movement due to Project
153 - - -
Addition for staff movement due to project
21 0 75 300
Grand Total 322 101 303 551
PCU Factor 3 1.5 1 0.5
PCU per day 966 152 303 276 1697
As per IRC: 64-1990 code, Table no 4, a Two Lane road in Plain terrain can
accommodate vehicular traffic load of 15000 PCU per day.
This road CHANDANKIYARI-DUBRA-RAGHUNATHPUR ROAD is two lane road
with approx. 7m width and can well accommodate existing traffic load along with
the additional load due to M/s Bravo project.
Note :
HEAVY : Truck, Bus, Cranes
MEDIUM : Minibus, Matador
LIGHT ; Car, Jeep, Auto Rickshaw, Trekker

ADS POINT -
IV
Traffic assessment study report shall be carried out and submitted
ANNEXURE-IV
P a g e - 3
TABLE-4.2
NAME OF THE LOCATION : ON LOCAL ROAD CONNECTING
MAHUDA-DENDUA-CHELYAMA NEAR BRAVO PLANT GATE
DATE OF SAMPLING : 06.02.2020
HOUR HEAVY MEDIUM LIGHT TWO
WHEELERS TOTAL
0700 - 0800 2 1 10 5 18
0800 - 0900 1 1 11 7 20
0900 - 1000 2 2 10 9 23
1000 - 1100 2 2 11 8 23
1100 - 1200 3 2 11 10 26
1200 - 1300 2 3 10 12 27
1300 - 1400 2 2 8 10 22
1400 - 1500 1 3 7 11 22
1500 - 1600 1 3 12 14 30
1600 - 1700 1 1 10 10 22
1700 - 1800 2 2 12 10 26
1800 - 1900 2 1 10 11 24
1900 - 2000 2 2 8 10 22
2000 - 2100 2 2 5 8 17
2100 - 2200 1 2 6 7 16
2200 - 2300 2 2 5 5 14
2300 - 0000 2 1 5 5 13
0000 - 0100 1 2 4 0 7
0100 - 0200 1 0 4 2 7
0200 - 0300 0 0 4 0 4
0300 - 0400 0 1 2 4 7
0400 - 0500 1 2 4 3 10
0500 - 0600 1 2 4 5 12
0600 - 0700 2 2 5 6 15
Total 36 41 178 172 427 Addition for material
movement due to Project 153 - - - 153
Addition for staff
movement due to project 21 0 75 300 396
Grand Total 210 41 253 472 976
PCU Factor 3 1.5 1 0.5
PCU per day 630 21 253 236 1140
As per IRC: 64-1990 code, Table no 4, a Two Lane road in Plain terrain can
accommodate vehicular traffic load of 15000 PCU per day.
This road MAHUDA-DENDUA-CHELYAMA ROAD is Two lane road with approx.
6m width and can well accommodate existing traffic load along with the additional load due to M/s Bravo project.
Note :
HEAVY : Truck, Bus, Cranes
MEDIUM : Minibus, Matador
LIGHT ; Car, Jeep, Auto Rickshaw, Trekker

ADS POINT -
IV
Traffic assessment study report shall be carried out and submitted
ANNEXURE-IV
P a g e - 4
Table no 4.3 Abstract from Indian Roads Congress (IRC:64 – 1990 code)
Guidelines for Capacity of Roads in Rural Areas

ADS POINT - V
Existing road conditions to be used for transportation of raw materials and finished
products inter-alia including its dimensions along with photographs shall be submitted
ANNEXURE-V
P a g e - 1
Bulk of the raw materials and products shall be transported by rail through nearest railway
siding (Rukni Railway station) which is around 1 km from project site. Raw materials will be
received first by railway rakes from nearby Rukni Railway Siding and then will be shifted to the
plant site through trucks.
Around 74% of total raw materials and finished products shall be transported by Rail and
balance 26% shall be transported by Road though state highways.
Details of roads surrounding Bravo Plant are shown in figure 5.0.
a) Chandankiyari-Dubra-Raghunathpur Road is passing through south direction at
Rukni more. This road originates at Raghunathpur on SH-05 at around 12 kms and
terminates at Chandankiyari on SH-12 at around 13 kms from Rukni More.
b) A local road Mahuda-Dendua-Chelyama Road is passing through west direction. This
road connects SH-08 and Chandankiyari-Dubra-Raghunathpur road at Rukni more.
The relevant Photographs along with width of the roads are presented below:
Fig 5 : ROADS SURROUNDING THE PLANT
To Chandankiyari (SH12)
To Raghunathpur (SH-05)

ADS POINT - V
Existing road conditions to be used for transportation of raw materials and finished
products inter-alia including its dimensions along with photographs shall be submitted
ANNEXURE-V
P a g e - 2
RAGHUNATHPUR (SH-05) TO RUKNI MORE
Chandankiyari (SH-12) to Rukni More
Rukni More (Tri-junction)
To Raghunathpur (SH-05) To Chandankiyari (SH-12)
To Bravo Plant

ADS POINT - V
Existing road conditions to be used for transportation of raw materials and finished
products inter-alia including its dimensions along with photographs shall be submitted
ANNEXURE-V
P a g e - 3
Rukni more is 12 km from State Highway (SH-05) and 13 km from State highway (SH-12). At Rukni more, width of road is 22 feet (Two Lane) black topped along with 6 feet footpath on either side of the road. There is moderate traffic density on this stretch of the road.
Rukni More to Bravo Plant Gate
Bravo Plant gate
Bravo Plant gate to Rukni Railway Siding
Bravo Plant gate is situated on Mahuda-Dendua-Chelyama Road having 20 feet width with black topped. Bravo Plant gate is approx.500 m from Rukni more. Traffic movement on this road is very low. Plant gate is designed with double gate system separately for inward and outward traffic movement to facilitate smooth movement of traffic for the plant.

ADS POINT - V
Existing road conditions to be used for transportation of raw materials and finished
products inter-alia including its dimensions along with photographs shall be submitted
ANNEXURE-V
P a g e - 4
Rukni Railway station (Rukni Railway Siding from Bravo Plant gate)
Bravo Plant from Rukni Railway siding
Bravo Railway Side Gate

ADS POINT - V
Existing road conditions to be used for transportation of raw materials and finished
products inter-alia including its dimensions along with photographs shall be submitted
ANNEXURE-V
P a g e - 5

ADS POINT -
VI
Quantity of raw materials and products to be transported by different modes such as
road and rail respectively shall be furnished
ANNEXURE-
VI
P a g e - 1
VI. DETAILS OF RAW MATERIALS & PRODUCTS The Quantity of raw materials and products, to be transported by different
modes is summarized and presented in Table-6.1.
TABLE-6.1
MATERIAL TRANSPORTATION DETAILS
Mode Product
Quantity
(Refer Table 6.2)
Raw material
Quantity
(Refer Table 6.3)
Total
Quantity
%age
Road 8,57,550 TPA 2,56,366 TPA 11,13,916 TPA 26.50%
Rail 8,57,550 TPA 22,31,498 TPA 3089048 TPA 73.50%
Total 17,15,100 TPA 24,87,864 TPA 4202964 TPA 100%
Bulk of the raw materials will be received first by railway rakes from nearby
Rukni Railway Siding and then will be shifted to the plant site through
trucks. 50% of the total products will be transported by rail.
Rukni railway siding is adjacent to the plant site in the north direction. All
the trucks for raw material and finished product transportation shall comply
with the applicable environmental norms.
The details of the products, to be manufactured after the proposed
expansion project are presented in Table-6.2.
TABLE-6.2 LIST OF PRODUCTS
PRODUCTS Quantity (IN TPA) Mode of transport (TPA)
Road Rail
Pellet 12,86,100 643050 643050
Billet 99,000 49500 49500
Long Products 3,30,000 165000 165000
Total Quantity 17,15,100 857550 857550
Total Product to be transported from Plant (Outward) 17,15,100
Percentage 50.00% 50.00%

ADS POINT -
VI
Quantity of raw materials and products to be transported by different modes such as
road and rail respectively shall be furnished
ANNEXURE-
VI
P a g e - 2
The major raw materials, which will be handled, consist of Iron Ore Fines,
imported & local coal, Pig Iron, Limestone, dolomite, Bentonite, Ferro Alloys
etc.
The annual requirement of major raw materials after the expansion
project is presented in Table-6.3.
TABLE- 6.3
LIST OF RAW MATERIALS
Raw Material Total Mode of transport (TPA)
Internal Road Rail
Sponge Iron Plant:
Pellet 4,21,879 4,21,879
Coal 2,65,518 2,65,518
Dolomite 17,701 17,701
SMS (IF route):
Pig Iron 85,309 85,309
Sponge Iron 3,89,813 2,95,020 94,793
Ferro Alloys 5,346 5,346
Scrap 56,274 32,093 24,181
Rolling Mill:
Billets 3,46,500 3,46,500
Power Plant - AFBC:
Coal 43,532 43,532
Dolochar 53,104 53,104
Pellet Plant:
Iron Ore Fines 17,93,400 17,93,400
Bentonite 11,956 11,956
Limestone 17,080 17,080
Coal 10,248 10,248
Producer Plant:
Coal 1,18,800 1,18,800
Total: 11,48,596 2,56,366 22,31,498
Total raw material to be transported from outside 24,87,864
Percentage 10% 90%

ADS POINT
- VII
Line source modelling shall be carried out based on the quantity of raw materials and products to
be transported through different modes such as road and rail respectively and report shall be
furnished.
ANNEXURE-VII
P a g e - 1
VII. DETAILS OF RAW MATERIALS & PRODUCTS The Quantity of raw materials and products, to be transported by different
modes is summarized and presented in Table-7.1.
TABLE-7.1
MATERIAL TRANSPORTATION DETAILS
Mode Product
Quantity
(Refer Table 7.2)
Raw material
Quantity
(Refer Table 7.3)
Total
Quantity
%age
Road 8,57,550 TPA 2,56,366 TPA 11,13,916 TPA 26.50%
Rail 8,57,550 TPA 22,31,498 TPA
3089048TPA
73.50%
Total 17,15,100 TPA 24,87,864 TPA 4202964 TPA 100%
Bulk of the raw materials will be received first by railway rakes from nearby
Rukni Railway Siding and then will be shifted to the plant through trucks.
50% of the total products will be transported by rail.
Rukni railway siding is adjacent to the plant site in the north direction. All
the trucks for raw material and finished product transportation shall
comply with the applicable environmental norms.
The details of the products, to be manufactured after the proposed
expansion project are presented in Table-7.2.
TABLE-7.2
LIST OF PRODUCTS
PRODUCTS Quantity (IN TPA) Mode of transport (TPA)
Road Rail
Pellet 12,86,100 643050 643050
Billet 99,000 49500 49500
Long Products 3,30,000 165000 165000
Total Quantity 17,15,100 857550 857550
Total Product to be transported from Plant (Outward) 17,15,100
Percentage 50.00% 50.00%
The major raw materials, which will be handled, consist of Iron Ore Fines,
imported & local coal, Pig Iron, Limestone, dolomite, Bentonite, Ferro Alloys
etc.

ADS POINT
- VII
Line source modelling shall be carried out based on the quantity of raw materials and products to
be transported through different modes such as road and rail respectively and report shall be
furnished.
ANNEXURE-VII
P a g e - 2
The annual requirement of major raw materials after the expansion project
is presented in Table-7.3.
TABLE- 7.3
LIST OF RAW MATERIALS
Raw Material Total Mode of transport (TPA)
Internal Road Rail
Sponge Iron Plant:
Pellet 4,21,879 4,21,879
Coal 2,65,518 2,65,518
Dolomite 17,701 17,701
SMS (IF route):
Pig Iron 85,309 85,309
Sponge Iron 3,89,813 2,95,020 94,793
Ferro Alloys 5,346 5,346
Scrap 56,274 32,093 24,181
Rolling Mill:
Billets 3,46,500 3,46,500
Power Plant - AFBC:
Coal 43,532 43,532
Dolochar 53,104 53,104
Pellet Plant:
Iron Ore Fines 17,93,400 17,93,400
Bentonite 11,956 11,956
Limestone 17,080 17,080
Coal 10,248 10,248
Producer Plant:
Coal 1,18,800 1,18,800
Total 11,48,596 2,56,366 22,31,498
Total raw material to be transported from outside 24,87,864
Percentage 10% 90%
Impact on Air Quality
Presently, the background emissions in the project area are primarily
confined to emissions from traffic plying on the nearby Chandankiyari –
Dubra - Raghunathpur road and Mahuda-Dendua-Chelyama Road in the
vicinity of the project site.

ADS POINT
- VII
Line source modelling shall be carried out based on the quantity of raw materials and products to
be transported through different modes such as road and rail respectively and report shall be
furnished.
ANNEXURE-VII
P a g e - 3
During the operation phase of the project, movement of goods’ vehicles and
loading and unloading operations may contribute to air emission. Control
measures like Electrostatic Precipitators (ESPs), Bag Filters and other dust
suppression system will be installed to mitigate/suppress such fugitive
emissions. With stringent traffic management system within the project site,
scope for air pollution due to movement of goods transports will be
minimized. The layout of the proposed project has generous area earmarked
for greenery development. This will act as effective media for arresting the
emissions within the project site.
The vehicular traffic plying in and out of the project site will be one of the
significant sources of air pollution. If the site is not properly regulated, it can
create disruption in free traffic movement leading to air pollution problems.
This can be tackled to a great extent by properly regulating the traffic and by
following strict and disciplined vehicular movement and operation at the
project site. By imposing vehicular emission standards, this problem can be
further curbed to a large extent. Adequate and planned road network will be
set up within the project site for smooth movement of the goods vehicles.
Based on the details of the raw materials and products as derived in the
Tables-7.1 to 7.3, total 11,13,916 TPA materials will be transported
through road (considering 365 working days) for the overall plant after
expansion. Around 153 trucks per day (6.38, say 7 trucks per hour) will be
required to transport the materials by road with the capacity of each truck
being 20 Tons. Hence, considering to & fro movement of the trucks, total 14
trips of truck movement for each hour shall be considered on surrounding
roads.
Moreover, there will be some additional traffic load due to manpower
movement during operation for proposed project of M/s Bravo Sponge Iron
Private Limited after expansion. There shall be around 1000 persons to
operate and maintain the proposed plant facilities. It is estimated that
around 75 persons will come to the plant by car & around 300 persons will
come on two wheelers. For the rest persons (around 625 nos.), the company
will provide the bus service. Total 20-21 buses will be required for this
purpose.
However, their movement will be well spread on the different road stretches
in the area, the impact prediction has been done, considering the entire
vehicular movement on these two main stretches i.e.,

ADS POINT
- VII
Line source modelling shall be carried out based on the quantity of raw materials and products to
be transported through different modes such as road and rail respectively and report shall be
furnished.
ANNEXURE-VII
P a g e - 4
Chandankiyari-Dubra-Raghunathpur road and Mahuda-Dendua-Chelyama
Road for the projection of the worst case scenario.
The air quality predictions have been carried out by using the air quality
model CALINE-4 developed by California Department of Transportation. The model is based on Gaussian diffusion equation and uses a mixing zone
concept to characterize pollutant dispersion over the roadway.
Details of CALINE-4
CALINE-4 is a dispersion model that predicts pollutant impacts near
roadways. Its purpose is to help planners to protect public health from the adverse effects of excessive exposure of the pollutants.
CALINE-4 is a simple line source Gaussian plume dispersion model. The
user defines the roadway geometry, worst-case meteorological parameters, anticipated traffic volumes and receptor positions.
CALINE-4 is a graphical windows-based user interface, designed to ease data entry and increases the on-line help capabilities of CALINE-4. The CALINE-4 setup program is self-contained with both programs (the
CALINE-4 interface and the CALINE-4 dispersion model), so the user only needs to complete a single installation step.
Details of Pollutants To account for the effect of the diurnal variations in model inputs (vehicular emissions and meteorological conditions), the averaging time for model
predictions has been restricted to 60 minutes. The averaging time is so selected because the primary meteorological factors that influence the air quality predictions i.e., wind speeds and directions do not remain steady for
longer time periods. Also, during the peak traffic hours, the traffic volumes typically show significant variations over periods longer than one hour.
The emission factors of NOx and PM in gm/km of Trucks / Trailer / Bus / Car / Two wheeler (Source: Central Pollution Control Board), used in the model are given in the following Table.
Emission Factors, (in gm/km)
Mode NOx PM
Trucks /
Trailer / Bus
8.0 0.36
Car 0.97 -
Two Wheeler 2 -
Source: Official website of Central Pollution Control Board * Multiplied by ‘1.6’ for converting into ‘gm/mile’ for use in CALINE-4

ADS POINT
- VII
Line source modelling shall be carried out based on the quantity of raw materials and products to
be transported through different modes such as road and rail respectively and report shall be
furnished.
ANNEXURE-VII
P a g e - 5
The predicted NOx and PM concentrations due to truck/ bus movements at
8 ambient air quality monitoring locations from vehicular traffic are
superimposed on the baseline ambient air quality data and incremental
values due to air emissions from the proposed units and the units under
implementation/ to be implemented in the Bravo project have been
presented in Tables – 7.4 & 7.5 to project the overall air quality scenario.
Out of the predicted NOx and PM concentrations, calculated for the 2
existing roads, only the maximum values at the respective receptors have
been considered for projecting the overall scenario.
Table – 7.4
EXPECTED AMBIENT AIR QUALITY FOR AAQM LOCATIONS
(FOR NOx)
Location
Code
AAQM location
Back Ground Maximum
value
Predicted GLC (Max) of Proposed
Units, Unit
under implementation & unit to be implemented
Max. Contribution
due to
Additional
Traffic
Movement due
to overall plant operation of
Bravo
Over all scenario/ Net
Impact
Oct’18 to
Dec’18
1 to 14
Feb’ 20
Based on
Oct’18 to
Dec’18 Data
Based on 1 to
14
Feb’ 20
Data A1 Near
Project Site
38 32 0.48 0.03 38.51 32.51
A2 Alkusa 31 30 0.94 0.0 31.94 30.94 A3 Dheria 35 23 1.17 0.01 36.18 24.18 A4 Kankdiha 27 24 0.15 0.01 27.16 24.16 A5 Ketlapur
Nutandi 32 28 0.44 0.02 32.46 28.46
A6 Rahardi 28 22 0.16 0.02 28.18 22.18 A7 Barhakan
ali 22 23 0.46 0.0 22.46 23.46
A8 Toldi 30 26 0.54 0.01 30.55 26.55 Norm 80.0
All values are in µg/m3.

ADS POINT
- VII
Line source modelling shall be carried out based on the quantity of raw materials and products to
be transported through different modes such as road and rail respectively and report shall be
furnished.
ANNEXURE-VII
P a g e - 6
Table – 7.5 EXPECTED AMBIENT AIR QUALITY FOR AAQM LOCATIONS
(FOR PM10)
All values are in µg/m3.
Note :
While taking a serious note of the concern, raised by the Honorable EAC members, a two weeks’ monitoring programme (01.02.2020 to 14.02.2020) was further chalked out to study the air quality at all 8 locations with an emphases to assess the impact on the available sensitive receptors around the same 8 locations.
While going through the statistical analysis for PM10 for the respective locations, all the values are below 80 µg/m3 except at one occasion at AQ1 (83 µg/m3). Hence, all the values are well within the stipulated limit of 100 µg/m3. It has been observed that all these schools are mostly away from settlement areas.
The details of additional studies is enclosed with ADS point no 8 as addendum 8.4
Locati
on
Code
AAQM
location
Back Ground Maximum
value
Predicted GLC (Max) of Proposed
Units, Unit under
implementation & unit to be implemented
Max.
Contribution
due to Additional
traffic
Movement due
to overall plant
operation of
Bravo
Over all scenario/ Net
Impact
Oct’18 to
Dec’18
1 to 14 Feb’ 20
Based on
Oct’18 to
Dec’18 Data
Based on 1 to 14 Feb’ 20 Data
A1 Near Project Site
93 83 4.99 0.2 98.19 88.19
A2 Alkusa 88 76 1.68 0.1 89.78 77.78 A3 Dheria 90 74 2.11 0.2 92.31 76.31 A4 Kankdiha 86 68 0.72 0.1 86.82 68.82 A5 Ketlapur
Nutandi 95 78 0.86 0.1 95.96 78.96
A6 Rahardi 84 79 0.77 0.1 84.87 79.87 A7 Barhakanali 77 70 0.82 0.1 77.92 70.92 A8 Toldi 80 72 0.99 0.1 81.09 73.09
Norm 100.0

ADS POINT
- VII
Line source modelling shall be carried out based on the quantity of raw materials and products to
be transported through different modes such as road and rail respectively and report shall be
furnished.
ANNEXURE-VII
P a g e - 7
Conclusion:
While referring the above table, the PM concentrations at the respective
AAQM locations due to the vehicular emissions during transportation of raw materials and products are calculated in the range of 0.1 to 0.2 µg/m3. The
corresponding NOx concentrations are calculated in the range of 0.01 to 0.03 µg/m3.
Hence, it can be concluded that the contribution of the vehicular traffic due
to the transportation of raw materials and products for the overall project after expansion is negligible.
The overall scenario of the air quality at the respective monitoring locations in the area after adding the expected contributions due to overall plant
operation after expansion to the maximum baseline data represents the maximum concentration in the range of 77.92 to 98.19 µg/m3 for PM, considering the background level as monitored during the period of Oct’18 to
Dec’18. The values for NOx are in the range of 22.46 to 38.51 µg/m3.
Considering the background level as monitored during the period of 1st Feb’20 to 14th Feb’20, the corresponding overall maximum values of PM & NOx are in the ranges of 68.82 to 88.19 µg/m3 and 22.18 to 32.51 µg/m3
respectively. All these values are within the stipulated norms of 100 µg/m3 and 80 µg/m3
respectively.
It may also be noted that the modeling results depict the worst case scenario
as washout due to rain has not been considered and deposition on other
forms of structures as buildings, trees etc. have not been taken into account.
Thus, in actuality, the pollutant concentrations are expected to be relatively
lower than the predicted value.
Mitigation Measures
It would be ensured that all the vehicles plying in the working zone are
properly tuned and maintained to keep emissions within the
permissible limits.
Speed Limit/ humper will be imposed to regulate vehicle speed.
Transportation will be through covered trucks and wagons.
Truck/tippers shall be parked in designated parking area only;

ADS POINT
- VII
Line source modelling shall be carried out based on the quantity of raw materials and products to
be transported through different modes such as road and rail respectively and report shall be
furnished.
ANNEXURE-VII
P a g e - 8
Minimize use of roads at any particular time by planning vehicles
movements.
Road crossings to be used will be well marked.
All trucks moving between railway siding to the plant site for
transporting raw materials, solid waste & product shall be fully
covered to avoid dust pollution.
With strict traffic management system and various environmental
management practices, contribution of pollutants in the ambient air
will be kept under control so as to create minimum disturbances in
the neighbourhood.
Adequate and planned road network will be set up in the project for
smooth movement of the goods vehicles.
At loading and unloading points, arrangement for Water sprinkling
will be made so that dust generation during transportation of
materials will be minimized further.
All the internal roads within the plant shall be concreted; hence dust
arising from the internal roads shall be insignificant. The greenbelt
development shall further help in reduction in fugitive emissions.

ADS POINT -
VIII
Reasons for higher level of presence of
Particulate matter in the Ambient Air and NOx in the source shall be furnished.
ANNEXURE-VIII
P a g e - 1
Reasons for High value of PM in Ambient Air:
PM10 :
Out of the total 196 values, only 3 values have exceeded the level of 90
µg/m3, which is only 1.5% of the total monitored values. Around 15%
values are obtained in the range of 81 to 90. But, most of the values
(around 84%) are below 80 µg/m3. Addendum 8.1 is presented below for
kind reference.
The values above 90 µg/m3 observed on two instances near the project
site (AQ1) may be attributed to the additional vehicular traffic around
the Rukni railway siding area due to simultaneously lifting of two rakes
materials which is a rare occurrence. This railway siding has only one
unpaved platform to unload the material. It is also pertinent to mention
that there is no sensitive manmade receptor at this location.
The value of 95 µg/m3 was obtained on 07.12.2018 at Ketlapur Nutandi
(AQ5). It was observed that there were local community celebrations
leading to significant vehicular movement on this particular day in the
area. However, the overall mean value for 3 months period is calculated
as 72 µg/m3.
PM2.5 :
The values of PM2.5 at 8 nos. ambient air quality monitoring locations were
obtained in the range of 18 to 45 µg/m3 (for the monitoring period: October,
2018 – December, 2018). Addendum 8.2 is presented below for kind reference.
The corresponding values of PM2.5 at 8 nos. ambient air quality monitoring
locations were obtained in the range of 15 to 39 µg/m3 (for the monitoring
period: 1st February, 2020 to 14th February, 2020). Addendum 8.4 is presented
below for kind reference.
All the values of PM2.5 (the maximum value being 45 µg/m3) are well within the
stipulated limit of 60 µg/m3.

ADS POINT -
VIII
Reasons for higher level of presence of
Particulate matter in the Ambient Air and NOx in the source shall be furnished.
ANNEXURE-VIII
P a g e - 2
NOx in Source : Please refer Addendum 8.3 for details.
There is NOx emission from five units (Existing-3, under Implementation-1,
Proposed -1). The NOx emission from all these five units shall be maintained
within the level of 100 mg/Nm3.
Based on the stack emission data and NOx emissions, the Ground Level
Concentrations (GLCs) were calculated using ISCST3 (Air Quality Dispersion
Model) and the predicted maximum GLC of NOx was obtained as 5.808 µg/m3
in ESE direction at a distance of 0.8 km. Addendum 8.3 is presented below for
reference.
Additional studies: Please refer Addendum 8.4 for details.
Taking serious note of the concern raised by the Honorable EAC members, a
two weeks’ monitoring was further conducted to study the air quality at all 8
locations with an emphases to assess the impact on the available sensitive
receptors around the same 8 locations. Please refer below for Addendum : 8.1
While going through the statistical analysis for PM10 for the respective locations,
all the values are below 80 µg/m3 except at one occasion at AQ1 (83 µg/m3).
Hence, all the values are well within the stipulated limit of 100 µg/m3. It has
been observed that all these schools are mostly away from settlement areas.

ADS POINT -
VIII
Reasons for higher level of presence of
Particulate matter in the Ambient Air and NOx in the source shall be furnished.
ANNEXURE-VIII
P a g e - 3
Addendum 8.1
Reason for High value of PM10 in Ambient Air:
The distribution of PM10 values obtained at the respective locations has been
presented for the different ranges from the Data of EIA report & relevant
abstract is attached as Addendum -8.5 and the summary is shown in the Table
below:
Distribution of PM10 values in Different Ranges
POLLUTANTS LOCATIONS Above
90 81 - 90
80 & Below
Total
PM10 (µg/m3)
Near Project Site (AQ1)
2 15 8 25
Alkusa (AQ2) 0 4 21 25
Dheria (AQ3) 0 3 22 25
Kankdiha (AQ4) 0 1 24 25
Ketlapur Nutandi (AQ5)
1 3 20 24
Rahardi (AQ6) 0 3 21 24
Barhakanali (AQ7) 0 0 24 24
Toldi (AQ8) 0 0 24 24
Total 3
(1.5%) 29
(14.8%) 164
(83.7%) 196
(100%)
While referring the above table,
Out of the total 196 values, only 3 values have exceeded the level of
90 µg/m3, which is only 1.5% of the total monitored values. Around
15% values are obtained in the range of 81 to 90. But, most of the
values (around 84%) are below 80 µg/m3.
The values above 90 µg/m3 have been obtained on total three
occasions at two out of total 8 locations as presented below:
LOCATION NAME
DATE OF MONITORING
PM10 (µg/m3)
Near Project Site
(AQ1)
06.12.2018 92
27.12.2018 93
Ketlapur Nutandi
(AQ5) 07.12.2018 95

ADS POINT -
VIII
Reasons for higher level of presence of
Particulate matter in the Ambient Air and NOx in the source shall be furnished.
ANNEXURE-VIII
P a g e - 4
Reasons for High value of PM in Ambient Air Near Project Site (AQ1):
The Values above 90 µg/m3 was observed on only two occasions out of total reading of 25 days. Such high values on two instances near the project site (AQ1) may be attributed to the emissions from the vehicular traffic around the Rukni railway siding area. Besides, wind blown dust due to the unpaved Road is another significant reason. The conditions of unpaved Rukni Railway siding is presented below.
It is also pertinent to mentioned that there is no sensitive manmade receptor at this location.
A view of Rukni Railway siding

ADS POINT -
VIII
Reasons for higher level of presence of
Particulate matter in the Ambient Air and NOx in the source shall be furnished.
ANNEXURE-VIII
P a g e - 5
Reasons for High value of PM in Ambient Air at Ketlapur Nutandi (AQ5):
The ambient Air Quality Monitoring Location at Ketlapur Nutandi (AQ5) represents a moderately populated habitation having unpaved
road connectivity.
The value of 95 µg/m3 was obtained on 07.12.2018. It was observed that there were local community celebrations leading to significant vehicular movement on this particular day in the area. However, the overall mean value for 3 months period is calculated as 72 µg/m3.
It is relevant to note that this location was in the upwind direction of the project site of M/s Bravo Sponge Iron Pvt. Ltd. during the
monitoring period. Hence, there is insignificant impact on the air quality of this location due to air emissions from the existing plant of
Bravo.

ADS POINT -
VIII
Reasons for higher level of presence of
Particulate matter in the Ambient Air and NOx in the source shall be furnished.
ANNEXURE-VIII
P a g e - 6
Addendum 8.2
Reason for High value of PM2.5 in Ambient Air:
Observation on PM2.5 Values in Ambient Air Quality:
The values of PM2.5 at 8 nos. ambient air quality monitoring locations were obtained in the range of 18 to 45 µg/m3 (for the monitoring period: October, 2018 – December, 2018).
The corresponding values of PM2.5 at 8 nos. ambient air quality monitoring locations were obtained in the range of 15 to 39 µg/m3 (for the monitoring period: 1st February, 2020 to 14th February, 2020).
All the values of PM2.5 (the maximum value being 45 µg/m3) are well within the stipulated limit of 60 µg/m3.

ADS POINT -
VIII
Reasons for higher level of presence of
Particulate matter in the Ambient Air and NOx in the source shall be furnished.
ANNEXURE-VIII
P a g e - 7
Addendum 8.3
Reason for High value of NOx in Source:
The major sources of emissions of NOx from the proposed units, Units under
implementation & to be implemented and from the existing units, have been presented in Table-8.5.
There is NOx emission from five units (Existing-3, under Implementation-1,
Proposed -1). The NOx emission from all these five units shall be maintained within the level of 100 mg/Nm3.
TABLE-8.5
Status Units NOx Concentration
(mg/Nm3)
NOx emission Load (gm/sec)
Existing units Induction Furnaces (2x15 T) - -
WHR Boiler attached with 1x100 TPD & 1X95 TPD DRI Kilns
100 1.91
WHR Boiler attached with 2x100 TPD DRI Kilns
100 2.12
AFBC Boiler (1x20 TPH) 100 1.85
Under Implementation
/ To be implemented
Induction Furnaces 1X15 T - -
Furnaces 1X15 T (1X15 T - -
AFBC Boiler (1x20 TPH) 100 1.85
Proposed Units Pellet Plant 2x0.85 MTPA - -
Induction Furnaces (3x25 T) - -
Waste Heat Recovery Boiler for 7 MW Power Generation
100 2.68
Based on the stack emission data and NOx emissions, the Ground Level Concentrations (GLCs) were calculated using ISCST3 (Air Quality Dispersion
Model) and the predicted maximum GLC of NOx was obtained as 5.808 µg/m3 in ESE direction at a distance of 0.8 km.

ADS POINT -
VIII
Reasons for higher level of presence of
Particulate matter in the Ambient Air and NOx in the source shall be furnished.
ANNEXURE-VIII
P a g e - 8
Addendum : 8.4
Additional Studies (1st February, 2020 to 14th February, 2020).
Taking a serious note of the concern, raised by the Honorable EAC members, a
two weeks’ monitoring programme was further chalked out to study the air
quality at all 8 locations with an emphases to assess the impact on the available
sensitive receptors around the same 8 locations. Based on the survey, it was
found that there are primary schools in and around all eight locations which are
considered as among the most sensitive zones because little children stay there
for a considerable period of time during a day. The monitoring was conducted at
a frequency of twice a week at each station for PM10, PM2.5, SO2 & NOx covering
2 weeks’ period (1st February, 2020 to 14th February, 2020). The relative
direction, distance, latitude and longitude with respect to the project site have
been tabulated in Table-8.3. The results are shown in Appendix-II and the
statistical analysis of all the parameters is presented in Table – 8.4.
TABLE - 8.3 AMBIENT AIR QUALITY MONITORING LOCATIONS
Sl. No.
Location Code
Location
Aerial Distance
w.r.t. Project site
(km)
Direction w.r.t. Project site
Co-ordinates
1. AQ1
Near Project Site (Kasibera Primary School)
0.46 SSE 23°32'39.97"N86°32'55.47"E
2. AQ2
Alkusa (Alkusa Primary School)
2.04 SE 23°32'05.32"N86°33'38.91"E
3. AQ3
Dheria (Dheria Primary School)
2.17 SSW 23°31'44.39"N86°32'38.88"E
4. AQ4
Kankdiha (Kankdiha Primary School)
4.51 WSW 23°31'56.86"N86°30'23.78"E
5. AQ5
Ketlapur Nutandi (Ketlapur Primary School)
3.08 NW 23°34'01.75"N86°31'29.42"E
6. AQ6
Rahardi (Rahardi Harijan Primary School)
3.39 WNW 23°33'04.61"N86°30'51.00"E
7. AQ7
Barhakanali (Barhakanali Primary School)
3.04 NNE 23°34'32.27"N86°33'02.66"E
8. AQ8 Toldi (Toldi Primary School)
3.16 ENE 23°33'17.67"N86°34'38.35"E

ADS POINT -
VIII
Reasons for higher level of presence of
Particulate matter in the Ambient Air and NOx in the source shall be furnished.
ANNEXURE-VIII
P a g e - 9
TABLE-8.4
STATISTICAL ANALYSIS OF AIR POLLUTANTS
(Period: 1st February, 2020 to 14th February, 2020)
Pollutants Locations MES Min Max A.M.
PM10
(µg/m3)
Near Project Site
(Kasibera Primary School) 4 62 83 73.0
Alkusa
(Alkusa Primary School) 4 53 76 66.3
Dheria
(Dheria Primary School) 4 58 74 68.3
Kankdiha
(Kankdiha Primary School) 4 50 68 60.5
Ketlapur Nutandi (Ketlapur Primary School)
4 61 78 70.0
Rahardi
(Rahardi Harijan Primary School) 4 56 79 67.8
Barhakanali
(Barhakanali Primary School) 4 52 70 61.3
Toldi
(Toldi Primary School) 4 57 72 64.0
Overall 32 50 83 66.4
PM2.5
(µg/m3)
Near Project Site (Kasibera Primary School)
4 25 37 31.0
Alkusa
(Alkusa Primary School) 4 20 35 28.1
Dheria
(Dheria Primary School) 4 22 35 29.5
Kankdiha
(Kankdiha Primary School) 4 15 29 23.8
Ketlapur Nutandi
(Ketlapur Primary School) 4 23 39 30.6
Rahardi (Rahardi Harijan Primary School)
4 20 36 27.9
Barhakanali
(Barhakanali Primary School) 4 19 30 24.2
Toldi
(Toldi Primary School) 4 21 32 26.2
Overall 32 15 39 27.7
SO2
(µg/m3)
Near Project Site
(Kasibera Primary School) 4 7 13 10.0
Alkusa
(Alkusa Primary School) 4 6 10 8.0
Dheria (Dheria Primary School)
4 4 9 7.0
Kankdiha
(Kankdiha Primary School) 4 5 10 8.0
Ketlapur Nutandi
(Ketlapur Primary School) 4 8 13 10.8
Rahardi
(Rahardi Harijan Primary School) 4 7 9 8.0
Barhakanali
(Barhakanali Primary School) 4 4 8 6.3
Toldi (Toldi Primary School)
4 6 12 8.3

ADS POINT -
VIII
Reasons for higher level of presence of
Particulate matter in the Ambient Air and NOx in the source shall be furnished.
ANNEXURE-VIII
P a g e - 10
Overall 32 4 13 8.3
NO2
(µg/m3)
Near Project Site
(Kasibera Primary School) 4 16 32 24.0
Alkusa
(Alkusa Primary School) 4 15 30 22.3
Dheria (Dheria Primary School)
4 17 23 20.3
Kankdiha
(Kankdiha Primary School) 4 12 24 17.3
Ketlapur Nutandi
(Ketlapur Primary School) 4 13 28 21.5
Rahardi
(Rahardi Harijan Primary School) 4 15 22 18.0
Barhakanali
(Barhakanali Primary School) 4 12 23 16.8
Toldi (Toldi Primary School)
4 14 26 20.5
Overall 32 12 32 20.1
While going through the statistical analysis for PM10 for the respective locations,
all the values are below 80 µg/m3 except at one occasion at AQ1 (83 µg/m3).
Hence, all the values are well within the stipulated limit of 100 µg/m3. It has
been observed that all these schools are mostly away from the settlement areas.

ADS POINT -
VIII
Reasons for higher level of presence of
Particulate matter in the Ambient Air and NOx in the source shall be furnished.
ANNEXURE-VIII
P a g e - 11
Addendum : 8.5
Abstract of relevant data from submitted EIA report
Eight (8) numbers of monitoring stations were set up to assess the existing air
quality of the study area. One station was located near the project site and the
seven others, outside the project site. The locations of the monitoring stations
were based on the frequent wind directions in order to site the stations as close
as feasible to the anticipated maximum pollutant deposition areas, moreover,
duly considering human habitation and proximity to sensitive zones within the
study area. Logistic considerations as ready accessibility, security, availability
of reliable power supply etc. were examined while finalizing the monitoring
locations.
There are no eco-sensitive areas like National Park/Wildlife Sanctuary/Bird
Sanctuary etc. within 10 km radius around the project site. Panchet Reserve
Forest is around 21 km in NE direction from the project site.
The equipment was placed at open space free from trees and other obstruction
which otherwise act as a sink of pollutants resulting in lower levels in
monitoring results. At locations close to highways, the equipment was placed at
least 100 m away from such highways/roads to avoid influence of traffic
exhaust emissions.
Ambient Air Quality Monitoring was conducted for the period (OCTOBER, 2018
– DECEMBER, 2018) at a frequency of twice a week at each station adopting a
continuous 24 hours schedule in respect of the following parameters:
- Particulate Matter-10 (PM10) - Particulate Matter-2.5 (PM2.5) - Sulphur Dioxide (SO2)
- Nitrogen Dioxide (NO2)
The relative direction, distance, latitude and longitude along with criteria for
selection of Ambient Air Quality Monitoring locations with respect to the project
site have been tabulated in Table-8.1. The locations of 8 ambient air quality
monitoring stations are presented in Figure-8.1.
The detailed monitored data for the entire 3 months’ period for the respective
locations and the parameters are presented as Appendix-1.

ADS POINT -
VIII
Reasons for higher level of presence of
Particulate matter in the Ambient Air and NOx in the source shall be furnished.
ANNEXURE-VIII
P a g e - 12
Statistical analysis (minimum, maximum, arithmetic mean of the ambient air
quality in the study area for the entire three months’ monitoring period is
presented in Table-8.2.
TABLE - 8.1 AMBIENT AIR QUALITY MONITORING LOCATIONS
Sl. No.
Location Code
Location
Aerial Distance
w.r.t. Project
site (km)
Direction w.r.t.
Project
site
Co-ordinates Criteria for Selection
1. AQ1 Near Project Site
0.6 KM SE 23°32'47.26"N
86°32'59.50"E
Representation of the Project
Site & located in most predominant down wind
direction
2. AQ2 Alkusa 2.3 KM SE 23°32'9.87"N
86°33'46.23"E
Located in most
predominant down wind
Direction.
3. AQ3 Dheria 2.1 KM S 23°31'51.89"N
86°32'40.58"E
Located in the settlement
area.
4. AQ4 Kankdiha 4.0 KM WSW 23°32'13.81"N
86°30'27.46"E
Located in the settlement
area.
5. AQ5 Ketlapur Nutandi
3.0 KM NW 23°34'2.15"N
86°31'24.28"E
Located in most predominant
up wind Direction.
6. AQ6 Rahardi 3.4 KM WNW 23°33'28.26"N
86°30'47.84"E
Located in the 2nd
predominant up wind
Direction.
7. AQ7 Barhakanali 3.0 KM N 23°34'33.59"N
86°32'53.11"E
Located in the Settlement
Area.
8. AQ8 Toldi 3.4 KM ENE 23°33'26.21"N
86°34'40.63"E
Located in the Settlement
Area.

ADS POINT -
VIII
Reasons for higher level of presence of
Particulate matter in the Ambient Air and NOx in the source shall be furnished.
ANNEXURE-VIII
P a g e - 13
Location Code Location Name
AQ1 Near Project Site
AQ2 Alkusa
AQ3 Dheria
AQ4 Kankdiha
AQ5 Ketlapur Nutandi
AQ6 Rahardi
AQ7 Barhakanali
AQ8 Toldi
FIGURE-8.1
AMBIENT AIR QUALITY MONITORING STATIONS

ADS POINT -
VIII
Reasons for higher level of presence of
Particulate matter in the Ambient Air and NOx in the source shall be furnished.
ANNEXURE-VIII
P a g e - 14
TABLE-8.2
STATISTICAL ANALYSIS OF AIR POLLUTANTS
(Period: October, 2018 – December,2018)
POLLUTANTS LOCATIONS MES MIN MAX A.M.
PM10
(µg/m3)
Near Project Site 25 68 93 81.7
Alkusa 25 55 88 68.5
Dheria 25 57 90 71.0
Kankdiha 25 52 86 63.6
Ketlapur Nutandi 24 59 95 72.1
Rahardi 24 54 84 67.8
Barhakanali 24 50 77 63.3
Toldi 24 56 80 66.7
OVERALL 196 50 95 69.3
PM2.5 (µg/m3)
Near Project Site 25 28 45 35.2
Alkusa 25 22 38 28.8
Dheria 25 22 41 30.5
Kankdiha 25 19 39 26.3
Ketlapur Nutandi 24 23 42 31.1
Rahardi 24 20 37 29.2
Barhakanali 24 18 32 25.8
Toldi 24 21 36 28.3
OVERALL 196 18 45 29.4
SO2
(µg/m3)
Near Project Site 25 8 18 12.2
Alkusa 25 4 12 7.4
Dheria 25 6 15 8.7
Kankdiha 25 4 13 7.1
Ketlapur Nutandi 24 5 14 8.5
Rahardi 24 4 11 7.3
Barhakanali 24 5 10 7.8
Toldi 24 5 12 8.1
OVERALL 196 4 18 8.4
NO2 (µg/m3)
Near Project Site 25 14 38 23.9
Alkusa 25 13 31 23.4
Dheria 25 10 35 20.8
Kankdiha 25 12 27 18.0
Ketlapur Nutandi 24 13 32 21.3
Rahardi 24 11 28 17.8
Barhakanali 24 10 22 16.4
Toldi 24 16 30 23.7
OVERALL 196 10 38 20.7

APPENDIX - I
Location Near Project Site
PM10 PM2.5 SO2 NO2
(µg/m3) (µg/m
3) (µg/m
3) (µg/m
3)
02.10.2018 68 29 8 23
05.10.2018 76 33 10 16
12.10.2018 85 37 13 20
16.10.2018 71 28 8 17
19.10.2018 77 32 10 22
23.10.2018 69 30 14 19
26.10.2018 83 36 11 22
30.10.2018 76 32 9 17
02.11.2018 81 36 15 24
06.11.2018 70 29 10 19
09.11.2018 90 42 8 14
13.11.2018 87 35 12 21
16.11.2018 78 33 14 24
20.11.2018 83 37 18 32
23.11.2018 90 40 16 22
27.11.2018 85 36 13 38
30.11.2018 86 37 11 23
03.12.2018 89 41 15 26
06.12.2018 92 40 13 32
10.12.2018 80 34 10 24
13.12.2018 89 38 15 29
17.12.2018 83 36 12 26
20.12.2018 78 31 14 36
24.12.2018 84 35 11 24
27.12.2018 93 45 16 27
TABLE: - 1
Onsite Ambient Air Quality Monitoring Results
(Period: OCTOBER, 2018 TO DECEMBER, 2018)
DATE
Page - 1

APPENDIX - I
Location Alkusa
PM10 PM2.5 SO2 NO2
(µg/m3) (µg/m
3) (µg/m
3) (µg/m
3)
02.10.2018 60 26 7 14
05.10.2018 55 22 4 16
12.10.2018 62 27 6 23
16.10.2018 58 24 7 13
19.10.2018 67 29 5 22
23.10.2018 56 22 6 25
26.10.2018 62 26 5 18
30.10.2018 66 28 6 15
02.11.2018 57 22 8 29
06.11.2018 75 33 11 24
09.11.2018 58 23 9 20
13.11.2018 70 30 6 23
16.11.2018 64 27 10 30
20.11.2018 69 30 8 25
23.11.2018 83 37 6 21
27.11.2018 74 32 7 27
30.11.2018 70 29 6 30
03.12.2018 81 36 9 27
06.12.2018 62 25 7 31
10.12.2018 76 29 8 29
13.12.2018 85 38 10 26
17.12.2018 72 30 8 23
20.12.2018 68 24 6 30
24.12.2018 88 38 12 24
27.12.2018 74 32 9 21
TABLE: - 2
Onsite Ambient Air Quality Monitoring Results
(Period: OCTOBER, 2018 TO DECEMBER, 2018)
DATE
Page - 2

APPENDIX - I
Location Dheria
PM10 PM2.5 SO2 NO2
(µg/m3) (µg/m
3) (µg/m
3) (µg/m
3)
02.10.2018 65 26 8 16
05.10.2018 70 31 6 20
12.10.2018 60 23 10 23
16.10.2018 78 36 6 17
19.10.2018 62 25 7 14
23.10.2018 57 23 8 12
26.10.2018 69 30 9 18
30.10.2018 66 26 6 15
02.11.2018 72 35 8 20
06.11.2018 60 22 7 17
09.11.2018 70 32 10 21
13.11.2018 77 34 6 20
16.11.2018 64 24 9 10
20.11.2018 70 30 8 14
23.11.2018 90 41 10 23
27.11.2018 69 29 11 25
30.11.2018 78 37 7 28
03.12.2018 66 25 9 22
06.12.2018 71 31 8 25
10.12.2018 82 39 10 21
13.12.2018 70 29 11 29
17.12.2018 79 36 8 26
20.12.2018 65 27 12 22
24.12.2018 90 40 15 35
27.12.2018 76 33 9 27
TABLE: - 3
Onsite Ambient Air Quality Monitoring Results
(Period: OCTOBER, 2018 TO DECEMBER, 2018)
DATE
Page - 3

APPENDIX - I
Location Kankdiha
PM10 PM2.5 SO2 NO2
(µg/m3) (µg/m
3) (µg/m
3) (µg/m
3)
02.10.2018 58 21 6 17
05.10.2018 52 19 7 14
12.10.2018 56 22 5 12
16.10.2018 64 28 4 16
19.10.2018 55 21 8 14
23.10.2018 64 27 6 12
26.10.2018 69 30 4 15
30.10.2018 57 23 9 18
02.11.2018 66 28 12 22
06.11.2018 59 23 5 20
09.11.2018 70 30 8 13
13.11.2018 60 24 11 22
16.11.2018 86 39 6 16
20.11.2018 62 25 4 21
23.11.2018 67 28 8 16
27.11.2018 60 24 5 22
30.11.2018 72 32 4 17
03.12.2018 62 25 7 20
06.12.2018 57 22 5 17
10.12.2018 65 27 10 15
13.12.2018 58 23 7 26
17.12.2018 70 30 9 20
20.12.2018 67 29 6 16
24.12.2018 73 34 13 23
27.12.2018 60 23 9 27
TABLE: - 4
Onsite Ambient Air Quality Monitoring Results
(Period: OCTOBER, 2018 TO DECEMBER, 2018)
DATE
Page - 4

APPENDIX - I
Location Ketlapur Nutandi
PM10 PM2.5 SO2 NO2
(µg/m3) (µg/m
3) (µg/m
3) (µg/m
3)
03.10.2018 60 26 6 19
06.10.2018 70 31 9 14
10.10.2018 67 28 5 21
13.10.2018 61 25 8 17
17.10.2018 72 32 7 14
20.10.2018 59 23 6 16
24.10.2018 74 32 9 13
27.10.2018 64 26 7 20
31.10.2018 68 29 8 17
03.11.2018 74 33 11 14
07.11.2018 69 31 9 23
14.11.2018 61 24 8 20
17.11.2018 77 34 7 17
21.11.2018 67 27 8 22
24.11.2018 76 33 9 26
28.11.2018 80 36 11 23
04.12.2018 73 32 6 17
07.12.2018 95 42 8 28
11.12.2018 71 30 13 32
14.12.2018 84 36 9 29
18.12.2018 68 28 7 26
21.12.2018 82 37 10 28
25.12.2018 73 31 8 25
28.12.2018 86 40 14 30
TABLE: - 5
Onsite Ambient Air Quality Monitoring Results
(Period: OCTOBER, 2018 TO DECEMBER, 2018)
DATE
Page - 5

APPENDIX - I
Location Rahardi
PM10 PM2.5 SO2 NO2
(µg/m3) (µg/m
3) (µg/m
3) (µg/m
3)
03.10.2018 60 26 5 17
06.10.2018 57 23 9 13
10.10.2018 62 25 4 11
13.10.2018 66 28 8 16
17.10.2018 54 20 4 20
20.10.2018 61 26 7 12
24.10.2018 80 36 9 16
27.10.2018 55 21 5 13
31.10.2018 62 27 9 11
03.11.2018 65 29 6 18
07.11.2018 70 32 8 12
14.11.2018 58 21 4 18
17.11.2018 75 33 9 21
21.11.2018 63 27 6 15
24.11.2018 72 32 10 13
28.11.2018 67 29 8 16
04.12.2018 77 35 6 22
07.12.2018 81 36 11 25
11.12.2018 66 28 8 20
14.12.2018 84 37 7 16
18.12.2018 76 32 9 25
21.12.2018 63 26 11 28
25.12.2018 73 34 6 27
28.12.2018 81 36 7 22
TABLE: - 6
Onsite Ambient Air Quality Monitoring Results
(Period: OCTOBER, 2018 TO DECEMBER, 2018)
DATE
Page - 6

APPENDIX - I
Location Barhakanali
PM10 PM2.5 SO2 NO2
(µg/m3) (µg/m
3) (µg/m
3) (µg/m
3)
03.10.2018 56 22 6 10
06.10.2018 60 25 7 15
10.10.2018 63 27 9 19
13.10.2018 50 18 5 13
17.10.2018 58 22 8 17
20.10.2018 64 26 7 14
24.10.2018 56 21 9 11
27.10.2018 67 28 8 17
31.10.2018 70 30 6 13
03.11.2018 65 27 9 20
07.11.2018 74 30 7 16
14.11.2018 66 28 8 22
17.11.2018 53 21 9 16
21.11.2018 62 27 10 21
24.11.2018 70 31 8 13
28.11.2018 77 32 7 18
04.12.2018 68 28 9 14
07.12.2018 52 19 6 20
11.12.2018 61 26 8 15
14.12.2018 72 30 10 12
18.12.2018 54 21 7 21
21.12.2018 67 29 9 16
25.12.2018 58 21 6 22
28.12.2018 75 32 8 19
DATE
TABLE: - 7
Onsite Ambient Air Quality Monitoring Results
(Period: OCTOBER, 2018 TO DECEMBER, 2018)
Page - 7

APPENDIX - I
Location Toldi
PM10 PM2.5 SO2 NO2
(µg/m3) (µg/m
3) (µg/m
3) (µg/m
3)
03.10.2018 61 24 10 17
06.10.2018 56 21 7 20
10.10.2018 67 29 9 25
13.10.2018 62 26 6 18
17.10.2018 72 32 11 23
20.10.2018 61 25 7 26
24.10.2018 58 23 6 18
27.10.2018 64 28 8 23
31.10.2018 62 25 6 16
03.11.2018 66 28 9 24
07.11.2018 63 26 11 21
14.11.2018 68 30 7 30
17.11.2018 60 25 12 25
21.11.2018 64 27 8 22
24.11.2018 74 33 5 28
28.11.2018 70 31 9 23
04.12.2018 68 29 8 25
07.12.2018 76 33 10 28
11.12.2018 61 25 7 24
14.12.2018 69 29 9 29
18.12.2018 77 35 8 26
21.12.2018 72 31 6 23
25.12.2018 80 36 7 30
28.12.2018 69 29 9 24
TABLE: - 8
Onsite Ambient Air Quality Monitoring Results
(Period: OCTOBER, 2018 TO DECEMBER, 2018)
DATE
Page - 8

APPENDIX-II
Location Near Project Site
DATE PM10 PM2.5 SO2 NO2
(µg/m3) (µg/m3) (µg/m3) (µg/m3)
03.02.2020 77 33 13 27
07.02.2020 83 37 9 16
10.02.2020 62 25 11 21
14.02.2020 70 29 7 32
TABLE: - 1
Onsite Ambient Air Quality Monitoring Results
(Period: 1st February, 2020 TO 14th February, 2020)

APPENDIX-II
Location Alkusa
DATE PM10 PM2.5 SO2 NO2
(µg/m3) (µg/m3) (µg/m3) (µg/m3)
03.02.2020 53 20 7 21
07.02.2020 66 27 6 15
10.02.2020 70 31 10 23
14.02.2020 76 35 9 30
Location Dheria
DATE PM10 PM2.5 SO2 NO2
(µg/m3) (µg/m3) (µg/m3) (µg/m3)
03.02.2020 58 22 4 23
07.02.2020 69 30 7 19
10.02.2020 74 35 9 22
14.02.2020 72 31 8 17
Location Kankdiha
DATE PM10 PM2.5 SO2 NO2
(µg/m3) (µg/m3) (µg/m3) (µg/m3)
03.02.2020 64 27 10 12
07.02.2020 50 15 9 18
10.02.2020 68 29 5 15
14.02.2020 60 24 8 24
TABLE: - 3
Onsite Ambient Air Quality Monitoring Results
(Period: 1st February, 2020 TO 14th February, 2020)
TABLE: - 4
Onsite Ambient Air Quality Monitoring Results
(Period: 1st February, 2020 TO 14th February, 2020)
TABLE: - 2
Onsite Ambient Air Quality Monitoring Results
(Period: 1st February, 2020 TO 14th February, 2020)

APPENDIX-II
Location Ketlapur Nutandi
DATE PM10 PM2.5 SO2 NO2
(µg/m3) (µg/m3) (µg/m3) (µg/m3)
04.02.2020 67 28 13 28
08.02.2020 74 33 9 13
11.02.2020 61 23 8 20
15.02.2020 78 39 13 25
Location Rahardi
DATE PM10 PM2.5 SO2 NO2
(µg/m3) (µg/m3) (µg/m3) (µg/m3)
04.02.2020 66 26 8 16
08.02.2020 56 20 9 19
11.02.2020 70 29 8 22
15.02.2020 79 36 7 15
Location Barhakanali
DATE PM10 PM2.5 SO2 NO2
(µg/m3) (µg/m3) (µg/m3) (µg/m3)
04.02.2020 52 19 6 15
08.02.2020 65 26 4 23
11.02.2020 70 30 8 17
15.02.2020 58 22 7 12
TABLE: - 7
Onsite Ambient Air Quality Monitoring Results
(Period: 1st February, 2020 TO 14th February, 2020)
TABLE: - 5
Onsite Ambient Air Quality Monitoring Results
(Period: 1st February, 2020 TO 14th February, 2020)
TABLE: - 6
Onsite Ambient Air Quality Monitoring Results
(Period: 1st February, 2020 TO 14th February, 2020)

APPENDIX-II
Location Toldi
DATE PM10 PM2.5 SO2 NO2
(µg/m3) (µg/m3) (µg/m3) (µg/m3)
04.02.2020 62 26 6 26
08.02.2020 57 21 7 19
11.02.2020 72 32 12 23
15.02.2020 65 27 8 14
TABLE: - 8
Onsite Ambient Air Quality Monitoring Results
(Period: 1st February, 2020 TO 14th February, 2020)

ADS POINT -
IX
Corporate Environmental Policy envisaging
sharing of responsibility in case of accident/failures shall be furnished.
ANNEXURE-IX
P a g e - 1
Corporate Environment Policy
i. Does the company have a well laid down Environment Policy approved by its Board of Directors? If so, it may be detailed in the EIA report.
Yes. The Company has a well laid down Environment Policy approved by the Board of Directors and ther same is enclosed as Addendum 9.1
ii. Does the Environment Policy prescribe for standard operating process/ procedures to bring into focus any infringement/ deviation/ violation of the environmental or forest norms/ conditions? If so, it may be detailed in the EIA.
Yes. Environment Policy clearly mentions that, in case of emergency (non-compliance/ infringement / deviation / violation / major accident), Head of Environment Department will do immediate reporting to the Executive Director-Corporate, Directors, Chairman of the Company. The detailed policy is
enclosed as Addendum 9.2
iii. What is the hierarchical system or Administrative order of the company to deal with the environmental issues and for ensuring compliance with the environmental clearance conditions? Details of this system may be given.
The hierarchical system or Administrative Order of the company to deal with environmental issues and for ensuring compliance with the environmental clearance conditions is furnished as Addendum 9.2.
iv. Does the company have system of reporting of non-compliances/ violations of environmental norms to the Board of Directors of the company and/or shareholders or stakeholders at large? This reporting mechanism shall be detailed in the EIA report.
Yes. To have proper checks and balances, the company has a well laid down system of reporting of non-compliances/violations of environmental norms to the Board of Directors of the company and the same is enclosed Addendum
9.2
CMD
ED - CORPORATE
Head - Environment Management Cell
Environment Health Safety
Env. Officer / Engg. Medical Officer Safety Officer
Unit Head
Operation Head

ADS POINT -
IX
Corporate Environmental Policy envisaging
sharing of responsibility in case of accident/failures shall be furnished.
ANNEXURE-IX
P a g e - 2
Addendum 9.1 Environment Policy approved by the Board of Directors

ADS POINT -
IX
Corporate Environmental Policy envisaging
sharing of responsibility in case of accident/failures shall be furnished.
ANNEXURE-IX
P a g e - 3
Addendum 9.2
Standard operating process/procedures of Environment Policy to bring into focus any infringements/deviation/violation of the environmental or forest
norms/conditions

ADS
POINT - X
Time bound action plan for green belt
development covering 33% of the plant with a tree density of 2500/ha shall be prepared
and submitted.
ANNEXURE-X
P a g e - 1
M/s Bravo Sponge Iron Pvt. Ltd. has earmarked 10.47 Hectares (25.87
acres) for Green Belt Development, which is 33% of the total plant area of 31.73 hectares (78.37 acres) of land (Existing & Proposed Project). Around
26,175 numbers of trees (@2500 nos. of tree per hectare) has been considered under plantation programme for greenbelt development.
Out of this 10.47 Hectares of land for greenery, 5.38 Hectares of land is already having green belt for existing project area.
Remaining 5.09 hectares will be utilized for green belt development in the plant area for proposed project where around 12725 numbers of trees
(@2500 trees per hectare) will be planted.
Hence there will be total 26225 trees (Existing (13500) + Proposed (12725)) on 10.47 hectares of land after implementation of the proposed project.
Time Schedule: The proposed project land for Development of greenbelt will be completed in a phased manner within a span of three (3) years with continuous
and intensive maintenance for 5.09 Hectares (12.57 acres).
Total Cost
Rs. 1,14,45,000 have been envisaged to be spent in three years for development of greenbelt on 5.09 hectares (12.57 acres) of land for total
15.42 hectares land for the proposed project. Please refer below Table no 10.1
Rs. 2,93,47,500 have been earmarked as three years’ expenditure for the maintenance of the greenbelt on the entire 10.47 hectares land (25.87
acres) for the overall plant area (31.73 hectares). Please refer below Table no 10.2
Apart from above, Rs. 14,67,300 are estimated as an expenditure for yearly maintenance of green belt area after completion of project implementation
period of 3 years.
Area Total
area
Green Belt Area
Required
(33%)
Developed as on 15.03.2020 Balance
%age Land Trees %age Land Trees
Existing Project
40.29
Acres
13.30
Acres
100% 13.30
Acres
13500
Nos. Completed
Proposed Project
38.08
Acres
12.57
Acres
0 0 0 100% 12.57
Acres
12725
Nos.
Total Project
78.37
Acres
25.87
Acres 51%
13.30
Acres
13500
Nos. 49%
12.57
Acres 12725 Nos. 31.73
Hectares
10.47
Hectares
5.38
Hectares
13500
Nos.
5.09
Hectares

ADS
POINT - X
Time bound action plan for green belt
development covering 33% of the plant with a tree density of 2500/ha shall be prepared
and submitted.
ANNEXURE-X
P a g e - 2
Time bound action plan for green belt development
Phase Wise Green Belt Development Plan: Green belt will be developed in a phase wise manner right from the construction phase of the project. In the first
phase of construction with the start of the construction activity, the areas along the plant boundary, the areas around the proposed temporary solid waste
storage and those along the major roads will be considered for tree plantation. In the second phase of the construction, the area around the office building will be
covered under tree plantation. And, in the third phase of the construction, when all the construction activity will be complete, plantation will be taken up in the
plant area, in different patches of the open land and along the remaining roads.
Table no 10.1
Time Schedule and Approximate Capital Cost of the Proposed Green Belt
Year of establishment /
formation
Area to be planted
(in Acres)
Expenditure on Formation/ Establishment
@ 3035 Mandays (MD) /Acre
1st Year 5 15,175 MD or Rs. 45,52,500
(For 5 acres)
2nd Year 5 15,175 MD or Rs. 45,52,500
(For 5 acres)
3rd Year 2.56 7770 MD or Rs. 23,31,000
(For 2.56 acres)
Total Initial Cost
12.57 38150 MD
Or ≡ Rs. 1,14,45,000
Average initial cost of Greenbelt Establishment is @ Rs. 900.00 per Plant; spread over a span of 3 Years of establishment.
At current wage rate of Rs. 300 per Manday (MD), it is Equivalent to 3 MD
per plant or Approximately 3035 MD per Acre, at current rate.

ADS
POINT - X
Time bound action plan for green belt
development covering 33% of the plant with a tree density of 2500/ha shall be prepared
and submitted.
ANNEXURE-X
P a g e - 3
Table no 10.2
Time Schedule and Approximate Maintenance Cost of the Green Belt for Overall Green Belt
Year of establishment
Area to be planted
(in Acres)
Cumulative Area
(in Acres)
Year wise Expenditure on Maintenance
per Acre
Total Year wise Expenditure on Maintenance
At the start Existing 13.30
1st Year 5.0
18.30 Maintenance @ 2125 MD /
Acre
38887 MD or Rs. 1,16,66,100
(For 18.30 acres.)
2nd Year 5.0
23.30 Maintenance @ 1518 MD /
Acre
35370 MD or Rs. 1,06,11,000 (For 23.30 acres)
3rd Year 2.57
25.87 Maintenance @ 911 MD /
Acre
23,568 MD or Rs. 70,70,400
(For 25.87 acres)
Total 25.87
- 97825 MD
Or ≡
Rs. 2,93,47,500 Approximate Annual cost of maintenance beyond initial establishment phase is: @ 5% of 97825 MD ≡ 4,891 MD / Year
4,891 MD / Year Or
Rs. 14,67,300/Year
1. Cost of raising greenbelt is expressed in man day equivalent to take care of future cost escalations.
2. First year maintenance operation cost is 70% of Initial Establishment cost. It is equivalent to 2125 MD per Acre.
3. Second Year maintenance operation cost is 50% of Initial Establishment cost. It is equivalent to 1518 MD per Acre.
4. Third Year maintenance operation cost is 30% of Initial Establishment cost
It is equivalent to 911 MD per Acre.
5. Annual recurring maintenance cost of the entire greenbelt after completion of project implementation period is approximately @ 5% of initial cost of Establishment of Greenbelt or Subsequent recurring expenditure on green belt maintenance is 152 MD Per year per Acre.

ADS
POINT - X
Time bound action plan for green belt
development covering 33% of the plant with a tree density of 2500/ha shall be prepared
and submitted.
ANNEXURE-X
P a g e - 4
TECHNIQUES FOR PLANTATION
Implementation of afforestation program is of paramount importance for any
industrial development. In addition to augmenting present vegetation, it will also check soil erosion, make the ecosystem more stable, make the climate more conductive and restore water balance. It can also be employed to bring
areas with special problems under vegetation cover and prevent further land deterioration. The potential value of vegetation in controlling air pollution has been well recognized. Trees helps in filtering particulates and are an
effective pollutant sink. Vegetation also reduces noise level and regulates the oxygen balance in the area by consuming released carbon dioxide and
attenuation of noise level. The main objective of the greenbelt is to provide a barrier between the plant
and the surrounding areas. The greenbelt helps to capture the fugitive assimilation of toxic gases and to attenuate the noise generated in the plant
apart from improving the aesthetics of the plant site. This includes plantation in the plant premises, along the internal and external roads, all around the boundary wall along the administrative buildings etc.
The plant species selected for greenbelt are mainly the native species. These saplings are planted in 2-3 rows with 10m to 15m width with a tree density of
about 2500 trees/ha. The trees will be watered preferably using the treated effluent. They will be manured using sludge from the sewage treatment plant (STP). In addition,
kitchen waste from the plant canteen can be used as manure after composting or by directly putting the manure at the base of the plants. The data on area of
green cover, survival rate etc. will be compiled for periodic review. However, following plan shall be made for green belt development:
Annual plans for tree plantation with specific number of trees to be
planted shall be made. The fulfillment of the plan shall be periodically monitored by the company’s Environment Department.
A plan for post plantation care will be reviewed in the monthly meetings. Any abnormal death rate of planted trees shall be investigated and
replacement will be ensured with suitable indigenous species.
Watering of the plants, manuring, weeding, cultivation will be carried out
for minimum 3 years and later as per requirement.
The proposed greenbelt area is to be demarcated properly with fencing to avoid intrusion and damages.

ADS
POINT - X
Time bound action plan for green belt
development covering 33% of the plant with a tree density of 2500/ha shall be prepared
and submitted.
ANNEXURE-X
P a g e - 5
Choice of Species and Quality planting materials: Quality Planting Materials of
Indigenous and naturalised species as mentioned above will be planted in 2-3 rows in the greenbelt, having a stand structure of 2500 plants per Hectare.
Planting materials will have following quality parameters:
Seedlings selected for plantation will be healthy and raised from very good quality seeds from good and proven provenance.
No root coiling will be allowed for the seedlings by adopting continuous shifting and grading procedures in the nursery.
Only the seedlings having height 900-1000 mm or more shall be used. (Height is measured from collar to tip).
Only the seedlings having collar diameter more than 20-25 mm shall be used.
Age of the seedlings shall be 12 month or more.
Non-succulent, hardened, vigorous, healthy and morbidity free seedlings shall be used.
Seedlings which can grow under the influence of Nitrogenous fertilizers shall be used.
Average height of the seedlings of a given species shall be 90% of the Maximum height of that species.
Native Species/seeds will be considered for plantation in consultation with local Horticulturists and Forest Department.
Selected Species shall be having large crown volume, rapid growth and
capacity to endure water stress and climatic conditions and tree species
selected for green belt is presented in Table-10.3.

ADS
POINT - X
Time bound action plan for green belt
development covering 33% of the plant with a tree density of 2500/ha shall be prepared
and submitted.
ANNEXURE-X
P a g e - 6
Table-10.3
Tree Species Recommended for Greenbelt Plantation
LIST OF SELECTED TREES FOR PLANTATION
SL. NO. TREE SPECIES COMMON NAME
1 Pongamia pinnata Karanj
2 Mimusops elengi Bakul
3 Butea monosperma Palash
4 Cassia fistula Amaltas
5 Dalbergia sissoo Sissoo
6 Anthocephalus indicus Kadam
7 Ficus benghalensis Banyan
8 Ficus religiosa Peepal
9 Swietenia macrophyla Mehagini
10 Acacia auriculiformis Sonajhuri
11 Spathodia campanulata Spathodia
12 Terminalia arjuna Arjun
13 Albizia lebbeck Siris
14 Ficus virens Pakur
15 Polyalthia longifolia Ashoka
16 Azadirachta indica Neem
17 Peltophorum pterocarpum Radhachura
18 Alstonia scholaris Chhatim
Planting techniques and methods (Technical standards):
Dimension of the pits shall be 1000mm x 1000mm x 1000mm to promote immediate and appropriate roots establishment. This dimension of the pits is chosen to avoid heat shocks to the roots due to refractory nature of the soil and extreme climatic condition. Better pit dimension makes aeration better and it improves edaphic factors.
Pit should be filled with dug out soil mixed with sand and manure with a ratio of soil: sand: manure = 2:1:1. This mixture is to be treated with appropriate fungicides andInsecticides as per the site condition to enhance

ADS
POINT - X
Time bound action plan for green belt
development covering 33% of the plant with a tree density of 2500/ha shall be prepared
and submitted.
ANNEXURE-X
P a g e - 7
the conducive edaphic factors in order to promote faster growth and better survival of the plants.
Staggered trenched are to be provided within the rows for better moisture conservation.
Major plantation will be done in the Monsoon season.
Post Planting Maintenance Operations:
Regular watering as and when required. In summer season, watering frequency will be increased so as to maintain moisture level in the soil to save plants from water scarcity.
Without prejudice to any other definition of summer; for the present work, summer is defined as the climatic condition in which maximum diurnal temperature exceeds 35 degree Celsius.
Regular watch & ward throughout the year.
In a year, minimum 3-nos.of weeding, soil working backed by nutrient and fertilizer application is to be carried out for proper nourishment
Every year, there should be 100% casualty replacement as per field requirements.
Plant hygiene will be maintained round the year with proper care.
Morbid plants will be treated as casualty and will be replaced every year along with casualty replacement.
Officer in-charge of environmental management will evaluate every month all Planting and other Afforestation work.
Appropriate textual and visual documentation will be maintained. Chronological log of the afforestation work is to be thoroughly maintained and preserved.
Planting density shall be 2500 Plants per Hectare.

ADS POINT - XI
Details of the producer gas plant along with the pollution control systems
envisaged shall be furnished.
ANNEXURE-XI
P a g e - 1
PRODUCER GAS PLANT
Coal Gas, produced in Producer Gas Plant (PGP) using coal gas
technology, will be used as fuel in the pellet plant. This is a clean fuel.
The composition of Producer Gas is given below:
CH4: 1.5%
H2: 13.0%
CO: 25.0%
CO2: 6.0%
N2: 53.9%
H2S: 0.20%
O2: 0.60%
Net Calorific Value: 1350 Kcal/Nm3
There will be 12 nos. coal gasifiers to produce 4000 Nm3/hour of producer gas. In a fixed bed gasifier, the coal passes downward in counter current direction to gas flow, through various phases
(devolatisation, gasification and combustion zones). Mixture of air and steam is introduced in lower part of gasifier through rotating grate. The
basic reaction, which takes place in a typical fixed bed gasifier is:
Coal + Air + Steam = CO2 + CO + H2 + CH4 + Tar + Ash
PROCESS DESCRIPTION
The proposed coal gasification facility consists of 12 Nos. of 4.0 m
diameter with a cumulative installed capacity of 60 million kcal/hour. The operating capacity is expected to be about 54 million kcal/hour.
The configuration of gasifiers will be in “cold-clean gas mode”, with “indirect cooling” and separation of tar.
There will be common coal feeding system consisting of a feeding conveyor from ground hopper conveying coal onto the horizontal
conveyor on top of battery of 12 X 4.0 m gasifiers. The said system of conveyors will supply coal to “top storage bunkers” of individual gasifiers as per process demand.

ADS POINT - XI
Details of the producer gas plant along with the pollution control systems
envisaged shall be furnished.
ANNEXURE-XI
P a g e - 2
The coal feeding system of individual gasifiers, consisting of
pneumatically operated twin feeding doors, feeds coal into the gasifier reactor from the top storage bunker as per process demand.
Coal is converted into hot producer gas in a water jacketed reactor through a series of thermo-chemical reactions. Water in the water jacket of the gasifiers is converted into steam and then used in the
gasification process.
Ash generated during the gasification process travels down into the ash pan placed below the reactor. The ash pan is slowly rotated to facilitate discharge of ash from pan onto the ash conveyor. Ash pan also contains
water, into which the bottom of the reactor is dipped. This creates a rotating water seal joint for discharge of ash through the water seal. The
ash conveyor carries ash from each of the gasifiers to the ash dump (ash bunker). From the ash dump (ash bunker), the ash will be periodically disposed-off to landfill sites within the company premises
or to third party customers.
Gas coming out of individual gasifier reactors will be hot and raw. The
gas cooling & cleaning system consists of indirect cooling type centrifugal tar separators and electrostatic precipitators.
Hot-raw gas, exiting from the gasifiers will first be cooled and about 80% tar is separated in centrifugal tar separators. Gas from these
separators goes to a common header to be conveyed to electrostatic tar separators. Tar from centrifugal tar separators gets collected in individual collection pots and then is pumped to tar storage. Cooling
water is continuously circulated to tar separators for external cooling of gas. The temperature of cooling water is maintained within limits with
the help of cooling towers.
Residual tar in gas is separated out in electrostatic tar precipitators.
The tar, so separated, will be first collected in tar pits and then transferred to tar tanks for storage. Tar has a good market value and
will be sold to authorized chemical manufacturers.
Various water seals are used for isolation of gas within the gasifier
block, along the gas pipeline and in the gas utilization area. Water used in the seals will be collected when the seals are emptied and the same

ADS POINT - XI
Details of the producer gas plant along with the pollution control systems
envisaged shall be furnished.
ANNEXURE-XI
P a g e - 3
water is re-used for filling the seals. So, there is no regular disposal of seal water. But there could be occasional disposal of seal-water. Such
water (which would contain traces of phenols) would be incinerated in the after burning chambers of sponge iron kilns.
Coal Tar generated from PGP shall be collected using “Centrifugal Tar Separator” and used as Fuel in DRI Kiln / alternately sold to authorized re-processors. No waste water will be generated from the
process.
CENTRIFUGAL TAR SEPARATOR
Indirect Type Centrifugal Tar Separator consists of 2 stages of indirect cooling of gas and simultaneous centrifugal tar separation. As can be
seen in the figure, gas rises upwards from the water seal into the first stage of separator. At the top of first stage, high velocity centrifugal
motion is imparted to gas to separate out droplets of tar. As the gas travels down in the outer annular path, it is cooled by external forced cooling. At the same time, condensed and separated tar travels down
along the wall of the annular path. As the gas enters the second stage,
it is cooled and therefore tar separation is more
effective. Here, again, similar action of high velocity centrifugal
separation and indirect forced cooling is repeated.

ADS POINT - XI
Details of the producer gas plant along with the pollution control systems
envisaged shall be furnished.
ANNEXURE-XI
P a g e - 4
However, wastewater generated during the stage of gas cooling shall be charged in the ABC of DRI plant.
In Indirect Type Centrifugal Tar Separator, there is no direct contact of gas with water. The cooling is done by heat transfer through wall to circulating water. Tar is removed by centrifugal action without any
washing with water. Therefore, phenolic water is not generated in this method of tar separation and the associated water pollution issues are
completely eliminated.
Generated Tar from the proposed producer gas plant will be temporarily
stored at an isolated location inside the plant premises. Storage capacity for Tar will be around 60 Mt. Finally, it will be used as Fuel in DRI Kiln / alternately sold to authorized re-processors approved by
SPCB / CPCB.

ADS POINT - XI
Details of the producer gas plant along with the pollution control systems
envisaged shall be furnished.
ANNEXURE-XI
P a g e - 5
RAW MATERIAL HANDLING SYSTEM OF PGP
To Control the fugitive emission during coal feeding in the PGP, following
system has been considered.
Using covered ground hopper with fogging system mixed with air and
water to settle down dust
Installing bag filter to control the fugitive emission from different
transfer pointas shown in below Diagram
Pollutant and pollution control systems
Wastewater generated during the stage of gas cooling shall be charged in the ABC of DRI plant.
As explained above, that “ In Indirect Type Centrifugal Tar Separator” Tar is removed by centrifugal action without any washing with water.
Therefore, phenolic water is not generated in this method of tar separation and the associated water pollution issues are completely eliminated
Generated Tar from the proposed producer gas will be used as Fuel in DRI Kiln / alternately sold to authorized re-processors approved by SPCB /
CPCB.
Dust emission during conveying and feeding of coal to producer gas plant will be mitigated by Using covered ground hopper with fogging system mixed with air and water to settle down dust and also by installing bag filter to control the fugitive emission from different transfer point