86p. (sternberg) - files.eric.ed.gov · pdf filea triarchic approach to giftedness. robert j....
TRANSCRIPT

ED 429 393
AUTHORTITLEINSTITUTION
SPONS AGENCY
REPORT NOPUB DATENOTECONTRACTAVAILABLE FROM
PUB TYPEEDRS PRICEDESCRIPTORS
IDENTIFIERS
ABSTRACT
DOCUMENT RESUME
EC 307 131
Sternberg, Robert J.A Triarchic Approach to Giftedness.National Research Center on the Gifted and Talented, Storrs,CT.; Yale Univ., New Haven, CT.Office of Educational Research and Improvement (ED),Washington, DC.RM-951261995-09-0086p.
R206R00001NRC/GT, University of Connecticut, 362 Fairfield Road, U-7,Storrs, CT 06269-2007.Reports Research (143)MF01/PC04 Plus Postage.*Cognitive Style; Construct Validity; Creativity; ElementarySecondary Education; *Gifted; Labeling (of Persons);Learning Theories; *Teacher Student Relationship; TeachingModels; *Theory Practice Relationship*Sternberg (Robert); Triarchic Theory of Intelligence(Sternberg)
This report describes four projects that apply Robert J.Sternberg's theories to various aspects of giftedness and gifted performance.Project 1, a construct validation and educational application of Sternberg'striarchic theory of human intelligence, revealed that students who areinstructed and whose achievement is evaluated in a way that matches (at leastpartially) their profile of abilities will perform better in school thanchildren who are mismatched. Project 2, which examined the construct validityof Sternberg's theory of mental self-government, found that teachers tend to:(1) evaluate more positively students who match their own profile or styleand (2) overestimate the extent to which students match their own style ofthinking. Project 3, construct validation of Sternberg and Lubart'sinvestment theory of creativity, found that creative individuals are peoplewho "buy low and sell high" in the world of ideas. Project 4, aninvestigation of Sternberg's pentagonal implicit theory of giftedness, foundthat society labels people as gifted to the extent that the people meet fivecriteria: excellence, rarity, productivity, demonstrability, and value.Overall, the four projects reveal the value of a theory-based approach tounderstanding giftedness. Each of the four parts contains references.(Author/DB)
********************************************************************************* Reproductions supplied by EDRS are the best that can be made *
* from the original document. *
********************************************************************************

ro_
cf.)
7 8 5The University of Georgia
THE NATIONAL
RESEARCH CENTER
ON THE GIFTED
AND TALENTED
The University of ConnecticutThe University of GeorgiaThe University of VirginiaYale University
A Triarchic Approach to Giftedness
Robert J. Sternberg
U.S. DEPARTMENT OF EDUCATIONOffice of Educational Research and Improvement
EDUCATIONAL RESOURCES INFORMATIONCENTER (ERIC)
034his document has been reproduced asreceived from the person or organizationoriginating it.
CI Minor changes have been made toimprove reproduction quality.
Points of view or opinions stated in thisdocument do not necessarily representofficial OERI position or policy.
BESTCOPY AVAILABLE
Yale UniversityNew Haven, Connecticut
September 1995Research Monograph 95126
2

A Triarchic Approach to Giftedness
Robert J. Sternberg
Yale UniversityNew Haven, Connecticut
September 1995Research Monograph 95126
THE NATIONALRESEARCH CENTERON THE GIFTEDAND TALENTED
The National Research Center on the Gifted and Talented (NRC/GT) is funded under theJacob K. Javits Gifted and Talented Students Education Act, Office of EducationalResearch and Improvement, United States Department of Education.
The Directorate of the NRC/GT serves as the administrative and a research unit and islocated at The University of Connecticut.
The participating universities include The University of Georgia, The University ofVirginia, and Yale University, as well as a research unit at The University ofConnecticut.
The University of ConnecticutDr. Joseph S. Renzulli, Director
Dr. E. Jean Gubbins, Assistant Director
The University of ConnecticutDr. Francis X. Archambault, Associate Director
The University of GeorgiaDr. Mary M. Frasier, Associate Director
The University of VirginiaDr. Carolyn M. Callahan, Associate Director
Yale UniversityDr. Robert J. Sternberg, Associate Director
Copies of this report are available from:NRC/GT
The University of Connecticut362 Fairfield Road, U-7Storrs, CT 06269-2007
Research for this report was supported under the Javits Act Program (Grant No. R206R00001) asadministered by the Office of Educational Research and Improvement, U.S. Department ofEducation. Grantees undertaking such projects are encouraged to express freely their professionaljudgement. This report, therefore, does not necessarily represent positions or policies of theGovernment, and no official endorsement should be inferred.
II 4
Note to Readers...
All papers by The National Research Center on the Gifted and Talented may bereproduced in their entirety or in sections. All reproductions, whether in part or whole,should include the following statement:
Research for this report was supported under the Javits Act Program(Grant No. R206R00001) as administered by the Office of EducationalResearch and Improvement, U.S. Department of Education. Granteesundertaking such projects are encouraged to express freely theirprofessional judgement. This report, therefore, does not necessarilyrepresent positions or policies of the Government, and no officialendorsement should be inferred.
This document has been reproduced with the permission of The NationalResearch Center on the Gifted and Talented.
If sections of the papers are printed in other publications, please forward a copy to:
The National Research Center on the Gifted and TalentedThe University of Connecticut362 Fairfield Road, U-7Storrs, CT 06269-2007
Please Note: Papers may not be reproduced by means of electronic media.
iii 5
A Triarchic Approach to Giftedness
Robert J. Sternberg
Yale UniversityNew Haven, Connecticut
ABSTRACT
This final technical report describes four projects that apply Robert J. Sternberg's theoriesto various aspects of giftedness and gifted performances. Project I, a construct validationand educational application of Sternberg's triarchic theory of human intelligence, revealedthat students who are instructed and whose achievement in evaluated in a way that matches(at least partially) their profile of abilities will perform better in school than children who aremismatched. Project II, which examined the construct validity of Sternberg's theory ofmental self-government, found that teachers tend to (a) evaluate more positively studentswho match their own profile of style, and (b) overestimate the extent to which studentsmatch their own style of thinking. Project ifi, construct validation of Sternberg and Lubart'sinvestment theory of creativity, found that creative individuals are people who "buy low andsell high" in the world of ideas. Project W, an investigation of Sternberg's pentagonalimplicit theory of giftedness, found that society labels people as gifted to the extent that thepeople meet five criteriaexcellence, rarity, productivity, demonstrability, and value.Overall, the four projects reveal the value of a theory-based approach to understandinggitedness.
6

A Triarchic Approach to Giftedness
Robert J. Sternberg
Yale UniversityNew Haven, Connecticut
EXECUTIVE SUMMARY
The four projects described in this final technical report apply Robert J. Sternberg'stheories to various aspects of giftedness and gifted performance. They differ in whichtheories were applied, and, of course, in the methods and data. All of the projects investigatehigher level cognition and its ramifications in gifted individuals.
Project I, the main project of the five-year grant period, is a construct validation andeducational application of Sternberg's triarchic theory of human intelligence. The projectwas designed to show that students who are instructed and whose achievement is evaluatedin a way that matches at least partially their profile of abilities will perform better in schoolthan children who are mismatched. High school students who were instructed inintroductory psychology did in fact perform significantly and substantially better when theywere matched rather than mismatched.
Project II investigated the construct validity of Sternberg's theory of mental self-government, a theory of thinking and learning styles. The basic idea is that people differ notonly in their abilities, but in how they apply these abilities to the tasks they face. Thus,styles are at the interface between abilities and personality. For example, a legislative personlikes to generate new ideas, but is not necessarily adept at generating such ideas. Anexecutive person prefers to work within existing frameworks for ideasto be told what todo. A judicial person likes to evaluate ideas. The data from four schools suggest that thetheory can be quite useful for understanding educational phenomena. For example, it wasfound that teachers tend to evaluate more positively students who match their own profile ofstyles. Teachers also overestimate the extent to which students match their own style ofthinking.
Project DI investigated the construct validity of Sternberg and Lubart's investmenttheory of creativity. According to this theory, creative individuals are people who "buy lowand sell high" in the world of ideas. They generate ideas that are unpopular and oftendisparaged; they convince other people of the worth of these ideas; and then they move onto other new and unpopular ideas. According to the theory, creative performance representsa confluence of intelligence, knowledge, thinking styles, personality, motivation, andenvironment. The construct validation was consistent with the predictions of the investmenttheory.
Project IV investigated Sternberg's pentagonal implicit theory of giftedness.According to this theory, a society labels people as gifted to the extent that the people meetfive criteria: (a) excellence, (b) rarity, (c) productivity, (d) demonstrability, and (e) value. Inother words, a person needs to excel in something in a way that is rare, needs to producesome kind of product or products, and thereby to demonstrate giftedness, and the productmust be of a kind that is valued. Data from two different samples were consistent with thevalidity of the theory.

The data from the four projects help advance our understanding of different aspectsof giftedness, both with respect to persons and products. In particular, they show the valueof a theory-based approach to understanding giftedness.
8viii
Table of Contents
ABSTRACT
EXECUTIVE SUMMARY VII
PART 1: A Triarchic Analysis of an Aptitude-Treatment Interaction 1
Traditional Means of Testing Intelligence and Their Implications for ATI 1
Methods 2Participants 2Materials 3
Ability Test 3Instructional Material 4Assessment of Achievement 4Design 5Procedure 5
Results 5Discussion 14References 17
PART 2: Styles of Thinking in School 21Approaches to Styles of Thinking 21The Theory of Mental Self-Government 22
Functions 22Forms 22Levels 23Leanings 23
General Methods 23Schools 23Participants 23Measures 24
Study 1: Teacher Styles 24Item Examples 24Results and Discussion 26
Grade Taught 26Subject Taught 27Duration of Teaching Experience 27Styles Across Schools 27School Styles 29
Study 2: Student Styles 29Method 29Results and Discussion 30
Study 3: Styles of Teachers and Students in Interaction 31Method 31Results and Discussion 31
General Discussion 34References 37
PART 3: An Investment Approach to Creativity: Theory and Data 39Six Resources for Creativity and Their Confluence 40Study 1: Testing the Investment Resources for Creativity 42
Method 43
Table of Contents (continued)
Results and Discussion 45Aspects of Creative Performance 46
Person-Centered Resources and Creative Performance 47Intellectual Processes 47Knowledge 49Intellectual Styles 49Personality 50Motivation 51A Developmental Trend 52
Testing the Confluence of Resources 53Study 2: Cognitive Risk-Taking and Creative Performance 54
Method 54Results and Discussion 56
Aspects of Cognitive Risk-Taking 56Risk-Taking and Creative Performance 57
Conclusions 57References 61
PART 4: What Do We Mean by "Giftedness"? A Pentagonal Implicit Theory 65The Nature of Implicit Theories 65The Pentagonal Implicit Theory of Giftedness 66The Role of Explicit Theories 68
Data 69Method 69Results 70
Implications for Educational Practice 71References 73
1 0x
List of Tables
Table 1.1 Basic Statistics for the STAT M-C: High School Level Means andStandard Deviations 6
Table 1.2 Overall Correlations of STAT Ability Scores 6
Table 1.3 Re liabilities of the STAT: High School Level 7
Table 1.4 Principal-Component Analysis With Varimax Rotation of STAT 8
Table 1.5 Concurrent Validities of the STAT With Other Ability Tests 8
Table 1.6 Inter-Rater Re liabilities (Intercorrelations) of Quality Ratings ofAchievement Measures for Four Judges 9
Table 1.7 Correlations of Combined STAT Multiple Choice and Essay ScoresWith Course Assessments 10
Table 1.8 Stepwise Multiple Regression of Course Performance on STATMultiple Choice Items and Essays 11
Table 1.9 Contrasts on Quality Ratings 12
Table 1.10 Raw Frequency Counts of Students With H.igh ("Best") Performancesin Total, and According to Whether They Were Matched orMismatched in Terms of Gifted Ability and Instruction 13
Table 1.11 Odds Ratios of Belonging to the "Best Performance" Group, Given aMatch Between Ability and Instruction 14
Table 2.1 Examples of Some of the Items and Reliability Coefficients of theScales of the Thinking Styles Questionnaire for Teachers, Set ofThinking Styles Tasks for Students and the Questionnaire of Students'Thinking Styles Evaluated by Teachers 25
Table 2.2 Teachers' Thinking Styles Influenced by the Type of School 28
Table 2.3 The Weights and the Z(s) of the Planned Contrasts 30
Table 2.4 Correlations Between Teachers' and Students' Thinking Styles Scores 32
Table 2.5 Do Teachers Overestimate the Extent to Which Their Students MatchTheir Own Style? 33
Table 2.6 Correlations Between Students' Grades Given by the Teachers WithCertain Thinking Styles and Students' Thinking Styles 34
Table 3.1 Correlations Across Creative Performance Domains 47
Table 3.2 Correlations of Resources With Rated Creative Performance 48
Table 3.3 Intercorrelations of Resources 50
I'

List of Tables (continued)
Table 4.1 Summary of Multiple Regression Analyses: Student Sample
Table 4.2 Summary of Multiple Regression Analyses: Parent Sample
12xii
70
71
A Triarchic Approach to Giftedness
Robert J. Sternberg
Yale UniversityNew Haven, Connecticut
PART 1: A Triarchic Analysis of an Aptitude-Treatment Interaction
Can we expand our notions of intelligence in order to include aspects of humanfunctioning beyond those encompassed by conventional psychometric theories ofintelligence? If so, is it possible systematically to measure intelligence in these broaderways? And if so, might such new measures shed new light on the existence of aptitude-treatment interactions in the schools? The work reported in this monograph addresses theseand related questions.
Part 1 of this monograph is divided into three main parts. First, we briefly discusstraditional ways of measuring human intelligence and their implications for understandingaptitude-treatment interactions (ATI). Next, we present some data on the use of theSternberg Triarchic Abilities Test (STAT), as one alternative to traditional psychometricmeasures of intelligence and as a means for elucidating ATIs. And finally, we discuss somegeneral implications of our findings.
Traditional Means of Testing Intelligence and TheirImplications for ATI
Identifying someone as intelligent implies that he or she has a high level of ability inat least some area. For example, "intelligent students" are ones identified as excelling in oneor more academic disciplines, such as reading or mathematics, or in some sort of intellectualactivity, such as memory or analysis. Although there is often informal agreement about whois intelligent in some way, there is often disagreement about how best to measureintelligence. In other words, beyond simple academic success, how is one able to detectindividuals who should perform well in school or on the job, whether or not they actuallydo?
Historically, measurement of intelligence in academic settings dates back to Binetand Simon, who developed a scale to distinguish normal children from children deficient inmental ability (Binet & Simon, 1905, 1908). Their scale consisted of a series of 30 tasks ofincreasing difficulty. Although varied, most of the tasks relied on understanding languageand on ability to reason using verbal or nonverbal (spatial and mathematical) materials. Thistest was later adapted by Terman to create the American Stanford-Binet Intelligence Scale(Terman, 1916), and to create similar tests such as the Wechsler Intelligence Scale forChildren-III (Wechsler, 1991).
After the success of early individually-administered tests at predicting academicperformance, group tests of cognitive ability were developed by Burt (1911) and by Otis(1918), the latter for use in testing recruits during World War I. Although these testscontinued to require direct answers to questions or solutions to problems, some of themused the multiple-choice procedure. More recently, a further refinement has beenintroduced in the form of computer-generated tests that adjust the difficulty of the questions
2
given to the examinee as a function of the success rate at previously generated questions(Mead & Drasgow, 1993). These conventional tests of intelligence tend to be based upontraditional psychometric notions of intelligence (e.g., Binet & Simon, 1908; Spearman,1927; see Sternberg, 1990, for a review of such notions; Thurstone, 1938), rather than onmore recent theoretical notions of what makes someone intelligent.
Current versions of these tests yield an overall score, an intelligence quotient (IQ),for which the average score is 100 and the standard deviation is about 15. The tests alsoyield subscores: for example, on the Wechsler tests, one obtains a total score as well asverbal and performance test scores. IQs are computed on the basis of scores that measurehow unusual a person's performance is vis a vis the performance of others in the same agegroup.
To the extent that the goal of these tests is to predict a wide variety of performancesin school, they have unquestionably been partially successful. However, teachers as well aspsychologists have increasingly become interested in the identification of children who areintelligent in ways that go beyond IQ (Renzulli, 1986; Richert, 1991; Sternberg, 1985, 1992,1994; Sternberg & Davidson, 1986). One reason for this trend is that IQ tests leave muchof the variance in performance unexplained. Although these tests allow better prediction ofperformance than is possible without using them, they typically show only a moderatecorrelation with measures of school performance (r = .40 to r = .70) (Wigdor & Garner,1982). The modest to moderate proportions of the variance accounted for by these testssuggests that new tests might improve the level of prediction obtained.
As theoretical work on intelligence has advanced, there has also been an increasinginterest in theory-based assessments that can help explain human intelligence, as well aspredict potentially intelligent performance in school and other settings. This theoreticalwork has been of many stripes. Carroll (1993) has extensively factor-analyzed existing datasets to construct a new, three-tier model of intelligence. Hunt (1980) has used cognitivetasks and their underlying models to understand intelligence, as have Jensen (1982), Snowand Lohman (1984), Pellegrino and Kail (1982), and others. Keating (1984) and Ceci(1990) have emphasized the importance of context, and Gardner (1983, 1993) hassuggested examining multiple intelligences. The work reported here is in this vein, but isbased on a different theory.
Conventional tests of intelligence have yielded what might be seen as somewhatdisappointing results when used in studies of ATI. In particular, to the extent that suchATIs have been found, they have tended to be primarily with respect to the general factor (g)of intelligence (Cronbach & Snow, 1977). One interpretation of these results would be thatsuch interactions are limited, few, and far between. Another interpretation, which we beginto examine in this monograph, is that the paucity of ATIs may reflect limitations in theconventional conceptualizations of intelligence as operationalized by traditionalpsychometric tests of abilities. In particular, we use as a theoretical basis for our researchthe triarchic theory of human intelligence (Sternberg, 1985).
Methods
Participants
The participants in the present study were high school students, ranging in age from13 to 16, who attended the 1993 Yale Summer Psychology Program (YSPP). The programwas advertised through brochures and newsletters distributed to schools in the USA and
14
3
abroad. Schools were asked to submit nominations of gifted students to the ProgramCommittee of the YSPP. A selection procedure was based on the students' performance onthe Sternberg Triarchic Abilities Test (STAT), level H, designed for advanced high schooland college students (Sternberg, 1993). The STAT was sent to schools that placednominations, where the test was administered to the nominated students.
A total of 199 students (146 females and 53 males) were selected for participation inthe summer program of 1993. Of these students, 3 (1.5%) were entering grade 9, 25(12.6%) were entering grade 10, 77 (38.7%) were entering grade 11, and 94 (47.2%) wereentering grade 12. The program participants were fairly widely distributed ethnically (basedon students' own reports): 60% European American, 11% African American, 6% HispanicAmerican, and 17% American from other ethnic minorities. Furthermore, 4% of thestudents were African African (from South Africa), and 2% "other."
Based on their STAT performance, all students enrolled in the program wereclassified into five different groups. The STAT subtest scores were standardized, so theycould be compared across different subtests. Students were identified as "high" in anaspect of ability based on their strongest test achievement and their score in respect to groupaverage. Thus, the first three groups included: (1) a group in which students were high inanalytical ability (N= 39, 19.6%); (2) a group in which students were high in creative ability(N = 38, 19.1%); and (3) a group in which students were high in practical ability (N = 35,17.6%). For students to be classified as "high" in analytic, creative, or practical ability, theirtotal score for a given ability was required to be at least a half-standard deviation above thegroup average and at least a half-standard deviation above their own scores for the other twoabilities measured by the STAT (e.g., analytic higher than creative and practical). Althoughthe half-standard deviation criterion might sound weak, recall that all students entering theprogram were first nominated as gifted by their schools. In addition, a "balanced" giftedgroup was also defined (N = 40, 20.1%). For students to be classified as balanced, they hadto score above the group average for all three abilities. Finally, the fifth group wascomprised of students who scored at or below the group average for all three abilities (N =47, 23.6%). These students were classified as not identified as gifted.
Materials
Ability Test
Participants for this study were selected on the basis of scores on the SternbergTriarchic Abilities Test (STAT) (Sternberg, 1991a, 1991c, 1993), a research instrumentconstituting one theory-based alternative to traditional intelligence tests. The test is basedon the triarchic theory of intelligence (Sternberg, 1985), which views intelligence ascomprising three aspects: an analytical aspect, a creative aspect, and a practical aspect.
In a nutshell, the analytical aspect of intelligence involves analyzing, evaluating, andcritiquing given knowledge; the creative aspect involves discovering, creating, arid inventingnew knowledge; and the practical aspect involves using, implementing, and applyingknowledge in everyday contexts.
The test has nine four-option multiple-choice subtests, each comprising four items.The test takes roughly one hour to administer. In addition, the test includes threeperformance or essay subtestsone emphasizing analytical, the second creative, and thethird practical thinking.
The nine multiple-choice subtests represent a crossing of three kinds of processdomains specified by the triarchic theoryanalytic, creative, and practicalwith three major
k):7-

4
content domainsverbal, quantitative, and figural. The idea behind this design is tomeasure the three aspects of processing in content domains that involve different basicabilities. The nine multiple-choice subtests plus the three performance tests are:
1. Analytic-Verbal (neologisms [artificial words]). Students see a novelword embedded in a paragraph, and have to infer its meaning from thecontext.
2. Analytic-Quantitative (number series). Students have to say whatnumber should come next in a series of numbers.
3. Analytic-Figural (matrices). Students see a figural matrix with the lowerright entry missing, and have to say which of the options fits into themissing space.
4. Practical-Verbal (everyday reasoning). Students have to solve a set ofeveryday problems in the life of an adolescent (e.g., what to do about afriend who seems to have a substance-abuse problem).
5. Practical-Quantitative (everyday math). Students have to solve mathproblems based on scenarios requiring the use of math in everyday life (e.g.,buying tickets for a ballgame or making chocolate chip cookies).
6. Practical-Figural (route planning). Students are presented with a map ofan area (e.g., an entertainment park), and have to answer questions aboutnavigating effectively through the area depicted by the map.
7. Creative-Verbal (novel analogies). Students are presented with verbalanalogies preceded by counterfactual premises (e.g., money falls off trees),and must solve the analogies as though the counterfactual premises were true.
8. Creative-Quantitative (novel number operations). Students are presentedwith rules for novel number operations (e.g.,flix, for which numericalmanipulations differ depending upon whether the first of two operands isgreater than, equal to, or less than the second). Subjects have to use thenovel number operations to solve presented math problems.
9. Creative-Figural (novel series completion). Subjects are first presentedwith a figural series that involves one or more transformations; they thenmust apply the rule of the original series to a new figure with a differentappearance, to complete a new series.
There are also three essay items, one each stressing analytical, creative, and practicalthinking. In the current version, the analytical problem requires students to analyze theadvantages and disadvantages of having police or security guards in a school building. Thecreative problem requires students to describe how they would reform their school systemto produce an ideal one. The practical problem requires students to specify a problem intheir life, and to state three practical solutions for solving it. Essays are scored foranalytical, creative, and practical qualities, respectively, by trained raters.
Instructional Material
The text for the course was a pre-publication version of In Search of the HumanMind (Sternberg, 1995), an introductory-psychology text comprising 20 chapters. The textcovers at a college level the topics typical of introductory-psychology courses.
Assessment of Achievement
There were two examinations in the course, a midterm and a final. Both examscomprised multiple-choice items emphasizing primarily recall and simple inference, as wellas analytically, creatively, and practically-oriented essays. There were also two homeworkassignments with analytical, creative, and practical parts. For example, one homework
16

5
assignment required students to (a) compare and contrast two theories of depression; (b)propose their own, improved theory, which could be based in part on past theories; and (c)show how they could apply their theory of depression to help a depressed friend. Therewas also an independent project with analytical, creative, and practical parts.
Design
Students were selected on the basis of their ability-test score profiles to be either (a)high-analytical, (b) high-creative, (c) high-practical, (d) high-balanced, or (e) low-balanced.They were then placed at random in sections of the introductory-psychology course thatemphasized (a) analytical instruction, (b) creative instruction, (c) practical instruction, or (d)memory instruction (control). Thus, some students were matched, and others mismatchedwith respect to ability patterns and instructional treatment. All students were assessed for(a) analytical, (b) creative, (c) practical, and (d) memory achievement. Thus, participantability and method of instruction were between-subjects variables, and method ofassessment was a within-subjects variable.
Procedure
Ability tests were sent out to schools from which students were nominated. Thetests were administered in the schools, and then returned to us for scoring and data analysis.Students were then selected for participation in the study on the basis of their ability pattern.They came to the four-week summer program at Yale, where they were housed in adormitory. Students used a common text and attended common lectures in the morning,given by a psychology professor who had won a university teaching award. In theafternoons, students were assigned to sections. There were eight sections in all, two foreach of the four instructional conditions. Although students and their parents signedinformed consent forms and thus knew they were part of a study, they did not know exactlywhat the study was about, nor that it involved ability patterns. Of course, they did not knowtheir test scores nor how the sections were intended to differ. All examinations wereadministered in class. At the end of the course, participants were debriefed.
Results
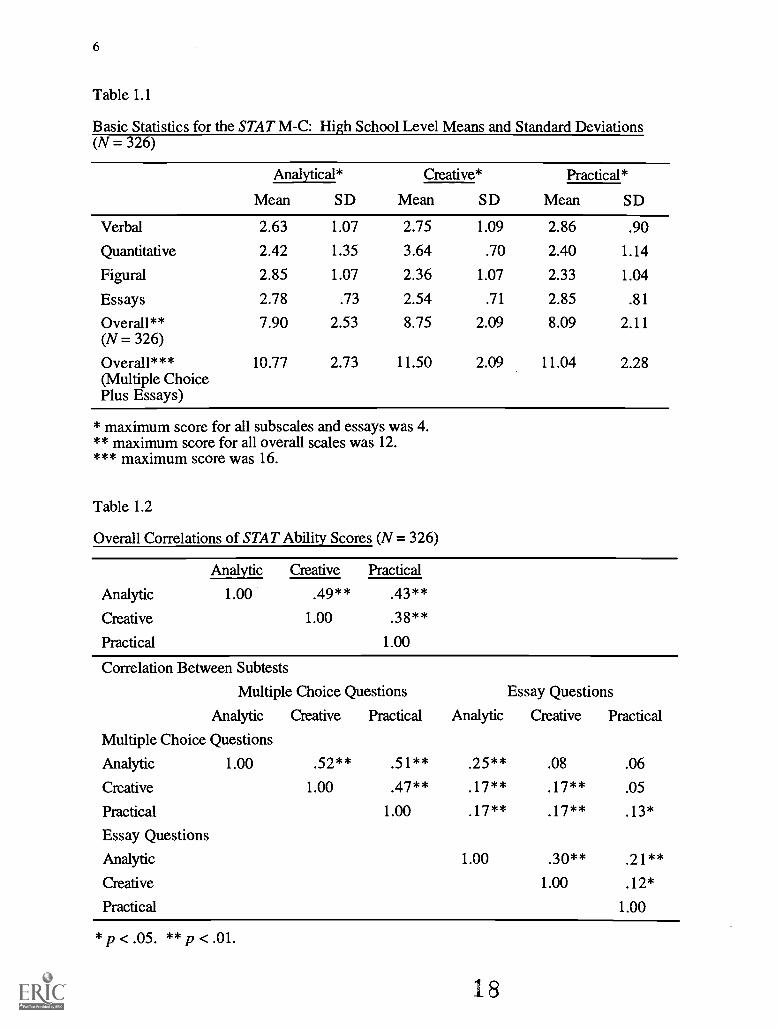
Basic statistics for the STAT are shown in Table 1.1. Scores for essays represent anaverage of two independent raters. These statistics show acceptable levels of meanperformance and dispersions around these means, with the exception of creative-quantitative,which was too easy.
Table 1.2 shows intercorrelations between the three subscales of the STAT for themultiple-choice and the essay sections separately, and for the three types of skills overall.In keeping with the triarchic theory, the levels of intercorrelation between the three subscalesare sufficiently high to suggest that there are at least some common mental processesunderlying the three kinds of functioning, but sufficiently low to suggest the discriminantvalidity of the three kinds of subtests. Indeed, the correlations among the three aspects ofprocessing are sufficiently low at least potentially to allow differential prediction to schoolor other performance, although of course other analyses are needed in order to see whethersuch differential prediction is achieved. One can also see some modality effects: Multiple-choice items tend to correlate better with each other than they correlate with essay items.
17
6
Table 1.1
Basic Statistics for the STAT M-C: High School Level Means and Standard Deviations(N = 326)
Analytical* Creative* Practical*
Mean SD Mean SD Mean SD
Verbal 2.63 1.07 2.75 1.09 2.86 .90
Quantitative 2.42 1.35 3.64 .70 2.40 1.14
Figural 2.85 1.07 2.36 1.07 2.33 1.04
Essays 2.78 .73 2.54 .71 2.85 .81
Overall** 7.90 2.53 8.75 2.09 8.09 2.11(N = 326)
Overall*** 10.77 2.73 11.50 2.09 11.04 2.28(Multiple ChoicePlus Essays)
* maximum score for all subscales and essays was 4.** maximum score for all overall scales was 12.*** maximum score was 16.
Table 1.2
Overall Correlations of STAT Ability Scores (N = 326)
Analytic Creative Practical
Analytic 1.00 .49** .43**
Creative 1.00 .38**
Practical 1.00
Correlation Between Subtests
Multiple Choice Questions Essay Questions
Analytic Creative Practical Analytic Creative Practical
Multiple Choice Questions
Analytic 1.00 .52** .51** .25** .08 .06
Creative 1.00 47** .17** .17** .05
Practical 1.00 .17** .17** .13*
Essay Questions
Analytic 1.00 .30**
Creative 1.00 .12*
Practical 1.00
*p<.05. ** p < .01.
18
7
Because we used two different forms of test items (multiple choice and essay) aswell as three different content domains within the multiple choice, it was possible to useLISREL (structural-equation) modeling in order to answer a fundamental question. Whatwould be the correlations across the abilities if one held method variance constant? In otherwords, we want to take out elements of the inter-subtest correlations that are due solely toshared forms of testing. Using such analysis, we found the correlations to be .08 foranalytic and creative, .14 for analytic and practical, and .06 for creative and practical. Noneof the correlations was significant. These results suggest that the three aspects ofintelligence have greater independence than it would seem on the basis of correlations ofsubtests.
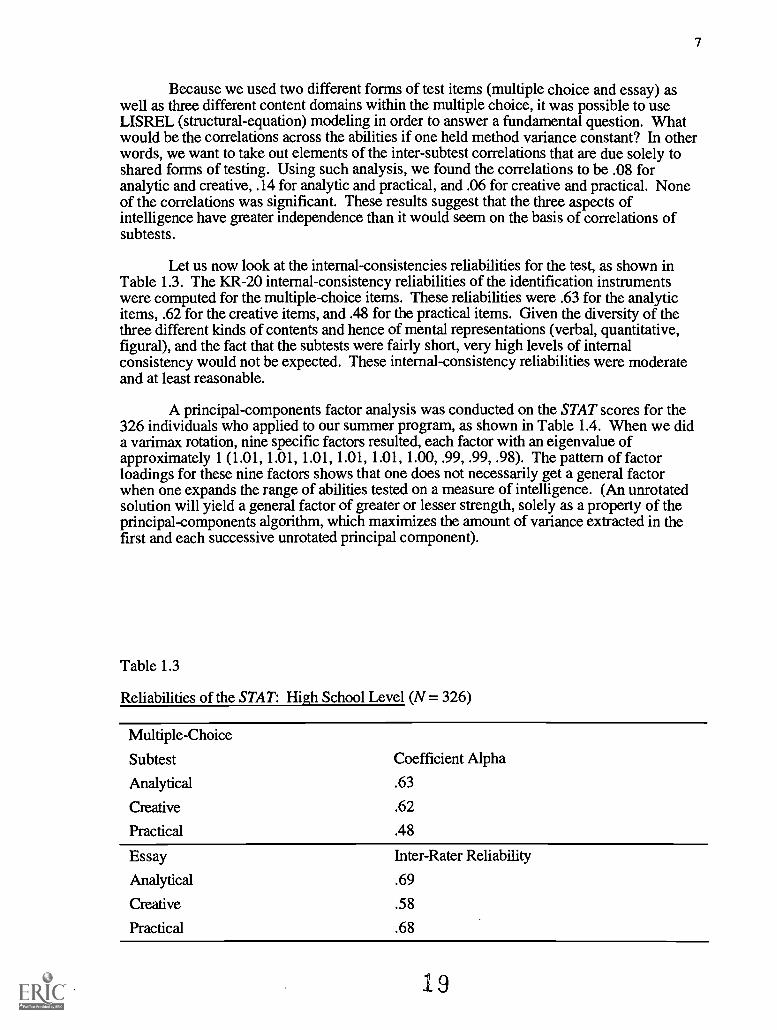
Let us now look at the internal-consistencies reliabilities for the test, as shown inTable 1.3. The KR-20 internal-consistency reliabilities of the identification instrumentswere computed for the multiple-choice items. These reliabilities were .63 for the analyticitems, .62 for the creative items, and .48 for the practical items. Given the diversity of thethree different kinds of contents and hence of mental representations (verbal, quantitative,figural), and the fact that the subtests were fairly short, very high levels of internalconsistency would not be expected. These internal-consistency reliabilities were moderateand at least reasonable.
A principal-components factor analysis was conducted on the STAT scores for the326 individuals who applied to our summer program, as shown in Table 1.4. When we dida varimax rotation, nine specific factors resulted, each factor with an eigenvalue ofapproximately 1 (1.01, 1.01, 1.01, 1.01, 1.01, 1.00, .99, .99, .98). The pattern of factorloadings for these nine factors shows that one does not necessarily get a general factorwhen one expands the range of abilities tested on a measure of intelligence. (An unrotatedsolution will yield a general factor of greater or lesser strength, solely as a property of theprincipal-components algorithm, which maximizes the amount of variance extracted in thefirst and each successive unrotated principal component).
Table 1.3
Reliabilities of the STAT: High School Level (N = 326)
Multiple-Choice
Subtest Coefficient Alpha
Analytical .63
Creative .62
Practical .48
Essay Inter-Rater Reliability
Analytical .69
Creative .58
Practical .68
1 9

8
Table 1.4
Principal-Component Analysis With Varimax Rotation of STAT (N = 326)
II III IV V VI VII VIII IX
A-V .97 .04 .06 .07 .07 .04 .11 .14 .08
A-Q .10 .10 .09 .05 .17 .18 .21 .11 .92
A-F .05 .11 .12 .02 .12 .94 .13 .15 .17
C-V .15 .09 .12 .12 .12 .16 .08 .94 .11
C-Q .07 .08 .97 .08 .09 .11 .11 .11 .08
C-F .08 .09 .10 .05 .96 .12 .10 .12 .15
P-V .07 .06 .07 .98 .05 .02 .05 .10 .04
P-Q .12 .12 .12 .05 .11 .13 .94 .09 .21
P-F .04 .97 .08 .07 .09 .11 .11 .09 .09
A = Analytic, C = Creative, P = Practical, V = Verbal, Q = Quantitative, and F = Figural
In a pilot Yale Summer Psychology Program conducted in 1992 (N = 64), a varietyof tests of abilities was administered. We expected these tests to be related to the STAT, andadministered them to serve as measures of the convergent and discriminant validity of theSTAT. Our emphasis was more on convergent than on discriminant validity. Nevertheless,the patterns of results generally make sense in terms of the constructs measured, as shownin Table 1.5.
The lowest correlations of other tests with the STAT are generally with the practicalsubtest, which is the subtest whose content is the most different from that of traditionaltests. The test most similar to conventional ones was the Terman Concept Mastery Test,followed by the Watson-Glaser Critical Thinking Appraisal, then by the Cattell Culture-Fair Test of g, followed by quantitative insight problems adopted from Sternberg (1986).The more conventional the test that we used, the higher the test tended to correlate with theanalytical subtest of the STAT and the lower with the creative subtest. These were onlytrends, however.
Table 1.5
Concurrent Validities of the STAT With Other Ability Tests
STAT
Concept-Mastery Watson-Glaser Cattell Insight Problems
Analytic .49** .47**
Creative .43** .53** .55** .59**
Practical .21 .32* .36* .21
*p < .05. **p < .01.
2 0

9
Student course performance was used to measure the predictive validity of the STATin the 1993 summer program. Students in the program were evaluated in three ways: Theywere given two assignments, a fmal project, and two examinations (midterm and final).Each of the assessments involved analytic, creative, and practical thinking, as well as use ofmemory.
For example, one homework assignment asked students to (a) analyze apsychological experiment for strengths and weaknesses (analytic), (b) improve on theexperiment (creative), and (c) show how the results of the experiment could be applied ineveryday life (practical). The midterm consisted of a multiple-choice portion measuringprimarily recall, and three essays: one analytic, one creative, and one practical. The fmalexam again consisted of multiple-choice and essay sections, differing from the midtermonly in the length of the multiple-choice section (it was longer) and the number of essays(three per type rather than one). The independent project required students to come up withtheir own investigation and to pursue it analytically, creatively, and practically.
Four raters scored all performance assessments (i.e., assignments, exam essays,final project). Each (analytic, creative, practical) part of each assessment was rated foranalytic, creative, and practical quality. To reduce redundancy, and to arrive at a purerassessment of each of these abilities, analyses are reported only for ratings matched toassessments (e.g., analytic ratings for the analytic performances, creativity ratings for thecreative performances, and practical ratings for the practical performances). Results weresimilar when all three ratings were used for all three types of performance.
All ratings were on a scale of 1 (low) to 9 (high). Raters met frequently in order toensure common standards and use of the rating scales. Interrater reliabilities for the fourjudges are shown in Table 1.6. We judged these correlations to be sufficiently high incombination to permit further analyses on the data.
Table 1.6
Inter-Rater Re liabilities (Intercorrelations) of Quality Ratings of Achievement Measures forFour Judges
Analytic task Creative task Practical task Overall tasks
Assignments .63 .50 .64 .59
Final Project .56 .40 .48 .45
Exams* .85 .57 .71 .71
Effective Reliability of Quality Ratings for Four Judges(Calculated using Spearman-Brown formula)
Assignments .87 .80 .88 .85
Final Project .84 .73 .79 .78
Exams .96 .84 .90 .90
* Cases involving unanswered exam questions were excluded from these analyses.
21

10
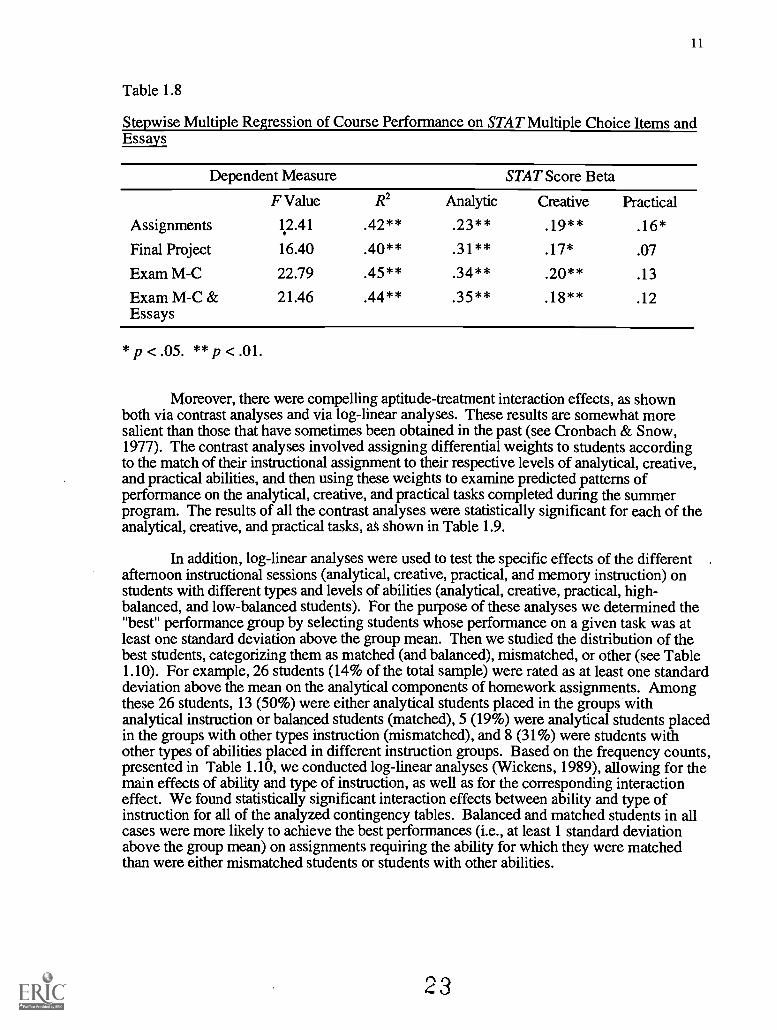
Simple correlations between the STAT and course performance are shown in Table1.7. The message of these correlations is clear. Subtests for all three processing domainsfor the STAT reliably predict all of the analytical, creative, and practical aspects of courseperformance. Of course, because the subtests are themselves correlated, there may beredundancy in these predictions. Hence, we need to use multiple regression in order toassess unique incremental degrees of prediction.
The results of stepwise multiple regressions, addressing the question of incrementalprediction, are shown in Table 1.8. In this analysis, variables were allowed to enter only iftheir unique contribution was statistically significant at the 5% level. In every case, at leasttwo variables, and in one case, all three variables, significantly contributed to prediction: theanalytical and either or both of the creative and practical scores. Given that courses havetraditionally emphasized analytical abilities and are likely to continue to do so, thecontribution of the analytical subtests, which are the most like the subtests on conventionaltests, is not surprising. It is worth noting, though, that at least one of the other two subtestsmade incremental contributions to each of the three predictions.
Table 1.7
Correlations of Combined STAT Multiple Choice and Essay Scores With CourseAssessments
STAT Scores
Analytic
Creative
Practical
Analytic35**
.30**
.27**
Assignments
Creative Practical
.28** .29**
.27** .25**
.29** .23**
Overall
.30**
.28**
Final Project
STAT Scores Analytic Creative Practical Overall
Analytic .37** .32** .28**
Creative .24** .27** .22**
Practical .29** .15** .13 .21**
Exams
STAT Score Analytic Creative Practical Overall
Analytic 35** 33** .38** .38**
Creative .29** .22** .23** .26**
Practical .26** .15** .21** .23**
*p < .05. **p < .01.
Note. Total Over all Assessments.42**Analytic
Creative .33* *Practical .29**
11
Table 1.8
Stepwise Multiple Regression of Course Performance on STAT Multiple Choice Items andEssays
Dependent Measure STAT Score Beta
F Value R2 Analytic Creative Practical
Assignments 12.41 .42** .23** .19** .16*
Final Project 16.40 .40** .31** .17* .07
Exam M-C 22.79 .45** .34** .20** .13
Exam M-C & 21.46 44** .35** .18** .12Essays
*p < .05. **p < .01.
Moreover, there were compelling aptitude-treatment interaction effects, as shownboth via contrast analyses and via log-linear analyses. These results are somewhat moresalient than those that have sometimes been obtained in the past (see Cronbach & Snow,1977). The contrast analyses involved assigning differential weights to students accordingto the match of their instructional assignment to their respective levels of analytical, creative,and practical abilities, and then using these weights to examine predicted patterns ofperformance on the analytical, creative, and practical tasks completed during the summerprogram. The results of all the contrast analyses were statistically significant for each of theanalytical, creative, and practical tasks, 8 shown in Table 1.9.
In addition, log-linear analyses were used to test the specific effects of the different .
afternoon instructional sessions (analytical, creative, practical, and memory instruction) onstudents with different types and levels of abilities (analytical, creative, practical, high-balanced, and low-balanced students). For the purpose of these analyses we determined the"best" performance group by selecting students whose performance on a given task was atleast one standard deviation above the group mean. Then we studied the distribution of thebest students, categorizing them as matched (and balanced), mismatched, or other (see Table1.10). For example, 26 students (14% of the total sample) were rated as at least one standarddeviation above the mean on the analytical components of homework assignments. Amongthese 26 students, 13 (50%) were either analytical students placed in the groups withanalytical instruction or balanced students (matched), 5 (19%) were analytical students placedin the groups with other types instruction (mismatched), and 8 (31%) were students withother types of abilities placed in different instruction groups. Based on the frequency counts,presented in Table 1.10, we conducted log-linear analyses (Wickens, 1989), allowing for themain effects of ability and type of instruction, as well as for the corresponding interactioneffect. We found statistically significant interaction effects between ability and type ofinstruction for all of the analyzed contingency tables. Balanced and matched students in allcases were more likely to achieve the best performances (i.e., at least 1 standard deviationabove the group mean) on assignments requiring the ability for which they were matchedthan were either mismatched students or students with other abilities.
23

12
Table 1.9
Contrasts on Quality Ratings
Contrast Coefficient Matrix
Ability Analytic Creative Practical Balanced Non- t-Value*gifted
Analytic AbilityContrast 2.0 1.0 1.0 3.0 -7.0Weight
Assignments 4.97
Final Project 5.29
Exams 4.57
Creative AbilityContrast 1.0 2.0 1.0 3.0 -7.0Weight
Assignments 3.89
Final Project 3.93
Exams 3.52
Practical AbilityContrast 1.0 1.0 2.0 3.0 -7.0Weight
Assignments 4.53
Final Project 2.92
Exams 4.53
* for all t values, p < .005.
2 4

13
Table 1.10
Raw Frequency Counts of Students With High ("Best") Performances in Total, andAccording to Whether They Were Matched or Mismatched in Terms of Gifted Ability andInstruction
AbilitiesAssessed
High Performance
Analytical
Total(Base N = 179)
Matched/Balanced*
Mismatched* Other*
Assignments 26 (14%) 13 (50%) 5 (19%) 8 (31%)
Exams 26 (14%) 11 (42%) 2 ( 8%) 13 (50%)
Final project 32 (18%) 11 (34%) 5 (16%) 16 (50%)
Overall 29 (16%) 12 (41%) 4 (10%) 13 (45%)
CreativeAssignments 34 (20%) 11 (32%) 8 (24%) 15 (44%)
Exams 31 (17%) 11 (35%) 5 (16%) 15 (48%)
Final project 25 (15%) 8 (32%) 3 (12%) 14 (56%)
Overall 32 (18%) 10 (31%) 5 (16%) 17 (53%)
PracticalAssignments 34 (19%) 16 (47%) 1 ( 3%) 17 (50%)
Exams 27 (15%) 12 (44%) 5 (19%) 10 (37%)
Final project 27 (15%) 12 (44%) 5 (19%) 10 (37%)
Overall 26 (14%) 9 (35%) 5 (19%) 12 (46%)
Note. "Best" is defined as at least one standard deviation above the group mean.
* Matched BalancedAnalytical students placed groups with analytical instruction orbalanced students.MismatchedAnalytical students placed in groups with other types of instruction.OtherStudents with other types of abilities placed in different instruction groups.
25
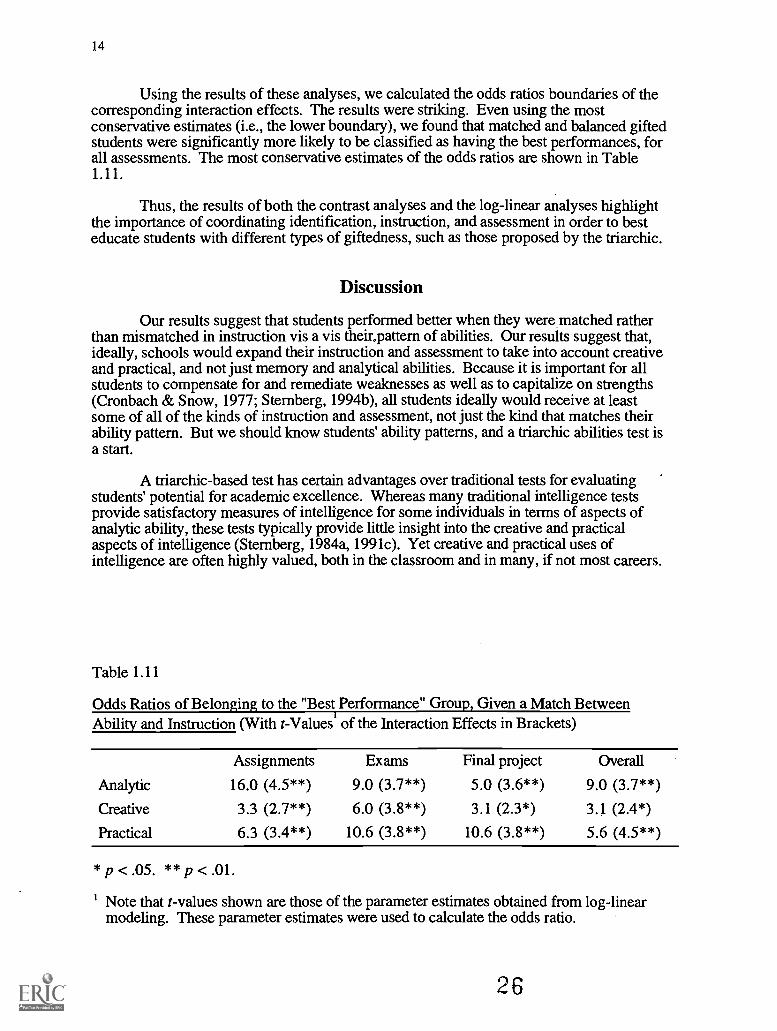
14
Using the results of these analyses, we calculated the odds ratios boundaries of thecorresponding interaction effects. The results were striking. Even using the mostconservative estimates (i.e., the lower boundary), we found that matched and balanced giftedstudents were significantly more likely to be classified as having the best performances, forall assessments. The most conservative estimates of the odds ratios are shown in Table1.11
Thus, the results of both the contrast analyses and the log-linear analyses highlightthe importance of coordinating identification, instruction, and assessment in order to besteducate students with different types of giftedness, such as those proposed by the triarchic.
Discussion
Our results suggest that students performed better when they were matched ratherthan mismatched in instruction vis a vis their.pattern of abilities. Our results suggest that,ideally, schools would expand their instruction and assessment to take into account creativeand practical, and not just memoly and analytical abilities. Because it is important for allstudents to compensate for and remediate weaknesses as well as to capitalize on strengths(Cronbach & Snow, 1977; Sternberg, 1994b), all students ideally would receive at leastsome of all of the kinds of instruction and assessment, not just the kind that matches theirability pattern. But we should know students' ability patterns, and a triarchic abilities test isa start.
A triarchic-based test has certain advantages over traditional tests for evaluatingstudents' potential for academic excellence. Whereas many traditional intelligence testsprovide satisfactory measures of intelligence for some individuals in terms of aspects ofanalytic ability, these tests typically provide little insight into the creative and practicalaspects of intelligence (Sternberg, 1984a, 1991c). Yet creative and practical uses ofintelligence are often highly valued, both in the classroom and in many, if not most careers.
Table 1.11
Odds Ratios of Belonging to the "Best Performance" Group, Given a Match BetweenAbility and Instruction (With t-Values of the Interaction Effects in Brackets)
Assignments Exams Final project Overall
Analytic 16.0 (4.5**) 9.0 (3.7**) 5.0 (3.6**) 9.0 (3.7**)
Creative 3.3 (2.7**) 6.0 (3.8**) 3.1 (2.3*) 3.1 (2.4*)
Practical 6.3 (3.4**) 10.6 (3.8**) 10.6 (3.8**) 5.6 (4.5**)
* p < .05. ** p < .01.
I Note that t-values shown are those of the parameter estimates obtained from log-linearmodeling. These parameter estimates were used to calculate the odds ratio.
26
15
Because a triarchic test can measure three different aspects of intelligence (analytical,creative, and practical) in four main content domains (verbal, mathematical, figural, and essaycontents), it allows students to be identified as intelligent in a variety of different ways. Italso allows teachers to identify strengths of students who might otherwise go unnoticed, andpotentially to design classroom activities who might allow different students to demonstratetheir nontraditional as well as traditional strengths. If teachers use the triarchic theory intheir teaching as well as their assessments of intelligence (see Sternberg, 1994b, 1994c),they will potentially allow students to develop a more well-rounded understanding ofdifferent subject areas. Students other than "the usual cast of characters" may also beidentified as intelligent. In our own study, the nontraditional (creative and practical) sectionsof the test identified a greater number of minority students as bright than did the moretraditional section (analytical).
A test based on the triarchic theory could also be useful for determining where anindividual stands with regard to the verbal, quantitative, and figural domains, as well as withregard to essay performance testing. Although other tests assess functioning across avariety of content domains, they primarily do so in the analytic, and not in the creative andpractical domains. In sum, then, a triarchic test seems to provide potential incrementalvalidity beyond the types of tests commonly used to measure intelligence, and to be ofparticular use to those seeking measures of abilities that go beyond those assessed bytraditional tests.
Of course, the current version of the STAT has some limits: For one thing, it isdifficult to measure the creative and practical aspects of intelligence in a paper-and-pencilformat, especially via multiple-choice items, and we believe that there is a long way to go interms of optimal test development. Moreover, the subtests were kept short to minimizetesting time, and the test is not standardized. Nor has it been shown to work at all ages orability levels. As said earlier, we are working with a research form of a test, not a polishedinstrument. We view the work reported here as work in progress, not as final, and we arecurrently working to refine our measures of the triarchic constructs.
Furthermore, there are aspects to academic excellence that the STAT does notmeasure, nor should it, according to the triarchic theory. For example, importantdeterminants of academic success include aspects of personality (Cantor & Fleeson, 1994),level of perceived self-efficacy in different academic tasks (Bandura, 1995; Zimmerman,Bandura, & Martinez-Pons, 1992), level of motivation (Ames & Archer, 1988; Deci &Ryan, 1991), mindfulness (Langer, 1993), self-regulation (Borkowski, Carr, Rellinger, &Pressley, 1990; Pinard, 1992), and will power (Corno & Kanfer, 1993), to name but a fewother variables that are important to academic success. Better prediction of academic andother kinds of performance will require not just improved measures of intelligence, but alsomeasures of other constructs such as these.
Finally, intelligence is at least partially defmed, we believe, in terms of culturalexpectations (Csikszentmihalyi & Robinson, 1986; Gardner, 1983, 1993; Granott &Gardner, 1994), and is expressed in real-world contexts, both in and out of school (Okagaki& Sternberg, 1988; Sternberg, 1991b). Thus, a full consideration of intelligence willrequire, ultimately, understanding of the contexts in which it will be applied.
In sum, the purpose of this investigation was to examine the interaction betweenability patterns and school achievement as a function of type of instruction. The results ofthe investigation show, we believe, at least some promise both for the theory and for furtherdevelopment of the test. At the very least, it appears worthwhile to explore the creative andpractical aspects of intelligence in addition to the analytical one, whether through a triarchictheory and test, or by some other means. There is apparently more to intelligence than g,
27

16
and what more there is to intelligence can have important implications for classroominstruction and assessment. Students achieve better when instruction matches at least in parttheir pattern of abilities.
2 8
17
References
Ames, C., & Archer, J. (1988). Achievement goals in the classroom: Students'learning strategies and motivation processes. Journal of Educational Psychology, 80(3),260-267.
Bandura, A. (1995). Self-efficacy in changing societies. New York: CambridgeUniversity Press.
Binet, A., & Simon, T. (1905). Methodes nouvelles pour le diagnostique du niveauintellectuel des anormaux (New methods for diagnosing the intellectual level ofsubnormals). L'année psychologique, 11, 191-336.
Binet, A., & Simon, T. (1908). Le développement de l'intelligence chez les enfants(The development of intelligence in children). L'année psychologique, 14, 1-94.
Borkowski, J. B., Carr, M., Rellinger, E., & Pressley, M. (1990). Self-regulatedcognition: Independence of metacognition, attributions, and self-esteem. In B. F. Jones &L. Idol (Eds.), Dimensions of thinking and cognitive instruction (pp. 53-92). Hillsdale, NJ:Erlbaum.
Burt, C. (1911). Experimental tests of higher mental processes and their relation togeneral intelligence. Journal of Experimental Pedagogy, 1, 93-112.
Cantor, N., & Fleeson, W. (1994). Social intelligence and intelligent goal pursuit:A cognitive slice of motivation. In W. D. Spaulding (Ed.), Nebraska symposium onmotivation: Integrative views of motivation, cognition, and emotion (Vol. 41, pp. 125-179).Lincoln, NE: University of Nebraska Press.
Carroll, J. B. (1993). Human cognitive abilities: A survey of factor-analyticstudies. Cambridge, MA: Cambridge University Press.
Ceci, S. J. (1990). On intelligence . . . more or less: A bio-ecological treatise onintellectual development. Englewood Cliffs, NJ: Prentice Hall (Century PsychologySeries).
Como, L., & Kanfer, R. (1993). The role of volition in learning and performance.In L. Darling-Hammond (Ed.), Review of research in education (Vol. 19, pp. 301-341).Washington, DC: American Educational Research Association.
Cronbach, L. J., & Snow, R. E. (1977). Aptitudes and instructional methods. NewYork: Irvington.
Csikszentmihalyi, M., & Robinson, R. E. (1986). Culture, time, and thedevelopment of talent. In R. J. Sternberg & J. E. Davidson (Eds.), Conceptions ofgiftedness (pp. 264-284). New York: Cambridge University Press.
Deci, E. L., & Ryan, R. M. (1991). A motivational approach to self: Integration inpersonality. In R. Dienstbier (Ed.), Nebraska symposium on motivation: Perspectives onmotivation (Vol. 38, pp. 237-288). Lincoln, NE: University of Nebraska Press.
Gardner, H. (1983). Frames of mind: The theory of multiple intelligences. NewYork: Basic Books.
2 9

18
Gardner, H. (1993). Multiple intelligences: The theory in practice. New York:Basic Books.
Granott, N., & Gardner, H. (1994). When minds meet: Interactions, coincidence,and development in domains of ability. In R. J. Sternberg & R. K. Wagner (Eds.), Mind incontext: Interactionist perspectives on human intelligence (pp. 171-201). New York:Cambridge University Press.
Hunt, E. B. (1980). Intelligence as an information-processing concept. BritishJournal of Psychology, 71, 449-474.
Jensen, A. R. (1982). The chronometry of intelligence. In R. J. Sternberg (Ed.),Advances in the psychology of human intelligence (Vol. 1, pp. 255-310). Hillsdale, NJ:Erlbaum.
Keating, D. P. (1984). The emperor's new clothes: The "new look" in intelligenceresearch. In R. J. Sternberg (Ed.), Advances in the psychology of human intelligence (Vol.2, pp. 1-45). Hillsdale, NJ: Erlbaum.
Langer, E. J. (1993). A mindful education. Educational Psychologist, 28, 43-50.
Mead, A. D., & Drasgow, F. (1993). Equivalence of computerized and paper-and-pencil cognitive ability tests: A meta-analysis. Psychological Bulletin, 114, 449-458.
Okagaki, L., & Sternberg, R. J. (1988). Unwrapping giftedness. In G. Kanselaar,J. L. van der Linden, & A. Pennings (Eds.), Individual differences in giftedness:Identification and education (pp. 30-45). Louvain, Belgium: Acco.
Otis, A. S. (1918). An absolute point scale for the group measurement ofintelligence. Journal of Educational Psychology, 9, 238-261.
Pellegrino, J. W., & Kail, R. (1982). Process analyses of spatial aptitude. In R. J.Sternberg (Ed.), Advances in the psychology of human intelligence (Vol. 1, pp. 177-217).Hillsdale, NJ: Erlbaum.
Pinard, A. (1992). Metaconscience et métacognition. Canadian Psychology, 33,27-41.
Renzulli, J. S. (1986). A three-ring conception of giftedness: A developmentalmodel for creative productivity. In R. J. Sternberg & J. E. Davidson (Eds.), Conceptions ofgiftedness (pp. 51-92). New York: Cambridge University Press.
Richert, E. S. (1991). Rampant problems and promising practices in identification.In N. Colangelo & G. A. Davis (Eds.), Handbook of gifted education (pp. 81-96). Boston:Allyn & Bacon.
Snow, R. E., & Lohman, D. F. (1984). Toward a theory of cognitive aptitude forlearning from instruction. Journal of Educational Psychology, 76, 347-376.
Spearman, C. (1927). The abilities of man. London: Macmillan. (Reprinted: NewYork: AMS Publishers, 1981).
Sternberg, R. J. (1984). What should intelligence tests test? Implications of atriarchic theory of intelligence for intelligence testing. Educational Researcher, 13, 5-15.
30

19
Sternberg, R. J. (1985). Beyond IQ: A triarchic theory of human intelligence.New York: Cambridge University Press.
Sternberg, R. J. (1986). Intelligence applied: Understanding and increasing yourintellectual skills. San Diego, CA: Harcourt Brace Jovanovich.
Sternberg, R. J. (1990). Metaphors of mind. New York: Cambridge UniversityPress.
Sternberg, R. J. (1991a). Triarchic abilities test. In D. Dickinson (Ed.), Creatingthe future: Perspectives on educational change (pp. 76-81). Aston Clinton, England:Accelerated Learning Systems.
Sternberg, R. J. (1991b). Giftedness according to the triarchic theory of humanintelligence. In N. Colangelo & G. A. Davis (Eds.), Handbook of gifted education (2nd ed.,pp. 45- 54). Boston: Allyn & Bacon.
Sternberg, R. J. (1991c). Theory-based testing of intellectual abilities: Rationalefor the Triarchic Abilities Test. In H. Rowe (Ed.), Intelligence: Reconceptualization andmeasurement (pp. 183-202). Hillsdale, NJ: Erlbaum.
Sternberg, R. J. (1992). Toward better intelligence tests. In M. C. Wittrock (Ed.),Testing and cognition (pp. 31-39). Englewood Cliffs, NJ: Prentice-Hall.
Sternberg, R. J. (1993). Sternberg Triarchic Abilities Test, high school level.Unpublished test.
Sternberg, R. J. (1994a). Changing conceptions of intelligence and their impactupon the concept of giftedness: The triarchic theory of intelligence. In J. L. Genshaft, M.Bireley, & C. L. Hollinger (Eds.), Serving gifted and talented students (pp. 33-47). Austin,TX: Pro-Ed.
Sternberg, R. J. (1994b). A triarchicodel for teaching and assessing students ingeneral psychology. General Psychologist 30(2), 42-48.
Sternberg, R. J. (1994c). Diversifying instruction and assessment. TheEducational Forum, 59(1), 47-53.
Sternberg, R. J. (1995): In search of the human mind. Orlando, FL: HarcourtBrace College Publishers.
Sternberg, R. J., & Davidson, J. E. (Eds.). (1986). Conceptions of giftedness.New York: Cambridge University Press.
Terman, L. M. (1916). The measurement of intelligence: An explanation of and acomplete guide for the use of the Stanford revision and extension of the Binet-SimonIntelligence Scale. Boston: Houghton Mifflin.
Thurstone, L. L. (1938). Primary mental abilities. Chicago: University ofChicago Press.
Wechsler, D. (1991). The Wechsler Intelligence Scales for ChildrenThirdedition (WISC-III). San Antonio, TX: Psychological Corporation.
3 1

20
Wickens, T. D. (1989). Multiway contingency tables analysis for the socialsciences. Hillsdale, NJ: Erlbaum.
Wigdor, A. K., & Garner, W. R. (Eds.). (1982). Ability testing: Uses,consequences, and controversies. Washington, DC: National Academy Press.
Zimmerman, B. J., Bandura, A., & Martinez-Pons, M. (1992). Self-motivation foracademic attainment: The role of self-efficacy beliefs and personal goal setting. AmericanEducational Research Journal, 29, 663-676.
3 9
21
PART 2: Styles of Thinking in School
Why do certain students seem to flourish with some teachers, and to wither withothers? What leads some teachers and students to prefer a lecture format in the classroom,whereas others prefer small discussion groups? Why do some teachers and students seemto prefer multiple-choice and short-answer tests, whereas others prefer essays and projects?All of these questions, we believe, can be addressed by the construct of thinking styles asexpressed by students and teachers.
In this section, we present the results of three studies that investigated this construct.Our particular studies are based on the theory of mental self-government (Sternberg, 1988,1990), although other theories, some of which are described below, have been proposed aswell. In particular, we were interested in investigating styles as they relate to the school andas they affect teaching and learning processes.
What, exactly, is a thinking style? A style of thinking is a preferred way of thinking.It is not an ability, but rather a preferred way of expressing or using one or more abilities.Two or more people with the same levels or patterns of abilities might nevertheless havevery different styles of thinking. Thus, styles of thinking are not in the domain of abilitiesor in the domain of personality, but at the interface between the two (Sternberg, 1994).
Because the set of related terms like thinking styles, learning styles, and cognitivestyles have been used extensively in the literatures of education and psychology, it isimportant for us to clarify our own use of the term. We suggest that although people dohave a profile of preferences in terms of the ways they prefer to think, at the same time,styles can be variable across tasks and situations. A student's preferred style inmathematics, for example, is not necessarily his or her preferred style in a cooking class.Moreover, styles are not fixed, but rather can vary across the life span. For example, thestyles that may lead to adaptive performance (either in learning or teaching) at theelementary-school level are not necessarily those that will work best at the advancedgraduate level. We believe, and will present data to show, that styles are at least in partsocialized, and that they are not, in any absolute sense, "good" or "bad." Rather, they can bemore or less adaptive for a given task or situation, and what is adaptive in one setting maynot be in another.
As noted above, ours is not the only theory of styles that has been proposed.Grigorenko and Sternberg (1995) have suggested that the literature on styles can be dividedinto three overlapping partitions.
Approaches to Styles of Thinking
The first approach is cognition-centered, and the literature is generally referred to asone on cognitive styles. Theorists and researchers in this area sought to investigate "thecharacteristic, self-consistent modes of functioning which individuals show in theirperceptual and intellectual activities" (Witkin, Oltman, Raskin, & Karp, 1971, p. 3). Someof the main styles studied in this literature are equivalence range (Gardner, 1953), and fielddependence-independence (Witkin, 1973). Reviews of this work can be found in Kogan(1983) and Vernon (1973).
A second approach to studying styles is personality-centered. The theory of Myersand Myers (1980), based on the work of Jung (1923), would fall into this camp. Myers and
3 3
22
Myers have distinguished among two attitudes, extraversion and introversion; twoperceptual functions, intuition and sensing; and two judgment functions, thinking andfeeling; and two ways of dealing with the outer world, judgment and perception. Gregorc(1984) has distinguished between two ways of handling each of space and time. Thus,people can be classified as abstract or concrete with respect to space, and as sequential orrandom with respect to time. Miller (1987, 1991) has proposed a somewhat differenttaxonomy, distinguishing among analytic versus holistic, objective versus subjective, andemotionally stable versus emotionally unstable individuals.
The third approach, an activity-centered one, tends to focus on styles of learning.These are the theories that have probably had the most direct application in the classroom.For example, Dunn and Dunn (1978) have categorized styles in terms of preferred elementsin a learning situation, such as various aspects of the environment (such as sound and light)and various aspects of interaction with the self and others (such as peers and adults).Renzulli and Smith (1978) have distinguished preferred styles of work in the classroom,such as projects, drill and recitation, and peer teaching. A theory that is of the same kind,but more oriented toward the world of work, is that of Holland (1973), who hasdistinguished among realistic, investigative, artistic, social, and enterprising styles on the job.
Our goal was to build on this work with the theory of mental self-government(Sternberg, 1988, 1994) and tests of the theory as it applies in the classroom. The goal ofthe theory is to integrate the various approaches described above, and to provide newdirections for theory applied to educational practice.
The Theory of Mental Self-Government
The basic idea of the theory of mental self-government is that people, like societies,have to organize or govern themselves. Thus, the theory addresses the question of howpeople govern and manage their everyday cognitive activities, within the school and without.
The theory is organized into five major parts: functions, forms, levels, scope, andleaning of mental self-government. Because scope was not used in our studies, we do notdescribe it further. What, then, is the role of each part in the theory?
Functions
Just as governments carry out legislative, executive, and judicial functions, so doesthe mind. The legislative function of the mind is concerned with creating, formulating,imagining, and planning. The executive function is concerned with implementing and withdoing. The judicial function is concerned with judging, evaluating, and comparing.
Forms
The forms of mental self-government resemble forms of government: monarchic,hierarchic, oligarchic, and anarchic. In the monarchic form, a single goal or way of doingthings predominates. People with a monarchic style tend to focus single-mindedly on onegoal or need at a time. The hierarchic form allows for multiple goals, each of which mayhave a different priority. People with this style like to do multiple things within the sametime frame, setting priorities for getting them done. The oligarchic form allows for multiplegoals, all of which are equally important. A person with this style also likes to do multiplethings within the same time frame, but has difficulty setting priorities for getting them done.Finally, the anarchic form is antisystematic. People with this style tend to eschew rules,
3 4
23
procedures, and formal systems. As a result, they often have difficulty adjusting to theschool as a system.
Levels
Just as governments have more local or more global levels of society with whichthey customarily deal, so do people. Local individuals prefer dealing with details and withconcrete issues, whereas global individuals prefer to deal with the large picture and withabstractions. Whereas the local person is susceptible to losing the forest for the trees, theglobal person is susceptible to seeing the forest but not the trees that constitute it.
Leanings
People, like governments, can have more liberal or more progressive leanings. Anindividual with a liberal style likes to do things in new ways and to have change in his orher life; an individual with a conservative style prefers traditions and stability.
The basic idea, then, is that people can be characterized and assessed on each ofthese styles. People may vary both in their extremity and in their flexibility with regard tothe styles. For example, some individuals might be liberal in almost any situation, whereasother individuals might be liberal in certain kinds of situations but conservative in others.Furthermore, a given individual might be strongly liberal, either in specific domains oracross domains, or else mildly liberal, again either within or across domains.
The goal of our studies was to operationalize the theory, and apply it to variouseducational activities, in particular, learning and teaching.
studies.
General Methods
This section describes those aspects of the methods that were cormnon across
Schools
Teachers and students from four school sites participated in the studies. Theschools were (a) a large urban public high school, (b) a prestigious and nationally knownpreparatory school with a high annual tuition, (c) an elementary-secondary private schoolwith an emphasis on emotional education and a similarly high tuition, (d) a small Catholicelementary-secondary parochial school. The private schools cater to somewhat differentclientele. Admission to the first requires very high grades and standardized test scores; thesecond private school, in contrast, welcomes students who have encountered difficulties intheir school careers; the third school comprises students who are virtually all Catholic, andemphasizes religious as well as secular education.
Participants
In all, 124 students (51 female and 73 male) and 85 teachers (57 female and 28male) participated in the studies. Of the group of students, 54 were from School A, 11 fromSchool B, 39 from School C, and 20 from School D. Of the group of teachers, 33 werefrom School A, 15 from School B, 29 from School C, and 8 from School D. Teacherstaught either all subjects (at the elementary-school level), history, English, foreign language,social studies, physics, chemistry, mathematics, biology, home economics, physical
3 5

24
education, or business-related subjects. Mean age of participating students was 14.8(standard deviation, 2.3). Mean age of participating teachers was 37.3 (standard deviation,11.2). Participation of all students and teachers was voluntary without compensation.
Measures
We used three basic measures in the studies described below. Examples of itemsfrom each measure, as well as internal-consistency alpha reliabilities of subscales (calculatedon independent but comparable samples of students and teachers not otherwise involved inthese studies), are shown in Table 2.1.
The purpose of having three measures was to have converging operations (Garner,Hake, & Eriksen, 1956) that measured the same constructs. In this way, sources of bias anderror associated with individual measures would be reduced (Campbell & Fiske, 1959).Not only did the kinds of measures differ, but who was doing the assessment of whomdiffered as well. Each of the instruments in the studies was created on the basis of itemssuggested and evaluated by teachers from various schools in Connecticut.
Thinking Styles Questionnaire for Teachers (TSQT). This was a 49-itemquestionnaire in which teachers were asked to assess their styles of teaching on sevensubscales (which were not, of course, identified to the teachers): legislative, executive,judicial, local, global, liberal, and conservative. Each subscale had 7 Likert-scale items withan evaluation scale ranging from 1 (low) to 7 (high).
Set of Thinking Styles Tasks for Students (STSTS). This was a set of 16 differenttasks and preference items for students. The tasks and preference items were assumed tomap directly onto 11 thinking styles, namely, legislative, executive, judicial, monarchic,hierarchic, oligarchic, anarchic, local, global, liberal, and conservative. Students had to solveproblems and make choices, and every response was coded via a scoring map ofcorrespondence between responses and styles. For each scale, the sum of the scores acrosstasks and preference items was considered to be a measure of the thinking style.
Questionnaire of Students' Thinking Styles Evaluated by Teachers (QSTST). Thiswas a questionnaire for teachers consisting of 49 items, 7 for each of 7 scales: legislative,executive, judicial, local, global, liberal, and conservative. Items were in the form of a Likertscale with ratings ranging from 1 (low) to 7 (high).
Study 1: Teacher Styles
The goal of this study was to explore teacher styles as a function of grade taught,number of years of teaching experience, and subject-matter area taught.
Item Examples
When I am studying literature, I prefer: a) to make up my own story with my owncharacters and my own plot (legislative); b) to evaluate the author's style, to criticize theauthor's ideas, and to evaluate characters' actions (judicial); c) to follow the teacher's adviceand interpretations of author's positions, and to use the teacher's way of analyzing literature(executive); d) to do something else (please describe your preferences in the space below).

25
Table 2.1
Examples of Some of the Items and Reliability Coefficients of the Scales of the ThinkingStyles Questionnaire for Teachers, Set of Thinking Styles Tasks for Students and theQuestionnaire of Students' Thinking Styles Evaluated by Teachers
Styles Sample Items Reliability
LegislativeExecutiveJudicialLocal
Global
Liberal
Conservative
LegislativeExecutiveJudicialLocalGlobalLiberalConservativeMonarchicHierarchicOligarchicAnarchic
Thinking Styles Questionnaire for Teachers (TSQT)
I want my students to develop their own ways of solving problems.I like to follow instructions when I am teaching.Teachers should give continual feedback on students' progress.I like to give my students tests that require exacting and highly
detailed work.I think that teachers must increase the conceptual as opposed
to the factual content of their lessons.Each year I like to select new and original materials to
teach my subject.I agree with people who call for more, harsher discipline,
and a return to the "good old ways."
Set of Thinking Styles Tasks for Students (STSTS)
N = 103
.80
.77
.93
.89
.66
.71
. 73
N = 166
.74
. 71
. 72
.68
.63.75.78.61.64.63.59
Questionnaire of Students' Thinking Styles Evaluated by Teachers (QSTST)N = 149
LegislativeExecutive
JudicialLocal
Global
Liberal
Conservative
S/he prefers to solve problems in her or his own way. .91S/he is very skilled at taking standardized tests and
short-answer or multiple-choice tasks. .92S/he likes to evaluate her or his own opinions and those of others. .70S/he tends to break down a problem into many smaller ones that
he/she can solve without looking at the problem as a whole. .83S/he often asks questions that are connected with the global
context of the problem. .70S/he grapples with each problem boldly, imaginatively,
and resourcefully. .85S/he sticks to standard rules of doing things. .88
3 7

26
The following is an example of a task to distinguish among oligarchic, hierarchical,monarchic, and anarchic thinkhig styles. You are the mayor of a large northeastern city.You have a city budget this year of $100 million. Below is a list of problems currentlyfacing your city. Your job is to decide how you will spend the $100 million available toimprove your city. Next to each problem is the projected cost to eliminate a problementirely. In the space on the next page list each problem on which you will spend citymoney and how much money you will budget for that problem. Whether you spend moneyon one, some, or all problems is up to you, but be sure your plan will not exceed the $100million available. Whether you spend all the money to solve one or a few problems ordivide the money partially to solve many problems is up to you. You have one additionalproblemyou are up for re-election next year, so consider public opinion when makingyour decisions.
Your city faces various problems: 1) Drug problem ($100,000,000); 2) The roads(they are old, full of pot holes, and need to be repaired) ($25,000,000); 3) You have no newland for landfill and you need to build a recycling center ($25,000,000); 4) You needshelters for the homeless ($50,000,000); 5) You must replace subway cars and city buses;you need to buy new ones for the public transportation system ($50,000,000); 6) The publicschool teachers are demanding a salary increase and they are going to go on strike($30,000,000); 7) Sanitation workers are demanding a salary increase and they are going togo on strike ($30,000,000); 8) An increase in unemployment has increased the number ofwelfare recipients ($80,000,000); 9) The AIDS epidemic has created the need for publiceducation on AIDS prevention and you need to build an AIDS hospital ($100,000,000); 10)You need to build a new convention center to attract out-of-state tourists. This couldgenerate additional revenue for the next fiscal year ($70,000,000).
Results and Discussion
We used two types of data analyses: analysis of variance and correlational analysis.Where we used analysis of variance, we did MANOVA followed up by univariate analyseswith Bonferroni corrections of p values.
Grade Taught
An overall MANOVA showed a significant main effect of grade level taught withrespect to the seven styles assessed by the questionnaire, Wilk's Lambda = .49, F(7 ,77) =13.7, p < .001. We therefore did follow-up analyses on the seven individual stylesassessed. We found two significant differences. Teachers at lower grade levels were morelegislative than teachers at higher grade levels, with respective means of 6.2 and 4.9, F(1,84)= 13.4, p < .001; complementarily, teachers at the lower grade levels were less executive thanthe teachers at the higher levels, F(1,84) = 29.1, p < .001.
We believe there are two plausible, non-mutually exclusive explanations of thisfinding. The first is that teachers who are more legislative and less executive tend togravitate toward teaching at the lower grade levels. The second explanation is that whenteachers teach at the lower grade levels, they become more legislative and less executive intheir style of teaching. In other words, because the lower grades generally allow morefreedom of style of teaching, teachers become more legislative. At the upper grade levels,where there is a more rigidly prescribed curriculum and standardized test scores of studentsare critical for the students' future admissions to college, teachers do not have the freedom tobe as legislative, and become more executive.
3 8

27
Subject Taught
We divided teachers into three groups on the basis of subjects taught: humanities,sciences, and applied subjects. Because we had 30 humanities teachers, 33 science teachers,but only 5 teachers of applied subjects, we decided to eliminate the applied teachers fromthis analysis, due to low N. A MANOVA revealed a significant effect of subject taught,Wilk's Lambda = .51, F(7,55) = 9.8, p < .001. We therefore did follow-up univariateanalyses of variance. The data showed a significant difference between groups on two ofthe seven styles assessed. Humanities teachers were more liberal than were scienceteachers, F(1,62) = 4.0,p < .05; science teachers were more local than were humanitiesteachers, F(1,62) = 16.4, p < .001.
These results seem consistent with the way humanities and sciences are taught inour schools, although not necessarily with anything intrinsic to the disciplines themselves.In the humanities as taught at the secondary and even elementary level, students aregenerally allowed free expression of ideas through essays, stories, and generally lessstructured modes of expression. In the sciences, the dominant mode of teaching tends to befactual recall and convergent solution of problem sets where there is a fixed, preset set ofanswers. Thus, the style of teaching in the humanities seems more oriented toward liberaland nonlocal thinking whereas the style of teaching in the sciences is more oriented towarda more local and less liberal form of expression.
Duration of Teaching Experience
We correlated number of years of teaching with scores for each of the seven styleswe assessed. We found statistically significant correlations for three styles. Moreexperienced teachers were more executive (r = .33, p < .001), local (r = .33, p < .001), andconservative (r = .44, p < .001) than were less experienced teachers. We also found similarresults for age of teachers (which is correlated .87 with duration of experience). However,when duration of teaching experience was partialed out of the correlation between age andstyle, virtually nothing was left, and no significant correlations remained.
We interpret these results as suggesting that when teachers first start out, they tendto try a lot of new things and to be rather exploratory in the methods of teaching they useand in their ways of relating to students. As the years go by, they discover what they believeto work for them, and become settled into, and possibly entrenched in their ways. Thispattern probably applies to many other occupations as wellwith older members of aprofession forming an establishment of sorts, and preferring more to support existingsystems and structures.
Styles Across Schools
We were interested in whether the differences we had observed informally amongschools would be reflected in mean patterns of teacher styles. So we compared meanprofiles of teacher styles across the four schools. The MANOVA revealed a Wilk'sLambda = .52, F(21,216) = 10.0, p < .001, suggesting the advisability of follow-upunivariate analyses.
We found significant differences across schools for six of seven styles. The resultsof this analysis are shown in Table 2.2.
In the analyses, we used Tukey tests corrected for multiple comparisons to followup on our univariate Fs.
39

28
Table 2.2
Teachers' Thinking Styles Influenced by the Type of School
Thinking styles School A' School B School C School DN=33 N=15 N =29 N= 8
Legislative 4.91 5.26 6.16 5.48Executive 4.14 3.68 2.33 4.66Judicial 5.24 5.42 4.82 5.29Local 4.04 3.42 2.58 4.05Global 4.94 4.87 5.05 5.48Liberal 5.08 5.54 5.51 5.57Conservative 3.48 2.37 1.84 3.68
Note. The table represents mean scores (maximum score is 7; minimum score is 1)calculated separately for teachers from different schools for the seven styles.
School A:School B:School C:
School D:
the public high school in community;the academically-oriented private school;the elementary-secondary private school with a special program for emotionaleducation;the elementary-secondary Catholic school
The teachers in the schools differed significantly with respect to the legislative style,F(3,84) = 13.4, p < .001. We found that teachers in School C (emphasizing emotionalneeds of students) was highest, and that both teachers in this school and in the parochialschool (D) were higher in this style than were teachers in the schools that were exclusivelygrades 9-12 (A and B). This result is thus consistent with our previous finding that teachersat the lower grades levels tend more toward the legislative.
The teachers in the schools also differed significantly with respect to the executivestyle, F(3,84) = 29.1, p < .001. Follow-up analyses revealed that all schools differedsignificantly from one another. The most executive school was the parochial Catholicschool (D), followed by the urban public high school (A), the elite preparatory school (B),and the private school oriented toward emotional needs (C). These results suggest thatteachers in the urban public and Catholic parochial school are comfortable with greaterdirection in their teaching, presumably from the administration, than was the case in theother two schools.
The teachers in the schools also differed significantly with respect to the judicialstyle, F(3,84) = 3.2, p < .05. The only significant pairwise comparison was that between theemotionally-oriented private school and the rest, with this private school being less judicialthan the others. This result is consistent with the focus of the school, where there are noletter-grade evaluations and where students who might be adjudged as more or less hopelessin the other schools are viewed as challenges rather than insurmountable problems. Indeed,interviews with administrators suggested that many of the students are in this schoolprecisely because other schools did not want to deal with them.
The teachers in the schools differed as well in the local style, F(3,84) = 17.0, p <.001. Follow-up comparisons revealed that teachers in the emotionally-oriented school (C)
4 0

29
had lower scores than the teachers in any of the other schools, and that teachers in theprestigious preparatory school (B) were lower than teachers in the urban public school (A)and in the parochical school (D), who did not differ from each other. These results wereconsistent with the less local approach of the emotionally-oriented school, which was lessmicroanalytic in its approach to teaching and assessment. Although the prestigious privateschool is at least as grade-oriented as are the other two schools, there is a substantial use ofessays, projects, and portfolios in this school, which tend to be less local in character thanthe assessments in the other two schools, which tend to be more oriented towardconventional short-answer testing.
The teachers in the schools differed in the liberal style, F(3,84) = 3.0, p < .05. Theteachers in the public school (A) were less liberal than the teachers in the other schools. Adifference was also observed for the conservative style, F(3,84) = 28.6, p < .001. The urbanpublic and Catholic parochical schools (A and D) were the most conservative, and theemotionally oriented school (C) was the least conservative, with the prestigious preparatoryschool (B) in the middle. This pattern was the same as that for the local style, and wasconsistent with our impression of a relatively conservative style of instruction in the publicand parochial schools, and a very avant garde approach in the emotionally oriented school.In the former two schools, relatively little deviation was allowed from preset policies withregard to almost everything pertaining not only to instruction, but to teacher comportment ingeneral.
School Styles
As we worked in the schools, we observed that not only did teachers seem to havetheir own individual styles, but so did schools. Each school seemed to have a distinctivelydifferent atmosphere. So we decided after the fact to assess the styles of the schools! Wehad a rater otherwise uninvolved in the study but who is a specialist in educationalpsychology and who has extensive experience working in schools to evaluate the styles ofeach of the schools, using as a basis for her ratings school catalogues, curricula, andpublicity materials. The teacher knew nothing more about the study than that we neededratings of each of the schools on the dimensions, which we explained. Each school wasrated on a 1-to-7 scale for each of the seven styles considered above. We then did contraststo evaluate whether there were differences in styles among the schools, based on the ratings.
Six of seven contrasts were statistically significant, as shown in Table 2.3. Becausethe pattern of results is quite similar to that discussed above, we do not here discuss in detailthese further results. At a general level, the results suggest that the data obtained for theteachers in the schools apply globally to the schools as well. Not only do teachers havestyles, but so do schools.
Study 2: Student Styles
Method
Subjects were all students in the sample described in the General Method section.We used one instrument, the Set of Thinking Styles Tasks for Students (STSTS). Wecollected socio-economic data information and other demographic data, students' grades,and scores on the Iowa Tests of Basic Skills, where available.
41
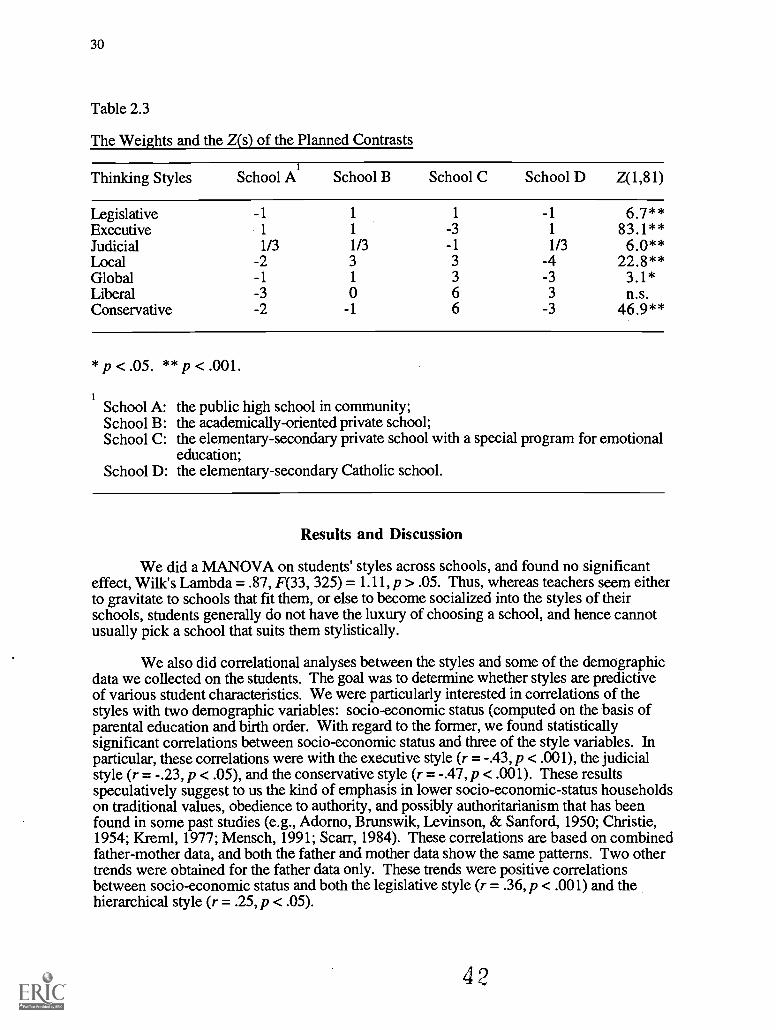
30
Table 2.3
The Weights and the Z(s) of the Planned Contrasts
Thinking Styles School A School B School C School D Z(1,81)
Legislative -1 1 1 -1 6.7**Executive 1 1 -3 1 83.1**Judicial 1/3 1/3 -1 1/3 6.0**Local -2 3 3 -4 22.8**Global -1 1 3 -3 3.1*Liberal -3 0 6 3 n.s.Conservative -2 -1 6 -3 46.9**
*p < .05. **p < .001.
School A:School B:School C:
School D:
the public high school in community;the academically-oriented private school;the elementary-secondary private school with a special program for emotionaleducation;the elementary-secondary Catholic school.
Results and Discussion
We did a MANOVA on students' styles across schools, and found no significanteffect, Wilk's Lambda = .87, F(33, 325) = 1.11, p > .05. Thus, whereas teachers seem eitherto gravitate to schools that fit them, or else to become socialized into the styles of theirschools, students generally do not have the luxury of choosing a school, and hence cannotusually pick a school that suits them stylistically.
We also did correlational analyses between the styles and some of the demographicdata we collected on the students. The goal was to determine whether styles are predictiveof various student characteristics. We were particularly interested in correlations of thestyles with two demographic variables: socio-economic status (computed on the basis ofparental education and birth order. With regard to the former, we found statisticallysignificant correlations between socio-economic status and three of the style variables. Inparticular, these correlations were with the executive style (r = -.43, p < .001), the judicialstyle (r = -.23, p < .05), and the conservative style (r = -.47, p < .001). These resultsspeculatively suggest to us the kind of emphasis in lower socio-economic-status householdson traditional values, obedience to authority, and possibly authoritarianism that has beenfound in some past studies (e.g., Adorno, Brunswik, Levinson, & Sanford, 1950; Christie,1954; Kreml, 1977; Mensch, 1991; Scarr, 1984). These correlations are based on combinedfather-mother data, and both the father and mother data show the same patterns. Two othertrends were obtained for the father data only. These trends were positive correlationsbetween socio-economic status and both the legislative style (r = .36, p < .001) and thehierarchical style (r = .25, p < .05).
4 0
31
The birth-order correlations revealed three significant positive correlations: betweenthe legislative and liberal styles and being later-born (r = .59 for the legislative style, .41 forthe liberal style, and .26 for the hierarchical style). A significant negative correlation wasalso obtained with the judicial style (r = -.24, p < .05).
To conclude, the second study showed that students' thinking styles did not differsignificantly across schools, and that levels of some styles did correlate significantly withtwo demographic variables: socio-economic status and birth order. In the third study, welooked not just at teacher or student thinking styles, but at the two in interaction.
Study 3: Styles of Teachers and Students in Interaction
Method
In this study, we wished to examine the effect of match versus mismatch of teachers'and students' thinking styles on students' performance. We decided to use an extreme-groups design vis a vis the teachers. Thus, we selected 28 teachers-4 for each of 7styleswho were extreme with respect to those styles (e.g., 4 who were highly legislative, 4who were highly executive). We then approached these teachers and asked them toparticipate in the study, which would involve a substantial time commitment (8-10 hours perteacher filling out styles questionnaires for each of the students involved). Of the 28 weapproached, 14 teachers from Schools 1 (N = 2), 2 (N = 5), and 3 (N = 7) agreed toparticipate. In School 4, none of the teachers were willing to make the time commitment,and so School 4 was dropped from the study. This study also involved a total of 104students from Schools 1, 2, and 3, of whom 58 were males and 46 were females.
The questionnaire used in this study was the Questionnaire of Students' ThinkingStyles Evaluated by Teachers (QSTST). Examples of some items from this questionnaireare presented above.
Results and Discussion
Study 2 showed no relation between students' styles and the styles characteristic oftheir schools. We did fmd, however, some matching between students' styles and the stylesof their teachers, as shown by the correlations in Table 2.4. This table shows thecorrelations between student and teacher styles for two measures of styles for teachers andstudents.
If one compares the corresponding correlations in the main diagonal with thenoncorresponding correlations off the main diagonal, one finds that the main-diagonalcorrelations are larger than the off-diagonal correlations in the same row 67 times and notlarger 17 times. By chance, on would expect the main diagonal correlations to be larger 42times. This effect is highly significant by the binomial test, z = -7.3, p < .001. Thus, thereis at least a suggestion that students' styles are somehow socialized by the teachers. Analternative interpretation, of course, would be that students are placed in classes so as tomatch the styles of their teachers, but this interpretation seems wildly implausible.
4 3
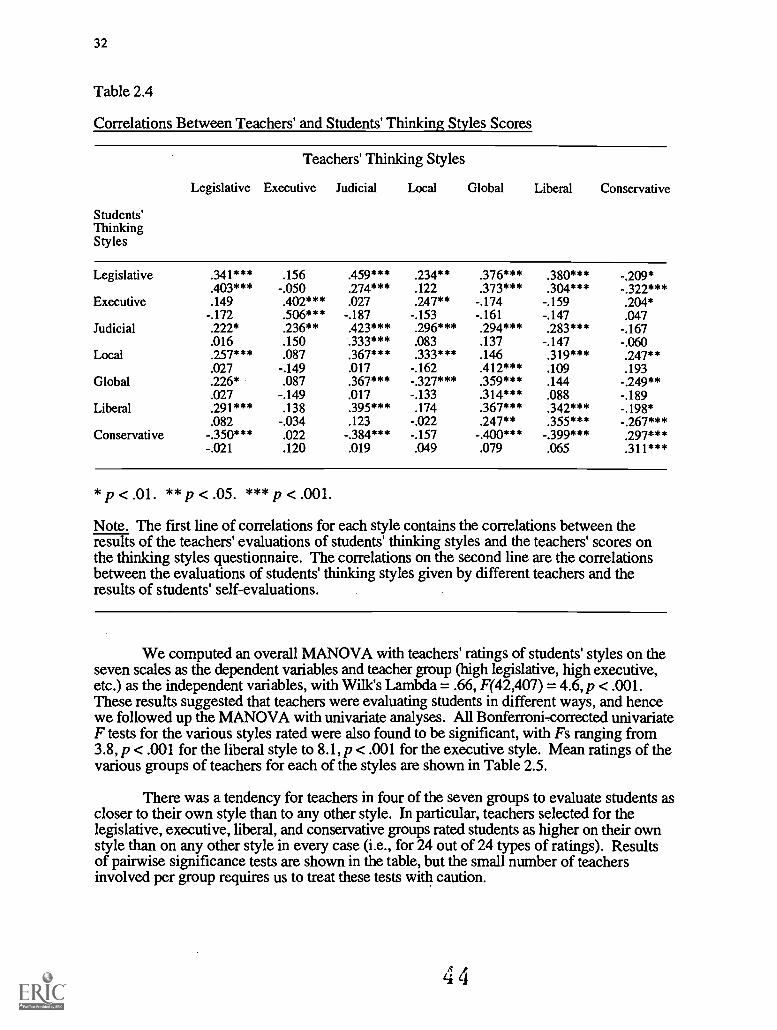
32
Table 2.4
Correlations Between Teachers' and Students' Thinking Styles Scores
Teachers' Thinking Styles
Students'ThinkingStyles
Legislative Executive Judicial Local Global Liberal Conservative
Legislative .341*** .156 459*** .234** .376*** .380*** -.209*403*** -.050 .274*** .122 .373*** .304*** -.322***
Executive .149 .402*** .027 .247** -.174 -.159 .204*-.172 506*** -.187 -.153 -.161 -.147 .047
Judicial .222* .236** .423*** .296*** .294*** .283*** -.167.016 .150 .333*** .083 .137 -.147 -.060
Local .257*** .087 .367*** .333*** .146 .319*** .247**.027 -.149 .017 -.162 .412*** .109 .193
Global .226* .087 .367*** -.327*** .359*** .144 -.249**.027 -.149 .017 -.133 .314*** .088 -.189
Liberal .291*** .138 .395*** .174 .367*** .342*** -.198*.082 -.034 .123 -.022 .247** .355*** -.267***
Conservative -.350*** .022 -.384*** -.157 -400*** -.399*** .297***-.021 .120 .019 .049 .079 .065 .311***
* p < .01. ** p < .05. *** p < .001.
Note. The first line of correlations for each style contains the correlations between theresults of the teachers' evaluations of students' thinking styles and the teachers' scores onthe thinking styles questionnaire. The correlations on the second line are the correlationsbetween the evaluations of students' thinking styles given by different teachers and theresults of students' self-evaluations.
We computed an overall MANOVA with teachers' ratings of students' styles on theseven scales as the dependent variables and teacher group (high legislative, high executive,etc.) as the independent variables, with Wilk's Lambda = .66, F(42,407) = 4.6, p < .001.These results suggested that teachers were evaluating students in different ways, and hencewe followed up the MANOVA with univariate analyses. All Bonferroni-corrected univariateF tests for the various styles rated were also found to be significant, with Fs ranging from3.8, p < .001 for the liberal style to 8.1, p < .001 for the executive style. Mean ratings of thevarious groups of teachers for each of the styles are shown in Table 2.5.
There was a tendency for teachers in four of the seven groups to evaluate students ascloser to their own style than to any other style. In particular, teachers selected for thelegislative, executive, liberal, and conservative groups rated students as higher on their ownstyle than on any other style in every case (i.e., for 24 out of 24 types of ratings). Resultsof pairwise significance tests are shown in the table, but the small number of teachersinvolved per group requires us to treat these tests with caution.
4 4

33
Table 2.5
Do Teachers Overestimate the Extent to Which Their Students Match Their Own Style?
F5trF(6.981lfor ANOVAs
Leg.
5.6***
Exec. Jud.
8.1*** 4.3**
Glob.
3.8*
Loc.
4.0*
Lib.
3.9*
Cons.
6.1***
Mean Students' Scores (by Teachers' Groups)
Legislative Teachers 5.2 3.4 4.3 4.4 3.9 4.8 3.3
(Nteach = 2; Nstu = 35)Executive Teachers
(Nteach = 2; Nstu = 41) 3.8 4.3 35 3.7 4.1 3.7 4.1
Judicial Teachers(Nteach = 2; Nstu = 37) 4.5 4.1 4.4 4.2 4.6 4.4 4.0
Local Teachers 4.8 4.3 4.7 3.4 4.5 4.4 4.6
(Nteach = 2; Nstu = 23)Global Teachers 4.7 4.1 4.5 4.4 4.1 4.7 3.9
(Nteach = 2; Nstu = 28)Liberal Teachers 4.1 3.4 3.8 3.9 3.7 4.9 3.8
(Nteach .= 2; Nstu = 29)Conservative Teachers 4.1 4.2 3.8 3.9 4.0 4.1 4.3
(Nteach = 2; Nstu = 38)
Note. These analyses compared the groups of students, taking classes with teachers, whodiffered in their thinking styles. Estimations of students' thinking styles were obtained fromthe teachers via the Questionnaire of Students' Thinking Styles Evaluated by Teachers(Wilks' Lambda = .45; F(42,407) = 4.6, p < .0001; * p < .001, ** p < .0005, *** p <.0001; for the binary test of means comparison, z = -4.5, p < .001).
In the judicial, global, and local groups, this trend did not emerge; in each of thesegroups, teachers rated the students higher on their own style half the time and lower theother half of the time. In other words, teachers in these groups did not tend to rate studentsas more like themselves than like other patterns of styles.
These results suggest that teachers with at least some styles may have a tendency toview their students as more like themselves (i.e., the teachers) than the students actually are.This tendency may in turn lead teachers to treat the students in ways that would beappropriate for the teachers' own styles, but not necessarily for the students' styles.
Finally, we addressed the question that most centrally motivated the present work.Are students more positively evaluated by teachers when their profile of styles matches thatof their teachers? To answer this question, we correlated students' grades as given by theirteachers with students' styles as evaluated by the teachers. We were interested indiscovering whether students were evaluated better to the extent that there was a matchbetween teachers' and students' style profiles. The data addressing this question are shownin Table 2.6.
4 5
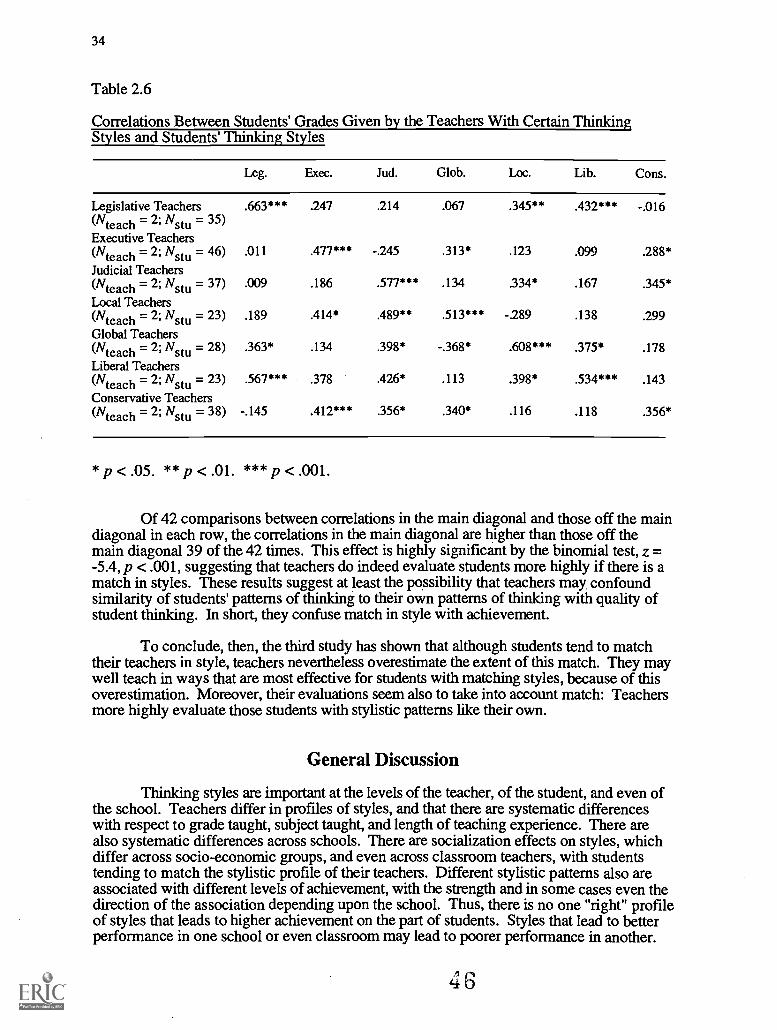
34
Table 2.6
Correlations Between Students' Grades Given by the Teachers With Certain ThinkingStyles and Students' Thinking Styles
Leg. Exec. Jud. Glob. Loc. Lib. Cons.
Legislative Teachers .663*** .247 .214 .067 345** .432*** -.016
(Nteach = 2; Nstu = 35)Executive Teachers
(Nteach = 2; Nstu = 46) .011 477*** -.245 .313* .123 .099 .288*
Judicial Teachers(Nteach = 2; Nstu = 37) .009 .186 .577*** .134 334* .167 .345*
Local Teachers
(Nteach = 2; Nstu = 23) .189 .414* .489** .513*** -.289 .138 .299
Global Teachers
(Nteach = 2; Nstu = 28) .363* .134 .398* -.368* .608*** .375* .178
Liberal Teachers
(Nteach 2; Nstu = 23) .567*** .378 .426* .113 .398* .534*** .143
Conservative Teachers
(Nteach = 2; Nstu = 38) -.145 .412*** .356* .340* .116 .118 .356*
*p < .05. ** p < .01. *** p < .001.
Of 42 comparisons between correlations in the main diagonal and those off the maindiagonal in each row, the correlations in the main diagonal are higher than those off themain diagonal 39 of the 42 times. This effect is highly significant by the binomial test, z =-5.4, p < .001, suggesting that teachers do indeed evaluate students more highly if there is amatch in styles. These results suggest at least the possibility that teachers may confoundsimilarity of students' patterns of thinking to their own patterns of thinking with quality ofstudent thinking. In short, they confuse match in style with achievement.
To conclude, then, the third study has shown that although students tend to matchtheir teachers in style, teachers nevertheless overestimate the extent of this match. They maywell teach in ways that are most effective for students with matching styles, because of thisoverestimation. Moreover, their evaluations seem also to take into account match: Teachersmore highly evaluate those students with stylistic patterns like their own.
General Discussion
Thinking styles are important at the levels of the teacher, of the student, and even ofthe school. Teachers differ in profiles of styles, and that there are systematic differenceswith respect to grade taught, subject taught, and length of teaching experience. There arealso systematic differences across schools. There are socialization effects on styles, whichdiffer across socio-economic groups, and even across classroom teachers, with studentstending to match the stylistic profile of their teachers. Different stylistic patterns also areassociated with different levels of achievement, with the strength and in some cases even thedirection of the association depending upon the school. Thus, there is no one "right" profileof styles that leads to higher achievement on the part of students. Styles that lead to betterperformance in one school or even classroom may lead to poorer performance in another.
4 6

35
With regard to the level of the school, we showed that schools seem themselves to havedifferent stylistic patterns, which are reflected in the styles of thinking of the teachers. Thedata suggest that teachers either seek out a school that matches their stylistic pattern, or elseadapt themselves, probably over a long period of time, to styles of thought that arecompatible with the styles characteristic of and valued by the school.
These levels interact. Probably the most crucial finding regarding the interactionwas that students were viewed by their teachers as achieving at higher levels when thestudents' profile of styles matched that of their teacher. In other words, teachers appear tovalue more highly students who are like themselves. Indeed, the data suggested thatteachers tend to overestimate the extent to which their students match their own styles.
The ideas of matching teaching and learning styles, and of the relevance of teachers'styles for learners' styles, are of course not new. Lawrence (1982) has recommendeddeveloping teaching strategies for the majority group of extraverted-sensing children, andthen creating more individualized approaches to the smaller number of introverted andintuitive children. Teachers who report intuitive-thinking and intuitive-feeling as thepreferred learning styles of their students tended to prefer teaching with sensing-feeling andsensing-thinking styles. Huelsman (1983) concluded that this lack of congruity could bedetrimental to teacher effectiveness and might be a factor in teacher stress, jobdissatisfaction, and decision to leave the profession.
The results presented here suggest that styles need to be considered in the teaching-learning process, and that the theory of mental self-government provides one basis for sucha consideration. In particular, addressing the question of which students are gifted requiresconsidering whether students can match their styles flexibly to a given task at hand, as wellwhether a teacher will recognize a student as gifted if the student's profile does not closelymatch the teacher's.
4 7

37
References
Adorno, T. W., Brunswik, E. F., Levinson, D. J., & Sanford, R. N. (1950). Theauthoritarian personality. New York: Harper.
Campbell, D. T, & Fiske, D. W. (1959). Convergent and discriminant validation bythe multitrait-multimethod matrix. Psychological Bulletin, 56, 81-105.
Christie, R. (1954). Studies in the scope and method of "The authoritarianpersonality." Chicago: The Free Press.
Dunn, R., & Dunn, K. (1978). Teaching students through their individuallearning styles. Reston, VA: Reston Publishing.
Gardner, R. (1953). Cognitive style in categorizing behavior. Perceptual andMotor Skills, 22, 214-233.
Garner, W. R., Hake, H. W., & Eriksen, C. W. (1956). Operationism and theconcept of perception. Psychological Review, 63, 149-159.
Gregorc, A. F. (1984). Style as a symptom: A phenomenological perspective.Theory Into Practice, 23, 51-55.
Grigorenko, E. L., & Sternberg, R. J. (1995). Thinking styles. In D. Saldofske &M. Zeidner (Eds.), International handbook of personality and intelligence (pp. 205-229).New York: Plenum.
Holland, J. L. (1973). Making vocational choices: A theory of careers.Englewood Cliff, NJ: Prentice-Hall.
Huelsman, J. (1983). An exploratory study of the interrelationships of preferredlearning styles, psychological types, and other selected characteristics of practicingteachers. Unpublished doctoral dissertation. The Ohio State University, Columbus, OH.
Jung, C. (1923). Psychological types. New York: Harcourt Brace.
Kogan, N. (1983). Stylistic variation in childhood and adolescence: Creativity,metaphor, and cognitive style. In P. H. Mussen (Ed.), Handbook of child psychology (Vol.3, pp. 630-706). New York: Wiley.
Kreml, W. P. (1977). The anti-authoritarian personality. Oxford, NY: PergamonPress.
Lawrence, G. W. (1982). People type and tiger stripes. Gainesville, NY: Centerfor the Application of Psychological Type.
Mensch, B. (1991). D. H. Lawrence and the authoritarian personality. NewYork: St. Martin's Press.
Miller, A. (1987). Cognitive styles: An integrated model. EducationalPsychology, 7, 251-268.
4 8

38
Miller, A. (1991). Personality types, learning styles and educational goals.Educational Psychology, 11, 217-238.
Myers, I. B., & Myers, P. B.Psychologists Press.
Renzulli, J. S., & Smith, L. HCenter, CT: Creative Learning Press.
Scarr, S. (1984). Mother care, other care. New York: Basic Books.
Sternberg, R. J. (1988). The triarchic mind: A new theory of human intelligence.New York: Viking.
Sternberg, R. J. (1990). Thinking styles: Keys to understanding studentperformance. Phi Delta Kappan, 71, 366-371.
Sternberg, R. J. (1994). Thinking styles and testing: Bridging the gap betweenability and personality assessment. In R. J. Sternberg & P. Ruzgis (Eds.), Intelligence andpersonality (pp. 105-127). New York: Cambridge University Press.
Vernon, P. (1973). Multivariate approaches to the study of cognitive styles. In J.R. Royce (Ed.), Contributions of multivariate analysis to psychological theory (pp. 125-148). London: Academic Press.
Witkin, H. A. (1973). The role of cognitive style in academic performance and inteacher-student relations. Unpublished report. Princeton, NJ: Educational TestingService.
(1980). Gifts differing. Palo Alto, CA: Consulting
. (1978). Learning styles inventory. Mansfield
Witkin, H. A., Oltman, P. K., Raskin, E., & Karp, S. A. (1971). Embedded FiguresTest, Children's Embedded Figures Test, Group Embedded Figures Test. Manual. PaloAlto, CA: Consulting Psychologist Press.
4 9
39
PART 3: An Investment Approach to Creativity: Theory and Data
What enables a person to be creative? Why do some people generate novel ideasand pursue them while others join the crowd with humdrum contributions? We suggest thatspecific aspects of six resourcesintellectual processes, knowledge, intellectual styles,personality, motivation, and environmental contextall contribute to creativity (Sternberg &Lubart, 1991, 1992, 1995). The cognitive resources work together with the conative andenvironmental ones to form an individual's "investment" in creative enterprise.
In any number of domains, a person may apply the six resources to initiate a projectand bring it to fruition. For creative work, we propose that the choice of domains, projects,and ideas for those projects will involve a basic investment strategy of "buying low andselling high." Buying low means pursuing ideas that are unknown or at least slightly out offavor but that have growth potential. A person can buy low in terms of both the primaryidea for a project and the secondary ideas needed to develop the product. Buying lowinherently links risk-taking to creative performance. Selling high involves presenting one'swork and moving on to new projects when an idea or product becomes valued and yields asignificant return. Analogous to stock-market investment success, sometimes creativity failsto occur because a person puts forth ("sells") an idea prematurely, or holds an idea so longthat it becomes common or obsolete. We suggest that selling high is important for creativesuccess on an individual project and for a career of creative work.
In addition to the "buy lowsell high" theme, the investment metaphor highlightsaspects of the definition and judgment of creativity. First, the evaluation of both financialworth and creativity involves social consensus. A stock is valuable, in part, becauseinvestors collectively desire to possess it. A product is labeled creative at a point in timebecause appropriate judges collectively agree on this evaluation (Amabile, 1982). Previoustheoretical and empirical accounts of people's conceptions of creativity suggest that noveltyor statistical rarity, appropriateness, and high quality are the main criteria for judgingcreative performance (Amabile, 1982; Jackson & Messick, 1965; MacKinnon, 1962;Sternberg, 1985b, 1988a). Second, the investment metaphor points out the importance ofconcentrating the evaluation of creativity on observable products. When evaluatingfmancial investments, the measurement of performance is tangible, namely, monetary gain.A potential stock investor who has good ideas but who does not participate in the stockmarket is not a successful investor in stocks. In our view of creativity, a similar distinctionexists between latent creative potential and creative performance. Our investigation of theinvestment approach focuses on creative performancecreativity that is actually manifestedin some kind of overt form (see Albert, 1983). Third, the investment approach highlightsthat there is a continuum of creative performance as there is a continuum of risk and profitin the financial realm.
As with any metaphor between disparate subjects, there are points ofcorrespondence, as we have been noting, and points of non-correspondence, which alsobring insights. One example of the differences between the investment and creative realmsis the starting point for each endeavor. Financial investors generally buy into existingstocks or other instruments. For creative work, people may join an existing field or a genre,but must also generate the specific project or starting ideas. Another example involves thesource of the "value added" after buying into a stock or idea, respectively. The fmancialinvestor usually monitors a stock, which may gain in value because the business oreconomy as a whole succeeds; the investor does not actually go to work for the company.For creativity, however, the individual must roll up his or her sleeves, apply the cognitive,conative, and enviromnental resources to the problem, push the project toward a fmal
50
40
product, and sometimes promote the product to win acceptance. Thus for creative work, anindividual's resources are actively applied throughout a project whereas, in the financialrealm, an investor uses his or her resources primarily to make just the "buy" and "sell"decisions.
To conclude our sketch of the investment approach, we turn to a brief description ofthe cognitive, conative, and environmental resources that a person can invest in a project andthe manner in which these resources combine (see Sternberg & Lubart, 1991, for details).We propose that the six resources described below can lead a person to buy low, develop aninnovative project, and sell high.
Six Resources for Creativity and Their Confluence
Problem definition (or redefmition) and insightful thinking are vital to creativeperformance (Davidson & Sternberg, 1984; Getzels & Csikszentmihalyi, 1976; Sternberg,1985a). Getzels and Csikszentmihalyi's (1976) seminal research on problem findingshowed that art students who produced highly original still-life drawings spent longerperiods of time formulating their compositions than less creative peers. Creative work ofteninvolves taking an existing problem and redefining it by approaching the problem from anew angle. The insight processes of selective encoding, comparison, and combination arehypothesized to facilitate problem redefinition and problem solution. Selective encodingoccurs when a person notices the relevance of information to a task. When Fleming noticedthe bactericidal properties of the penicillium mold that had ruined an experiment, he had aselective-encoding insight. Selective comparison involves the judicious use of analogies andmetaphors to conceptualize and complete a task. Kekulé, for example, allegedly used adream of a snake biting its tail to aid him in discovering the ring-like structure of thebenzene molecule. Selective combination is the meaningful synthesis of disparateinformation. Darwin synthesized into a unified whole disparate facts that served as a basisfor his theory of natural selection. Analogously, in investing, the successful investor mustselectively encode information others do not see as relevant, compare the current case toother investment situations, and synthesize the implications of this information to make thebest investment decisions.
Knowledge, the second resource, is necessary to make an informed creativecontribution in any domain. Knowledge provides a large part of the raw material on whichintellectual processes operate. Knowledge of the "state of the market" in a domain helps aperson to avoid reinventing ideas or products that society has already experienced.Knowledge also allows a person to be contrarianto move away from the popular trendsas successful investors often do in financial markets (Dreman, 1982). With further benefitsto creative performance, knowledge helps a person to produce high quality work, to noticeand use beneficial chance occurrences, and to devote greater cognitive resources to theprocessing of new ideas. Given these benefits of knowledge, it is important to note,however, that experts operating on knowledge-rich tasks may become entrenched in astandard or "correct" way of approaching a problem (Frensch & Sternberg, 1989; Langer,1989). For creativity, therefore, very high levels of knowledge can be detrimental(Simonton, 1984, Sternberg & Lubart, 1991).
Intellectual styles, the third resource, refer to preferences in using one's intellectualskills. Certain intellectual styles facilitate the application of intellectual processes andknowledge by directing an individual toward problem approaches where novelty can occur.Based on a model of mind as mental self-government, three of the style clusters are calledlegislative-executive, conservative-liberal, and global-local (Sternberg, 1988b). People with a
5 1
41
legislative style prefer work that allows them to make new rules and structures, whereasthose with an executive style prefer to apply their thinking skills to the execution of tasks byfollowing rules. A preference for sequential completion of tasks one at a time, themonarchic style, often co-occurs with the executive style. The conservative-liberal stylescontrast those with a proclivity for tasks that involve old approaches with those preferringnew approaches. Finally, the global style refers to people who prefer to focus on thebroader, general aspects of a task whereas the local style describes those who prefer detail-oriented work. An individual can be characterized by a combination of styles reflectingperson-situation interactions (Cantor & Mischel 1979), but one style may dominate overothers for a given individual. The legislative, liberal, and global styles are hypothesized tomake positive contributions to creative performance. The executive, conservative, monarchic,and local styles are predicted to affect creativity negatively.
In terms of the creative personality, we identify five attributes as essential. Each ofthese attributes helps the cognitive resources to be used effectively. The first, tolerance ofambiguity (Barron & Harrington, 1981; Golann, 1963), is necessary during those periodsof creative endeavor in which things are not quite fitting together, but in which prematureclosure would prevent the intellectual processes from having a sufficient opportunity to get ahandle on the problem. The second attribute, perseverance (Golann, 1963; Roe, 1952), isessential in any kind of contrarian efforts where one is going against entrenched ideas andagainst those who have a stake in the existing order. Intellectual processes and knowledgeoften need to be applied repeatedly to solve a problem. Without perseverance, the problem-solver may very well become tired and stop the cognitive work early. Third, a willingness togrow becomes important as one attempts to go beyond one's past knowledge and previouslysuccessful uses of intellectual skills to make new ones that are genuinely novel. Fourth, awillingness to take risks (Glover, 1977; McClelland, 1956) is emphasized in our investmentapproach. During creative work, there is a potential for gain (internal and external rewards)or loss (e.g., time, energy, criticism) and the outcome is uncertain. A general principle ofinvestment is that, on average, greater return involves greater risk. The link between risk-taking, cognitive resources, and creative performance is developed in detail later in thechapter. Finally, the fifth attribute is individuality and a supporting courage of one'sconvictions (Amabile, 1983; Barron & Harrington, 1981; Dellas & Gaier, 1970; Golann,1963; MacKinnon, 1962, 1965). One needs to value one's novel cognitions and thedifferences between these cognitions and other people's ideas. To achieve creativity, aperson needs to believe in novel ideas even if they go against the crowd's opinion. Theseaspects of personality are viewed as necessary for the maintenance of high levels of creativeperformance over long periods of time.
Closely related to personality characteristics is the motivation to use intellectualprocesses, knowledge, or intellectual styles for creative purposes. In the financial realm,"money makes the world go around." For creative work, intrinsic rewards such as realizingone's potential and satisfying one's curiosity have often been viewed as important drivingforces for creativity (Arnabile, 1983; Crutchfield, 1962; Golann, 1962, Rogers, 1954).These motivators share a common featurethey all tend to focus attention on the task,which concentrates the effect of whatever cognitive resources are available. Goal-focusingmotivators, in contrast, lead people to see a task as a means to an end. If the goal, whichmay be money, recognition, or an intangible reward, remains salient during task completion,then creative performance suffers because attention is drawn away from the task itself.Thus, we emphasize the way in which motivation focuses attention (task vs. goal) rather thanthe specific motivator. We suggest that, at moderate levels, motivators (both intrinsic andextrinsic) will be most effective for creativity because people will have a desire to work andbe able to maintain a focus on their work. Thus, in accord with the Yerkes-Dodsonprinciple, motivation is hypothesized to bear an inverted-U relationship to creativity.
5 2
42
The fmal resource for creativity is the environmental context. Environments canprovide physical or social stimulation, either of which helps new ideas to form by "jumpstarting" a person's thinking processes. Environments also differ in the extent to whichcreativity is fostered (Amabile, 1983; Lubart, 1990; Rubenson & Runco, 1992; Simonton,1984). The earliest inklings of new ideas, which Finke, Ward, and Smith (1992) call"preinventive forms," need an atmosphere that permits and encourages further idea growthand developments. When conformity is valued, new ideas may be squelched as soon asthey are conceived. In investment terms, these conditions would constitute a "bear market"for creative work. In a third role, social environments provide a subjective evaluation of aproduct's creativity or an individual's creative performance. For example, the work of ayoung poet could be considered very creative by her peers, but not by literary critics, whomight regard the poetry as too offbeat. Thus, the environment sets standards for creativeproducts that individuals may come to internalize as part of their cognitive processes.
A confluence of resources is also necessary. The combined contributions of theindividual resources plus interactions among the resources lead to a proclivity for "buyinglow" and achieving creative performance (see Sternberg & Lubart, 1991). The nature of theresource confluence may vary with the specific domain and task that is involved.
Taken together, we believe that these ideas on the conceptualization of the resourcesand their confluence themselves represent an integrative approach to creativity. We haveattempted to combine the strongest elements of specialized and alternative theories using anew investment metaphor and confluence hypotheses. In particular, the investmentapproach draws on Amabile's (1983) componential model of creativity, Csikszentmihalyi's(1988) system approach, Getzels and Csikszentmihalyi's (1976) research on problemfinding, and Walberg's (1988) ideas on creativity and "human capital."
The investment approach also connects with Finke, Ward, and Smith's (1992) workon creative cognition. The creative cognition approach focuses on the informationprocesses and structures that lead to creativity. Similar to the investment view, creativity isseen as the result of several mental processes that are used to generate and develop newideas. Also, Finke, Ward, and Smith (1992) mention the importance of motivation,overcoming a fear of failure, and personal involvement on a task, which leads toperseverance and a conviction in one's ideas. Unlike the investment approach, however,creative cognition work (as the label indicates) concentrates on the cognitive side ofcreativity. We balance our attention between cognitive and non-cognitive (personality,motivation, environment) resources. Thus, one could view the work on creative cognition asan extended and a specialized treatment of the cognitive portion of creativity, compatiblewith our more general multivariate approach.
We will expand on the potential links between creative cognition and the investmentapproach after considering two preliminary empirical studies conducted within theinvestment approach. The first study focuses on the cognitive and conative resources forcreative work. The second study provides an in-depth look at cognitive risk-taking and theconcept of buying low and selling high.
Study 1: Testing the Investment Resources for Creativity
Although some recent work has begun to acknowledge that different aspects ofcreativity are best studied together (Csikszentmihalyi, 1988; Gruber, 1981; Hill, 1990;Rossman & Horn, 1972), previous empirical work has often treated the antecedents ofcreativity in relative isolation from each other. For example, a large literature base explores
5 3

43
the connection between creativity and intelligence. However, this work has remainedseparate from other studies on personality and creativity (see Barron & Harrington, 1981).The present research simultaneously studies multiple resources of the investment approach.We seek to describe the contribution to creativity of each resource alone and in the contextof the other resources. For example, we explore how aspects of intelligence relate tocreative performance and then whether the variability in creative performance thatintelligence "explains" is different from the variability that the other resources "explain."We hypothesize that each resource will uniquely contribute to creative performance. Theresources will also contribute in ways that overlap statistically with other resources and cannot be isolated at this time. The relative contribution of each resource to creativeperformance depends on three variables: (a) the general importance of the resource forcreativity (e.g., intellectual processes may be more important than knowledge), (b) thespecific requirements of the creativity task (e.g., short-term tasks may decrease theimportance of cognitive style or personality), and (c) the extent to which each resource isoperationalized and measured well. With these points in mind, the fmdings we reportshould be considered suggestive rather than definitive.
The present research, with its multivariate design, also allows us to examine potentialinteractions between the resources for creativity. We hypothesize that high levels on two ormore resources (such as intellectual processes and knowledge) may boost creativity morethan does the simple additive effect of the individual resources.
Before turning to the methodology and results, we want to note that the focus of thecurrent study is on the person-centered resources for creativity (intellectual processes,knowledge, intellectual styles, personality, and motivation)thus, this first study does notdirectly address the environmental resource. Also, the present study uses a sample oflaypeople to test the investment approach (see also Finke, Ward, & Smith, 1992). Others,such as Gruber (1981), have examined the lives of extremely creative people (e.g. CharlesDarwin). The investment approach, presented above, should apply to all levels of creativeachievement. There are large- and small-scale investors in both the fmancial and creativerealms. However, the use of a sample of laypeople focuses the current test on more typical,everyday-levels of the creative-performance continuum.
Method
Our subjects for the primary phase of the study consisted of 48 people from theNew Haven, CT area (24 males, 24 females). The mean age of the sample was 33.40 years(SD = 13.79), with a range of 18 to 65 years. Fifteen additional New Haven subjects (8males, 7 females) judged the creativity of the work produced in the first phase. These ratershad a mean age of 41.07 years (SD = 13.02) and ranged in age between 21 and 70.
Our study employed multiple measures of creative performance and of theresources, which were chosen to reflect both the investment approach and alternativeperspectives. The materials consisted of (a) creativity tasks, (b) cognitive tests designed tomeasure the intellectual processes relevant to creativity, and (c) self-report measurespertaining to the knowledge, intellectual styles, personality, and motivation resources of theinvestment framework.
Drawing, writing, advertising, and scientific tasks were composed to allow a broadassessment of creative performance. These tasks involve the production of substantiveproducts that can exhibit a range of creativity. The tasks have a parallel form across the fourdomains and include topic selection as an integral part of the creative process. Amabile,(1983) and others have used similar types of tasks (e.g., collage-making and poem-writing)to measure creative performance.
5 4
44
The materials for each task consisted of a list of topics and an array of supplies(e.g., pens, paper, pastels). Some drawing topics were "hope," "rage," and "earth from aninsect's point of view." Examples of topics used for the other domains were: "Beyond theEdge" and "The Octopus's Sneakers" as titles to be expanded into stories, "bowties,""brussels sprouts," and "the IRS" as topics for television commercials, and "How could wedetect aliens among us?" as an open-ended scientific problem. Three to ten topics wereprovided for each domain.'
Four tests of intellectual ability were used as convergent measures of the investmentapproach's intellectual processes resource. The measures were: (a) the Stroop Color andWord Test, individual form (Golden, 1975) to measure selective encoding, (b) the LetterSeries Test (Thurstone, 1962) to measure induction, (c) the Culture-Fair Test of g, Scale 3,Form A (Cattell & Cattell, 1963) to measure fluid intelligence, and, (d) a Coping withNovelty test designed for this study to measure selective encoding, combination, andcomparison skills. The Coping with Novelty test consisted of 7 insight problems, 17 verbaland 13 figural problems that involved unusual and counterfactual reasoning, and 10 verballearning from context problems (interitem reliability = .89). These items were drawn fromprevious research on the triarchic theory of human intelligence (Sternberg, 1980, 1985a,1986)
Knowledge was assessed with a biographical questionnaire concerning educationalhistory, knowledge level, and activities in the domains studied. For knowledge level,subjects were asked to compare their knowledge in a domain with an average person'sknowledge. For relevant activities, subjects were asked how often they engaged in drawing,painting, writing short stories, writing poetry, looking at advertisements, selling products,conducting science experiments, electronics, working on social problems, plus otheractivities.
Two instruments, the Intellectual Styles Questionnaire (ISQ), an operationalizationof Sternberg's (1988b) theory of mental self-government, and the Myers-Briggs TypeIndicator (MBTI), Form G (Myers & McCaulley, 1985), were used to assess intellectualstyles. The Intellectual Styles Questionnaire (ISQ) has 130 items measuring thirteenthinking styles, including the legislative, executive, monarchic, conservative, liberal, global,and local styles specified in the investment approach. A sample item measuring the globalstyle is: "When working on a project, I care more about its general impact than about thedetails of it." Previous research on the ISQ has also shown adequate scale reliability andconstruct validity (Martin, 1988). The MBTI provides convergent validity with itsintuitivesensing style dimension, which is related to the investment framework'sconception of styles.
A wide range of personality characteristics was measured by the Adjective CheckList (ACL) (Gough & Heilbrun, 1983) and the Personality Research Form (PRF), Form E(Jackson, 1984). The ACL provides a list of adjectives that the subject may check as self-descriptors. The PRF uses brief statements of behaviors that the subject may fmdindicative. These instruments provide converging measures for the personality resource.
1 The topics for each domain were: Drawing: a dream, a quark, hope, rage, pleasure, earth from an insect'spoint of view, contrast, tension, motion, beginning of time; Writing: Beyond the Edge, A Fifth Chance,Saved, Under the Table, Between the Lines, Not Enough Time, The Keyhole, The Octopus's Sneakers, 2983,It's Moving Backward; Advertising: double-pane windows, brussels sprouts, Internal Revenue Service(portray positive image), broom, iron, cufflinks, bowties, doorknobs, sugar substitute; Science: Detectingwhether aliens are living among us, Determining if someone has been on the moon in the past month,Devising a way for the SDI "star wars" system to destroy real missiles but avoid empty decoy missiles sentto overload the defense system.

45
Motivation was assessed by a motivational questionnaire composed for this studyand the Creative Motivation Scale (Torrance, in press). The 50-item motivationalquestionnaire was constructed on the basis of previous experimental work (see Amabile,1985); subjects used a 7-point scale to rate how well domain-specific statements like "Iwould write a short story to challenge myself' described them. The "intrinsic" motivationsof relaxation, self-expression, gaining insights, enjoying order in a product, personalchallenge, and enjoying a sense of accomplishment and "extrinsic" motivations of money,impressing others, fulfilling external expectations, and obtaining a future job were assessedacross artistic, literary, advertising, scientific, and general-life domains. Items werestandardized and used to form intrinsic (6 items), extrinsic (4 items), and comprehensivemotivation scales (10 items) for each of the domains (15 scales in total). The scales showedhigh interitem reliability with a median alpha of .80. The Creative Motivation Scalecontains 28 true-false behavioral statements regarding intrinsic motivation and othercreativity-relevant motivations. The Creative Motivation Scale was included for comparativepurposes.
Subjects completed the creativity tasks and resource measures during,the course ofthree two and one-third hour sessions. The sessions occurred, on average, two days apart.The first session began with the drawing, writing, advertising, and scientific tasks, whichwere presented in counterbalanced orders across subjects. As described above, each taskinvolved (a) the selection of a topic from a list of possible topics, and (b) the creation of aproduct. Subjects worked individually and were encouraged to "be imaginative" and to"have fun." Subjects worked on the drawing and writing tasks for 20 minutes each and theadvertising and scientific tasks for 10 minutes each. After completion of these four tasks,the Intellectual Styles Questionnaire, Adjective Check List, and Stroop Color and WordTest were administered. In the second session, each subject received the drawing, writing,advertising, and scientific tasks in a new sequence. This time, however, subjects chose anew topic from each task list and then proceeded. Following these tasks, subjectscompleted the knowledge questionnaire, Torrance's Creative Motivation Scale, themotivational questionnaire, the Myers-Briggs Type Indicator, the letter series test, and theCulture Fair Test of g. The third session consisted of the Coping with Novelty test and thePersonality Research Form. In all sessions, subjects occasionally shared the experimentaltesting room.
Our creativity rating procedure was modeled on Amabile's (1983) consensualassessment technique, with the exception that peer judges were used. Peers, rather thanexperts, were chosen to be raters because peers are the most likely audience for laypersons'work and peers typically evaluate each others' work. Our peer raters worked individuallyand were asked to use their own definition of creativity. They judged each product on a 1(low creativity) to 7 (high creativity) point scale. The need for raters to judge products thatvaried on topic choice made the rating task more difficult than if all products were on thesame topic. However, the presence of multiple topics in a set of products to be judged ischaracteristic of many, if not most, real-world judgement situations and interjudgereliabilities were high. Raters reported that they judged the products against each other anduse some external standards as well. Following the creativity ratings, a single randomselection of 24 pieces from each product set was presented for further rating. The subset ofproducts from each domain was rated for novelty, aptness to the topic chosen, aestheticvalue, integration of disparate elements, technical skill, and perceived effort employed by thecreator.
Results and Discussion
The presentation of the results for this first study is divided into three sections. Thefirst section describes aspects of creative performance: descriptive statistics, criteria used by
56

46
raters, and consistency over time and domain. The relationships between individualresources of the investment approach and creative performance are reported in the secondsection. In the fmal section, the confluence of resources is addressed.
Aspects of Creative Performance
The creativity score for each product was the mean creativity rating given by 15raters. The mean creativity ratings for the eight products generated by each subject (twodrawings, two writings, two advertisements, two scientific solutions) were all close to the 4.0midpoint of the rating scale (m = 3.68 to 4.22), demonstrating that neither a ceiling nor afloor effect occurred. Standard deviations were slightly less than one point on the ratingscale (SD = .78 to .91). For each subject, a composite creativity score was generated foreach domain by averaging the two products from the domain.2 These scores are referred tosimply as the "drawing," "writing," "advertising," and "scientific" creativity scores. Themean creativity score across all four domains is termed the "overall" creativity score.
The interjudge reliabilities (alpha coefficients) of the ratings for the various domainsranged from .81 to .89, demonstrating high interjudge consistency (see Amabile, 1982).For the overall creativity score the mean interjudge correlation was .43 and the reliabilitywas .92. We examined raters' implicit criteria for creativity by gathering additional ratingson a subset of 24 products from each task domain. Each product was characterized by acreativity rating and ratings on the dimensions of novelty, aptness, aesthetic value,integration of disparate elements, technical goodness, and effort exhibited. The specializedratings, in general, correlated significantly with creative performance ratings and with eachother. Of primary interest, creativity ratings correlated .65 (p < .001) with novelty ratings,.49 (p < .001) with aptness ratings, and .57 (p < .001) with technical goodness ratings.Novelty ratings were relatively independent (r = .09, n.s.) of aptness ratings and correlated.37 (p < .001) with technical goodness.
Based on theoretical definitions and previous research (Amabile, 1982), ahierarchical forward regression was performed on the raters' data. Novelty and aptnessratings were entered first as predictors of creativity ratings. With novelty (/3= .62, p < .001)and aptness (/3 = .43, p < .001) in the model, 61 percent of the variance in creativity ratingswas explained (F(2,93) = 73.21, MSe = .25, p < .001). Integration ratings then entered as athird significant predictor variable. This fmal model explained 70 percent of the varianceusing novelty (fl = .40, p < .001), aptness (/3 = .15, p < .05), and integration (/3 = .47, p <.001), (F(3,92) = 71.67, MSe = .19, p < .001). Separate regressions by domain supportedthe generalizability of the overall analysis to writing, advertising, and scientific products. Inthe drawing-product analysis, aesthetic value rather than integration entered as a thirdsignificant predictor of creativity ratings.
How stable was creative performance? A repeated-measures analysis of varianceacross time and domain showed no significant mean differences for the creativity of workproduced during session one and session two. Correlations across time suggest moderatestability. The correlations between the products within each domain were: .37 (p < .05) fordrawing 1 with drawing 2, .63 (p < .001) for writings, .65 (p < .001) for advertisements, .52(p < .001) for science, and .67 (p < .001) for overall creative performance between sessions.While all of these correlations across time are significant, some fluctuations in creativeperformance obviously occur. We believe that these fluctuations are inherent to creativity,and derive from day-to-day changes in the resources that lead to creative performance. Thedrawing, writing, advertising, and science creativity scores used throughout this study provide
2 One subject was missing a science product for time 2. This subject's scientific creativity score equaled thescore for the first science project.

47
a more stable estimate of creative performance than individual products because the domainscores represent the mean performance on two occasions.
There was a significant difference in rated creativity across the four domains,F(3,138) = 5.51, MSe = .69, p < .01. The mean creativity ratings for the drawings were4.13, for the writings 4.14, for the advertisements 3.91, and the scientific products the meanwas 3.71. A contrast showed that the science domain was significantly lower than thedrawing and writing domains. These mean differences may reflect subjects' differentialfamiliarity with the domains.
Addressing the issue of domain-specificity of creative performance, Table 3.1presents the correlations across the domains. These ranged from .23 (n.s.) to .62 (p < .001)with a median correlation of .37 (p < .01). The results suggest that creativity is moderatelydomain-specific; however there is more overlap between domains than would be expectedjust by chance. Others, such as Runco (1987) who studied children's self-reported creativeachievements across several domains, also fmd that creativity is somewhat but notcompletely domain specific. This balance makes sense within our investment approachbecause some resources such as intellectual processes may apply widely across domains(leading to generalized creativity) but other resources (such as the personality trait of risktaking) may be more domain specific, especially for advanced levels of creative work(Sternberg & Lubart, 1993).
Person-Centered Resources and Creative Performance
Intellectual Processes
The Culture Fair Test of g (IQ), series completion test, and Coping with Novelty testall correlated strongly with creative performance (r = .41 to r = .68, p < .001). These testsrequired selective encoding, comparison, and combination processes; the results thereforeprovide convergent evidence for the importance of the insight skills specified in theintellectual processes resource. The Stroop Color and Word Test involved selectiveencoding alone and showed somewhat lower correlations with creative performance (r = .22,n.s. to r = .35, p < .05). For subsequent confluence analyses, an overall intellectual-processmeasure was created by linearly combining standardized scores for all the individual tests.The correlations of this combined measure with creative performance ranged from .50 (p <.001) to .61 (p < .001) across domains (see Table 3.2).
Table 3.1
Correlations Across Creative Performance Domains (N = 48)
Creative Performance DomainDraw Write Advertise Science
DrawingWritingAdvertisingScience
.85 .32*.89
.31*
.41**
.81
.23
.62***44**.87
* p < .05. ** p < .01. *** p < .001.
Note. The diagonal elements give the alpha coefficient interrater reliabilities.

48
Table 3.2
Correlations of Resources With Rated Creative Performance (N = 48)
DrawCreative Performance Domain
Science OverallWrite Advertise
ResourceIntellectual Processes .51*** .59*** .50*** .61*** .75***Knowledge 35* 37** 33* .41** .
Intellectual Styles -.08 -.28 -.51*** -.28Personality .25 .25 .26 .32* .36*
Motivation .28 34* .61*** .34* .53***
Combined Resourcesb .61** .63*** .73*** .66*** .83***
* p < .05. ** p < .01. *** p < .001.
aMotivation is expressed as a combined score containing negative linear and negativequadratic (inverted-U) trends.Combined Resources is the regression-based multiple correlation of the five resourceswith creative performance.
In a separate study, described later in detail, a second sample of 44 New Havensubjects also completed the drawing and writing creativity tasks, the Culture Fair Test of g,the Extended Range Vocabulary Test, and other measures. The Culture Fair Test of g againcorrelated significantly with creative performance in drawing (r = .35, p < .05) and writing(r = .36, p < .05). These correlations were slightly lower but not significantly different (z <1) from those observed in the present study. Demonstrating discriminant validity, theExtended Range Vocabulary test, a measure of crystallized intelligence, showednonsignificant correlations with creative performance (r = -.08, n.s. for drawing; r = .13,n.s. for writing). Perhaps, the low correlations (-.05 to +.31) previously observed betweenintelligence and creativity (Barron & Harrington, 1981) were due to the use of intelligencemeasures that emphasized crystallized intelligence and did not fully tap relevant processingabilities (see Horn, 1976, for an alternative view). Historically, there have also beenspeculations that increases in intellectual ability to a certain level (IQ < 120) benefit creativeperformance, whereas increases in intellectual skill beyond the threshold show no consistenteffect on creative performance (Golann, 1963; Meer & Stein, 1955; Schubert, 1973). Ourdata did not show any significant threshold or asymptotic effects for the intellectualmeasures employed with either of our samples (see Cohen & Cohen, 1983, for statisticalmethods used).
Taken together, we believe that the current results support a conceptualization of theintellectual resource for creativity that centers on insight abilities. We want to note, however,that insight processes do not necessarily form the complete set of intellectual skills forcreativity. Indeed, we have recently suggested that an ability to strategically alternatebetween divergent and convergent modes of thinking during a project and the judicious useof evaluation to monitor one's progress on a task may be relevant high-level skills (seeSternberg & Lubart, 1993). In their recent work on creative cognition, Finke, Ward, and
5 9
49
Smith (1992) have proposed other sets of cognitive skills that are involved in the generationof preinventive forms and then exploration of these ideas. Generative processes includeassociation of items in memory, synthesis and transformation of ideas, and analogicaltransfer. Exploratory processes include searching for useful attributes, shifting contextswhen interpreting preinventive forms, and searching for limitations. Some of theseprocesses, such as synthesis, analogical transfer, and searching for limitations overlap withthose that we highlight in the investment approach. The diverse set of intellectual processesmentioned in the creative cognition approach, the investment approach, and other approacheswill need to be tested more completely in future work.
Knowledge
Subjects reported three types of information: (a) educational level achieved; (b)perceived knowledge about drawing, writing, advertising design, and scientific problemsolving; and (c) the frequency of domain-related activities. The frequency data provided ameasure of familiarity for each of the task domains.
Subjects' years of education showed positive correlations of approximately .30 (p <.05) for the domains of writing, advertising, and science. Self-reported knowledge level in adomain was unrelated to creative performance, with the exception was advertisingknowledge, which correlated .35 (p < .05) with creative performance on the advertising task.In contrast to self-reported knowledge level, the frequency-familiarity measures showedsome strong positive relationships to creative performance. Frequency of writing, forexample, correlated .45 (p < .01) with writing performance. Writing frequency alsocorrelated with advertising performance (r = .33, p < .05). This domain generality wasexpected because knowledge is often relevant to more than one specific task. In thescientific domain, social problem-solving frequency (r = .51, p < .001) was more importantthan formal scientific activity levels (r = .08, n.s.). Given that the scientific problems usedin this study involved social rather than laboratory settings, the stronger correlation withsocial problem solving was reasonable.
An overall knowledge score was formed from a composite of education, knowledgelevel, and frequency reports. This overall score showed moderate correlations to creativeperformance (see Table 3.2) and is used in the analysis for a confluence of resources. Fourdomain-specific knowledge scores were also analyzed. The pattern of results for eachdomain when using domain-specific versus overall scores was very similar. We view theoverall knowledge score as more useful, however, because there is relevance and value ofknowledge from outside domains (e.g., writing and drawing) to a target domain (e.g.,advertising).
Intellectual Styles
For overall creative performance, a higher level of creativity was associated withlower levels on the executive (r = -.35, p < .05), conservative (r = -.40, p < .01), andmonarchic styles (r = -.28, p < .10). This correlational pattern was consistent across taskdomains and is theoretically meaningful; a preference for conservative, rule-followingbehavior is antithetical to creativity. The correlations for the liberal and local styles withcreative performance were in the predicted direction but did not reach significance. Thelegislative (r = -.02, n.s.) and global styles (r = -.35, p < .05) did not relate to creativeperformance as predicted. For purposes of testing the role of the intellectual-styles resourcein the confluence analyses, a combined score was created using executive, conservative, andmonarchic styles. As expected, this combined score for the intellectual-styles resourceshows negative correlations with creative performance and negative correlations with theother resources (see Tables 3.2 and 3.3).
C

50
Table 3.3
Intercorrelations of Resources (N = 48)
IP K IS
Intellectual Processes .25 -.44** .22 .57***Knowledge -.32* .68*** .09Intellectual Styles -.51**Personality .18
aMotivation
*p < =.05. ** p < .01. *** p < .001.
aMotivation is expressed as a combined score containing negative linear and negativequadratic (inverted-U) trends.
For the Myers-Briggs inventory, the only significant correlation involved thesensing-intuition style. Sensing types tend to be reality oriented, to prefer mles, and toemphasize facts and precision. Intuitive types are the opposite. They concentrate oninferences, meanings, and hidden patterns. A preference for an intuitive style as opposed tothe sensing style was significantly correlated with creative performance in the writing (r =.33, p < .05), advertising (r = .34, p < .05), and overall domains (r = .39, p < .05). Thisresult corresponds to previous studies on the relationship of the Myers-Briggs inventory tocreative performance (Myers & McCaulley, 1985). Furthermore, the negative role of thesensing type offers convergent evidence for the negative roles that Sternberg's executive andconservative styles displayed.
In summary, the original conceptualization of the intellectual-styles resource waspartially supported. Perhaps the executive, conservative, and monarchic styles aredetrimental to creativity in general while the global and legislative styles are beneficial tocreativity only when the problem-finding phase of creative work is emphasized.
Personality
The five personality dimensions hypothesized as relevant to creativity are toleranceof ambiguity, perseverance, desire to grow, willingness to take risk, and individuality with asupporting courage of one's convictions. Based on the content of the ACL and PRF scales,relevant scores from the Personality Research Form and the Adjective Check List werestandardized and then combined to form five new, reliable theory-based scales.3 An overallpersonality resource measure was also formed by linear combination of the fivetheoretically-based scales.
3 The theory-based personality scores were formed from standardized scores as follows: Tolerance ofambiguity = -1(PRF cognitive structure + PRF order + ACL order ), reliability = .91; Perseverance = (PRFendurance + ACL endurance), reliability = .85; Desire to grow = (PRF change + PRF achievement + PRFsentience + PRF understanding + ACL change + ACL achievement), reliability = .82; Willingness to takerisk = -1( PRF harm avoidance + ACL self-control), reliability = .86; Individuality = (PRF autonomy +PRF dominance + ACL autonomy + ACL dominance + ACL self-confidence), reliability = .89. Reliabilityof the theory-based scales was computed following Nunnally (1967) and used established inter-itemreliabilities for each of the ACL and PRF scales.
61

51
The correlations between personality dimensions and creative performance wererelatively consistent across task domains. Tolerance of ambiguity correlated .19 (n.s.) withoverall creative performance, willingness to take risk correlated .25 (p < .10), individualitycorrelated .26 (p < .10), and desire to grow correlated .39 (p < .01). Due, perhaps, to theshort-term nature of our study, perseverance was unrelated to creativity on our tasks. Ingeneral, the influence of personality on a project probably accrues over time, leadingcorrelations of the personality resource with creative performance duringa brief task tounderestimate the influence of the resource (see Abelson, 1985). The combined personalityresource measure correlated .25 (p < .10) with drawing creativity, .25 (p < .10) with writingcreativity, .26 (p < .10) with advertising creativity, .32 (p < .05) with scientific creativity, and.36 (p < .05) with overall creative performance.
Motivation
The self-report motivational questionnaire assessed a variety of "intrinsic" and"extrinsic" motivators in the drawing, writing, advertising, scientific, and general-lifedomains. The mean response on the 7-point scale for the strength of each motivator wasapproximately 4.0 with a standard deviation of approximately two points. Intrinsic,extrinsic, and comprehensive motivation scales for the drawing, writing, advertising, andscience domains showed a pattern of significant positive correlations with the general-lifescales. For the current sample, self-reported motivation in the specific domains studieddoes not appear to be highly differentiated from self-reported motivation for activities ingeneral. Furthermore, the domain-specific scores did not provide independent contributionsbeyond the general-life motivation scores in any of the analyses to be reported. Resultsinvolving intrinsic, extrinsic, and comprehensive general-life motivation scales, therefore, areour focus.
The intrinsic, extrinsic, or comprehensive motivation scales did not show anysignificant linear relation to creative performance. However, as predicted, meaningfulinverted-U relationships did occur; there was an optimal level for general motivation(comprehensive scale) beyond which additional motivation was negatively related to creativeperformance. Curvilinear trends were assessed by statistical tests following Cohen andCohen's (1983) procedures. Hierarchical regressions showed a significant negativequadratic (inverted-U) trend for the writing, advertising, science, and overall creativeperformance analyses.4 In the drawing domain, the quadratic trend was negative butnonsignificant. The incremental variance (AR2 ) explained by the quadratic motivation trendin each domain was .04 (n.s.) for drawing, .15 (p < .01) for writing, .40 (p < .001) foradvertising, .11 (p < .05) for science, and .28 (p < .001) for the overall analysis.
Further supporting the investment framework's conception of the motivationalresource, both intrinsic (relaxation, self-expression, gaining insights, enjoying order in aproduct, personal challenge, and enjoying a sense of accomplishment) and extrinsicmotivation scales (earn money, desire to impress others, fulfill external expectations, andobtain a future job) showed significant inverted-U relationships to overall creativity. Thisresult suggests that different types of motivators (intrinsic, extrinsic) are not themselvesinherently good or bad for creative work. Rather, there appears to be an optimal level ofmotivation, beyond which a person might become too goal-focused to concentrateon thecreative work itself.
4Full regressions containing linear and quadratic terms were used to follow-up the hierarchicalregression
results (Cohen & Cohen, 1983). Across domains, the linear and quadratic components had significantnegative Beta weights with approximately the same magnitude. The resultant equation (y=-x-x2) producesan inverted-U function with creative performance scores (y) increasing until a moderate level of motivaticin(x) is reached. After this point, higher levels of motivation lead to a rapid decline in creative performance.
62

52
In terms of the confluence analyses, a combined score containing negative linear andnegative quadratic (inverted-U) trends was used to represent the motivational resource (seeTable 3.2); the linear and quadratic terms from the comprehensive, general-life motivationscale were standardized first and then given equal weight in the new combination score. Onthis new motivation-resource score, subjects with intermediate levels of motivation receivehigh scores and subjects with very low or very high levels of motivation receive low scores.Thus, scores on the new motivation-resource variable are expected to correlate in a positive,linear fashion with creative performance; the motivational resource exhibited thesecorrelations with creative performance (see Table 3.2).
- The Creative Motivation Scale (Torrance, in press), another measure of intrinsicmotivation used in the present study, correlated .38 (p < .01) with the intrinsic motivationscore in the general-life domain, -.06 (n.s.) with the extrinsic motivation score, and .23 (n.s.)with the comprehensive motivation score. These results offer some validation for theintrinsic items on the motivation questionnthre constructed for this study. The CreativeMotivation Scale, however, showed no significant linear or quadratic relationships withcreative performance. Examination of the Creative Motivation Scale suggests that severalitems measure personality characteristics, such as perseverance, curiosity, and willingness togrow. The heterogeneity of the item content probably affected the scale's correlations withcreative performance and our own motivation measure. In general, regarding the motivationresults we want to note that our fmdings contrast with Amabile's (1983) fmdings, whichsuggest a positive, linear relationship between intrinsic motivation and creativity. The issueof task-focused and goal-focused motivation for creativity needs to be studied further andthe current fmdings need to replicated.
A Developmental Trend
An influence of the social environment may have occurred through the raterstheevaluative component of the environment. In the advertising domain, age was positivelyrelated to creative performance through 30 years, at which point the relationship turnednegative. A hierarchical regression for the advertising domain showed that there was anonsignificant linear trend, F <1, and a significant quadratic trend, F(2,45) = 3.30, MSc =.48, p < .05, R2 = .13. These trends might have been the result of generational differences increativity standards; as the producer moves away in age from the rater, the two mayincreasingly differ on their standards for novelty and creativity. For example, a 65-year-oldsubject might have produced an advertisement that she considered creative; a 30-year-oldrater might have regarded this product as out-dated. In fact, the work judged as mostcreative was produced by subjects who were approximately ten years younger than theaverage age of the raters.
The generational-differences explanation for the negative age trends in theadvertising domain fits with the notion that within certain fields the type of work that isconsidered creative changes rapidly over time. For example, the characteristics of creativework in the literary domain may shift more slowly than the views of creative work inadvertising. An alternative explanation of the inverted-U age effects through age decrementsin intellectual processes (r = -.17, n.s.), a more conservative and executive style (r = .14,n.s.), less tolerance of ambiguity (r = -.46, p < .001), or less willingness to take risks (r =-.47, p < .001) seems less plausible because of the domain specificity of the age results.We are currently investigating these age effects further.
63
53
Testing the Confluence of Resources
The investment approach predicts that high levels of creativity emerge from aninteractive combination of the resources. The composite scores created for each resourcewere used as predictors for creative performance. Zero-order correlations of each predictorwith the creativity criterion variables are presented in Table 3.2. In general, intellectualprocesses and then knowledge and motivation show the highest correlations. Intellectualstyles and personality show some significant relationships to creative performance but thereis more variability across domains.
The intercorrelations of the resource variables ranged in absolute value from .09(n.s.) to .68 (p < .001) (see Table 3.3). All the correlations between resources were positiveexcept for correlations with the intellectual-styles resource, which, as explained above, werenegative. The intercorrelations support the idea of a "creativity syndrome"thedeterminants of creativity seem to co-occur to a moderate extent (see Mumford &Gustafson, 1988).
Multiple regressions of creative performance on the five measured resources provideevidence that the resources, although related, make some independent (unique) contributionsto creative performance. Forward-selection, backward-selection, and full regressionprocedures all lead to virtually identical results; the results for the full regression procedureare discussed.
In the drawing domain model, only the intellectual processes resource accounted fora significant portion of unique variability (JJ = .55, p < .01), (F(5,42) = 4.96, MSe = .36, p <.01, R2= .37). For the writing domain, intellectual processes again bore a strongrelationship to performance (/3 = .53, p < .01). Knowledge showed a weight of .36 (p <.05). We also found a significant linear interaction of intellectual processes and knowledgefor the writing domain (J3 = .29, p < .05). This interaction showed that a high level of bothresources was especially beneficial. Inclusion of the interaction term increased the writingvariance explained from .40 for 5 resource equation to .48, (F(6,41) = 6.33, MSe = .39, p <.001).
The results for the advertising domain suggest that the resources may receivedomain-specific emphases. The resources with significant weights in the advertising modelwere motivation (ii = .49, p < .001), intellectual styles (fi = -.35, p < .05), and knowledge (/3= .32, p < .05), (F(5, 42) = 9.72, MSe = .27, p < .001, R2= .53). The negative beta weightfor intellectual styles indicates that as the proclivity toward executive, conservative, andmonarchic styles increased, creative performance decreased.
The science domain results and overall (multiple domain) performance analysesreturn us to the relevance of the intellectual processes resource in terms of uniquepredictors. For science, the intellectual resource had a significant regression weight (,8 =.56, p < .001) and the knowledge resource parameter (ft = .24) was marginal, F(5,42) = 6.69,MSc = .33, p < .001, R2= .44). For overall performance, intellectual processes (/3 = .57 , p <.001) and knowledge (ft = .36, p <.001) were significant and motivation showed amarginally significant parameter (ft = .19, p < .10), (F(5,42) = 18.41, MSe = .11, p < .001, R2= .69). In closing this section on the confluence results, we note that all of the regressionresults should be viewed as tentative and remain to be replicated.
4

54
Study 2: Cognitive Risk-Taking and Creative Performance
We conducted a second study to focus on the notion of "buying low" and takingrisks for creative performance. The fmancial market illustrates the "rules" of risk-taking ina monetary domain. Investment in a long-standing company with a record of slow growthinvolves less risk than investment in a new company that promises fast growth. The newcompany is unproven, and while the opportunity for larger profits exists, there is alsoincreased uncertainty that the profit will materialize. Investors may choose to "buy low" andrisk their money on the unproven company, hoping for the big payoff or to "buy high,"choose an established firm, and be relatively sure of small profits.
Analogous to the fmancial world, most endeavors offer more and less riskyalternatives; in any domain, "buying low" involves taking risks. For creative work, the riskstend to be intellectual ones (which carry social and monetary ramifications). An artist, forexample, may choose between several projects. Within each project, there may be furtheroptions for topics, topic development, materials, and style. Typically,.the choices at eachstep fall into two risk-payoff options. One option can be labeled "low risk-low payoff'because a high probability of success is usually associated with following a well-wornproblem-solving path. The other option, "high risk-high payoff," offers a chance of greatsuccess but the path is treacherous and less traveled.
Willingness to take risk, a personality trait, guides the problem-solving route that aperson will pursue. Risk-taking influences whether cognitive abilities, such as insightprocesses, will be applicable during problem solving or unnecessary because a routine pathis being pursued. Thus risk-taking can be viewed as one of the keys to creativeperformance because risk-taking opens opportunities for creativity-relevant cognitiveresources to be utilized.
In a variety of contexts (general decision-making, business, and school), studiesshow that people tend to avoid risks, preferring the low risk-low payoff option (Clifford,1988; Dreman, 1977; Kahneman & Tversky, 1982; MacCrimmon & Wehrung, 1985).People follow the proverb: A bird in hand is worth two in the bush. The investmentapproach suggests that this general aversion to risk partially accounts for the infrequency ofcreative performance. Although "buying low" and taking risk does not guarantee thatcreative performance will occur, "buying high" basically guarantees that it will not.
Two studies offer preliminary support of the risk-takingcreative performance linkthat we have been developing. Eisenman (1987) presented 200 adult subjects with a contestsituation and found that selection of the high risk-high payoff option was related to highperformance both on a measure of creative attitudes and on a divergent thinking test (r = .34to r = .37, p < .01). Glover (1977) induced risk-taking in college students through groupdiscussions of risky decision-making situations. Compared with control subjects, the risk-induced subjects showed higher originality and flexibility scores on the Torrance Tests ofCreative Thinking (p < .01). Our study builds on this work and uses multiple assessmentsof risk-payoff preferences and multiple domains of creative performance.
Method
Forty-four subjects from the New Haven area (22 males, 22 females) with anaverage age of 32.37 years (SD = 13.13, range: 18-67) completed four kinds of tasks. Themeasures were (a) creativity tasks, (b) cognitive tests of intellectual ability, (c) risk-takingcontests, and (d) self-report measures of risk-taking, personality, and biographicalinformation.

55
For creativity measures, drawing and writing tasks from our first study, describedearlier, were used. The cognitive tests consisted of the Cattell Culture Fair Test ofg, Scale3, Form A (Cattell & Cattell, 1963), for fluid intelligence and the Extended RangeVocabulary Test, Scale V-3 (French, Ekstrom, & Price, 1963) for crystallized intelligence.
Two contests provided behavioral measures of risk-taking. Subjects were given theopportunity to enter their drawing in one contest and their short story in another contest.Each contest established two "pools" of work from which the best entries would be selected.One pool was described as high risk and high payoff. In this pool, there was one winner of$25. The other pool involved lower risk and lower payoff, with five winners of $10 each.The instructions allowed subjects to enter one pool for the drawing contest and a differentpool for the writing contest, if they desired. Based on our judges' ratings, prizes wereawarded at the conclusion of the study.
The self-report questionnaires measured propensity toward risk-taking in averydifferent way. Three choice-dilemma questionnaires assessed risk-taking in the drawing,writing, and general-life domains. The general-life questionnaire was an updated version ofKogan and Wallach's (1964) original instrument; gender-specific language and somefactual details were revised. The drawing and writing questionnaires were constructed forthis study as domain-specific forms of Kogan and Wallach's questionnaire.
Each questionnaire contained twelve hypothetical situations. Subjects were asked toimagine themselves in the situations. Each scenario presented a choice between two coursesof action: (a) a high risk, potentially high-payoff alternative, and (b) a low risk, low-payoffalternative. Subjects selected the minimum odds of success that they would require beforepursuing the high-risk option. A sample scenario from the drawing-domain questionnairefollows:
You are a potter, making a large vase to be displayed at a pottery craft show. Youhope to receive recognition in the pottery guild's magazine that will be doing afeature story on the show. You have two ideas for a vase. Idea A would use apotter's wheel to form a vase with smooth contours that are pleasing to look at. Youknow that several other potters at the show use the same method but you feelconfident that you will receive a little recognition for technical skill in your vase.Idea B would use a hand coil method in which you roll clay into strips and piece thestrips together. This method yields an unusual primitive vase. The magazine editorsmay feature your coil vase because of its uniqueness or they may not even mentionit because it could be seen as too far out of the mainstream. Listed below are severalprobabilities or odds that the coil vase (idea B) will turn out successfully. Pleasecheck the lowest probability that you would consider acceptable to make itworthwhile to pursue the coil vase.
The possible odds for success were: 1 in 10, 3 in 10, 5 in 10, 7 in 10, or 9 in 10. Asubject could also refuse the risky alternative "no matter what the probabilities" and thenwould receive a score of 10 out of 10 for that scenario. The questionnaire reliabilities wereadequate (.74 to .78). The scores are reflected (multiplied by -1) to maintain consistencywith other risk measures. High (reflected) scores on these choice-dilemma questionnairestherefore indicate risk-taking.
Risk-taking was further assessed with items on the biographical questionnaire.Subjects used a 7-point scale to describe their risk tendencies in drawing and writing for theoverall task, topic selection, topic development, and materials and style used. Subjects werealso asked if they would describe themselves as a high or low risk-taker in the drawing andwriting domains.

56
Another portion of the biographical questionnaire provided a brief assessment ofeducational history, knowledge-level, activities and interests in the domains studied, andpersonality-motivational tendencies. The Adjective Check List (Gough & Heilbrun, 1983)also measured personality characteristics. On the final portion of the biographicalquestionnaire, subjects judged the creativity of their own products using 7-point responsescales.
Subjects were tested individually during a three-hour session. The drawing andwriting tasks were administered first, followed by the choice-dilemma questionnaires, theAdjective Check List, biographical questionnaire, Gauen Culture Fair Test of g, andExtended Range Vocabulary Test. Subjects chose a contest group in which to enter theirwork either at the start of the session before they worked on the creativity tasks or at thevery end, after finishing the creativity tasks. We therefore manipulated the timing of thecontest decision.
A separate group of 15 New Haven subjects (8 males, 7 females; m age = 31.73, SD= 6.83, range: 22-45) judged the creativity of the drawing and writing work with goodinterrater reliability.
Results and Discussion
Aspects of Cognitive Risk-Taking
In accord with previous research, people were relatively risk-avoidant. In thedrawing contest, 32 of the subjects chose the low risk-low payoff option, in contrast to 12who chose the high risk-high payoff alternative. In the writing contest, 29 subjects selectedthe low risk and 15 selected the high risk. In both cases, the bias toward lower risk wassignificant (p < .05). On the hypothetical scenario measures, subjects were slightly riskaverse. For each questionnaire where low scores (-120) indicate risk aversion, the meanscores were -64.14 (SD = 19.85) for drawing scenarios, -60.61 (SD = 19.14) for writingscenarios, and -71.77 (SD = 19.19) for general-life scenarios. Subjects also describedthemselves as somewhat risk-averse on the self-report items. On a 7-point scale with lowscores indicating risk aversion, the mean response was 3.06 (SD = 1.77) for the drawingdomain and 3.64 (SD = 1.78) for the writing domain.
The tests of intelligence as well as years of education were essentially unrelated torisk-taking. However, self-reported levels of knowledge for drawing and writing correlatedwith self-reported risk taking in the respective domains (drawing: r = .48, p < .01; writing:r = .33, p < .05). Similarly, the frequency with which a subject engaged in drawing orwriting activities and liked these activities correlated moderately with domain-specific risk-taking on contest, hypothetical scenario, and self-report measures (median r = .31, p < .05).Scores on the self-confidence, desire for change, and the creative personality scales from theAdjective Check List were moderately related to risk-taking on the hypothetical scenariomeasures.
As mentioned in the procedure section, we varied whether subjects had to choosetheir contest option (high or low risk) before beginning their drawings and short stories orafter finishing them. The manipulation had no measurable effect on the level of risk-takingor the relationship between risk-taking and creative performance. This null finding suggeststhat risk-taking does not depend especially on the producer looking at the fmal product andjudging whether it is good enough to enter into a high-risk contest. We suggest that risk-taking is a personality trait that develops and is influenced by prior experiences in a domain.Early, successful experiences increase self confidence and the tendency for risk-taking. Theresults, described below, that link creative performance with risk-taking in hypotheticalscenarios (different from our creative performance tasks) further support the idea that risk-
67
57
taking is not simply a pragmatic choice once a product has been completed, but ratherapervasive tendency that can influence each step of problem solving.
Risk-Taking and Creative Performance
The main question of interest is whether higher levels of risk-takingare associatedwith higher levels of creative performance. For the drawing contest, subjects choosing thehigh risk-high payoff option showed a mean creativity score of 4.21 (SD = .99) whereassubjects choosing the low risk-low payoff option showed a mean score of 3.90 (SD = .75).Although this result did not reach significance, a follow-up analysis using creativity ratingsfrom three graduate-student judges with artistic background showed stronger results. Thehigh-risk group received a mean creativity score of 4.36 (SD = 1.98) and the low riskgroup's mean score was 2.86 (SD = 1.57), t(42) = 2.62, p < .05. The "artistic" judges alsoshowed high reliability (alpha = .83).
The scenario-based measures of risk-taking supported a connection between risk-taking and creativity. Risk-taking on the drawing scenarios correlated significantly withdrawing creativity (r = .39, p < .01). A multiple regression of the drawing, writing, andgeneral-life scenario scores on creative performance in the drawing task tested for domainspecificity between risk-taking and creativity, (F(3,40) = 3.91, MSe = .56, p < .05, R2= .23).The drawing scenario measure was the best predictor (fl = .54, p < .05). The general-lifescenario measure acted as a suppressor effect, enhancing the domain specific nature of thedrawing risk measure (/3 = -.38, p < .06). Further supporting domain specificity, the writingscenario measure showed a non-significant weight in the equation.
In contrast to the situational scenario and behavioral contest measures of risk, self-report items showed little relationship to creative performance. Only one item that assessed"overall" risk-taking on drawings related to creative performance (r = .34, p < .05).
In summary, we found some support for the hypothesized link between risk-takingand creative performance in the drawing domain. The drawing scenario measure of risk-taking showed this relationship most clearly. In the writing domain no significant resultswere obtained. However, examination of the writings produced by subjects who scored inthe top 20 percent and bottom 20 percent on the writing risk scenario measure suggested aninteresting trend: We believed the stories of the high risk-takers to be more unconventionalthan those of the low risk-takers. We had three additional peer judges rateunconventionality and found a significant difference in the ratings for high risk-takers (m =4.00, SD = .75) versus low-risk takers (m = 3.11, SD = .85), t(16) = 2.36, p < .05.
An investigation of the stories suggests that the unconventional stories did notreceive high creativity ratings, on average, because of the controversial issues with which thestories dealt. For example, one high-risk-taking subject chose "It's moving backward" as atitle and offered a negative view of American politics. In this case, as well as others, the riskdid not pay off with respect to the judges. Perhaps our judges had a narrower view of whatconstitutes a creative short story compared to a creative drawing, so the range of risk-takingthat could lead to an acceptable product was limited.
Conclusions
The current results provide initial support for the investment approach but alsosuggest revisions and areas for further research. The basic conceptualization of theintellectual processes, knowledge, and personality resource were supported by the results;

58
these results also support and extend earlier theoretical and empirical work (e.g. Amabile,1983; MacKinnon, 1962, 1965; McClelland, 1956). The intellectual styles resource did notoperate completely as expected. Executive, conservative, and monarchic styles werenegatively related to creative performance but the legislative and global styles did notpromote creative work. These fmdings may be due to the semi-structured nature of ourcreativity assessments. In any case, the intellectual styles resource requires further studyand possible revision. Finally, the motivational resource showed an inverted-U relationshipto creative performance, which is consistent with our task-focused versus goal-focuseddistinction.
In terms of the relative importance and confluence of resources, several promisingresults were also obtained. First, creative performance was most related to the intellectualprocesses resource. This result is sensible because the creative performance measuresinvolved short-term, timed tasks. We noted earlier that certain resources such as personalitymay show their importance in long-term projects rather than short-term tasks. Second,regression analyses showed significant involvements for.multiple resources. For example,the analysis of overall creative performance showed that intellectual processes, knowledge,and motivation accounted for unique portions of variance. Third, the creative performancemeasures and the confluence analyses addressed the issue of domain specificity. Forexample, the motivation and intellectual styles resources received emphasis in the advertisingdomain. And, an interaction between intellectual processes and knowledge was observed asspecific to the writing domain. Together, these results demonstrate the utility of amultivariate approach to creative performance.
At a general level, the results are congruent with many recent proposals that suggestthe need for a convergence of cognitive and conative elements for creativity (see Amabile,1983; Arieti, 1976; Barron, 1988; Csikszentmihalyi, 1988; Feldman, 1988; Gardner, 1988;Gruber, 1981; Mumford & Gustafson, 1988; Simonton, 1988). For example, Amabile(1983) describes creativity as a result of domain-relevant skills (knowledge and abilities),creativity-relevant skills (styles, personality traits, and idea-generation heuristics), andmotivation (primarily intrinsic motivation). High levels of these components must co-occurin an appropriate environment to yield high levels of creative performance. Portions of thecurrent results can be seen as supportive of both Amabile's model and the investmentapproach.
At this time a rigorous test between various confluence theories of creativity is notpossible for two reasons. First, confluence theories need to become more specific than theyare at present. We acknowledge that the investment approach must move toward greaterspecificity. The current results suggest that domain and task variables are important fordetermining the nature of a resource confluence for creativity. Second, studies need to testboth competing theories' concepts of the resources for creativity and these theories' conceptsof the confluence of resources. It is possible that empirical support for a specific resourceconfluence will depend on the specification of the resources involved.
Next, we can consider the investment concept of "buying low and selling high." Theresults of the study on cognitive risk-taking provide some support for the benefits of"buying low," but we want to note that the test of the investment metaphor was limited. Ingeneral, the investment approach is part of an emerging economic perspective on creativity.Contributing to this perspective, for example, Rubenson and Runco (1992) propose anaccount of societal levels of creativity using the concepts of supply and demand. Theyapply cost-benefit analysis to people's decisions to actively seek creativity training. Also,Walberg (1988) has emphasized society's need to develop "human capital," the "knowledge,skills, and talents" necessary for creative work.
6 9

59
The investment approach and the new economic perspective on creativity offer manyavenues for research. The investment approach, specifically, still remains to be tested (a)over longer periods of time using significant work produced prior to the investigation, (b)using more eminent samples, and (c) using samples with broader distributions on theresources to better test the confluence hypotheses. Also, the measurement of the resourcesneeds to be improved, the direct effects of the environment need to be assessed, and therelationship between risk-taking and creative performance needs to be studiedmorecompletely.
Finally, the investment approach and the creative-cognition approach can benefit bydrawing connections between each other. For example, creative-cognition research hasattempted to analyze problem tasks and specify the particular generative processes,preinventive structures, and exploratory processes that are employed in each task. Theinvestment approach needs to move toward this type of specific modeling. Also, theinvestment approach needs to be linked to a process model of creative problem solving.This process model may be a general one that covers problem solving in a wide range ofdomains, such as the generation-exploration model of Finke, Ward, and Smith (1992).Alternatively, domain-specific process models may be necessary. Within each task'sprocess model, we would want to specify the points where various intellectual processes aremost active, when and how knowledge is utilized, and whether intellectual styles, personality,motivation, or environmental resources influence specific portions of the process or act ingeneral ways. For example, insight processes and tolerance of ambiguity may be especiallyimportant during the initial conception of a project whereas solution monitoring andperseverance may be most important in the later stages of a project.
Our work with the investment approach also suggests new directions for creativecognition research. First, work on creative cognition may consider how a general strategy,such as attempting to buy low and sell high, could pervade creative work and influenceactions at each problem-solving step. Second, creative cognition research may consider theimpact of non-cognitive (personality, motivational, and environmental variables) on theeffectiveness and use of cognitive processes. Third, creative cognition research mayinvestigate whether beneficial interactions occur when certain generative processes are usedtogether with particular exploratory processes or preinventive structures.
In conclusion, the results provide initial support for many aspects of the investmentapproach's person-centered resources for creativityintellectual processes, knowledge,intellectual styles, personality, and motivation. The results also demonstrate the relativeimportance of cognitive resources, show beneficial effects from a partial confluence of theperson-centered resources, and show a partial link between buying low and creativeperformance. We suggest that the investment approach offers a framework with whichprevious work can be integrated and the current results can be understood. The investmentapproach also offers a base from which future links can be developed to other multivariateapproaches, other economic-based approaches, and work in the creative-cognition approach.
70
61
References
Abelson, R. P. (1985). A variance explanation paradox: When a little is a lot.Psychological Bulletin, 97(1), 129-133.
Albert, R. S. (1983). Toward a behavioral defmition of genius. In R. S. Albert,(Ed.), Genius and eminence: The social psychology of creativity and exceptionalachievement (pp. 57-72). New York: Pergamon Press.
Amabile, T. M. (1982). Social psychology of creativity: A consensual assessmenttechnique. Journal of Personality and Social Psychology, 43(5), 997-1013.
Amabile, T. M. (1983). The social psychology of creativity. New York: Springer-Verlag.
Amabile, T. M. (1985). Motivation and creativity: Effects of motivational orientationon creative writers. Journal of Personality and Social Psychology, 48(2), 393-399.
Arieti, S. (1976). Creativity, the magic synthesis. New York: Basic Books.
Barron, F. (1988). Putting creativity to work. In R. J. Sternberg, (Ed.), The natureof creativity (pp. 76-98). New York: Cambridge University Press.
Barron, F., & Harrington, D. M. (1981). Creativity, intelligence, and personality.Annual Review of Psychology, 32, 439-476.
Cantor, N., & Mischel, W. (1979). Prototypes in person perception. In L.Berkowitz (Ed.), Advances in experimental social psychology (Vol. 12, pp. 4-52). NewYork: Academic Press.
Cattell, R. B., & Cattell, A. K. (1963). Test of g: Culture fair, scale 3.Champaign, IL: Institute for Personality and Ability Testing.
Clifford, M. M. (1988). Failure tolerance and acadeinic risk taking in ten- totwelve-year-old students. British Journal of Educational Psychology, 58(1), 15-27.
Cohen, J., & Cohen, P. (1983). Applied multiple regression/correlation analysisfor the behavioral sciences (2nd ed.). Hillsdale, NJ: Lawrence Erlbaum.
Crutchfield, R. (1962). Conformity and creative thinking. In H. Gruber, G. Terrell,& M. Wertheimer (Eds.), Contemporary approaches to creative thinking (pp. 120-140).New York: Atherton Press.
Csikszentmihalyi, M. (1988). Society, culture, and person: A systems view ofcreativity. In R. J. Sternberg (Ed.), The nature of creativity (pp. 325-339). New York:Cambridge University Press.
Davidson, J. E., & Sternberg, R. J. (1984). The role of insight in intellectualgiftedness. Gifted Child Quarterly, 28, 58-64.
Dellas, M., & Gaier, E. L. (1970). Identification of creativity: The individual.Psychological Bulletin, 73, 55-73.
7 1
62
Dreman, D. (1977). Psychology and the stock market. New York: Amacom.
Dreman, D. (1982). The new contrarian investment strategy. New York: RandomHouse.
Eisenman, R. (1987). Creativity, birth order, and risk taking. Bulletin of thePsychonomic Society, 25, 87-88.
Feldman, D. H. (1988). Creativity: Dreams, insights, and transformations. In R. J.Sternberg (Ed.), The nature of creativity (pp. 271-297). New York: Cambridge UniversityPress.
Finke, R. A., Ward, T. B., & Smith, S. M. (1992). Creative cognition: Theory,research, and applications. Cambridge, MA: MIT Press.
French, J. W., Ekstrom, R. B., & Price, I. A. (1963). Kit of reference tests forcognitive factors. Princeton, NJ: Educational Testing Service.
Frensch, P. A., & Sternberg, R. J. (1989). Expertise and intelligent thinking:When is it worse to know better? In R. J. Sternberg (Ed.), Advances in the psychology ofhuman intelligence (Vol. 5, pp. 157-188). Hillsdale, NJ: Erlbaum.
Gardner, H. (1988). Creative lives and creative works: A synthetic scientificapproach. In R. J. Sternberg (Ed.), The nature of creativity (pp. 298-321). New York:Cambridge University Press.
Getzels, J., & Csikszentmihalyi, M. (1976). The creative vision: A longitudinalstudy of problem-finding in art. New York: Wiley-Interscience.
Glover, J. A. (1977). Risky shift and creativity. Social Behavior and Personality,5, 317-320.
Golann, S. E. (1962). The creativity motive. Journal of Personality, 30, 588-600.
Golann, S. E. (1963). Psychological study of creativity. Psychological Bulletin,60(6), 548-565.
Golden, C. J. (1975). A group version of the Stroop Color and Word Test.Journal of Personality Assessment, 39(4), 386-388.
Gough, H. G., & Heilbrun, A. B. (1983). The Adjective Check List manual. PaloAlto, CA: Consulting Psychologists Press.
Gruber, H. (1981). Darwin on man: A psychological study of scientific creativity(2nd ed.). Chicago: University of Chicago Press. (Original work published 1974).
Hill, K. (1990). An ecological approach to creativity and motivation: Trait andenvironment influences in the college classroom. Unpublished doctoral dissertation,Brandeis University, Waltham, MA.
Horn, J. L. (1976). Human abilities: A review of research and theory in the early1970s. Annual Review of Psychology, 27, 437-485.
72
63
Jackson, D. N. (1984). Personality Research Form manual (3rd ed.). Port Huron,MI: Research Psychologists Press.
Jackson, P., & Messick, S. (1965). The person, the product, and the response:Conceptual problems in the assessment of creativity. Journal of Personality, 33, 309-329.
Kahneman, D., & Tversky, A. (1982). The psychology of preferences. ScientificAmerican, 246(1), 160-173.
Kogan, N., & Wallach, M. A. (1964). Risk taking: A study in cognition andpersonality. New York: Holt, Rinehart, and Winston.
Langer, E. J. (1989). Mindfulness. New York: Addison-Wesley.
Lubart, T. I. (1990). Creativity and cross-cultural variation. InternationalJournalof Psychology, 25, 39-59.
MacCrimmon, K. R., & Wehrung, D. A. (1985). A portfolio of risk measures.Theory and Decision, 19(1), 1-29.
MacKinnon, D. W. (1962).Psychologist, 17, 484-495.
MacKinnon, D. W. (1965).American Psychologist, 20, 273-28
The nature and nurture of creative talent. American
Personality and the realization of creative potential.1.
Martin, M. C. (1988). Mind as mental self-government: Construct validation ofatheory of intellectual styles. Unpublished master's thesis, Yale University, New Haven, CT.
McClelland, D. C. (1956). The calculated risk: An aspect of scientificperformance. In C. W. Taylor (Ed.), The 1955 University of Utah research conference onthe identification of creative scientific talent (pp. 96-110). Salt Lake City, UT: Universityof Utah Press.
Meer, B., & Stein, M. I. (1955). Measures of intelligence and creativity. Journalof Psychology, 39, 117-126.
Mumford, M. D., & Gustafson, S. B. (1988). Creativity syndrome: Integration,application, and innovation. Psychological Bulletin, 103, 27-43.
Myers, I. B., & McCaulley, M. H. (1985). Manual: A guide to the developmentand use of the Myers-Briggs Type Indicator. Palo Alto, CA: Consulting PsychologistsPress.
Nunnally, J. (1967). Psychometric theory. New York: McGraw-Hill.
Roe, A. (1952). The making of a scientist. New York: Dodd, Mead.
Rogers, C. R. (1954). Toward a theory of creativity. ETC: A Review of GeneralSemantics, 11, 249-260.
Rossman, B. B., & Horn, J. L. (1972). Cognitive, motivational and temperamentalindicants of creativity and intelligence. Journal of Educational Measurement, 9(4), 265-286.
73
64
Rubenson, D. L., & Runco, M. A. (1992). The psychoeconomic approach tocreativity. New Ideas in Psychology, 10, 131-147.
Runco, M. A. (1987). The generality of creative performance in gifted andnongifted children. Gifted Child Quarterly, 31, 121-125.
Schubert, D. S. P. (1973). Intelligence as necessary but not sufficient for creativity.Journal of Genetic Psychology, 122, 45-47.
Simonton, D. K. (1984). Genius, creativity, and leadership. Cambridge, MA:Harvard University Press.
Simonton, D. K. (1988). Creativity, leadership, and chance. In R. J. Sternberg,(Ed.), The nature of creativity (pp. 386-426). New York: Cambridge University Press.
Sternberg, R. J. (1980). Stalking the elusive homunculus: Isolating themetacomponents of intelligence. Unpublished manuscript.
Sternberg, R. J. (1985a). Beyond IQ: A triarchic theory of human intelligence.New York: Cambridge University Press.
Sternberg, R. J. (1985b). Implicit theories of intelligence, creativity, and wisdom.Journal of Personality and Social Psychology, 49, 607-627.
Sternberg, R. J. (1986). Intelligence applied: Understanding and increasing yourintellectual skills. San Diego, CA: Harcourt Brace Jovanovich.
Sternberg, R. J. (1988a). The nature of creativity: Contemporary psychologicalperspectives. New York: Cambridge University Press.
Sternberg, R. J. (1988b). Mental self-government: A theory of intellectual stylesand their development. Human Development, 31, 197-224.
Sternberg, R. J., & Lubart, T. I. (1991). An investment theory of creativity and itsdevelopment. Human Development, 34(1), 1-32.
Sternberg, R. J., & Lubart, T. I. (1992). Buy low and sell high: An investmentapproach to creativity. Current Directions in Psychological Science, 1(1), 1-5.
Sternberg, R. J., & Lubart, T. I. (1993). Creative giftedness: A multivariateinvestment approach. Gifted Child Quarterly, 37(1), 7-15.
Sternberg, R. J., & Lubart, T. I. (1995). Defying the crowd: Cultivating creativityin a culture of conformity. New York: Free Press.
Thurstone, T. G. (1962). Primary mental abilities. Chicago: Science ResearchAssociates.
Torrance, E. P. (in press). Creative Motivation Scale: Norms technical manual.Bensenville, IL: Scholastic Testing Service.
Walberg, H. J. (1988). Creativity and talent as learning. In R. J. Sternberg (Ed.),The nature of creativity (pp. 340-361). New York: Cambridge University Press.
7 4
65
PART 4: What Do We Mean by "Giftedness"?A Pentagonal Implicit Theory
Why is a child who scores in the top 1% on the Wechsler Intelligence Scale forChildren much more likely to be labeled as "gifted" than a child whose 100-meter sprintingtime places her in the top 1% of her age cohort? Why is a physicist who is consideredNumber 1 in the country by his peers or another panel of judges considered gifted, whereasthe criminal who is Number 1 on the FBI's most-wanted list is not? Why do contestants inmajor beauty contests, such as the Miss America Pageant have to answer questions aboutissues perceived to be of domestic or international importance, whereas contestants in themajor scientific competitions, such as the Westinghouse Science Talent Search, do not haveto submit to judgments of their personal attractiveness? The pentagonal implicit theory ofgiftedness (Sternberg, 1993), described herein, seeks to answer these and related questions.
The Nature of Implicit Theories
Implicit theories are not public or formal. Rather, they are intellectual constructionsthat reside in individual people's minds (Sternberg, 1985b; Sternberg, Conway, Ketron, &Bernstein, 1981). Such theories can be discovered through questions and inference, and areoften revealed by behavior. Typically, however, we do not examine our implicit theoriesclosely until questioned; we simply employ them in making our everyday judgments of theworld and of those who inhabit it. For example, we each have an implicit theory of whatconstitutes charisma, and when we meet other people, we judge them against the standardsof this unspoken construct. Similarly, we each have an implicit theory of what constitutesgiftedness.
Contrasting with implicit theories are explicit theories, the constructions ofpsychologists or other scientists that are based or at least tested, in psychology, on datacollected from people performing tasks presumed to measure psychological functioning.Explicit theories have dominated the literature on giftedness (see, for example, Sternberg &Davidson, 1986, for a collection of such theories). Theorists specify what they believe to bethe elements of giftedness, and then try to verify that their claims are psychologically oreducationally valid.
Why even bother to study implicit theories of giftedness? What difference does itmake what a layperson thinks when there are well-informed theorists who have devoted theirprofessional lives to studying and judging the problem? There are at least five reasons whyit is worthwhile to understand people's conceptions (implicit theories) of giftedness.
First, discovering such implicit theories can be useful in helping to formulate thecommon-cultural views that dominate thinking within a societywhat we mean, forexample, by "giftedness." Second, understanding implicit theories can also help usunderstand or provide bases for explicit theories, because explicit theories derive in partfrom scientists' or other researchers' implicit theories of the construct under investigation.In other words, explicit theories are themselves the result of implicit ones. Third, implicit,not explicit, theories have the most influence on actual everyday life and practices. People'sgeneralized implicit theories of giftedness, for example, determine how decisions aboutidentification are made. Fourth, if we want to "change our ways"to improve our criteriafor identifying the giftedwe need to know exactly what those ways are. Fifth, andperhaps most importantly, one might argue that in the case of giftedness, implicit theorieshave a privileged status that they do not have in the case of other constructs, such as
66
memory. Why? Because in the case of memory, there is good evidence that the construct isbased on an actual set of related biological phenomena, many of which probably take placein the hippocampus. In the case of giftedness, however, we seem to be dealing, at least inpart, with a labeling phenomenon. Consider why.
In one culture, the gifted individual might be a hunter, in another, a gatherer, and in athird, a student. The first two cultures might not even have any form of formal schooling.Giftedness, like beauty, seems to exist in the eyes of the beholder; memory does not. Justas cultural standards for beauty may vary (Duck, 1991), so may cultural standards forgiftedness. This is not to say that, within a culture, no objective criteria for giftedness can bedefined. But the criteria are determined by one's external culture, rather than by one'sinternal physiology.
In sum, implicit theories of giftedness are important, for they provide a dimension ofunderstanding that cannot be obtained through the study of explicit theories. This does notmean that explicit theories are unimportant. Rather, both kinds of theories are needed, andshould be studied in conjunction. Implicit theories provide the form or structure by whichwe defme giftedness, whereas explicit theories provide the content that is embedded withinthat form or structure.
The Pentagonal Implicit Theory of Giftedness
The goal of the pentagonal implicit theory of giftedness is to capture andsystematize people's intuitions about what makes an individual gifted. It is important tostate that, in general, implicit theories need not be "correct," in any ultimate sense. Onceupon a time, almost everyone instinctively believed that the sun revolved around the earth.Their implicit theory was wrong. To the extent that giftedness is like beauty, however, thereis no right and wrong, but only what people perceive to be better and worse, or higher andlower on some scale. The theory states that in order to be judged as gifted, a person needsto meet five criteria: (1) the excellence criterion, (2) the rarity criterion, (3) the productivitycriterion, (4) the demonstrability criterion, and (5) the value criterion.
1. The Excellence Criterion. The excellence criterion states that the individual issuperior in some dimension or set of dimensions relative to peers.
To be gifted, one has to be extremely good at somethingin psychologicalterminology, high in a judged dimension or dimensions. The qualification "relative topeers" is necessary because the designation of excellence depends upon the skills of thoseagainst whom one is judged. A 10-year-old's raw score on an intelligence test might convertinto a very high score relative to age peers, but would seem unexceptional relative to childrenfive years older. Similarly, a musical performance that would be exceptional for an 8-year-old taking weekly music lessons at school might be quite undistinguished for an 8-year-oldwho has been trained at a conservatory since age four.
2. The Rarity Criterion. The rarity criterion states that in order to be labeled asgifted, an individual must possess a high level of an attribute that is rare relative to peers.
The rarity criterion is needed to supplement the excellence criterion because aperson may show an abundance of a given attribute, but if a high evaluation of that attributeis not judged to be rare, the person is not viewed as gifted. Suppose we give a test ofmastery of the basics of the English language to a class of college seniors at a gooduniversity. They should all make high scores on the test, because all are fully proficient in
76

67
the basics of English. But even if all received perfect scores, we would not say they are alltherefore gifted. Thus, one may display excellence, but unless such excellence is rare, thatperson is not likely to be viewed as gifted.
3. The Productivity Criterion. The productivity criterion states that thedimension(s) along which the individual is evaluated as superior must lead to orpotentially lead to productivity.
Consider again the contestants in the beauty contest. Why is it that they mustanswer questions about issues of the day, rather than merely being judged solely on theirappearance? Appearance is probably the major determinant in the contest, so why is it notsufficient? Despite the fact that the contest is really about beauty, beauty in itself is notperceived as productive or potentially productive. The contestant needs to demonstrate thatshe can do something beyond just looking good. In contrast, the contestant in a scientificcompetition is not judged on other dimensions such as personal appearance, because thescientific work itselfthe basis of the contestis viewed as productive.
The productivity criterion generates disagreements over exactly who should belabeled as gifted. Some, for example, believe that a high score on an intelligence test is notsufficient grounds for labeling a person as gifted; the high-scoring person hasn't shown thathe or she can "do" anything (e.g., Gardner, 1983). To others, getting a high score on thetest is viewed as doing something in and of itself; at worst, it shows the person's potentialfor productivity.
In childhood, of course, it is possible to be labeled as gifted without having beenproductive. In fact, children are typically judged more on potential than on actualproductivity. As people get older, however, the relative weights of potential and actualizedpotential change, with more emphasis placed on actual productivity. People who do notrealize their potential through some kind of productive work may still be labeled as gifted,but with qualifications. To earn the label "gifted" without qualification, a person mustaccomplish something.
4. The Demonstrability Criterion. The demonstrability criterion states that thesuperiority of the individual on the dimension(s) which determine "giftedness" must bedemonstrable through one or more tests that are valid assessments.
The individual needs to be able to demonstrate, in one way or another, that he or shereally has the abilities or achievements which led to the judgment of "giftedness." Simplyclaiming giftedness is not enough. Thus, a person who scores poorly on all measures usedin assessment, and who is unable to demonstrate in any compelling alternative way that hedoes indeed have special abilities, will not be viewed as gifted.
The assessment instrument(s) used, however, must be valid. Validity means thateach instniment is believed to measure what it is supposed to measure. If, for example, achild presents a high score on a new intelligence test that requires only that the child dot i's,the result will not be valid. Dotting i's is not an acceptable measure of intelligence. Orsuppose that a job candidate gives a brilliant talk, suggesting unusual gifts both in researchand in presentation. But then, when asked about the content of the talk, he is unable toanswer even the simplest of questions. Members of the audience gradually conclude thatthe candidate was somehow "programmed," probably by his advisor. The job talk wouldthen be invalid as a measure of the candidate, because it did not actually reflect his gifts (orlack thereof).
77
68
The validity issue has become extremely important in recent years in theidentification of intellectually gifted schoolchildren. In the past, many schools were contentto use standardized intelligence tests, and perhaps grades in school and scores onachievement tests, as bases for identifying children as intellectually gifted. As the focus oftesting has been shifting more and more toward an emphasis on performance- and product-based assessment, however, some have questioned the validity of the traditional measures(e.g., Gardner, 1983; Renzulli, 1986). Someone who would have been labeled as giftedunder traditional measures before might not now be so labeled. The implicit theory ofgiftedness may not have changed, but what is considered valid as a demonstration ofgiftedness may have.
5. The Value Criterion. The value criterion states that for a person to be labeledas gifted, the person must show superior petformance in a dimension that is valued forthat person by his or her society.
The value criterion restricts the label of giftedness to those who hold attributes thatare valued as relevant to giftedness. The individual who is Number 1 on the FBI's mostwanted list might be superior in one or more dimensions, rare in his ability to performcertain malevolent acts, and able to demonstrate his skills upon demand. He may even behighly productivein a criminal way. But because what he is so good at is not valued bysociety at large, he is not likely to be labeled as gifted by the American populace. Still, it isquite possible that he would be labeled as gifted by a pack of thieves; the pentagonal theoryallows that what is prized as a basis for giftedness may differ from one culture or evensubculture to another.
Implicit theories by nature are relativistic; there is never any guarantee that people'spersonal values will match across time and space. But implicit theories, as noted above,provide the best practical form or stmcture by which to identify the gifted. For a judgmentto occur according to strict standards, one needs to add content to implicit theories. This isthe role of explicit theories, considered next.
The Role of Explicit Theories
Implicit theories are necessarily relativistic, because what is perceived is often time-and culture-dependent. Consider, for example, intelligence. We know from studies ofimplicit theories that what people consider to be intelligent differs across time and place(Berry, 1984; Serpell, 1974; Wober, 1974).
On the other hand, explicit theories of intelligence attempt to specify just whatintelligence is, so that whether a given person is actually intelligent (according to a givenexplicit theory) will depend upon the person's standing as measured by that theory. Notethe importance of the qualifier, "according to a given explicit theory." The judgment madeis still relative to an explicit theory, and as we know, such theories differ.
Consider, for example, two contemporary theories of intelligence, those of Gardner(1983) and of Sternberg (1985a). According to Gardner, a person of extraordinarily highmusical ability is intellectually gifted by virtue of the superiority of the musical ability.According to Sternberg, such a person is musically gifted; the person is not intellectuallygifted by virtue of the superior musical ability, although that individual might well beintellectually gifted based on further information.
7 8

69
In short, explicit theories provide defmitions of content. But we are still left with thejudgments that the explicit theory is derived from. The problem is that in the science ofunderstanding human gifts, we do not yet have certainties. There are no explicit theoriesnow known to be totally and absolutely correct, nor is that very likely in the foreseeablefuture. Nevertheless, the combination of implicit and explicit theories can help usunderstand both the structure people instinctively use for labeling others as gifted, and themore objective content (or specific scales) they use to give force to these labels.
Data
Does the pentagonal implicit theory actually capture people's intuitions aboutgiftedness? Do people really use these criteria in making their evaluations of others? Wedecided to fmd out.
Method
In the spring of 1992, we tested two groups of subjects: 24 students-12 male and12 femaleat Yale University, and 39 parents of gifted children in Connecticut. Roughlyhalf of each gender group evaluated boys; the other half girls. We gave each subject 60brief descriptions of imaginary students. Each description included the following items:
1. How the student scored nationally on a given standardized test. (Describedas "good, mediocre, excellent," etc.)
2. How this score ranked within the student's school. (Top 20%, etc.)3. How accurate the school feels the given test is in predicting gifted
performance.4. How much value the school places on a given test as a measure of
giftedness.5. The number of independent projects (prescreened for high quality) a student
submitted.6. How much value the school places on independent projects as a measure of
giftedness.
The subjects them made two evaluations. On a scale of 1-6 we asked them to rank
1. How likely they thought the school would identify this child as gifted and2. How likely they thought they personally would identify this child as
gifted.
The experiment was designed to allow use of multiple regressions to predict ratings oflikelihood of students being identified as gifted (the dependent variable) from the sixindependent variables in each description. The six independent variables, based on thepentagonal implicit theory, were:
(1) excellence (Statement 1)(2) rarity (Statement 2)(3) productivity (Statement 5)(4) demonstrability (i.e., validity) (Statement 3)(5) value (Statements 4, 6)
Thus, a significant regression weight for any criterion would indicate its use in judgments ofgiftedness.

70
Results
Overall mean ratings on the 6-point scale for the 24 student subjects were 4.26 forgirls-school rating, 4.13 for girls-self rating, 4.15 for boys-school rating, and 4.07 forboys-self rating. Mean ratings of boys and girls did not differ significantly. For the 39parent subjects, comparable means were 3.99, 4.18, 3.85, and 4.08 respectively. Of greaterinterest here, though, are the results of the multiple regressions, which are summarized inTables 4.1 and 4.2. The results are practically identical for the two samples.
Excellence, rarity, productivity, and value of the test showed statistically significantregression weights in all four multiple regressions. The weight values for the independentprojects was statistically significant in all but one regression. Patterns of weights weresimilar for evaluations of boys and of girls. Interestingly, our subjects believed that theywould take validity (demonstrability) into account in their evaluations, but that the schoolwould not. Subjects also believed that they took excellence into account more than wouldthe school, whereas the school's system of values was clearly seen as more important to theschool than it was to the subjects doing the ratings.
Overall levels of prediction were quite high, with R2 values varying from .68(corresponding to a multiple correlation of .82) to .91 (corresponding to a multiplecorrelation of .95). These levels were somewhat higher for the self ratings than for theschool ratings, which makes sense, as subjects are more likely to believe they know theirown implicit theory than that they know the implicit theory of the school.
These results are generally consistent with the pentagonal implicit theory. Theysuggest that people take into account the five points of the theory in making evaluations, andbelieve that the school takes into account all of the points except instrument validity(demonstrability). Of course, our population of subjects was a limited one, and we plan todo subsequent research with other populations.
Table 4.1
Summary of Multiple Regression Analyses: Student Sample
Rating (statement)13 (standardized regression coefficient)
Girls-School Girls-Self Boys-School Boys-Self
Excellence (1) .32*** .73*** .28*** .55***
Rarity (2) .45*** .38*** .25** .23***Productivity (5) 37*** .22*** 44*** .58***Demonstrability (3) .00 .13** .03 .28***Value (4) .49*** .26*** .50***Value (6) .26*** .10* .28*** .07
.78*** .91*** .68*** .87***
Root-mean-square error .46 .33 .60 .38
*p < .05. **p < .01. ***p < .001.
80
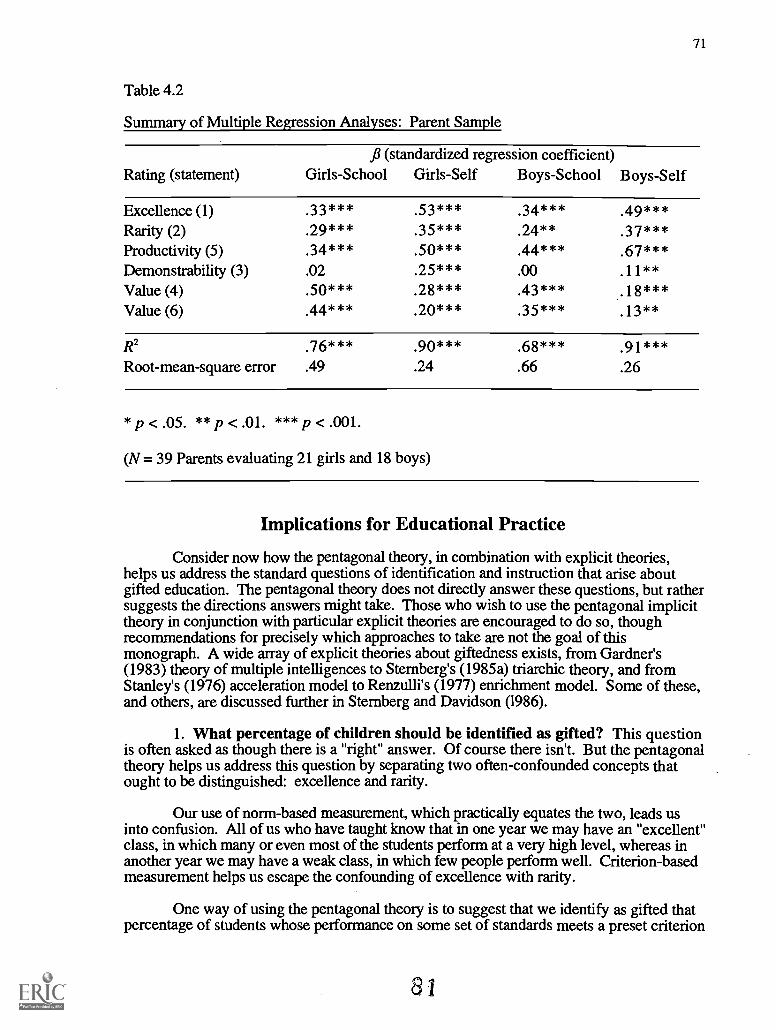
71
Table 4.2
Summary of Multiple Regression Analyses: Parent Sample
Rating (statement)fi (standardized regression coefficient)
Girls-School Girls-Self Boys-School Boys-Self
Excellence (1) 33*** .53*** .34*** .49***Rarity (2) .29*** 35*** .24**Productivity (5) .34*** .50*** .44*** .67***Demonstrability (3) .02 .25*** .00 .11**Value (4) .50*** .28*** .43*** .18***Value (6) .44*** .20*** .35*** .13**
R2 .76*** .90*** .68*** .91***Root-mean-square error .49 .24 .66 .26
*p<.05. **p<.01. ***p<.001.
(N. 39 Parents evaluating 21 girls and 18 boys)
Implications for Educational Practice
Consider now how the pentagonal theory, in combination with explicit theories,helps us address the standard questions of identification and instruction that arise aboutgifted education. The pentagonal theory does not directly answer these questions, but rathersuggests the directions answers might take. Those who wish to use the pentagonal implicittheory in conjunction with particular explicit theories are encouraged to do so, thoughrecommendations for precisely which approaches to take are not the goal of thismonograph. A wide array of explicit theories about giftedness exists, from Gardner's(1983) theory of multiple intelligences to Sternberg's (1985a) triarchic theory, and fromStanley's (1976) acceleration model to Renzulli's (1977) enrichment model. Some of these,and others, are discussed further in Sternberg and Davidson (1986).
1. What percentage of children should be identified as gifted? This questionis often asked as though there is a "right" answer. Of course there isn't. But the pentagonaltheory helps us address this question by separating two often-confounded concepts thatought to be distinguished: excellence and rarity.
Our use of norm-based measurement, which practically equates the two, leads usinto confusion. All of us who have taught know that in one year we may have an "excellent"class, in which many or even most of the students perform at a very high level, whereas inanother year we may have a weak class, in which few people perform well. Criterion-basedmeasurement helps us escape the confounding of excellence with rarity.
One way of using the pentagonal theory is to suggest that we identify as gifted thatpercentage of students whose performance on some set of standards meets a preset criterion
8 1

72
of excellence, and for whom we have the resources to provide special services. We willthereby acknowledge that our limitations in identification reflect not only students' abilities,but our own ability to serve such students.
We need to consider excellence independently of rarity, and to realize that we seekout rarity in part because of our inability to serve all students who may truly have veryimpressive potentials.
2. What constructs or measures should we use to identify the gifted? Thepentagonal theory makes clear that there is no one "right" construct measure, or even set ofconstructs or measures, that we "ought" to use. Rather than simply doing what we dobecause it has always been done that way, we need to take responsibility for statingexplicitly just what it is that we value and why. If we care about the potential of anindividual to contribute to himself, others, and society in a productive way, then we need tojustify why the measures we use will help identify such potentially productive individuals.
The least "metacognitively aware" formulators of programs for the gifted simply usewhatever measures have been used in the past to identify the gifted in a way that is ahnostwholly lacking in reflection and self-awareness. Call them "Stage I" programmers. Stage IIprogrammers, somewhat more aware of thinking theories and processes, will latch onto aparticular explicit theory of giftedness and use that, citing the theorist as their authority. Atleast such programmers have considered some alternatives. Stage ifi programmers are stillmore metacognitively aware, and will be able to defend why they use So and So's theory, oreven traditional techniques not clearly based in any theory. But the most thoughtfulprogrammers, those of Stage IV, will not simply latch onto whatever happens to be around,with or without justification, but will have a conception of what it is that they value, and willthen seek an explicit theory, or a combination of such theories, to help realize this system ofvalues. Stage IV programmers realize that the use of an explicit theory to help identify thegifted automatically makes a statement not only about the construct(s) with which the theoryor theories deal (such as intelligence or creativity), but also about what is valued by thosewho will make identification decisions.
3. What kind of educational program is ideal for gifted children? Debatesabout the best program for gifted children take on a different character when viewed fromthe standpoint of the pentagonal theory. There is no "right" answer to the question of whatkind of program is best. Rather, we again need to ask ourselves what we value. If we valuerapid learning, and believe that rapid learners will be in an enhanced position to contribute toour society, then acceleration makes sense. If we believe that what matters is the depth orcare students take in probing into what they learn, enrichment will be preferable. If both areprized, we might use a combination. Whatever we do, we should ensure that the valuesexpressed in the instructional program are the same as those expressed in the identificationprogram. If we select for rapid learners, we ought to teach in kind. Once we clarify whatwe value, we should then act accordingly.
In conclusion, the pentagonal implicit theory provides a basis for understanding howpeople assign the label of giftedness to some individuals but not to others. It suggests theframework supporting such judgments, whereas explicit theories fill in possible andalternative contents. By understanding implicit as well as explicit theories, we obtain a bettergrasp of what giftedness might mean not only as specified by psychological or educationaltheorists, but by the people who day-to-day make decisions about giftedness. For they aretheorists too, and those who most affect the lives of us and our children.
8 2

73
References
Berry, J. W. (1984). Towards a universal psychology of cognitive competence. InP. S. Fry (Ed.), Changing conceptions of intelligence and intellectual functioning (pp. 35-61). Amsterdam: North-Holland.
Duck, S. (1991). Understanding relationships. New York: Guilford Press.
Gardner, H. (1983). Frames of mind: The theory of multiple intelligences. NewYork: Basic Books.
Renzulli, J. S. (1977). The enrichment triad model: A guide for developingdefensible programs for the gifted and talented. Mansfield Center, CT: Creative LearningPress.
Renzulli, J. S. (1986). The three-ring conception of giftedness: A developmentalmodel for creative productivity. In R. J. Sternberg & J. E. Davidson (Eds.), Conceptions ofgiftedness (pp. 53-92). New York: Cambridge University Press.
Serpell, R. (1974). Aspects of intelligence in a developing country. African SocialResearch, 17, 576-96.
Stanley, J. C. (1976). The case for extreme educational acceleration of intellectuallybrilliant youth. Gifted Child Quarterly, 20(1), 66-75, 41.
Sternberg, R. J. (1985a). Beyond IQ: A triarchic theory of human intelligence.New York: Cambridge University Press.
Sternberg, R. J. (1985b). Implicit theories of intelligence, creativity, and wisdom.Journal of Personality and Social Psychology, 49, 607-627.
Sternberg, R. J. (1993). The concept of "giftedness": A pentagonal implicit theory.The origins and development of high ability (pp. 5-21). London: CIBA Foundation.
Sternberg, R. J., Conway, B. E., Ketron, J. L., & Bernstein, M. (1981). People'sconception of intelligence. Journal of Personality and Social Psychology, 41, 37-55.
Sternberg, R. J., & Davidson, J. E. (Eds.). (1986). Conceptions of giftedness. NewYork: Cambridge University Press.
Wober, M. (1974). Towards an understanding of the Kiganda concept ofintelligence. In J . W. Berry & P. R. Dasen (Eds.), Culture and cognition: Readings incross-cultural psychology (pp. 261-280). London: Methuen.
83
75
Research Monograph SeriesThe National Research Center on the Gifted and Talented
The University of Connecticut362 Fairfield Road, U-7Storrs, CT 06269-2007
www.ucc.uconn.edu/-wwwgt
Production AssistantsDawn R. Guenther
Siamak Vahidi
ReviewersMarcia A. B. Delcourt
E. Jean GubbinsBruce Shore
Dean Simonton
Also of Interest
Regular Classroom Practices With Gifted Students: Results of a National Survey ofClassroom Teachers
Francis X. Archambault, Jr., et al.
An Observational Study of Instructional and Curricular Practices Used With Gifted andTalented Students in Regular Classrooms
Karen L. Westberg, et al.
Why Not Let High Ability Students Start School in January?The Curriculum Compacting Study
Sally M. Reis, et al.
Evaluation of the Effects of Programming Arrangements on Student Learning OutcomesMarcia A. B. Delcourt, et al.
Qualitative Extension of the Learning Outcomes StudyMarcia A. B. Delcourt and Karen Evans
Toward a New Paradigm for Identifying Talent PotentialMary M. Frasier and A. Harry Passow
8 4
76
Also of interest from the
Research Monograph Series
Talents in Two Places: Case Studies of High Ability Students With Learning DisabilitiesWho Have Achieved
Sally M. Reis, Terry W. Neu, and Joan M. McGuire
The Effects of Group Composition on Gifted and Non-Gifted Elementary Students inCooperative Learning Groups
David A. Kenny, Francis X. Archambault, Jr., and Bryan W. Hallmark
Extending the Pedagogy of Gifted Education to All StudentsSally M. Reis, Marcia Gentry, and Sunghee Park
Case Studies of Talented Students Who Achieve and Underachieve in an UrbanHigh School
Sally M. Reis, et al.
Profiles of Successful Practices for High Ability Students in Elementary ClassroomsKaren L. Westberg and Francis X. Archambault, Jr.
Academic Diversity in the Middle School: Results of a National Survey of MiddleSchool Administrators and Teachers
Tonya Moon, Carol A. Tomlinson, and Carolyn M. Callahan
85
1\TRCG/T
The
National
Research
Center
on
the
Gifted
and
Talented
Research
Teams
The University of Connecticut
Dr. Francis X. Archambault, Associate DirectorThe University of ConnecticutSchool of Education, U-4Storrs, CT 06269-2004860-486-4531
Dr. Alexinia Y. BaldwinDr. Scott W. BrownDr. Deborah E. BurnsDr. David A. KennyDr. Jonna KulikowichDr. Sally M. ReisDr. Karen L. WestbergDr. Michael F. Young
The University of Georgia
Dr. Mary M. Frasier, Associate DirectorThe University of GeorgiaDepartment of Educational Psychology323 Aderhold HallAthens, GA 30602-7146404-542-5106
Dr. Scott L. Hunsaker
The University of Virginia
Dr. Carolyn M. Callahan, Associate DirectorCurry School of EducationThe University of Virginia405 Emmet StreetCharlottesville, VA 22903804-982-2849
Dr. Michael S. CaldwellDr. Marcia A. B. DelcourtDr. Kathleen MayDr. Claudia SowaDr. Ellen TomchinDr. Carol A. Tomlinson
Yale University
Dr. Robert J. Sternberg, Associate DirectorDepartment of PsychologyYale UniversityP.O. Box 208205New Haven, CT 06520-8205203-432-4632
Dr. Pamela Clinkenbeard
83
77

D
12(
U.S. Department of EducationOffice of Educational Research and Improvement (OERI)
National Libraiy of Education (NLE)Educational Resources Information Center (ERIC)
NOTICE
REPRODUCTION BASIS
®
IC
This document is covered by a signed "Reproduction Release(Blanket) form (on file within the ERIC system), encompassing allor classes of documents from its source organization and, therefore,does not require a "Specific Document" Release form.
This document is Federally-funded, or carries its own permission toreproduce, or is otherwise in the public domain and, therefore, maybe reproduced by ERIC without a signed Reproduction Release form(either "Specific Document" or "Blanket").
EFF-089 (9/97)