8.3 applying proportional reasoning to understand functions · students will grasp the concept of a...
TRANSCRIPT

8th Grade Mathematics
Unit #3: Modeling Relationships with Functions Pacing: 25 Days Unit Overview
In this unit, students model functions in different ways (algebraically, graphically, numerically in tables, or by verbal descriptions) and interpret those representations qualitatively and quantitatively. Students will grasp the concept of a function as a rule that assigns to each input exactly one output. They will understand that functions describe situations where one quantity determines another. They can translate among representations and partial representations of functions (noting that tabular and graphical representations may be partial representations), and they describe how aspects of the function are reflected in the different representations. Until Grade 8, almost all of students’ statistical topics and investigations have dealt with univariate data, e.g., collections of counts or measurements of one characteristic. Eighth graders apply their experience with the coordinate plane and linear functions in the study of association between two variables. The Mathematical Practices should be evident throughout instruction and connected to the content addressed in this unit. For instance, understanding how functions model relationships requires that students reason abstractly and quantitatively (MP.2) while looking for and making use of structure (MP.7).
Prerequisite Skills Vocabulary Mathematical Practices
1) Read numbers on a number line
2) Create t-tables and construct graphs (including scaling the axes)
3) Graph ordered pairs (x,y)
4) Evaluate Expressions
5) Compute with whole numbers and decimals, including application of order of operations
6) Understand characteristics of a proportional relationship
7) Write and solve algebraic equations
Functions Linear association
Slope-Intercept
Linear model
y-value Dependent variable
Non-linear association
Negative association
x-value Independent variable
Relation Positive association
Vertical line test
Linear relationship
Linear function
Ordered Pair
Input Initial value Rate of change
Domain Range
Output Non-linear function
Relative frequency
Rise
Intercept Slope Interval notation
Run
MP.1: Make sense of problems and persevere in solving them
MP.2: Reason abstractly and quantitatively
MP.3: Construct viable arguments and critique the reasoning of others
MP.4: Model with mathematics
MP.5: Use appropriate tools strategically
MP.6: Attend to precision
MP.7: Look for and make use of structure
MP.8: Look for and express regularity in repeated reasoning

2 | P a g e
Common Core State Standards Progression of Skills According to the PARCC Model Content Framework, Standard 3.NF.2 should serve as an opportunity for in- depth focus:
According to the PARCC Model Content Framework, Standard 8.F.2 should serve as opportunity for in-depth focus:
“Work toward meeting this standard repositions previous work with tables and graphs in the new context of input/output rules.”
According to the PARCC Model Content Framework,
The key advance in proportion concepts between 7th grade and 8th grade is: “Students build on previous work with proportional relationships, unit rates, and graphing to connect these ideas and understand that the points (x,y) on a non-vertical line are the solutions of the equation y= mx+b, where m is the slope of the line as well as the unit rate of a proportional relationship (in the case b=0). Students also formalize their previous work with linear relationships by working with functions—rules that assign to each input exactly one output.”
7th Grade 8th Grade High School N/A
8.F.1: Understand that a function is a rule that assigns to each input exactly one output. The graph of a function is the set of ordered pairs consisting of an input and the corresponding output.
HS.F.IF1A: Understand that a function from one set (called the domain) to another set (called the range) assigns to each element of the domain exactly one element of the range.
N/A 8.F.2: Compare properties of two functions each represented in a different way (algebraically, graphically, numerically in tables, or by verbal descriptions).
HS.F.IF.A.2: Use function notation, evaluate functions for inputs in their domains, and interpret statements that use function notation in terms of a context.
7.RP.2: Recognize and represent proportional relationships between quantities
8.F.3: Interpret the equation y = mx + b as defining a linear function, whose graph is a straight line; give examples of functions that are not linear.
N/A
N/A 8.F.4: Construct a function to model a linear relationship between two quantities. Determine the rate of change and initial value of the function from a description of a relationship or from two (x, y) values
HS.IF.B6: Calculate and interpret the average rate of change of a function (presented symbolically or as a table) over a specified interval. Estimate the rate of change from a graph
7.RP.2: Recognize and represent proportional relationships between quantities
8.F.5: Describe qualitatively the functional relationship between two quantities by analyzing a graph (e.g., where the function is increasing or decreasing, linear or nonlinear). Sketch a graph that exhibits the qualitative features of a function
HS.IF.B4: For a function that models a relationship between two quantities, interpret key features of graphs and tables in terms of the quantities, and sketch graphs showing key features given a verbal description of the relationship.
Major Standards (70%)
8.SP.1 Construct and Interpret scatter plots.
8.SP.2 Know that straight lines are used to model
relationships. 8.SP.4 Understand patterns of
association.
8.F.1 Understand and define functions. 8.F.2 Compare properties of two functions. 8.F.3 Interpret y=mx+b as as defining a linear
equation. 8.F.4 Construct a function to model a linear
relationship. 8.F.5 Analyze and sketch graphs that represent the
qualitative feautres of a function.

3 | P a g e
Big Ideas Students Will… • What is a function? What are the
different ways to represent a function?
• How do I determine whether a function is linear or non-linear? How can I recognize an equation that will produce a linear graph?
• How can a graph, table, ordered pair, or an algebraic rule help describe the relationship between two variables? How can we determine a gradual, steep or constant change between any two variables?
Know/Understand Be Able To… • A mathematical relation is a set of ordered pairs that
can be listed in a table, shown on graph as points, or represented in mapping.
• The set of x-values is the domain and the set of y-values is the range. A function is a relation in which each element (number) of the domain is mapped to exactly one element (number) of the range. A function can be determined on a graph by using a vertical line test.
• Functions provide a tool for describing how variables change together. Using a function in this way is called modeling, and the function is called a model.
• Functions can be represented in multiple ways—in algebraic symbols, graphs, verbal descriptions, tables, and so on—and these representations, and the links among them, are useful in analyzing patterns of change.
• Some representations of a function may be more useful than others, depending on how they are used.
• Functions are single-valued mappings from one set—the domain of the function—to another—its range.
• Functions apply to a wide range of situations. They do not have to be described by any specific expressions or follow a regular pattern. They apply to cases other than those of “continuous variation.” For example, sequences are functions.
• For functions that map real numbers to real numbers, certain patterns of covariation, or patterns in how two variables change together, indicate membership in a particular family of functions and determine the type of formula that the function has.
• Describing what it means for a situation to have a functional relationship
• Determining the relationship between the input and output of a function
• Determining the different types of functions that can be used and altered to model various situations in life
• Representing a linear function in the context of a problem situation
• Representing a function using real world context • Interpreting, sketching, and analyzing graphs from
situations • Identifying relations and functions • Evaluating functions • Modeling functions using rules, tables and graphs • Writing function rule given table or real-world
situation • Using inductive reasoning in counting number patterns • Writing rules for arithmetic sequences • Modeling arithmetic sequence as linear function • Finding input value given the output value, and vice
versa

4 | P a g e
Unit Sequence Student Friendly Objective
SWBAT… Key Points/
Teaching Tips Sample Assessment Item from
Exit Ticket Instructional
Resources 1 Represent linear relationships
using tables, graphs, equations and words
• Key Point: The relationship between two variables is linear if the change of one variable with respect to the change in the other is constant.
A fitness instructor exercises about 12.5 hours per week. Write an equation to find the total number of hours h the instructor exercises in any number of weeks w.
My Math Chapter 4 Lessons 1-2
2 Develop a conceptual understanding of functions in order to derive a formal definition of a function.
• Tip: A mapping diagram can help students see if a relation is a function by determining if every member of the domain has only one arrow leading to the range.
A ball bounces across the schoolyard. It hits the ground at (0, 0) and bounces up and lands at (1, 0) and bounces again. The graph shows only one bounce.
1) Identify the height of the ball at the following values of 𝑡: 0, 0.25.
2) What is the average speed of the ball over the first 0.25 second?
Engage NY Module 5 Lesson 1 (Appendix C) My Math Chapter 4 Inquiry Lab: Relations and Functions (Pages 285 – 286)
Weeks, w Total Hours, h
1 12.5 2 25 3 37.5 4 50

5 | P a g e
3 Construct and test a formal definition of a function
• Definitions should be based on the understanding that functions occur when there is exactly one y-value associated with any x-value.
Can the table shown below represent values of a function? Explain:
Engage NY Module 5 Lesson 2 (Appendix C) http://www.mathplayground.com/functionmachine.html
4 Use substitution to find the value of a function. Differentiate between dependent and independent variables and organize inputs, outputs and rules in a function table
Key points:
• Remind students that the variable y is simply another way to express the notation f(x) in a function rule or a function table.
1) Find the function value: f(-2) if f(x) = x + 4 3) How does the domain affect the range in a function?
My Math Chapter 4 Lesson 3 http://www.ixl.com/math/grade-8/complete-a-function-table http://www.ixl.com/math/grade-8/write-a-rule-for-a-function-table
5 Graph linear functions from function tables and equations
• Determine the connection between points (x, y), functions, and the equation representing the function (y = mx + b).
• determine whether a set of data is continuous or discrete
• “by the book” (appendix c) may be used as an extension resource
An appliance repairman charges $60 for a service call plus an additional $40 per hour to repair appliances. The function is represented by y = 40x + 60.
a. Make a function table to find the total cost of 1, 2, 3 or 4 hours of repair on an appliance:
b. Graph the function c. Is the function continuous or
discrete? Explain
My Math Chapter 4 Lesson 4 “By the Book” (Appendix C) http://www.ixl.com/math/grade-8/graph-a-line-from-a-function-table http://www.ixl.com/math/grade-8/graph-a-line-from-an-equation

6 | P a g e
6 Make sense of, represent and solve real world problems related to linear functions
• Students know that distance traveled is a function of the time spent traveling and that the total cost of an item is a function of how many items are purchased.
A linear function has the table of values below. The information in the table shows the number of pages a student can read in a certain book as a function of time in minutes. Assume a constant rate: Time in minutes(x)
2 6 11 20
Total # of pages read (y)
7 21 38.5 70
a. Write the rule or equation that
represents the linear function that describes the total number of pages read, 𝑦, in 𝑥 minutes.
b. How many pages can be read in 45 minutes?
c. Do all linear functions have a constant rate of change? Explain.
Engage NY Module 5 Lesson 3 (Appendix C)
7 Flex Day (Instruction Based on Data) Recommended Resources:
Engage NY Module 5 Lesson 4 (Appendix C) “Order Matters” (Appendix C)
“Vending Machines” (Appendix C) “Secret Codes and Number Rules” (Appendix C)
My Math Chapter 4 Problem-Solving Investigation (Pages 305 – 307) My Math Chapter 4 Mid-Chapter Check (Page 308)

7 | P a g e
8 Identify a function by its graph
• Students must understand that the graph of a function is the set of ordered pairs consisting of an input and the corresponding output.
· essential question: why is the graph of a function identical to the graph of a certain equation?
The amount of water that flows out of a certain hose in gallons is a function of the amount of time in minutes that the faucet is turned on. The amount of water that flows out of the hose in 4 minutes is 11 gallons. Assume water flows at a constant rate. a. Write an equation in two
variables that represents the amount of water, 𝑦, in gallons, as a function of the time in minutes, 𝑥, the faucet is turned on.
b. Use the equation you wrote in part (1) to determine the amount of water that flows out of a hose in 8 minutes, 4 minutes, and 2 minutes.
c. The input of the function, 𝑥, is time in minutes, and the output of the function, 𝑦, is the amount of water that flows out of the hose in gallons. Write the inputs and outputs from part (2) as ordered pairs, and plot them as points on the coordinate plane.
Engage NY Module 5 Lesson 5 (Appendix C) http://learnzillion.com/lessons/1191
8 | P a g e
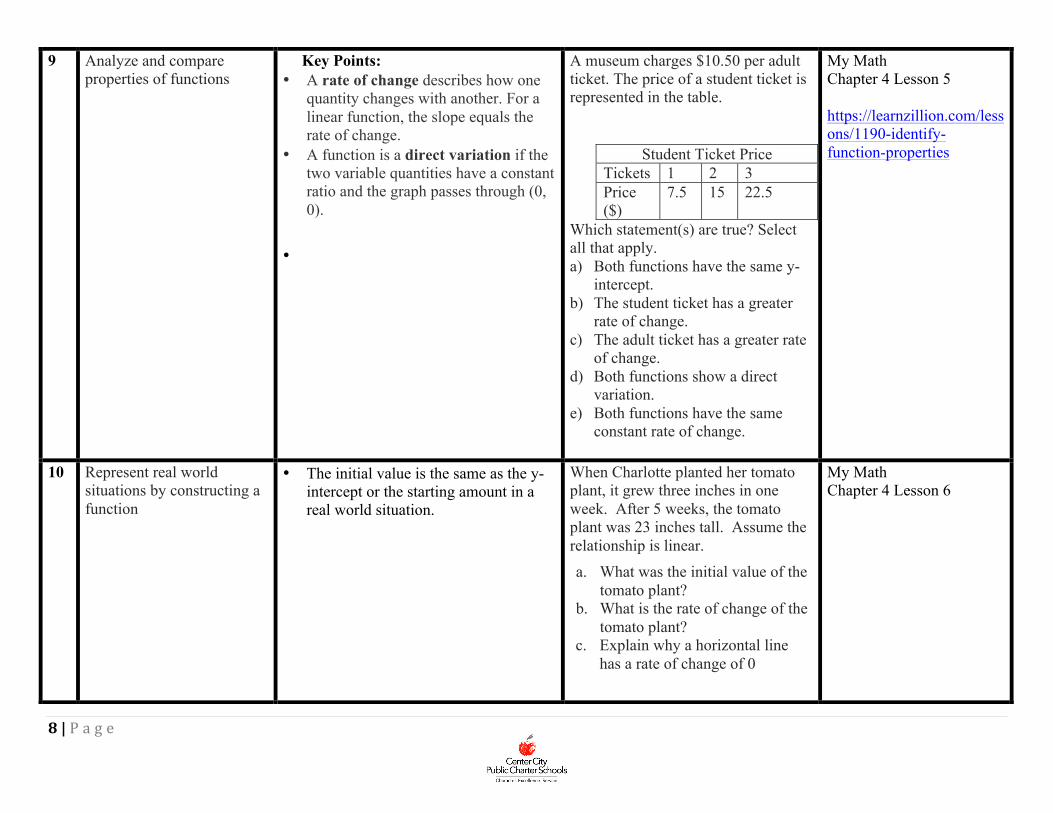
9 Analyze and compare properties of functions
Key Points: • A rate of change describes how one
quantity changes with another. For a linear function, the slope equals the rate of change.
• A function is a direct variation if the two variable quantities have a constant ratio and the graph passes through (0, 0).
•
A museum charges $10.50 per adult ticket. The price of a student ticket is represented in the table.
Student Ticket Price Tickets 1 2 3 Price ($)
7.5 15 22.5
Which statement(s) are true? Select all that apply. a) Both functions have the same y-
intercept. b) The student ticket has a greater
rate of change. c) The adult ticket has a greater rate
of change. d) Both functions show a direct
variation. e) Both functions have the same
constant rate of change.
My Math Chapter 4 Lesson 5 https://learnzillion.com/lessons/1190-identify-function-properties
10 Represent real world situations by constructing a function
• The initial value is the same as the y-intercept or the starting amount in a real world situation.
When Charlotte planted her tomato plant, it grew three inches in one week. After 5 weeks, the tomato plant was 23 inches tall. Assume the relationship is linear. a. What was the initial value of the
tomato plant? b. What is the rate of change of the
tomato plant? c. Explain why a horizontal line
has a rate of change of 0
My Math Chapter 4 Lesson 6

9 | P a g e
11 Use rate of change to determine whether or not a function is linear
• Students interpret the equation y = mx + b as defining a linear function, whose graph is a line
Is the function a linear function? Check at least three pairs of inputs and their corresponding outputs:
Input Output -2 3 8 -2 10 -3 20 -8
What will the graph of the function from part (1) look like? Explain.
Engage NY Module 5 Lesson 6 (Appendix C)
12 Compare properties of at least two functions each represented in a different way (algebraically, graphically, numerically, etc.). Use rate of change to compare two functions.
• Providing example language for students to reference will be useful. This might consist of sentence starters, sentence frames, or a word wall.
Of the four linear functions represented below, which has the greatest rate of change?
Engage NY Module 5 Lesson 7 (Appendix C) http://learnzillion.com/lessons/1193-compare-two-functions-by-analyzing-an-equation-and-a-table
13 Differentiate between linear and non-linear functions
Students may benefit from exploring these challenge exercises in small groups.(Engage lesson)
A function has the rule so that each input of x is assigned an output of 𝑥! − 4. Do you think the function is linear or nonlinear? Explain.
Engage NY Module 5 Lesson 8 (Appendix C) My Math Chapter 4 Lesson 7

10 | P a g e
14 Flex Day (Instruction Based on Data) Recommended Resources:
“Which is Which?” (Appendix C) My Math Chapter 4 Lesson 9 (Pages 347 – 354)
My Math Chapter 4 Inquiry Lab (Pages 343 – 346) My Math Chapter 4 21st Century Career (Pages 355 – 356)
15 Make sense of, represent
and solve real world problems related to rate of change, linear relationships and functions
• Task-based lessons over the course of four days • Provide an appropriate balance of independent work/think time with collaborative
work/think time • Emphasize the problem solving process rather than the answer (i.e. how are
students making sense of and thinking about the problems; what type of solution pathways are they designing before they get started)
• Provide an opportunity for students to share different strategies/methods for tackling the tasks
• End each lesson with meaningful discussions (i.e. Socratic seminars, critiquing their peer’s work, etc.) and/or written reflections
“Battery Charging Task” “MAP Concept Task: Lines and Linear Equations” “What’s My Line?” “MAP Task: Modeling Situations with Linear Equations” “Fill the Tanker” (Appendix C)
16
17
18
19
Flex Days (Instruction Based on Data) Recommended Resources:
“Sorting Functions” (Appendix C) “Analyzing Linear Functions” (Appendix C)
“Ditch Diggers” (Appendix C) “Engage NY Assessment” (Appendix C)
My Math Chapter 4 Review (Pages 357 – 360) My Math Unit Project (Pages 361 – 362)
20 End of Unit MCLASS Beacon Assessment
Appendix B

11 | P a g e
Appendix A: Unpacked Standards Guide
Source: Public Schools of North Carolina NCDPI Collaborative Workspace
Standard Unpacking What do these standards mean a child will know and be able to do?
8.F.1 Understand that a function is a rule that assigns to each input exactly one output. The graph of a function is the set of ordered pairs consisting of an input and the corresponding output.1 1Function notation is not required in Grade 8.
8.F.1 Students understand rules that take x as input and gives y as output is a function. Functions occur when there is exactly one y-value is associated with any x-value. Using y to represent the output we can represent this function with the equations y = x2 + 5x + 4. Students are not expected to use the function notation f(x) at this level. Students identify functions from equations, graphs, and tables/ordered pairs. Graphs Students recognize graphs such as the one below is a function using the vertical line test, showing that each x-value has only one y-value; whereas, graphs such as the following are not functions since there are 2 y-values for multiple x-value.
12 | P a g e
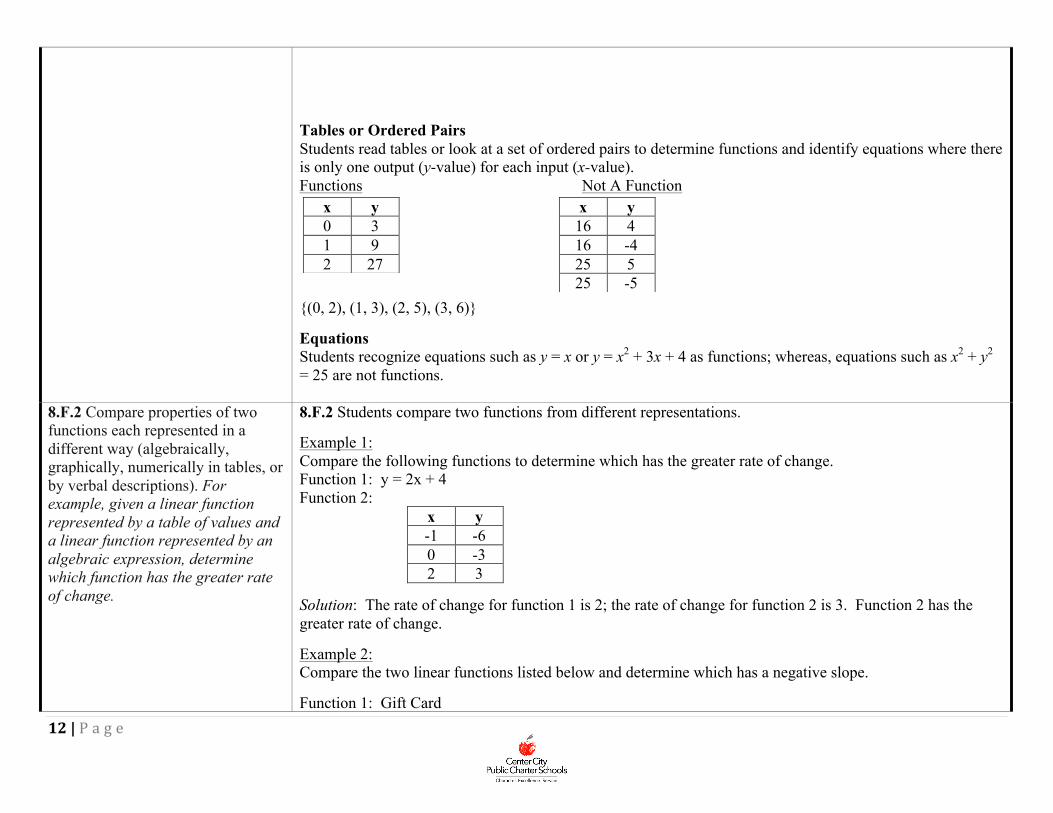
Tables or Ordered Pairs Students read tables or look at a set of ordered pairs to determine functions and identify equations where there is only one output (y-value) for each input (x-value). Functions Not A Function
{(0, 2), (1, 3), (2, 5), (3, 6)} Equations Students recognize equations such as y = x or y = x2 + 3x + 4 as functions; whereas, equations such as x2 + y2 = 25 are not functions.
x y 0 3 1 9 2 27
x y 16 4 16 -4 25 5 25 -5
8.F.2 Compare properties of two functions each represented in a different way (algebraically, graphically, numerically in tables, or by verbal descriptions). For example, given a linear function represented by a table of values and a linear function represented by an algebraic expression, determine which function has the greater rate of change.
8.F.2 Students compare two functions from different representations. Example 1: Compare the following functions to determine which has the greater rate of change. Function 1: y = 2x + 4 Function 2:
x y -1 -6 0 -3 2 3
Solution: The rate of change for function 1 is 2; the rate of change for function 2 is 3. Function 2 has the greater rate of change. Example 2: Compare the two linear functions listed below and determine which has a negative slope. Function 1: Gift Card

13 | P a g e
Samantha starts with $20 on a gift card for the bookstore. She spends $3.50 per week to buy a magazine. Let y be the amount remaining as a function of the number of weeks, x. Function 2: Calculator rental The school bookstore rents graphing calculators for $5 per month. It also collects a non-refundable fee of $10.00 for the school year. Write the rule for the total cost (c) of renting a calculator as a function of the number of months (m). c = 10 + 5m Solution: Function 1 is an example of a function whose graph has a negative slope. Both functions have a positive starting amount; however, in function 1, the amount decreases 3.50 each week, while in function 2, the amount increases 5.00 each month. NOTE: Functions could be expressed in standard form. However, the intent is not to change from standard form to slope-intercept form but to use the standard form to generate ordered pairs. Substituting a zero (0) for x and y will generate two ordered pairs. From these ordered pairs, the slope could be determined. Example 3: 2x + 3y = 6 Let x = 0: 2(0) + 3y = 6 Let y = 0: 2x + 3(0) = 6 3y = 6 2x = 6 3y = 6 2x = 6 3 3 2 2 y = 2 x = 3 Ordered pair: (0, 2) Ordered pair: (3, 0) Using (0, 2) and (3, 0) students could find the slope and make comparisons with another function.
x y 0 20 1 16.50 2 13.00 3 9.50
8.F.3 Interpret the equation y = 8.F.3 Students understand that linear functions have a constant rate of change between any two points.

14 | P a g e
mx + b as defining a linear function, whose graph is a straight line; give examples of functions that are not linear. For example, the function A = s2 giving the area of a square as a function of its side length is not linear because its graph contains the points (1,1), (2,4) and (3,9), which are not on a straight line.
Students use equations, graphs and tables to categorize functions as linear or non-linear. Example 1: Determine if the functions listed below are linear or non-linear. Explain your reasoning.
1. y = -2x2 + 3 2. y = 0.25 + 0.5(x – 2) 3. A = ∏r2
4. 5. X Y 1 12 2 7 3 4 4 3 5 4 6 7
Solution:
1. Non-linear 2. Linear 3. Non-linear 4. Non-linear; there is not a constant rate of change 5. Non-linear; the graph curves indicating the rate of change is not constant.
8.F.4 Construct a function to model a linear relationship between two quantities. Determine the rate of change and initial value of the function from a description of a relationship or from two (x, y) values, including reading these from a table or from a graph. Interpret the rate of change and initial value of a linear function in terms of the situation it models, and in terms of its graph or a table of values.
8.F.4 Students identify the rate of change (slope) and initial value (y-intercept) from tables, graphs, equations or verbal descriptions to write a function (linear equation). Students understand that the equation represents the relationship between the x-value and the y-value; what math operations are performed with the x-value to give the y-value. Slopes could be undefined slopes or zero slopes. Tables: Students recognize that in a table the y-intercept is the y-value when x is equal to 0. The slope can be
determined by finding the ratio between the change in two y-values and the change between the two corresponding x-values. Example 1: €
yx

15 | P a g e
Write an equation that models the linear relationship in the table below. Solution: The y-intercept in the table below would be (0, 2). The distance between 8 and -1 is 9 in a negative direction à -9; the distance between -2 and 1 is 3 in a positive direction. The slope is the ratio of rise to run
or or = -3. The equation would be y = -3x + 2 Graphs: Using graphs, students identify the y-intercept as the point where the line crosses the y-axis and the slope as the rise. run Example 2: Write an equation that models the linear relationship in the graph below. Solution: The y-intercept is 4. The slope is ¼ , found by moving up 1 and right 4 going from (0, 4) to (4, 5). The linear equation would be y = ¼ x + 4.
x y -2 8 0 2 1 -1
€
yx
€
−93

16 | P a g e
Equations: In a linear equation the coefficient of x is the slope and the constant is the y-intercept. Students need to be given the equations in formats other than y = mx + b, such as y = ax + b (format from graphing calculator), y = b + mx (often the format from contextual situations), etc. Point and Slope: Students write equations to model lines that pass through a given point with the given slope. Example 2: A line has a zero slope and passes through the point (-5, 4). What is the equation of the line? Solution: y = 4 Example 3: Write an equation for the line that has a slope of ½ and passes though the point (-2, 5) Solution: y = ½ x + 6 Students could multiply the slope ½ by the x-coordinate -2 to get -1. Six (6) would need to be added to get to 5, which gives the linear equation. Students also write equations given two ordered pairs. Note that point-slope form is not an expectation at this level. Students use the slope and y-intercepts to write a linear function in the form y = mx +b. Contextual Situations: In contextual situations, the y-intercept is generally the starting value or the value in the situation when the independent variable is 0. The slope is the rate of change that occurs in the problem. Rates of change can often occur over years. In these situations it is helpful for the years to be “converted” to 0, 1, 2, etc. For example, the years of 1960, 1970, and 1980 could be represented as 0 (for 1960), 10 (for 1970) and 20 (for 1980). Example 4: The company charges $45 a day for the car as well as charging a one-time $25 fee for the car’s navigation system (GPS). Write an expression for the cost in dollars, c, as a function of the number of days, d, the car was rented.

17 | P a g e
Solution: C = 45d + 25 Students interpret the rate of change and the y-intercept in the context of the problem. In Example 4, the rate of change is 45 (the cost of renting the car) and that initial cost (the first day charge) also includes paying for the navigation system. Classroom discussion about one-time fees vs. recurrent fees will help students model contextual situations.
8.F.5 Describe qualitatively the functional relationship between two quantities by analyzing a graph (e.g., where the function is increasing or decreasing, linear or nonlinear). Sketch a graph that exhibits the qualitative features of a function that has been described verbally.
8.F.5 Given a verbal description of a situation, students sketch a graph to model that situation. Given a graph of a situation, students provide a verbal description of the situation. Example 1: The graph below shows a John’s trip to school. He walks to his Sam’s house and, together, they ride a bus to school. The bus stops once before arriving at school. Describe how each part A – E of the graph relates to the story. Solution: A John is walking to Sam’s house at a constant rate. B John gets to Sam’s house and is waiting for the bus. C John and Sam are riding the bus to school. The bus is moving at a constant rate, faster than John’s walking rate. D The bus stops. E The bus resumes at the same rate as in part C. Example 2: Describe the graph of the function between x = 2 and x = 5? Solution: The graph is non-linear and decreasing.
18 | P a g e