8252-palagia uk - meal cooler mf01 compliance report · duct area 0.126m 2 meter temperature tm...
TRANSCRIPT


Contents Part 1: Executive Summary ...........................................................................................................................3
1.1 Monitoring Objectives .........................................................................................................................3 1.2 Monitoring Results ..............................................................................................................................4 1.3 Operating Information .........................................................................................................................4 1.4 Monitoring Deviations .........................................................................................................................4
Part 2: Supporting Information ......................................................................................................................5
Appendix 1 General Information ...............................................................................................................5 Appendix 2 Diagrams of Emission Point ..................................................................................................7 Appendix 3 Particulate Matter (Sampling Measurement & Results) ........................................................9 Appendix 4 Calibration Certificates ........................................................................................................ 16 Appendix 5 Uncertainty Calculations ...................................................................................................... 19
Report Reference EI/8252-Meal Cooler MF01 Pelagia UK – PF/GYFMM/EPA –2019
Version 1
Page 2 of 19

Part 1: Executive Summary
1.1 Monitoring Objectives
Pelaagia (UK) Ltd placed a contract with CES Environmental Instruments Ltd for the compliance check monitoring of emissions to air from the Meal Cooler MF01. Meal Cooler MF01 Pelagia (UK) Ltd process fish and fish offal by the application of heat and drying to produce fish meal and fish oil for use in the animal feed industry, the hardened oil trade and other specialist outlets.
Raw material is heated in a cooker to enable oil extraction during pressing and pressed to remove as much body liquor as possible before drying. Solid material is removed from the liquor and directed to the dryer. Liquor is further treated to remove oil which is sent to storage.
Process emissions are directed through the foul air system which incorporates a waste heat evaporator; vapour condenser and boiler combustion plant. The test work was undertaken on 17 July 20189 by CES Environmental Instruments Ltd Engineers and carried out as part of CES Environmental Instruments Ltd job reference EI/8252 The substances monitored were:- Particulate Matter On the day of testing there were no special requirements for the monitoring.
Report Reference EI/8252-Meal Cooler MF01 Pelagia UK – PF/GYFMM/EPA –2019
Version 1
Page 3 of 19

1.2 Monitoring Results
Emission Point Reference: Meal Cooler MF01 Substance to be Monitored Emission Limit
Value Periodic
Monitoring Result
Uncertainty of
Measurement(95% CI)
Blank Result Units Reference Conditions
Emission Rate
Date of Sampling Start and End Times
Monitoring Method
Reference
Accreditation for use of Method
Operating Status
Particulate Matter 20 3.90 0.59 0.00* mg/m³ 273K, 101.3kPa 0.0175 kg/hr 17 July 2019 09:00-11:20 BS EN 13284-1 UKAS & MCERTS
Normal Operation
* Indicates where a value less than the limit of detection of the weighing procedure (0.21mg) has been reported, the value lies between the detection limit and zero. A value of half the limit of detection (0.21mg) has been used to calculate the concentration.
1.3 Operating Information
Emission Point Reference: Meal Cooler MF01
Process Type Batch Sample Details Fuel Product Load Abatement
Continuous - - Fish Meal Normal Operation None
Comparison of Operator CEMS and Periodic Monitoring Results
Substance to be Monitored Emission Limit Value
Periodic Monitoring
Result
Uncertainty of Measurement
(95% CI)
Units Reference Conditions Date of Sampling Start and End Times
CEMS Results
Particulate Matter 20 3.90 0.59 mg/m³ 273K, 101.3kPa 17 July 2019 09:00-11:20 No Data Available
1.4 Monitoring Deviations The sample plane does not comply upstream and downstream as per the requirements of BS EN 15259. The appropriate sample ports are not fitted as per the requirements of BS EN 15259.
Report Reference EI/8252-Meal Cooler MF01 Pelagia UK – PF/GYFMM/EPA –2019
Version 1
Page 4 of 19
Part 2: Supporting Information
Appendix 1 General Information
Report Reference EI/8252-Meal Cooler MF01 Pelagia UK – PF/GYFMM/EPA –2019
Version 1
Page 5 of 19
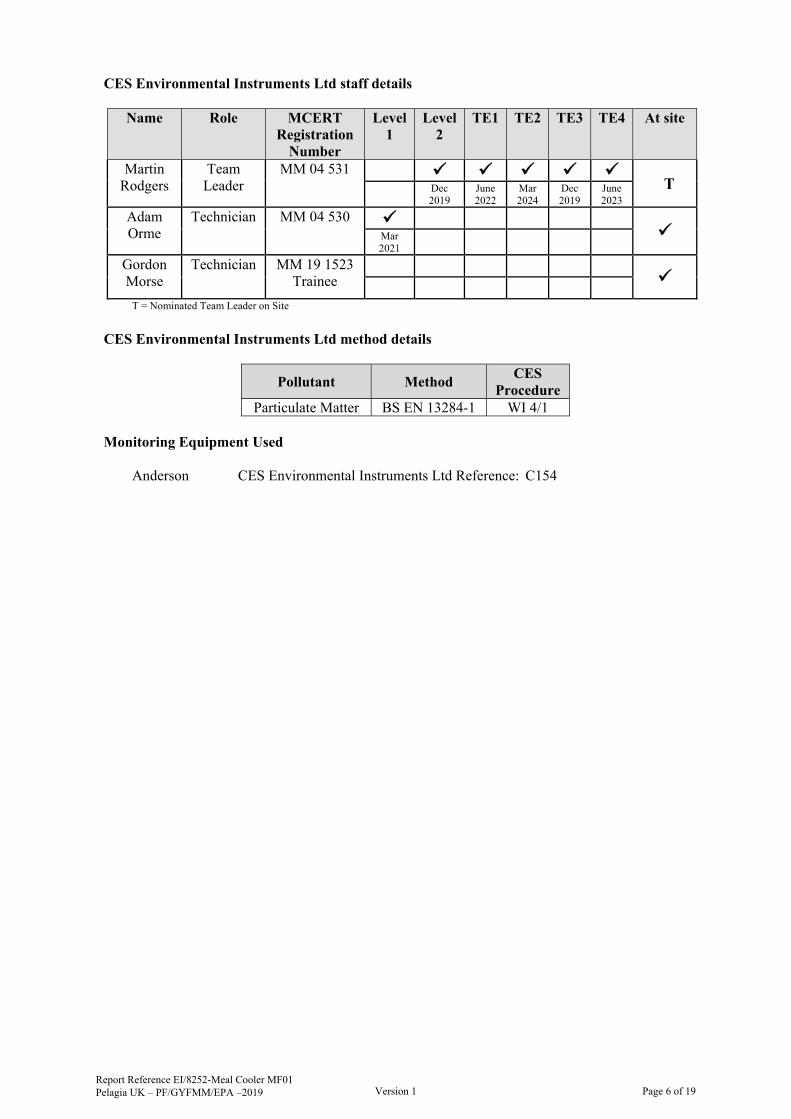
CES Environmental Instruments Ltd staff details
T = Nominated Team Leader on Site
CES Environmental Instruments Ltd method details
Pollutant Method CES
Procedure Particulate Matter BS EN 13284-1 WI 4/1
Monitoring Equipment Used
Anderson CES Environmental Instruments Ltd Reference: C154
Name Role MCERT Registration
Number
Level 1
Level 2
TE1 TE2 TE3 TE4
At site
Martin Rodgers
Team Leader
MM 04 531 T
Dec 2019
June 2022
Mar 2024
Dec 2019
June 2023
Adam Orme
Technician MM 04 530 Mar
2021 Gordon Morse
Technician MM 19 1523 Trainee
Report Reference EI/8252-Meal Cooler MF01 Pelagia UK – PF/GYFMM/EPA –2019
Version 1
Page 6 of 19
Appendix 2 Diagrams of Emission Point
Report Reference EI/8252-Meal Cooler MF01 Pelagia UK – PF/GYFMM/EPA –2019
Version 1
Page 7 of 19
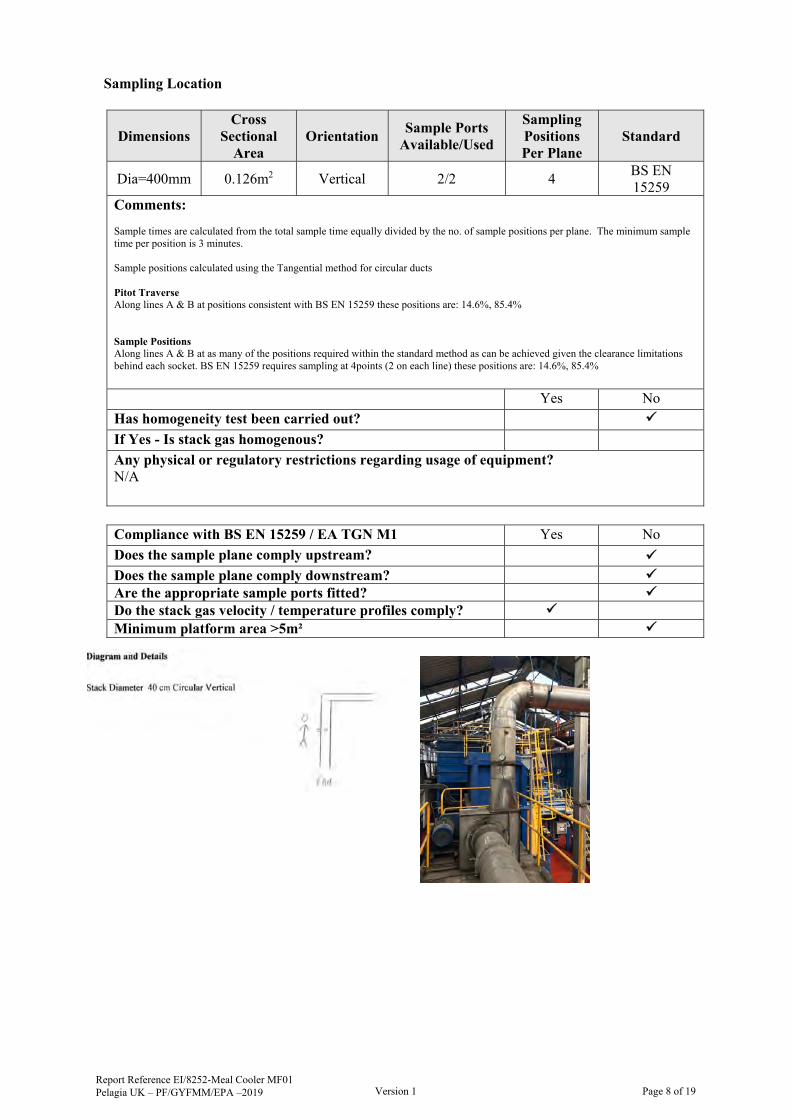
Sampling Location
Dimensions Cross
Sectional Area
Orientation Sample Ports
Available/Used
Sampling Positions Per Plane
Standard
Dia=400mm 0.126m2 Vertical 2/2 4 BS EN 15259
Comments: Sample times are calculated from the total sample time equally divided by the no. of sample positions per plane. The minimum sample time per position is 3 minutes. Sample positions calculated using the Tangential method for circular ducts Pitot Traverse Along lines A & B at positions consistent with BS EN 15259 these positions are: 14.6%, 85.4% Sample Positions Along lines A & B at as many of the positions required within the standard method as can be achieved given the clearance limitations behind each socket. BS EN 15259 requires sampling at 4points (2 on each line) these positions are: 14.6%, 85.4%
Yes No
Has homogeneity test been carried out?
If Yes - Is stack gas homogenous?
Any physical or regulatory restrictions regarding usage of equipment? N/A
Compliance with BS EN 15259 / EA TGN M1 Yes No
Does the sample plane comply upstream? Does the sample plane comply downstream? Are the appropriate sample ports fitted? Do the stack gas velocity / temperature profiles comply? Minimum platform area >5m²
Report Reference EI/8252-Meal Cooler MF01 Pelagia UK – PF/GYFMM/EPA –2019
Version 1
Page 8 of 19
Appendix 3 Particulate Matter (Sampling Measurement & Results)
Report Reference EI/8252-Meal Cooler MF01 Pelagia UK – PF/GYFMM/EPA –2019
Version 1
Page 9 of 19
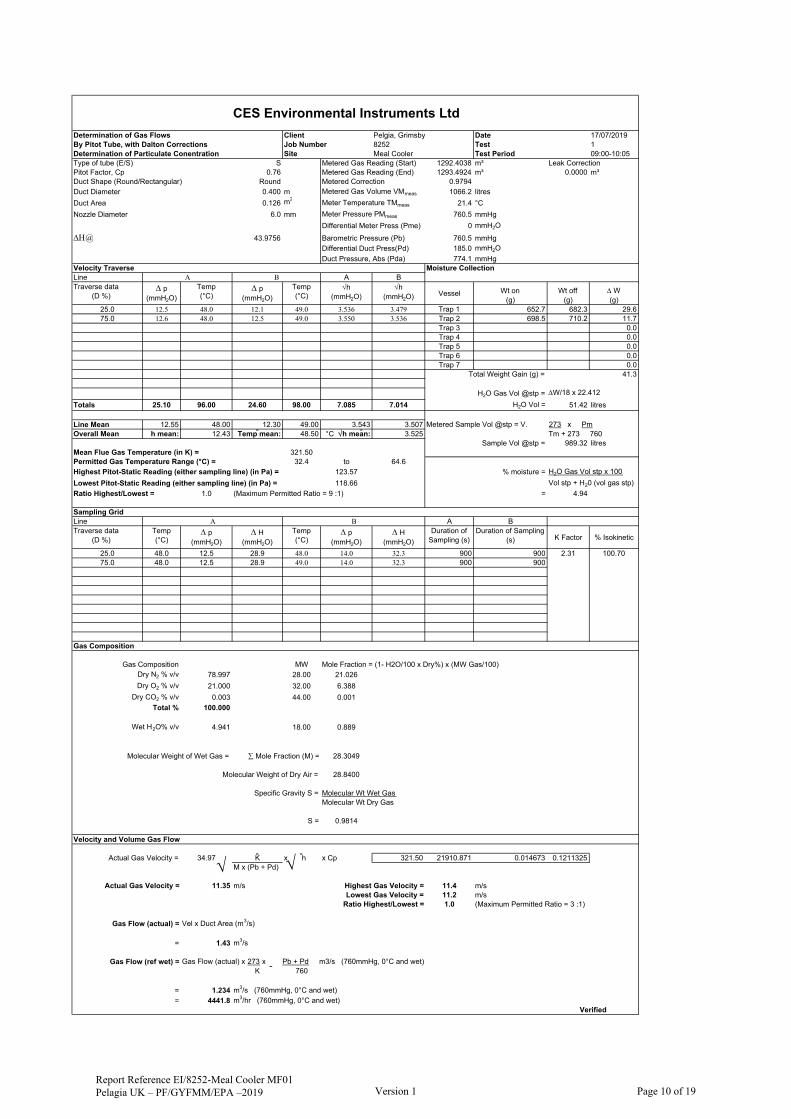
CES Environmental Instruments Ltd
Determination of Gas Flows Client Pelgia, Grimsby Date 17/07/2019By Pitot Tube, with Dalton Corrections Job Number 8252 Test 1Determination of Particulate Conentration Site Meal Cooler Test Period 09:00-10:05Type of tube (E/S) S Metered Gas Reading (Start) 1292.4038 m³ Leak CorrectionPitot Factor, Cp 0.76 Metered Gas Reading (End) 1293.4924 m³ 0.0000 m³Duct Shape (Round/Rectangular) Round Metered Correction 0.9794Duct Diameter 0.400 m Metered Gas Volume VMmeas 1066.2 litres
Duct Area 0.126 m2Meter Temperature TMmeas 21.4 °C
Nozzle Diameter 6.0 mm Meter Pressure PMmeas 760.5 mmHg
Differential Meter Press (Pme) 0 mmH2O
@ 43.9756 Barometric Pressure (Pb) 760.5 mmHgDifferential Duct Press(Pd) 185.0 mmH2O
Duct Pressure, Abs (Pda) 774.1 mmHgVelocity Traverse Moisture CollectionLine A BTraverse data (D %)
p(mmH2O)
Temp (°C)
p(mmH2O)
Temp (°C)
h (mmH2O)
h (mmH2O) Vessel Wt on
(g)Wt off
(g) W (g)
25.0 12.5 48.0 12.1 49.0 3.536 3.479 Trap 1 652.7 682.3 29.675.0 12.6 48.0 12.5 49.0 3.550 3.536 Trap 2 698.5 710.2 11.7
Trap 3 0.0Trap 4 0.0Trap 5 0.0Trap 6 0.0Trap 7 0.0
Total Weight Gain (g) = 41.3
H2O Gas Vol @stp = W/18 x 22.412
Totals 25.10 96.00 24.60 98.00 7.085 7.014 H2O Vol = 51.42 litres
Line Mean 12.55 48.00 12.30 49.00 3.543 3.507 Metered Sample Vol @stp = V. 273 x PmOverall Mean h mean: 12.43 Temp mean: 48.50 °C h mean: 3.525 Tm + 273 760
Sample Vol @stp = 989.32 litresMean Flue Gas Temperature (in K) = 321.50Permitted Gas Temperature Range (°C) = 32.4 to 64.6Highest Pitot-Static Reading (either sampling line) (in Pa) = 123.57 % moisture = H2O Gas Vol stp x 100
Lowest Pitot-Static Reading (either sampling line) (in Pa) = 118.66 Vol stp + H20 (vol gas stp)
Ratio Highest/Lowest = 1.0 (Maximum Permitted Ratio = 9 :1) = 4.94
Sampling GridLine A BTraverse data (D %)
Temp (°C)
p(mmH2O)
H(mmH2O)
Temp (°C)
p(mmH2O)
H(mmH2O)
Duration of Sampling (s)
Duration of Sampling (s) K Factor % Isokinetic
25.0 48.0 12.5 28.9 48.0 14.0 32.3 900 900 2.31 100.7075.0 48.0 12.5 28.9 49.0 14.0 32.3 900 900
Gas Composition
Gas Composition MW Mole Fraction = (1- H2O/100 x Dry%) x (MW Gas/100)Dry N2 % v/v 78.997 28.00 21.026
Dry O2 % v/v 21.000 32.00 6.388
Dry CO2 % v/v 0.003 44.00 0.001
Total % 100.000
Wet H2O% v/v 4.941 18.00 0.889
Molecular Weight of Wet Gas = Mole Fraction (M) = 28.3049
Molecular Weight of Dry Air = 28.8400
Specific Gravity S = Molecular Wt Wet GasMolecular Wt Dry Gas
S = 0.9814
Velocity and Volume Gas Flow
Actual Gas Velocity = 34.97 K x h x Cp 321.50 21910.871 0.014673 0.1211325M x (Pb + Pd)
Actual Gas Velocity = 11.35 m/s Highest Gas Velocity = 11.4 m/sLowest Gas Velocity = 11.2 m/s
Ratio Highest/Lowest = 1.0 (Maximum Permitted Ratio = 3 :1)
Gas Flow (actual) = Vel x Duct Area (m3/s)
= 1.43 m3/s
Gas Flow (ref wet) = Gas Flow (actual) x 273 x Pb + Pd m3/s (760mmHg, 0°C and wet) K 760
= 1.234 m3/s (760mmHg, 0°C and wet)
= 4441.8 m3/hr (760mmHg, 0°C and wet)Verified
A B
A B
Report Reference EI/8252-Meal Cooler MF01 Pelagia UK – PF/GYFMM/EPA –2019
Version 1
Page 10 of 19
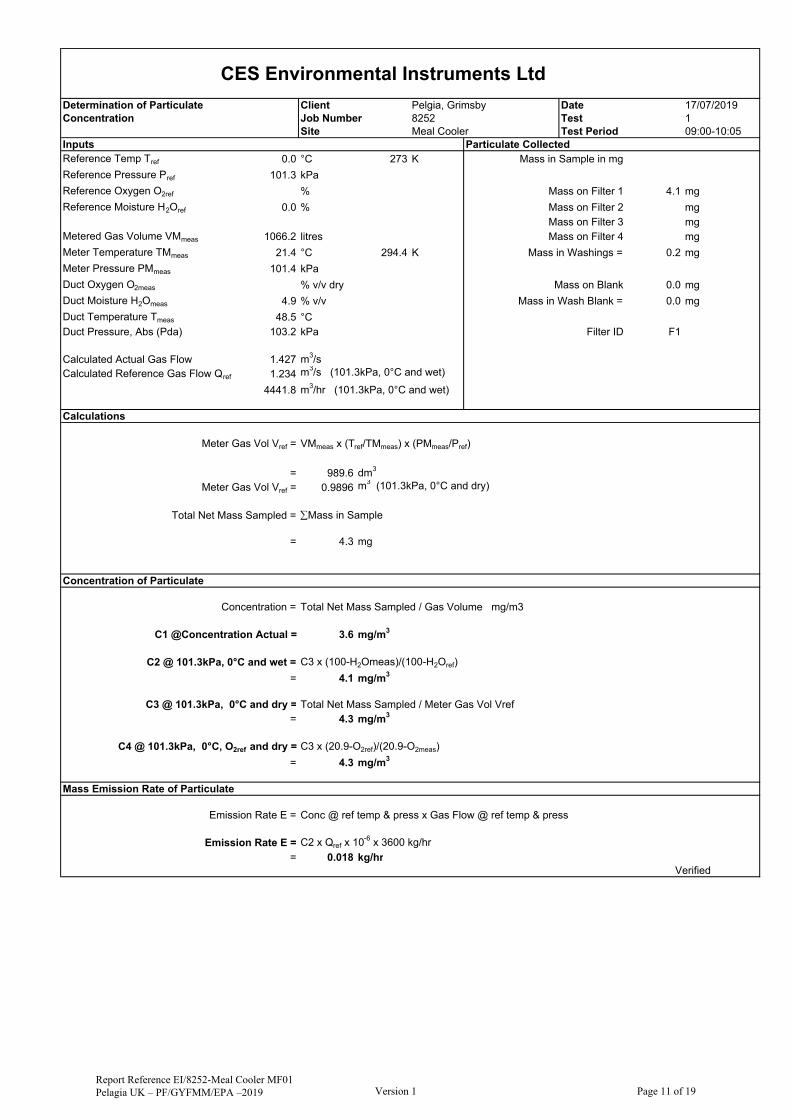
CES Environmental Instruments Ltd
Determination of Particulate Client Pelgia, Grimsby Date 17/07/2019Concentration Job Number 8252 Test 1
Site Meal Cooler Test Period 09:00-10:05Inputs Particulate CollectedReference Temp Tref 0.0 °C 273 K Mass in Sample in mg
Reference Pressure Pref 101.3 kPa
Reference Oxygen O2ref % Mass on Filter 1 4.1 mg
Reference Moisture H2Oref 0.0 % Mass on Filter 2 mgMass on Filter 3 mg
Metered Gas Volume VMmeas 1066.2 litres Mass on Filter 4 mg
Meter Temperature TMmeas 21.4 °C 294.4 K Mass in Washings = 0.2 mg
Meter Pressure PMmeas 101.4 kPa
Duct Oxygen O2meas % v/v dry Mass on Blank 0.0 mg
Duct Moisture H2Omeas 4.9 % v/v Mass in Wash Blank = 0.0 mg
Duct Temperature Tmeas 48.5 °CDuct Pressure, Abs (Pda) 103.2 kPa Filter ID F1
Calculated Actual Gas Flow 1.427 m3/sCalculated Reference Gas Flow Qref 1.234 m3/s (101.3kPa, 0°C and wet)
4441.8 m3/hr (101.3kPa, 0°C and wet)
Calculations
Meter Gas Vol Vref = VMmeas x (Tref/TMmeas) x (PMmeas/Pref)
= 989.6 dm3
Meter Gas Vol Vref = 0.9896 m3 (101.3kPa, 0°C and dry)
Total Net Mass Sampled = Mass in Sample
= 4.3 mg
Concentration of Particulate
Concentration = Total Net Mass Sampled / Gas Volume mg/m3
C1 @Concentration Actual = 3.6 mg/m3
C2 @ 101.3kPa, 0°C and wet = C3 x (100-H2Omeas)/(100-H2Oref)
= 4.1 mg/m3
C3 @ 101.3kPa, 0°C and dry = Total Net Mass Sampled / Meter Gas Vol Vref= 4.3 mg/m3
C4 @ 101.3kPa, 0°C, O2ref and dry = C3 x (20.9-O2ref)/(20.9-O2meas)
= 4.3 mg/m3
Mass Emission Rate of Particulate
Emission Rate E = Conc @ ref temp & press x Gas Flow @ ref temp & press
Emission Rate E = C2 x Qref x 10-6 x 3600 kg/hr
= 0.018 kg/hrVerified
Report Reference EI/8252-Meal Cooler MF01 Pelagia UK – PF/GYFMM/EPA –2019
Version 1
Page 11 of 19
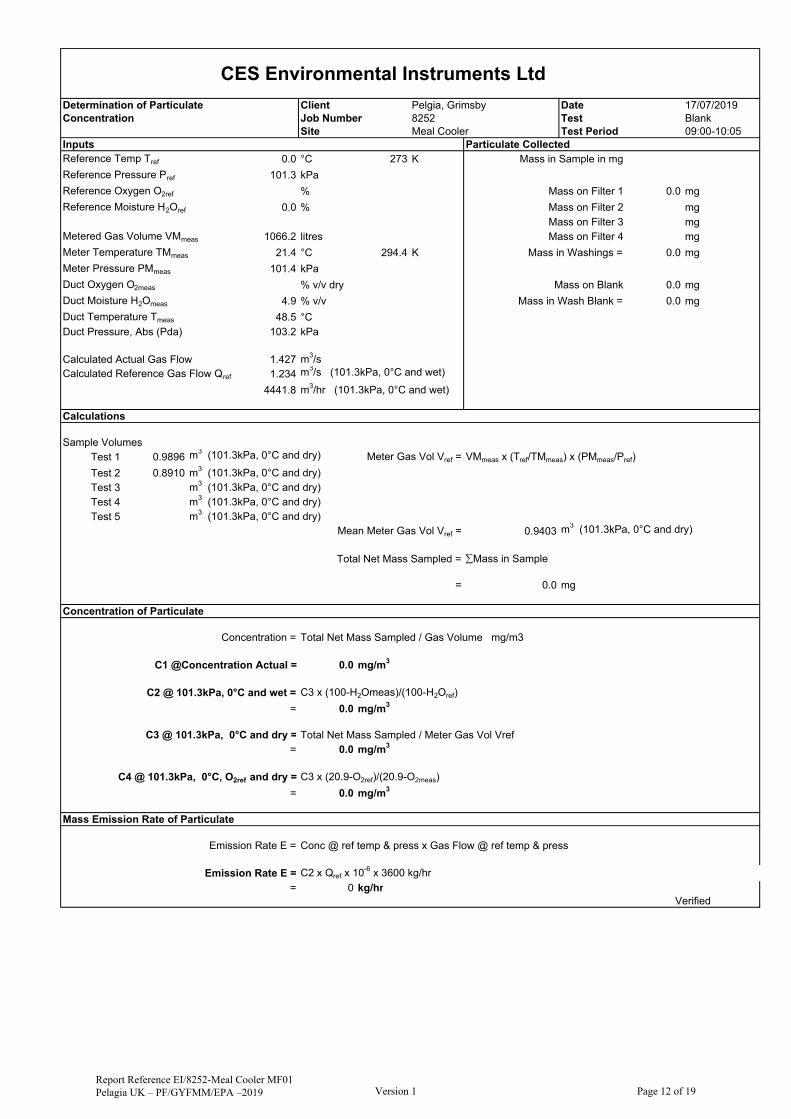
CES Environmental Instruments Ltd
Determination of Particulate Client Pelgia, Grimsby Date 17/07/2019Concentration Job Number 8252 Test Blank
Site Meal Cooler Test Period 09:00-10:05Inputs Particulate CollectedReference Temp Tref 0.0 °C 273 K Mass in Sample in mg
Reference Pressure Pref 101.3 kPa
Reference Oxygen O2ref % Mass on Filter 1 0.0 mg
Reference Moisture H2Oref 0.0 % Mass on Filter 2 mgMass on Filter 3 mg
Metered Gas Volume VMmeas 1066.2 litres Mass on Filter 4 mg
Meter Temperature TMmeas 21.4 °C 294.4 K Mass in Washings = 0.0 mg
Meter Pressure PMmeas 101.4 kPa
Duct Oxygen O2meas % v/v dry Mass on Blank 0.0 mg
Duct Moisture H2Omeas 4.9 % v/v Mass in Wash Blank = 0.0 mg
Duct Temperature Tmeas 48.5 °CDuct Pressure, Abs (Pda) 103.2 kPa
Calculated Actual Gas Flow 1.427 m3/sCalculated Reference Gas Flow Qref 1.234 m3/s (101.3kPa, 0°C and wet)
4441.8 m3/hr (101.3kPa, 0°C and wet)
Calculations
Sample VolumesTest 1 0.9896 m3 (101.3kPa, 0°C and dry) Meter Gas Vol Vref = VMmeas x (Tref/TMmeas) x (PMmeas/Pref)
Test 2 0.8910 m3 (101.3kPa, 0°C and dry)Test 3 m3 (101.3kPa, 0°C and dry)Test 4 m3 (101.3kPa, 0°C and dry)Test 5 m3 (101.3kPa, 0°C and dry)
Mean Meter Gas Vol Vref = 0.9403 m3 (101.3kPa, 0°C and dry)
Total Net Mass Sampled = Mass in Sample
= 0.0 mg
Concentration of Particulate
Concentration = Total Net Mass Sampled / Gas Volume mg/m3
C1 @Concentration Actual = 0.0 mg/m3
C2 @ 101.3kPa, 0°C and wet = C3 x (100-H2Omeas)/(100-H2Oref)
= 0.0 mg/m3
C3 @ 101.3kPa, 0°C and dry = Total Net Mass Sampled / Meter Gas Vol Vref= 0.0 mg/m3
C4 @ 101.3kPa, 0°C, O2ref and dry = C3 x (20.9-O2ref)/(20.9-O2meas)
= 0.0 mg/m3
Mass Emission Rate of Particulate
Emission Rate E = Conc @ ref temp & press x Gas Flow @ ref temp & press
Emission Rate E = C2 x Qref x 10-6 x 3600 kg/hr
= 0 kg/hrVerified
Report Reference EI/8252-Meal Cooler MF01 Pelagia UK – PF/GYFMM/EPA –2019
Version 1
Page 12 of 19

CES Environmental Instruments Ltd
Determination of Gas Flows Client Pelgia, Grimsby Date 17/07/2019By Pitot Tube, with Dalton Corrections Job Number 8252 Test 2Determination of Particulate Conentration Site Meal Cooler Test Period 10:15-11:20Type of tube (E/S) S Metered Gas Reading (Start) 1293.5016 m³ Leak CorrectionPitot Factor, Cp 0.76 Metered Gas Reading (End) 1294.4864 m³ 0.0000 m³Duct Shape (Round/Rectangular) Round Metered Correction 0.9794Duct Diameter 0.400 m Metered Gas Volume VMmeas 964.5 litres
Duct Area 0.126 m2Meter Temperature TMmeas 22.8 °C
Nozzle Diameter 6.0 mm Meter Pressure PMmeas 760.5 mmHg
Differential Meter Press (Pme) 0 mmH2O
@ 43.9756 Barometric Pressure (Pb) 760.5 mmHgDifferential Duct Press(Pd) 185.0 mmH2O
Duct Pressure, Abs (Pda) 774.1 mmHgVelocity Traverse Moisture CollectionLine A BTraverse data (D %)
p(mmH2O)
Temp (°C)
p(mmH2O)
Temp (°C)
h (mmH2O)
h (mmH2O) Vessel Wt on
(g)Wt off
(g) W (g)
25.0 12.5 48.0 12.1 49.0 3.536 3.479 Trap 1 682.3 713.6 31.375.0 12.6 48.0 12.5 49.0 3.550 3.536 Trap 2 710.2 720.6 10.4
Trap 3 0.0Trap 4 0.0Trap 5 0.0Trap 6 0.0Trap 7 0.0
Total Weight Gain (g) = 41.7
H2O Gas Vol @stp = W/18 x 22.412
Totals 25.10 96.00 24.60 98.00 7.085 7.014 H2O Vol = 51.92 litres
Line Mean 12.55 48.00 12.30 49.00 3.543 3.507 Metered Sample Vol @stp = V. 273 x PmOverall Mean h mean: 12.43 Temp mean: 48.50 °C h mean: 3.525 Tm + 273 760
Sample Vol @stp = 890.75 litresMean Flue Gas Temperature (in K) = 321.50Permitted Gas Temperature Range (°C) = 32.4 to 64.6Highest Pitot-Static Reading (either sampling line) (in Pa) = 123.57 % moisture = H2O Gas Vol stp x 100
Lowest Pitot-Static Reading (either sampling line) (in Pa) = 118.66 Vol stp + H20 (vol gas stp)
Ratio Highest/Lowest = 1.0 (Maximum Permitted Ratio = 9 :1) = 5.51
Sampling GridLine A BTraverse data (D %)
Temp (°C)
p(mmH2O)
H(mmH2O)
Temp (°C)
p(mmH2O)
H(mmH2O)
Duration of Sampling (s)
Duration of Sampling (s) K Factor % Isokinetic
25.0 48.0 12.5 28.9 48.0 14.0 32.3 900 900 2.31 101.2075.0 48.0 12.5 28.9 49.0 14.0 32.3 900 900
Gas Composition
Gas Composition MW Mole Fraction = (1- H2O/100 x Dry%) x (MW Gas/100)Dry N2 % v/v 78.997 28.00 20.901
Dry O2 % v/v 21.000 32.00 6.350
Dry CO2 % v/v 0.003 44.00 0.001
Total % 100.000
Wet H2O% v/v 5.508 18.00 0.991
Molecular Weight of Wet Gas = Mole Fraction (M) = 28.2434
Molecular Weight of Dry Air = 28.8400
Specific Gravity S = Molecular Wt Wet GasMolecular Wt Dry Gas
S = 0.9793
Velocity and Volume Gas Flow
Actual Gas Velocity = 34.97 K x h x Cp 321.50 21863.301 0.014705 0.1212642M x (Pb + Pd)
Actual Gas Velocity = 11.36 m/s Highest Gas Velocity = 11.4 m/sLowest Gas Velocity = 11.2 m/s
Ratio Highest/Lowest = 1.0 (Maximum Permitted Ratio = 3 :1)
Gas Flow (actual) = Vel x Duct Area (m3/s)
= 1.43 m3/s
Gas Flow (ref wet) = Gas Flow (actual) x 273 x Pb + Pd m3/s (760mmHg, 0°C and wet) K 760
= 1.235 m3/s (760mmHg, 0°C and wet)
= 4446.6 m3/hr (760mmHg, 0°C and wet)Verified
A B
A B
Report Reference EI/8252-Meal Cooler MF01 Pelagia UK – PF/GYFMM/EPA –2019
Version 1
Page 13 of 19

CES Environmental Instruments Ltd
Determination of Particulate Client Pelgia, Grimsby Date 17/07/2019Concentration Job Number 8252 Test 2
Site Meal Cooler Test Period 10:15-11:20Inputs Particulate CollectedReference Temp Tref 0.0 °C 273 K Mass in Sample in mg
Reference Pressure Pref 101.3 kPa
Reference Oxygen O2ref % Mass on Filter 1 3.4 mg
Reference Moisture H2Oref 0.0 % Mass on Filter 2 mgMass on Filter 3 mg
Metered Gas Volume VMmeas 964.5 litres Mass on Filter 4 mg
Meter Temperature TMmeas 22.8 °C 295.8 K Mass in Washings = 0.1 mg
Meter Pressure PMmeas 101.4 kPa
Duct Oxygen O2meas % v/v dry Mass on Blank 0.0 mg
Duct Moisture H2Omeas 5.5 % v/v Mass in Wash Blank = 0.0 mg
Duct Temperature Tmeas 48.5 °CDuct Pressure, Abs (Pda) 103.2 kPa Filter ID F2
Calculated Actual Gas Flow 1.428 m3/sCalculated Reference Gas Flow Qref 1.235 m3/s (101.3kPa, 0°C and wet)
4446.6 m3/hr (101.3kPa, 0°C and wet)
Calculations
Meter Gas Vol Vref = VMmeas x (Tref/TMmeas) x (PMmeas/Pref)
= 891.0 dm3
Meter Gas Vol Vref = 0.8910 m3 (101.3kPa, 0°C and dry)
Total Net Mass Sampled = Mass in Sample
= 3.5 mg
Concentration of Particulate
Concentration = Total Net Mass Sampled / Gas Volume mg/m3
C1 @Concentration Actual = 3.2 mg/m3
C2 @ 101.3kPa, 0°C and wet = C3 x (100-H2Omeas)/(100-H2Oref)
= 3.7 mg/m3
C3 @ 101.3kPa, 0°C and dry = Total Net Mass Sampled / Meter Gas Vol Vref= 3.9 mg/m3
C4 @ 101.3kPa, 0°C, O2ref and dry = C3 x (20.9-O2ref)/(20.9-O2meas)
= 3.9 mg/m3
Mass Emission Rate of Particulate
Emission Rate E = Conc @ ref temp & press x Gas Flow @ ref temp & press
Emission Rate E = C2 x Qref x 10-6 x 3600 kg/hr
= 0.017 kg/hrVerified
Report Reference EI/8252-Meal Cooler MF01 Pelagia UK – PF/GYFMM/EPA –2019
Version 1
Page 14 of 19
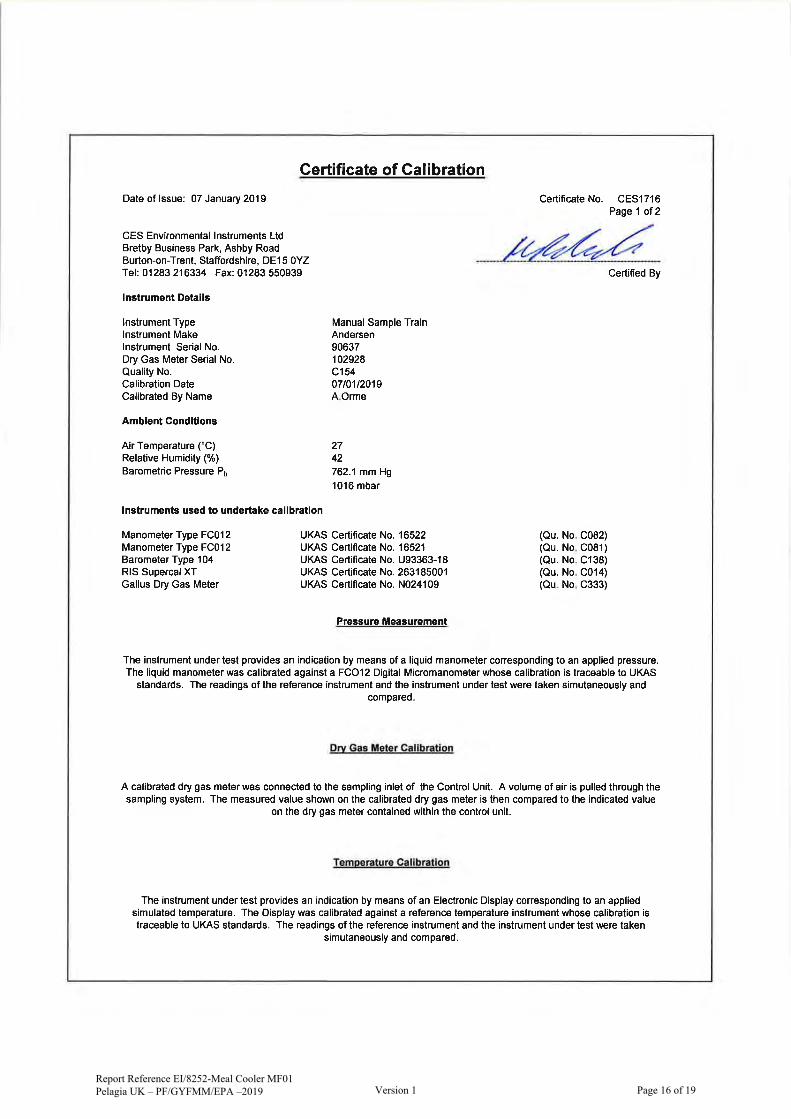
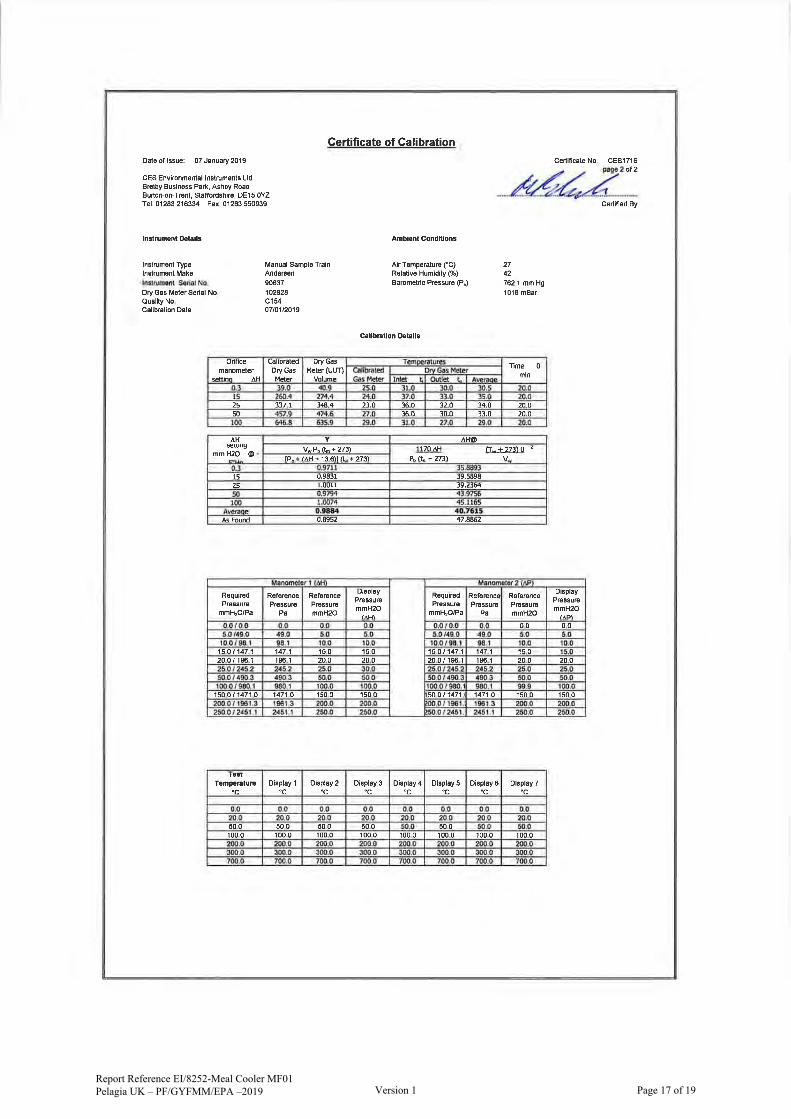
Appendix 4 Calibration Certificates
Report Reference EI/8252-Meal Cooler MF01 Pelagia UK – PF/GYFMM/EPA –2019
Version 1
Page 15 of 19
Report Reference EI/8252-Meal Cooler MF01 Pelagia UK – PF/GYFMM/EPA –2019
Version 1
Page 16 of 19
Report Reference EI/8252-Meal Cooler MF01 Pelagia UK – PF/GYFMM/EPA –2019
Version 1
Page 17 of 19
Appendix 5 Uncertainty Calculations
Report Reference EI/8252-Meal Cooler MF01 Pelagia UK – PF/GYFMM/EPA –2019
Version 1
Page 18 of 19

Uncertainty calculation for EN 13284 Determination of low range mass concentration of dust, Manual Gravimetric Method
Measurement Equation
Limit value (ELV) 20 mg.m-3Reference oxygen % by volume
Measured concentration 4.14 mg.m-3 (at reference conditions)
Measured Quantities Symbol Value Standard uncertainty Units Uncertainty as percentageUncertainty at lv Requirement of std
Sampled Volume Vm 0.9896 uVm 0.001 m30.10 <=2%
Sampled gas Temperature Tm 273 uTm 2 k 0.73 <=1%
Sampled gas Pressure ρm 101.3 uρm 0.1 kPa 0.10 <=1%
Sampled gas Humidity Hm 0 uHm 1 % by volume 1.00 <=1%
Oxygen content O2,m uO2,m 0.1 % by volume #DIV/0! <=5%
Mass particulate m 4.1 um 0.26 mg 6.34 1.31 <5% of limit value
Note - Sampled gas humidity, temperature and pressure are values at the gas meterLeak L 2 % 2.00 <=2%
Uncollected Mass UCM 0.2 mg 4.87804878 <=10%
(Instack filter - no rinse)Intermediate calculations
Factor for std conds fs 1.00
uncertainty components symbol sensitivity coeff u (in units of fs)
ρm 0.010 0.001
Hm 0.010 0.010
Tm 0.004 0.007
ufs 0.012 1.24
Corrected volume V 0.99 uV 0.012 m31.25
Factor for O2 correction fc 1.00
uncertainty components symbol sensitivity coeff u
O2,m 0.05 0.005
Factor for O2 Correction ufc 1.00 0.005 0.48
Parameter Value Units Sensitivity coeff Uncertainty contribution Uncertainty as %
Corrected Volume (standard co V 0.99 m3 4.19 0.05 mg.m-3 1.25 %
Mass m 4.10 mg 1.01 0.26 mg.m-3 6.34 %
Factor for O2 Correction fc 1.00 4.14 0.02 mg.m-3 0.48 %
Leak L 0.05 mg.m-3 1.00 0.05 mg.m-3 1.15 %Uncollected mass UCM 0.12 mg 1.01 0.12 mg.m-3
2.82 %
Combined measurement uncertainty 0.30 mg.m-3
Expanded uncertainty as percentage of measured value 14.32 % measured of value expressed with a level of confidence of 95%(Using a coverage factor k=2)
Expanded uncertainty in units of measurement 0.59 mg.m-3
Expanded uncertainty as percentage of limit value 2.97 % ELV
Verified
sm fVV
m
refc O
Of
,2
,2
21
21
cfVmc
3.101
273
100
)100( m
m
ms T
Hf
8252-Meal Cooler-PM Uncertainty
Report Reference EI/8252-Meal Cooler MF01 Pelagia UK – PF/GYFMM/EPA –2019
Version 1
Page 19 of 19