7⃣fa❓s (& the ✅s)
TRANSCRIPT

7 frequently asked questions...(..& the answers)

! FA❓(..& the ✅s)

How's the integration going...?

$, 😂 Or 😍 ❓


💰💰💰💰💰💰💰💰💰💰

💰💰💰💰💰💰💰💰

🍒🍎🍏🍉📈YoY❓

Total fruit tons
60,000
77,500
95,000
112,500
130,000
Jul Aug Sep Oct Nov Dec Jan Feb Mar Apr May Jun

New🌴🌴🌴🌴❓

🔍🔍💰💰

EHP immature hectares
20,000
30,000
40,000
50,000
60,000
2013 2014 2015 2016
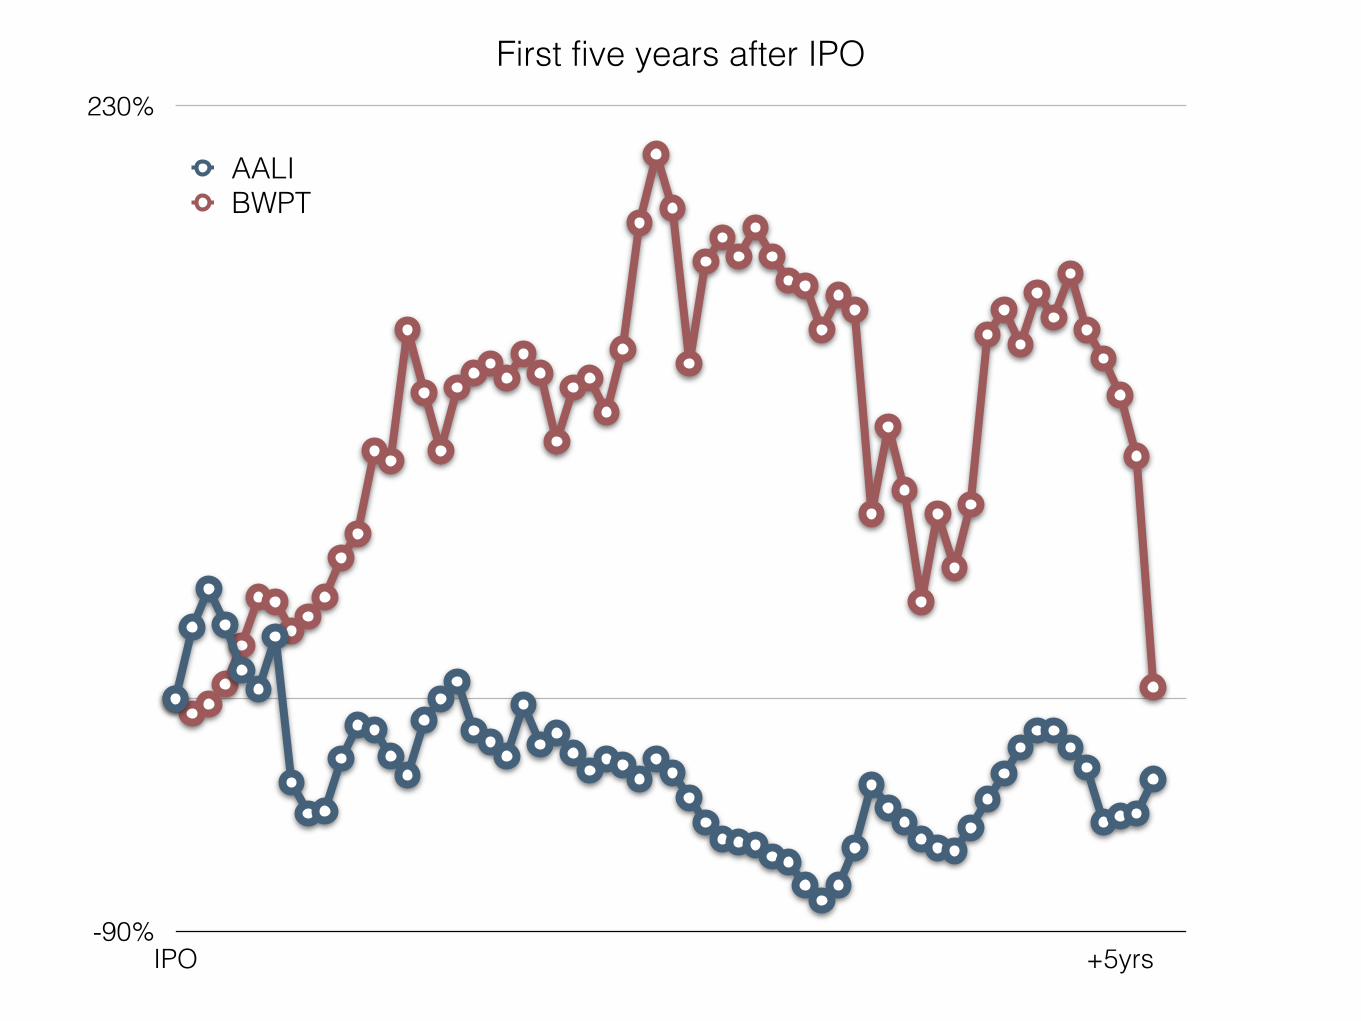
First five years after IPO
-90%
230%
IPO +5yrs
AALIBWPT

Second five years after IPO
IPO +10 years
AALIBWPT

/🌗💰👎❓

🍒🍎🍏🍉📉

New mature hectares

Interest expense = mature %
30%
70%
MatureImmature

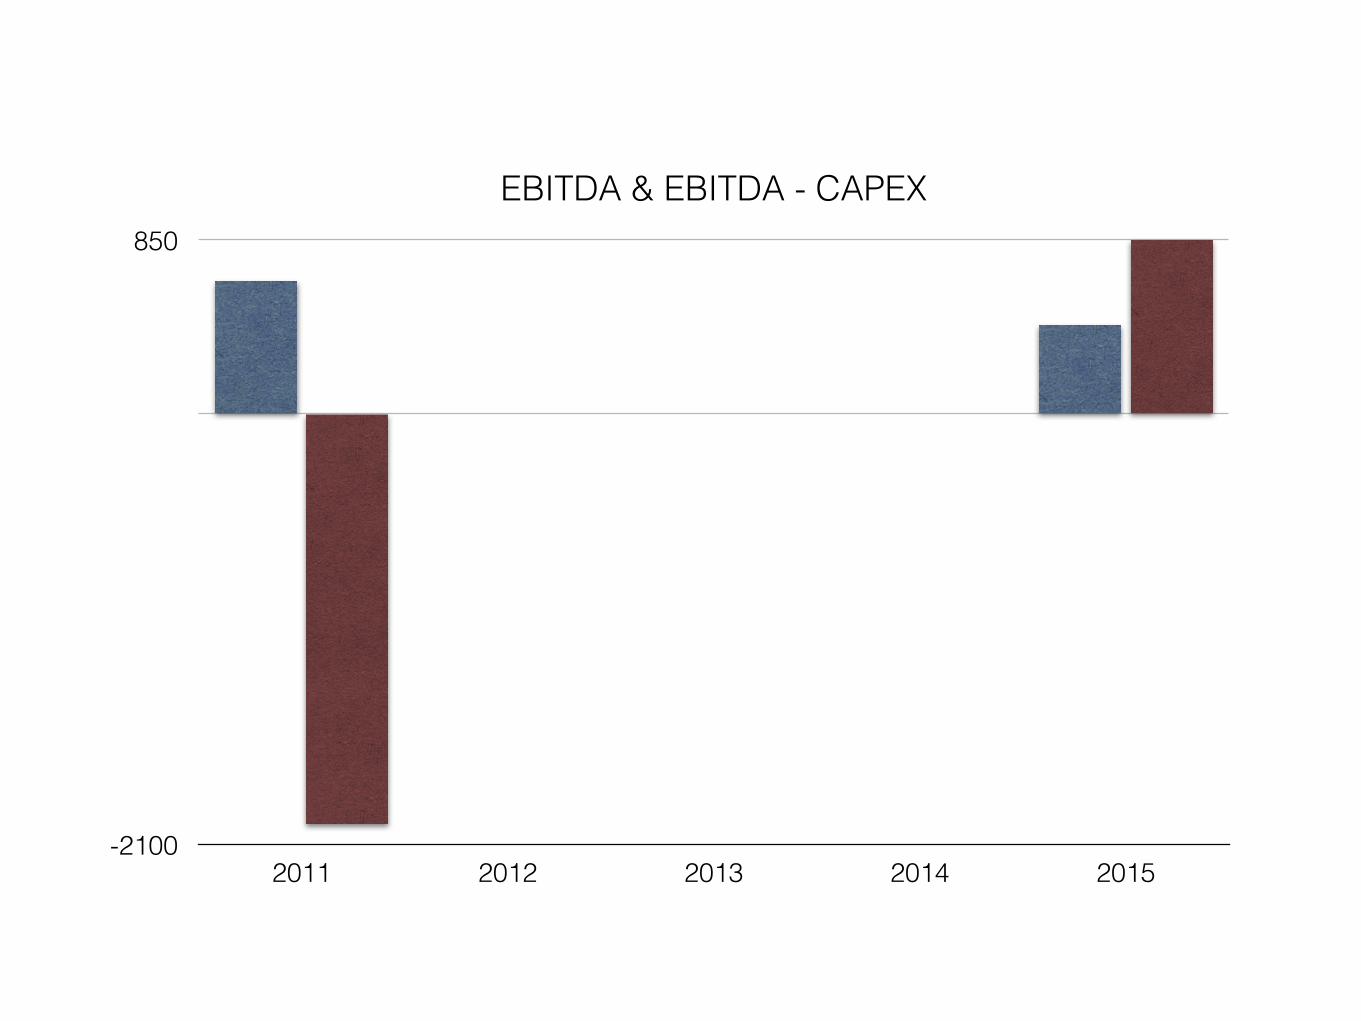
& it's not surprising...

EBITDA
-2100
850
2011 2012 2013 2014 2015

EBITDA & EBITDA - CAPEX
-2100
850
2011 2012 2013 2014 2015

/🌗💰333

How to make Eagle high plantations forecast ?


Age Hectares Yield Production
Prime 14,667 25.9 379,88613up
Mature 15,386 22.7 349,2599-12
Young 72,280 12.6 910,7294-8
1,639,875

Sales forecast, RpmNucleus Fruits 1,639,875FFB 6% 98,392
1,541,482OER 23.7% 365,331KER 3.9% 60,118

Sales forecast, RpmNucleus Fruits 1,639,875FFB 6% 98,392
1,541,482OER 23.7% 365,331KER 3.9% 60,118PriceOil 8.0 2,922,650Kernel 4.5 270,530FFB 1.3 127,910Sales 3,321,091

Cash cost per hectare, Rpm 2014Fertilizing & maintenance 6.6Harvesting 2.7Mill 0.9G&A 3.9
1 Plantation Cost 14.12 Opex 4.03 Cash Cost per Hectares(1+2) 18.1

Cash cost per hectare, Rpm 2014Fertilizing & maintenance 6.6Harvesting 2.7Mill 0.9G&A 3.9
1 Plantation Cost 14.12 Opex 4.03 Cash Cost per Hectares(1+2) 18.1
Mature hectares 102,000Cash cost 1,845,580

EBITDA, Rpm
Cash cost 1,845,580Sales 3,321,091EBITDA 1,475,510

EHP Balance sheet, Rpm1H 2015
Mature plantation 6,844,960Immature plantation 2,079,095Addition to immature 175,413PPE 131,988Capex 307,401Debt 7,462,292Equity 6,874,922

EHP Balance sheet, Rpm1H 2015
Addition to immature 175,413PPE 131,988Capex 307,401

EHP Balance sheet, Rpm1H 2015
Addition to immature 175,413PPE 131,988Capex 307,401
Annualized Capex per hectare 17.62015 Immature hectares 38,0002015 capex 667,499

EBITDA & EBITDA - CAPEX
-2100
850
2011 2012 2013 2014 2015
EBITDA & EBITDA - CAPEX
-2100
850
2011 2012 2013 2014 2015

El N💦☁☀❓

Palm oil price & El Ninos
$0
$350
$700
$1,050
$1,400
1960 2015
V strongStrongModerateWeak

Average monthly movement 0.4% EL Nino 1.6%
Current EL Nino 0%

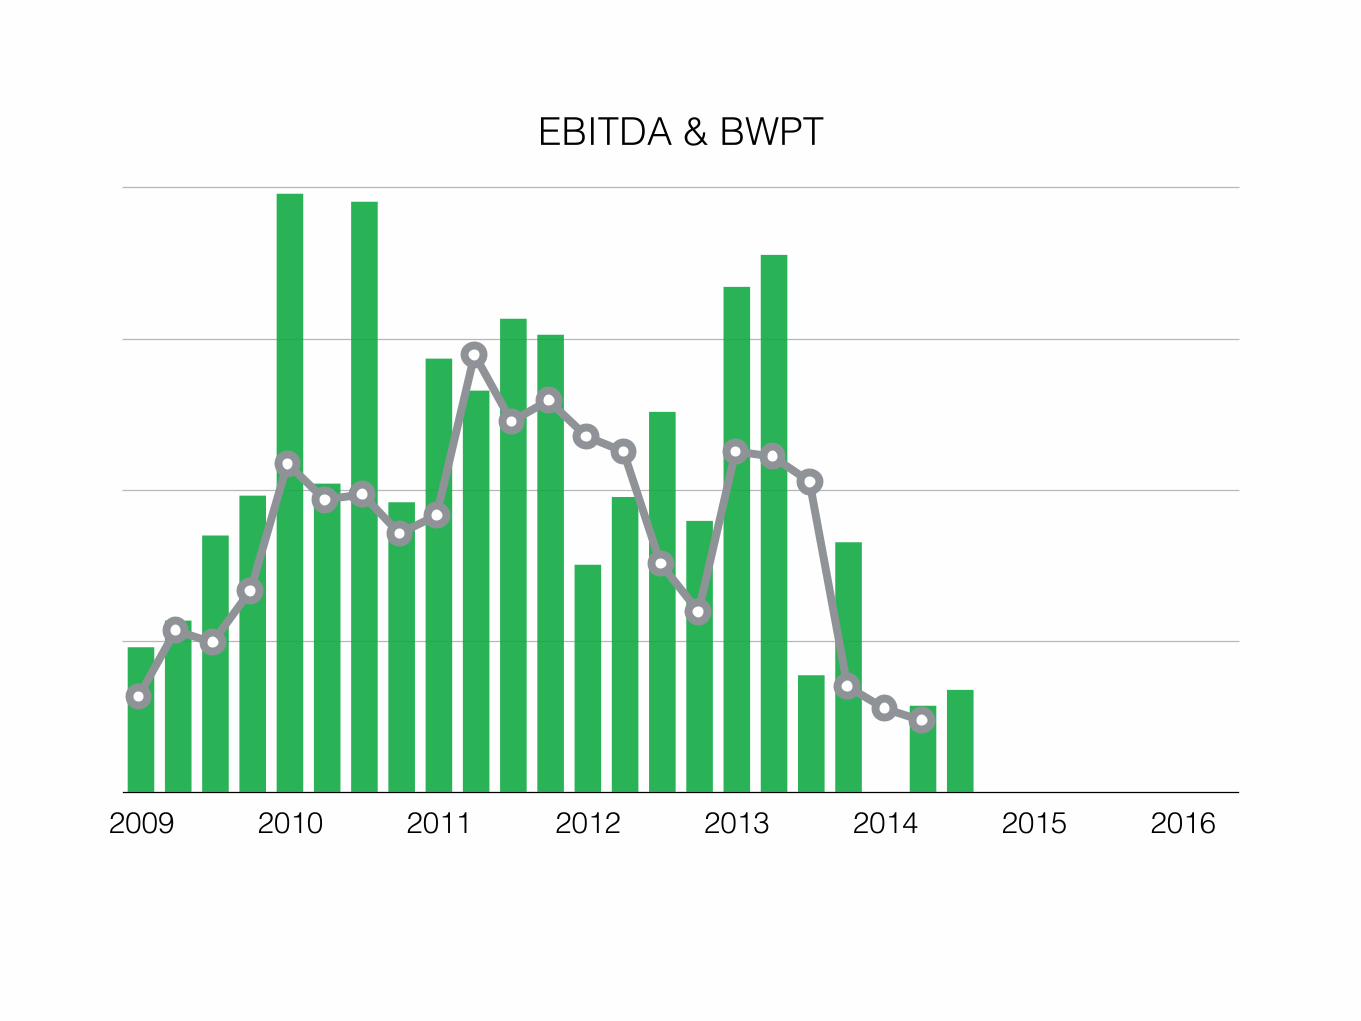
FGV 💲💲💲⬆😑😑😑❓

EBITDA & BWPT
2009 2010 2011 2012 2013 2014 2015 2016
EBITDA & BWPT
2009 2010 2011 2012 2013 2014 2015 2016

EBITDA & BWPT
2009 2010 2011 2012 2013 2014 2015 2016

EBITDA & BWPT
2009 2010 2011 2012 2013 2014 2015 2016
