785061 duc
DESCRIPTION
yes it is a very interesting IoT articleTRANSCRIPT
Research ArticleLarge-Scale Mobile Sensing Enabled Internet-of-ThingsTestbed for Smart City Services
Jorge Lanza, Luis Sánchez, Luis Muñoz, José Antonio Galache, Pablo Sotres,Juan R. Santana, and Verónica Gutiérrez
Network Planning and Mobile Communications Laboratory, University of Cantabria, 39005 Santander, Spain
Correspondence should be addressed to Luis Munoz; [email protected]
Received 30 March 2015; Revised 6 July 2015; Accepted 8 July 2015
Academic Editor: Paolo Bellavista
Copyright © 2015 Jorge Lanza et al. This is an open access article distributed under the Creative Commons Attribution License,which permits unrestricted use, distribution, and reproduction in any medium, provided the original work is properly cited.
Smart cities are one of the key application domains for the Internet-of-Things paradigm. Extending the Web into the physicalrealm of a city, by means of the widespread deployment of spatially distributed Internet-addressable devices with sensing and/oractuation capabilities, allows improving efficiency of city services. Vehicles moving around the city become excellent probes whenthe objective is to gather information across the city in a cost effective manner. Public transportation fleets, taxis, or vehicles suchas waste collection trucks cover most of the urban areas with a limited number of vehicles. This paper presents the deployment of alarge scale Internet-of-Things testbed that has been carried out in the city of Santander. It extends previous descriptions by providinga specification of one of the unique features of the testbed, namely, the devices that have been installed on 140 buses, taxis, and vansthat every day drive around the city. Besides the physical characteristics of the devices installed and the lessons learnt during thedeployment, the paper introduces the three mobile sensing network strategies used for distributing the data gathered. Finally, thepaper sketches some of smart city services which might be provided using the information coming from the mobile IoT devices.
1. Introduction
Improving efficiency of city services and facilitating a moresustainable development of cities are the main drivers ofthe smart city concept. The growth and change in cities areaccelerating and make it even harder to provide a sustainableurban living environment [1]. The use of an Information andCommunication Technologies- (ICT-) based infrastructurealongside the traditional utilities and services infrastructureswill be the next big step in the development of cities [2, 3].Information systems will help to optimise infrastructure,inform citizens, and build a communication network thatspans the city and allows tailoring the utility and servicesdelivery to the actual needs rather than to overprovisionfor peak demands; in turn, the confluence of ICT and cityservices will fuel economic growth and prosperity and willform new city ecosystems. This revolution is still only at thebeginning as suitable infrastructures are being deployed andsignificant investments into the city infrastructures are beingmade.
Based on this precept, the SmartSantander project [4]targeted the creation of a European experimental test facilityfor the research and experimentation of architectures, keyenabling technologies, services, and applications for theInternet of Things (IoT) in the context of a smart city. Thisfacility aims to leverage key IoT-enabling technologies and toprovide the research community with a unique-in-the-worldplatform for large-scale IoT experimentation and evaluationunder real-world operational conditions. The objectives ofSmartSantander’s deployed IoT infrastructure are two-foldas well as concurrent. As a testbed, it enables experimentalassessment of cutting-edge scientific research. However, thistestbed goes beyond the experimental validation of novel IoTtechnologies. It also aims at supporting the assessment of thesocioeconomical acceptance of new IoT solutions and thequantification of service usability and performance with endusers in the loop.
To attract the widest interest and demonstrate the use-fulness of the SmartSantander platform, the deployment ofthe IoT experimentation infrastructure has been undertaken
Hindawi Publishing CorporationInternational Journal of Distributed Sensor NetworksVolume 2015, Article ID 785061, 15 pageshttp://dx.doi.org/10.1155/2015/785061

2 International Journal of Distributed Sensor Networks
to realise the most interesting and impact-generation exper-imentation scenarios. In this sense, part of the SmartSan-tander’s testbed is based on the deployment of 140 IoT deviceson vehicles that are continuously driving around the city.Such a deployment has, to the best of our knowledge, notany analogous one in any of the testbeds existing nowadaysin the world. In addition to enabling experimentation onvehicular networking technologies, IoT devices embarked onvehicles get, as mobile sensors, a variety of information withincreased capillarity in time and space that allows gatheringdata from all over the city in a much more efficient manner.This capacity for getting information from almost the wholecity area is critical in supporting the provision of smart cityservices.
Two main contributions are presented in this paper.Firstly, as the deployment of distributed multipurpose multi-stakeholder mobile IoT infrastructure is complexity-fraughtand not risk-averse (often a compromise over platform capa-bilities, overall usefulness, and cost), we regard the experiencegained and lessons learnt from our physical deploymentprocess as a valuable contribution. In this respect, the paperprovides detailed insight on the actual physical deploymentof 140 IoT devices embarked on buses, taxis, and other cityservices vehicles and how they interoperate with the rest ofdevices present at the SmartSantander IoT infrastructure.
It is, however, important to highlight, for the sake ofcompleteness, and to fully understand the technical relevanceof this first contribution, which are the main functionalitiesand related challenges that underlie the deployment andsetup of the experimental infrastructure. In this sense, theexperimentation possibilities enabled by existing testbeds,which are primarily focused on wireless sensor network(WSN) research, do not fully fulfill the testbed method-ologies needed to perform experimentally driven researchwhen moving from islands of WSNs to a global networkedinfrastructure—as envisioned by the Internet of Things. Thisvision opens up new challenges that demand new capabilitiesand features from suitable testbeds [5, 6]. Key features thathave been observed for the deployment of the SmartSan-tander platform in general and the mobile IoT devices inparticular to support the experimentationwhenmoving fromWSNs to IoT are (1) scale, (2) heterogeneity, (3) mobility, (4)experimentation realism, (5) data-centricity, (6) concurrency,and (7) autonomy.
Second contribution presented in the paper is the descrip-tion and discussion of the three strategies that are used toaddress the mobile crowd sensing challenge. Respectively,they are based on periodic reporting through mobile broad-band network, opportunistic Vehicle-to-Infrastructure (V2I)networking on top of IEEE 802.15.4 links, and Delay TolerantNetwork (DTN) approach using IEEE 802.11. Moreover,analytical assessment of the V2I-based strategy using realdata traces as obtained from the mobile IoT devices is alsopresented.
Finally, the description of two smart city services thatmake use of the data gathered by the embarked IoT devices isanother minor contribution presented in the paper. Present-ing these services is meant to showcase the potentiality of thedeployed infrastructure besides the experimentation support,
which focused on the analyses done. However, it is out ofthe scope of this paper to assess the deployment in terms ofhow the information gathered thanks to this deployment hasoptimized the city management.
The paper is organized as follows. In Section 2 relatedwork and research activities are summarized highlightingthe advances achieved by the contributions presented inthe paper. Section 3 provides insights on the deployed IoTinfrastructure. It first sketches the SmartSantander platformbefore focusing on the details and lessons learnt from theinstallation of IoT devices on vehicles. Results from theanalytical assessment of the strategies employed for mobilecrowd sensing data dissemination are presented in Section 4along with the description of the three data disseminationstrategies. In Section 5 two smart city applications exploitingthe information gathered by the mobile IoT devices deployedare described. Finally, Section 6 concludes the paper.
2. Related Work
This section overviews current trend in terms of applicationscenarios and main research path in vehicular networks(VANETs) and how the smart city applications describedin this paper represent an advance on the applicability ofVANETs.Then it outlines related real-world deployments andinitiatives in which vehicles are used as sensing platformscomparing them with the sensing infrastructure describedin this paper. Finally, a review of various mobile sensingproposals in the literature is presented comparing the archi-tecture and data dissemination strategies used with the onesimplemented in the SmartSantander mobile sensing testbed.
Many different services have been proposed in theliterature using VANETs like CarTel [7], TrafficView [8],or MobEyes [9]. These services are mainly focused onsafety applications like collision warning, up-to-date trafficinformation, or active navigation [10]. Thus, much of theexisting literature has focused on challenges around efficientdata dissemination [11] as it is of particular interest forsafety services. Anyway, the common denominator for themajority of applications is that they are navigation or roadsafety related and, thus, concentrate on the vehicles andcirculation domains rather than serving to domains outsidethe traffic circumstances. However, vehicular networks havethe potential to become important sensor platforms, forexample, for proactive urban monitoring and for sharing anddisseminating data of general interest. Each vehicle can senseone or more events (e.g., detecting toxic chemicals), processsensed data, and report this information to a common sensorplatform.
In this sense, the general philosophy of smart cities [2, 12]is a paradigm shift combining IoT and M2M infrastruc-tures with a citizen-centric model, all together leveragingmassive data collected by sensors, connected devices, socialapplications, and so forth. Most of the existing smart cityinitiatives with relevant sensor deployments like Santander[13], Barcelona [14], Oulu [15], or Cambridge [16] rely onstatic environments, with application-specific monitoringtasks. However, in the very last years, there are a num-ber of deployments and applications in which vehicles are

International Journal of Distributed Sensor Networks 3
being used to monitor different parameters of the city. TheCopenhagen Wheel [17], a project of the SENSEable CityLab at the Massachusetts Institute of Technology (MIT),places environmental sensors on the rear wheel of a bicyclewhich connects via Bluetooth to the cyclist smartphoneand from there potentially shared. However, to the best ofour knowledge, this was a short-term project with limitedpenetration and results. LIVE Singapore [18] is anotherproject fromMIT in collaboration with Singapore authoritieswhich is developing an open platform for the collection,the combination, and fusion as well as the distributionof real-time data that originate from a large number ofdifferent sources. Some of the information is taken fromtaxis investigating how in the future the system can bestreamlined in order to better match taxi supply and demand.Cab Spotting [19] traces San Francisco’s taxi cabs as theytravel throughout the Bay Area. The patterns traced by eachcab create a living map of city life that hints at economic,social, and cultural trends that are otherwise invisible. Thedeployment of vehicle-mounted sensing devices described inthis paper and the applications exploiting the informationgathered by them are much in line with these projects.They aim at using information captured through a vehicularnetwork on general-purpose applications within the smartcity scenario. Analogous experimental testbeds focused onmobility have also been deployed [5]. While a minority cancompare in the number of mobile devices [20], they do notcombine at similar scale fixed and mobile devices and theyare not deployed in real-world conditions. Large scale ofthe deployed infrastructure and its integration on a FutureInternet enabled platform are the key distinguishing noveltiesof the testbed presented in this paper.
Even though cities on developed countries can relyon the coverage of their territory with 3G or LTE highcapacity wireless access networks, the expected growth ofmobile data traffic might overwhelm these infrastructuresif another capillary network paradigm is not put forward[21]. Lee and Gerla [22] overviewed various wireless accessmethods in vehicular environments. However, the exactpotential of large-scale urban mobile capillary networks isstill to be exactly quantified. For example, the ubiquity ofWiFi access in urban areas makes this solution particularlyinteresting. Some studies have focused on its potential (e.g.,[23]), concluding that a relevant percentage of the datacan be offloaded from the cellular infrastructure in highdensity areas. Moreover, another interesting feature thathas been also explored is the ability of mobile sensingnodes to store the data, instead of periodically reporting itto sinks [24]. For example, MetroSense [25] proposes anarchitecture for mobile sensing: servers in the wired Internetare in charge of storing/processing sensed data; Internet-connected stationary gateways (GWs) act as sensor accesspoints between servers and mobile sensors (MS); MS movein the field opportunistically delegating tasks to each other,and “muling” [26] data to GW. The main data disseminationstrategy implemented for the SmartSantandermobile sensingdeployment is based on periodic reporting using cellularaccess network. However, opportunistic offloading of sensed
data through short- and medium-range wireless access tech-nologies such as IEEE 802.15.4 and IEEE 802.11 has also beenused. Analysis performed to real data traces obtained fromthe embarked devices has demonstrated the suitability, undercertain conditions, of the implemented mechanisms.
3. Large-Scale IoT Smart City Testbed
Setting an experimental facility into a city context has specialsignificance for three main reasons: (1) the pervasivenessof IoT-based technologies that form part of the smart cityinfrastructure fabric and the realism of experimentationachieved through their use; (2) the infrastructural scaleand heterogeneity (devices, protocols, and services) and thepopulation of users that are key enablers for a broad rangeof experimentation; (3) the diversity of problems and appli-cation domains in dense technosocial ecosystems such assmart cities that provide invaluable sources of challengingfunctional and nonfunctional requirements.
Before presenting the insights of the mobile sensingpart of the SmartSantander infrastructure, this section, first,briefly describes the SmartSantander platform high-levelarchitecture and the fixed part of the IoT infrastructure inorder to put the whole IoT deployment in context.
3.1. SmartSantander IoT Platform Reference Model. TheSmartSantander platform follows a three-tiered architectureconsisting of an IoT device tier, an IoTGW tier, and server tier.
The IoT node tier provides the necessary experimenta-tion substrate consisting of IoT devices. These devices aretypically resource-constrained (in terms of power, memory,and energy availability) and export sensing or actuatingcapabilities. This tier accounts for the majority of the devicesutilised in the testbed. Due to their outdoor deployment,these devices are subject to harsh environmental conditions(physical damage, weather influences, and power supply).For dependability, dual power supplies (electric distributionnetwork combined with batteries) and dual communicationinterfaces are installed. For reliability, multiple communi-cation paths to a gateway are enabled for sensor readingcollection and for maintenance (e.g., over-the-air firmwareand application updates) and a set ofmanagement proceduresare implemented to ensure rapid detection of malfunctioningnodes.
The IoT gateway node tier links the IoT devices at theedges of the network to a core network infrastructure. TheGW tier devices are typically more powerful than IoT nodesbut at the same can still be based on embedded devicearchitectures and are thus more resource-constrained thandevices of the server tier.
The server tier provides more powerful server deviceswhich are directly connected to the core network infrastruc-ture.The servers can be used to host IoT data repositories andapplication servers that can be configured to realise a varietyof different IoT services and applications or to investigateapproaches for real-world data mining and knowledge engi-neering.The server tier might benefit from virtualisation in acloud infrastructure, ensuring high reliability and availabilityof all components and services.

4 International Journal of Distributed Sensor Networks
The proposed architecture is agnostic to the communica-tion technologies between the different elements at the dif-ferent tiers. In this sense, realizations of the architecture canbe carried out using different communication technologiesbetween servers, GW nodes, and IoT nodes.
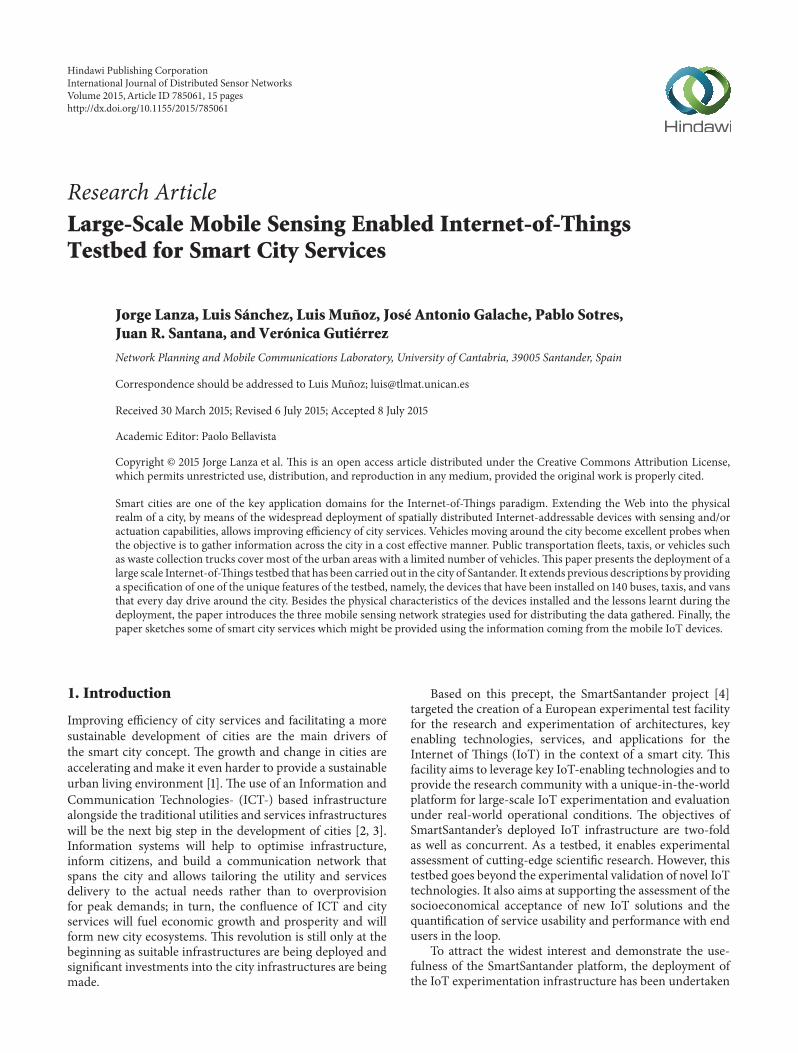
In order to realize this architecture, we propose a refer-ence model for IoT experimentation testbeds that encom-passes both testbed observation/management and IoT exper-imentation planes. We contend that such facilities require,as illustrated in Figure 1, the provision of testbed featuresby four main subsystems: (1) Authentication, Authorisation,and Accounting (AAA), (2) TestbedManagement, (3) Exper-imental Support, and (4) Application Support. The AAAsubsystem controls the access to the testbed by authenticatingusers, authorising the invocation of particular testbed ser-vices based on user privileges, and monitoring the level ofplatform-use by users. The Testbed Management subsystemencapsulates the functionalities concerning the automaticmanagement of the facility. The Experimentation SupportSubsystem (ESS) provides operations to assist the user duringthe entire experimentation life-cycle [27]. The ApplicationSupport Subsystem (ASS) offers, via its Application SupportInterface (ASI), a wide range of data management functionsthat can operate on information retrieved from the devices atthe IoT node tier.
In our referencemodel, each subsystem comprises severalfunctional blocks that implement the functionality expectedfrom the subsystem. Subsystems may span across the threetiers requiring different components or logic to be deployedat each tier. Subsystems export a number of interfaces. Inter-faces in our referencemodel architecture are notional entitiesthat expose the functionality of the different subsystemsthrough a collection of Application Programming Interfaces(APIs). In concrete instantiations of the reference model,these interfaces may be realised through technologies such asWeb Services, RESTful APIs, messaging protocols, or eventhandling to name but a few.
3.2. Fixed IoT Infrastructure. As reported in previous work[6], existing IoT experimentation facilities have several lim-itations that make them fail to provide adequate supportfor the emerging requirements of experimental IoT research.The SmartSantander facility [13] offers a variety of propertiesand features to overcome many of these shortcomings andintegrates them into a holistic experimentation environment.
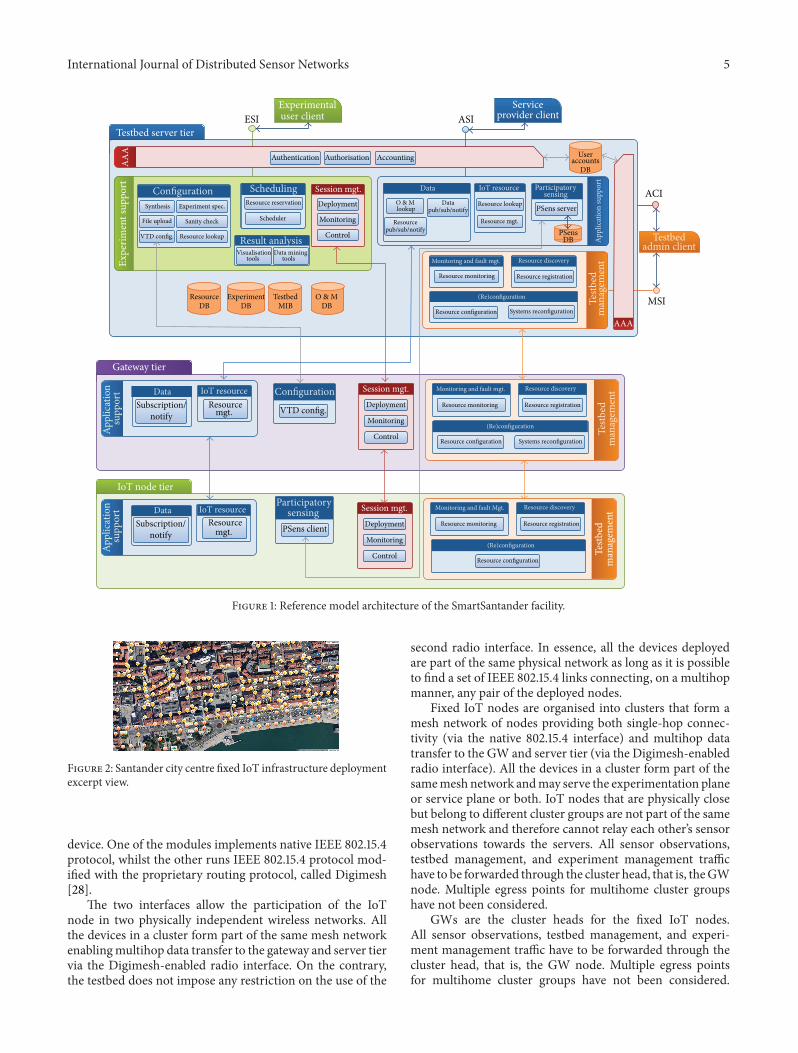
The IoT experimentation facility deployed in Santanderwas settled on a cyclic approach. The objective of the firstcycle of deployment was to create a meshed Wireless SensorNetwork (WSN) on fixed locations that would serve as a test-ing environment for the experimental validation of advancedWSN-related mechanisms. The deployment, also influencedby the city of Santander smart city service requirementsand strategy, intentionally provided a concentration of IoTdevices in the city centre (a 1 Km2 area) in order to achievethe maximum possible impact to the citizens. Nonetheless,other city areas are also covered.
Figure 2 shows an excerpt view of the Santander citycentre deployment. The different markers represent thedeployed nodes (i.e., carbon monoxide (CO), light intensity,
noise, temperature, and car presence detection sensors).Following the architecture described in the previous section,the deployment includes clusters of wireless sensors that useone gateway device acting as cluster head.
The first cycle of IoT deployment yielded 740 points ofpresence in the city. Each point of presence is equippedwith several sensors making a total of more than 50 noisesensors, 600 temperature sensors, 500 light intensity sensors,and 30 CO sensors. Additionally, 23GWs have been installedto ensure connectivity between the IoT node tier and theserver tier. In the second cycle, three fixed node clusterswere added to the infrastructure totalling approximately 50more IoT nodes supporting a smart irrigation use case witharound 170 additional sensors such as relative humidity,soil moisture, soil temperature, solar radiation, atmosphericpressure, rainfall, or water flow.
Although WSNs are typically considered autonomous interms of power needs, this assumption does not reconcilewith the envisaged high-frequency multiuser usage modelof the testbed. Energy autonomy is achieved through theuse of long-lasting batteries and, most importantly, energyefficient mechanisms. However, experimentation imposes astiffer power consumption penalty on IoT nodes that cannotbe realistically met by batteries alone.
A hybrid solution to IoT node power requirements wasadopted tominimise the infrastructure’s energy consumptionsignature on the power grid but ensure the survivability ofits experimentation nodes. To fulfill the need for proximityto a power source, sensor devices were attached to publiclampposts at a minimum of 3.5 meters high. The sensordevices are also endowed with rechargeable batteries and acharging circuit. This solution guarantees power supply evenunder energy-hungry experimentation scenarios.
Sensor nodes installed on lampposts are based on theATmega1281 microcontroller. Depending on the device, thecorresponding sensing probes are connected to a sensorboard placed on top of the main board. This enabled thedeployment of IoT nodes with diverse sensing capabilities,each with a configuration designed to support particularexperiment or smart city service classes.The sensing capabil-ities of our IoT devices include air quality (temperature andCO sensors), noise (noise sensor), temperature (temperaturesensor), luminosity (light and temperature sensors), irriga-tion monitoring sensor (temperature, relative humidity, soilmoisture, and soil temperature sensors), and environmentalstation (temperature, relative humidity, solar radiation, atmo-spheric pressure, anemometer, and rainfall sensors).
3.3. Testbed Intertier Connectivity. Intertier connectivity inthe SmartSantander testbed (the SantanderWSN) is arrangedthrough different communication technologies. This sectiondescribes the network topology of the facility. As illustratedin Figure 3, the most noteworthy characteristic of thesedevices in terms of communication capacities is that they areprovisioned to provide two separate wireless communicationchannels: one for the experimentation plane and one for themanagement/service plane. The solution adopted at the IoTnodes level was the inclusion of two XBee-Pro radio modules(operating at 2.4GHz frequency) on each lamppost sensor
International Journal of Distributed Sensor Networks 5
Testbed server tier
AAA
Appl
icat
ion Data
Subscription/IoT resource
Resource
Participatorysensing
PSens client
VTD config.
Session mgt.Deployment
Monitoring
Control
Session mgt.Deployment
Monitoring
Control
Monitoring and fault Mgt.
Resource monitoring
Resource discovery
Resource registration
Monitoring and fault mgt.
Resource monitoring
Resource discovery
Resource registration
Monitoring and fault mgt.
Resource monitoring
Resource discovery
Resource registration
Resource configuration
Testb
edm
anag
emen
tTe
stbed
man
agem
ent
(Re)configuration
Resource configuration Systems reconfiguration
(Re)configuration
Resource configuration Systems reconfiguration
(Re)configuration
supp
ort
Appl
icat
ion
supp
ort
notify
DataSubscription/
notify
mgt.
IoT resourceResource
mgt.
IoT node tier
Gateway tier
Testb
edm
anag
emen
t
ESI ASIExperimentaluser client
Serviceprovider client
AA
A
ACI
MSI
Expe
rimen
t sup
port Configuration
Synthesis
File upload
VTD config.
Experiment spec.
Sanity check
Resource lookup
Session mgt.Deployment
Monitoring
Control
Appl
icat
ion
supp
ort
User
Participatorysensing
PSens server
PSens
SchedulingResource reservation
Scheduler
Result analysisVisualisation
toolsData mining
tools
Authentication Authorisation Accounting
O & MDB
TestbedMIB
ExperimentDB
ResourceDB
accountsDB
DB
IoT resource
Resource mgt.
Resource lookup
Data
DataO & M
Resourcepub/sub/notify
pub/sub/notify
Testbedadmin client
lookup
Configuration
Figure 1: Reference model architecture of the SmartSantander facility.
Figure 2: Santander city centre fixed IoT infrastructure deploymentexcerpt view.
device. One of the modules implements native IEEE 802.15.4protocol, whilst the other runs IEEE 802.15.4 protocol mod-ified with the proprietary routing protocol, called Digimesh[28].
The two interfaces allow the participation of the IoTnode in two physically independent wireless networks. Allthe devices in a cluster form part of the same mesh networkenablingmultihop data transfer to the gateway and server tiervia the Digimesh-enabled radio interface. On the contrary,the testbed does not impose any restriction on the use of the
second radio interface. In essence, all the devices deployedare part of the same physical network as long as it is possibleto find a set of IEEE 802.15.4 links connecting, on a multihopmanner, any pair of the deployed nodes.
Fixed IoT nodes are organised into clusters that form amesh network of nodes providing both single-hop connec-tivity (via the native 802.15.4 interface) and multihop datatransfer to the GW and server tier (via the Digimesh-enabledradio interface). All the devices in a cluster form part of thesamemesh network andmay serve the experimentation planeor service plane or both. IoT nodes that are physically closebut belong to different cluster groups are not part of the samemesh network and therefore cannot relay each other’s sensorobservations towards the servers. All sensor observations,testbed management, and experiment management traffichave to be forwarded through the cluster head, that is, theGWnode. Multiple egress points for multihome cluster groupshave not been considered.
GWs are the cluster heads for the fixed IoT nodes.All sensor observations, testbed management, and experi-ment management traffic have to be forwarded through thecluster head, that is, the GW node. Multiple egress pointsfor multihome cluster groups have not been considered.

6 International Journal of Distributed Sensor Networks
Platform servers
Internet
Universityintranet
intranetCity council
GPRS
IoT nodeGatewayIEEE 802.15.4
IEEE 802.15.4 with DigimeshGPRS link
Cluster 1
Cluster 2Cluster 3
Figure 3: Testbed physical network diagram.
Depending onwhere theGW is deployed, several possibilitiesfor connecting them to the Internet, and thus to the PlatformServers, arise.Whenever it has been possible, GWs have beendeployed at one of the City Council or University premises.This kind of location allows direct access to a wired Intranet.If it is not possible to find such location, GPRS connection isused to connect the GW to the core network.
Platform Servers are directly connected to the corenetwork using the network of the University of Cantabria.
Connectivity for the IoT nodes deployed on vehiclesdiffers from the case of static ones. These devices are notpart of any cluster but they mainly use a GPRS connectionto directly report the observations captured by their sensorsand to support testbed and experimentation managementprocedures. However, as it will be described in the followingsection, wireless local area connectivity capabilities of someof the IoT devices mounted on vehicles allow these nodes toalso communicate with IoT fixed nodes network as long asthe vehicle on which they are mounted comes close to them.
3.4. Mobile Sensing Deployment. Once the high-level archi-tecture of the platform and the fixed part of the infrastructurehave been briefly introduced, in this section the details ofthe mobile sensing part of the SmartSantander experimentalfacility will be presented.
3.4.1. Mobile IoT Devices Description. Although the deploy-ment of fixed IoT devices is very representative as it massively
covers Santander city centre, it was necessary to extendthe environmental monitoring service to other areas of thecity. Hence, instead of continuing with fixed deploymentsall over the city, 140 new IoT devices were deployed onmunicipal public buses (84 of them), taxis (30 of them), andother municipal services’ vehicles (26 of them). This way, amuch wider area was covered in a much more efficient way.Using the enlarged number of measurement locations andintelligent processing of the measurements, it was possible toobtain sufficiently accurate measurements that are currentlyused as the initial indicator of the status of the environmentpollution.
Figure 4 shows the schema of the devices installed onthe vehicles. In order to support the additional requirementsimposed by the mobility of the nodes and to maximize theexperimentation possibilities over devices on such unrivalledlocation, the nodes are far more complex than their fixedcounterparts.
A modular approach has been followed to address thethree main functional requirements imposed to the mobilesensing devices: (1) Experimentation-Service provision dualityrefers to the duality that the deployed devices have withregard to their use as part of an environmental monitoringsmart city service, as well as their use as an experimen-tation laboratory; (2) Coexistence with the existing fixedSmartSantander infrastructure refers to the fact that accessfrom and to the devices should be possible through thealready existing platform not only at the server tier but

International Journal of Distributed Sensor Networks 7
Vehicle interior mounted Vehicle exterior mounted
GPS/GPRS
Environmental datacollection module
(Optional) localcommunication
module
(Opt
iona
l) CA
N-B
us co
nnec
tor
Main processing unit
Local
storage
IEEE 802.15.4or
IEEE 802.11
persistence
Figure 4: Mobile IoT device schema.
also on a peer-to-peer manner at the IoT device tier; and(3) Environmental monitoring sensing capacity refers to theenvironmental monitoring smart city service that expects toreceive air pollution information from the mobile sensingdevices.
The Main Processing Unit is based on an embedded PCrunning Linux operating systembased on a 32-bit ARM7pro-cessor. Since vehicles aremoving all over the city, the commu-nication towards the server tier cannot be handled through ashort-range wireless technology as it is the case with the fixeddevices. Thus, embarked nodes are equipped with a GeneralPacket Radio Service (GPRS) interface. However, IoT nodesinstalled on buses have a Local Communication Module. Thismodule has twodifferent configurations.Thefirst one is basedon an ATmega1281 microcontroller, equipped with a nativeIEEE 802.15.4 interface that allows them to communicatenot only with other devices deployed on other buses, withthe same module configuration, but also with the devicesinstalled on lampposts. This configuration (represented witha dashed border in Figure 4 due to its optionality) is onlypossible at the public buses since it is the only kind ofvehicle where an appropriate rooftop placeholder, shownin Figure 5(a), with Line of Sight (LOS) towards fixed IoTdevices could be found. Devices installed on taxis and othermunicipal services are mainly situated under the vehiclebonnet so, in our deployment, peer-to-peer communicationwith other IoT devices is not possible for those devices dueto radio signal degradation caused by metallic parts of thevehicle. Most of the 84 IoT devices deployed on buses arebuilt with this configuration. The second configuration forthe Local Communication Module integrates an IEEE 802.11interface that can only act in Basic Service Set (BSS) mode(a.k.a. infrastructuremode) so that it can connect to availableWiFi access points. Only 6 buses are equipped with an IoTdevice with this configuration.
It is important to highlight that the testbed allowscomplete reprograming of the microcontroller at the LocalCommunication Module, thus enabling a larger versatility ofthe devices for supporting advanced experimentation on topof them.
The Environmental Data Collection Module contains abunch of sensors for detecting air pollutants such as nitrogendioxide (NO
2), carbon monoxide (CO), and ozone (O
3) as
well as detection of particles in suspension, temperature,and air humidity. Installed on the rooftop, the sensors areprotected within an ABS box that is shown in Figure 5(b). Inthis box, the air inlet traverse a labyrinth designed to allow airflow while preventing water spills in the electronics.
Most significantly, mobile IoT devices are also equippedwithGPS so that all their observations come geolocalized andthey also report speed and course of the vehicle. Additionally,the nodes deployed on the Santander public buses provideinformation from the vehicles’ CAN-Bus (represented withdashed line in Figure 4 due to its optionality). The infor-mation taken from the vehicles is used to feed the trafficassessment service.
It is also important to mention that observation genera-tion (i.e., gathering of information from the device sensors)frequency is higher than the reporting (i.e., sending thisinformation to the repository at the server tier) one. In thissense, the IoT nodes have a sampling rate that is deliberatelyconfigured to generate a large number of observations. Asthe devices count with a Local Persistence Storage memory,the Environmental Data Collection Module is continuouslyproducing new observations.
3.4.2. Deployment Insights and Lessons Learnt. Apart frompresenting the mobile IoT nodes architecture and features, itis essential to highlight some issues that have been addressedduring the deployment or have arisen as lessons learnt.
Never forget that the deployed infrastructure aim is tosupport IoT experimentation, the more information that canbe captured, and the widest experimentation possibilitiesthat are opened. Having a budget restriction, the possibilityof enlarging the available information by increasing thenumber of IoT devices has a limit.The approach taken was tooverrate the sensing frequency. This way, a larger amount ofinformation could be made available. However, there is alsoa restriction that applies to this approach; the reporting of allthe observations gathered poses a challenge to the networkingsolution to be implemented. In this sense, the solutionadopted reported one observation every five minutes, on areal-time manner, while one observation every 80 secondsis captured. Those observations that are not immediatelyreported are kept locally and reported throughDelay TolerantNetworking (DTN) or opportunistic networking strategieswhich will be described in Section 4.
The main application for the information produced bymobile IoT nodes, namely, environmental monitoring, doesnot need observations at such high pace; however, otherapplications, such as traffic assessment, benefit from thisoversampling. Moreover, as it has been already mentioned,the whole SmartSantander deployment is meant to supportexperimentation on IoT technologies. Massive production ofsensor observations is critical to maximize the research andexperimentation opportunities on top of the deployed facility.
Concerning the powering of the mobile nodes, it isrealized by connecting them to the vehicle electrical batteries.This way, we guarantee a large, practically endless, energy

8 International Journal of Distributed Sensor Networks
(a) (b)
Figure 5: (a) Detail of sensor nodes installed on public bus; (b) Environmental Data Collection Module.
(a) (b)
Figure 6: (a) Mobile IoT devices real-time location view; (b) mobile IoT devices aggregated location view.
supply to the nodes.This is an aspect of particular importancefor experimental testbeds that has been effectively addressedfor the different deployments of the SmartSantander testbed.As mobile devices are not only supporting the monitoring ofenvironmental parameters but also enabling experimentationon top of them, extreme duty cycles optimizing powerconsumption must be discarded. As it has been stated inSection 1, one of the challenges that must be overcomeby the experimental testbeds is the avoidance, as much aspossible, of restrictions to the experimentation. In this sense,such extreme duty cycles would limit the experimentationpossibilities. The solution adopted for powering the mobilenodes through the vehicle batteries allows these nodes to bealways on if necessary. However, in order to avoid improbablevehicle battery drain, devices are set to hibernate if the engineof the vehicle is kept off for one hour. As soon as the engine isturn on, the IoT device gets back into fully operative mode.
The decision of installing IoT devices on top of vehicleshas demonstrated to be extremely useful and an importantlesson learnt itself. The main advantage of installing thesedevices in vehicles regards the extended range that canbe covered in a very cost-effective manner. As it can beseen in Figure 6, the distribution of the devices along thecity provides a good coverage of almost the whole city.Additionally, frequent encounters among mobile IoT devicesas well as between the mobile and fixed IoT devices enabletesting of peer-to-peer networking strategies. In Figure 6(a),the instantaneous position of the mobile IoT devices fleetcan be observed. In contrast, in Figure 6(b), an aggregatedview of the last 30,000 observations taken by the mobile IoT
devices is presented in bubbles gathering all the observationsgenerated in 1000 square meters around. Colour code goesfrom orange (more than 100) to blue (between 15 and 100)and pink (less than 15). It is also important to mention thatmobility is not restricted to the city and some vehicles go farbeyond Santander boundaries.
The connection of the newly deployed devices to thealready existing testbed poses also some challenges. It goeswithout saying that wireless access technologies were theonly possibility, not only for the mobile devices but also forthe fixed ones due to the geographic scale of the deploy-ment. Using a Wide Area Network (WAN) technology wasthe straightforward decision to guarantee access availabil-ity. However, the main drawback of these networks is theassociated cost. The GPRS connection used for the IoTdevices deployed was associated with the fleet managementservice used by the public transportation company, whichhelped minimizing these costs, but adding communicationinterfaces using short-range ISM-band technologies to someof the devices has proven to be a wise decision. Besidesenabling opportunistic networking solutions, described inSection 4, that add network redundancy thus making theoverall system more resilient, it opens new experimentationopportunities since, to the best of our knowledge, there isno experimental testbed in which IEEE 802.15.4 technologycan be used for communication among nodes moving atrelatively high speeds. Moreover, it is part of the future plansfor extending the testbed to include novel IoT-relatedwirelessaccess technologies, such as SigFox [29] or LoRa [30], whichcould be tested under real-world conditions.

International Journal of Distributed Sensor Networks 9
Last but not least, the installation process had to over-come some hurdles in terms of logistics and casing. Con-cerning the first aspect, it is important to note that the IoTnodes were installed on vehicles that were on duty. Thus, itwas of utmost importance to minimize the installation time.Modular design of the devices helped in this requirementas the different physical modules could be installed inparallel. Pertaining to the casing, this was a major issuefor the Environmental Data Collection Module as it had tocompulsorily be installed outdoors. The solution adopted forthe air inlet to pass an ABS labyrinth has demonstrated to beadequate as no damage due to water or humidity has beenrecorded even in a rainy city as Santander is.
3.5. Key Success Indicators of the Support for Experimenta-tion. After having presented the details of the installationand described the lessons learnt associated with the actualinstallation process, in this section we will analyse it in termsof the features identified as most relevant characteristicsfor supporting IoT experimentation, namely, scale, hetero-geneity, mobility, experimentation realism, data-centricity,concurrency, and autonomy, and take them as key successindicators assessing whether the deployed infrastructure hasachieved its main goal or not. Since the description hasfocused on the mobile part of the SmartSantander testbed,the analyses will also concentrate on it.
It is clear that, in terms of scale, the number of mobileIoT devices deployed puts SmartSantander testbed in the toppart of the table of any existing experimentation testbeds[5]. However, scale has additional connotations, namely,geographic extension and amount of information generated,which are of special interest for IoT experimentation and arealso significantly covered in the testbed.
In terms of heterogeneity, the testbed has focused oninformation heterogeneity rather than on devices hetero-geneity itself. This goes in line with the focus on IoT ratherthan on WSN. While for WSN experimentation havingaccess to heterogeneous devices is a relevant feature fordemonstrating portability of solutions, IoT experimentationrequirements are much more service oriented [31] and thusare interested in the services that the infrastructure provideswhich are in general information-centric.
Enabling experimentation involving mobility is the obvi-ous leap forward enabled by the deployment described in thispaper. The main limitation is that only undergone mobilityis supported meaning that an experimenter will not beable to control the trajectory of mobile devices. On theother hand, the fact that some of the mobile devices cancommunicate with the fixed ones must be highlighted as amajor enablement of the testbed.
One of the main rationales for experimentally drivenresearch is to be able to challenge the solutions being devel-oped against real-world situations that cannot be modelledin simulation environments. Controlled testbeds (typicallyindoor) are actually a step forward but they are still restrictedin realism terms. The testbed we have described is exposedto real-world conditions which implicitly affect experimentsrunning on top of it. Solutions evaluated under such cir-cumstances will benefit from these contour conditions, thus
guaranteeing that the resulting solution is suited to a real-lifeurban setting.
Data-centricity is another key differentiator betweenWSN experimentation and IoT one. While, for the firstone, focus is put on the devices and how they operate(communicate, internetwork, etc.), IoT builds on top ofdevices but provides a higher level of abstraction in whichthe focus is put on the services that objects provide (generallydata gathering and reporting). The SmartSantander platformand the mechanisms deployed for intertier communicationwere implemented with this feature as a fundamental designconsideration and the deployed mobile infrastructure hasbeen successfully integrated in it.
Experimentation as a service model has been adopted bythe SmartSantander platform so that concurrent experimen-tation can be handled.This way the underlying infrastructureis decoupled from the experimenters’ requests guaranteeingscalability both in terms of enlarging the deployed infrastruc-ture, where as a matter of fact mobile IoT devices have beenseamlessly incorporated into the testbed on a plug and playmanner, and in terms of increasing the number of concurrentexperiments.
With the scale and variety of testbed managementevents to track, one cannot assume that human interventionalone is sufficient to provide timely response to events andremediation to faults. Testbed management automation hasbeen incorporated keeping the human in the loop only fordecision-making and policy-specification. Moreover, thereare other aspects, more related to the deployment andnetworking, that have been put forward in order tomaximizetestbed autonomy. Firstly, the energy demands from theinfrastructure, which are augmented due to experimentationsupport necessity, have been tackled during the installationprocess guaranteeing large enough energy sources for all themobile IoT devices. Secondly, multiple intertier communi-cation networking solutions have been adopted in order toavoid single point of failure problems and maximize testbedresiliency.
4. Mobile Sensing Data Distribution Strategies
Data distribution is one of the key aspects to be solved inorder to fully exploit the potential of a sensing infrastructurebased on vehicle-mounted IoT devices. In this sense, asalready introduced, the three-tiered architecture definedspecifies that access to the information gathered at the IoTtier must be reported towards the components at the servertier since these latter ones are the responsible for makingit available to the applications and services consuming thisinformation.
In the following subsections the three different obser-vations reporting strategies employed for the Santanderdeployment will be described.
4.1. WAN-Based Observations Reporting
4.1.1. Strategy Description. To be really effective, smart cityservices have to enable citizens and organisations to makewell-informed decisions in a timely fashion. As the value of

10 International Journal of Distributed Sensor Networks
information can fall rapidly, smart city services need to becapable of capturing relevant information in real-time anddistributing it in a format that citizens and organisations canact on immediately.
WAN-based observations reporting strategy make useof the GPRS interface with which all the IoT devicesinstalled on the vehicles of the SmartSantander’s facility areequipped.These IoT devices are programmed to periodicallysend an observation to the so-called GW for mobile nodes(GW4MN). This element, directly connected to the servertier, forwards these observations to the appropriate reposi-tory.
The periodicity with which observations are reportedis a tunable parameter depending on time, distance, or acombination of both. Thus, an observation can be reportedevery certain number of seconds, when the vehicle hastravelled a specific number ofmeters or when the first of thesetwo conditions occur. Currently, this reporting frequency isfixed to five minutes.
4.1.2. Strategy Discussion. This reporting strategy is used asthe baseline for the SmartSantander deployment. It guar-antees sufficiently fresh information since GPRS coverageof the city is almost 100% assured. Moreover, it supportsreal-time event-based asynchronous reporting. Additionally,it is the only one that can be implemented by all the IoTdevices installed on the SmartSantander’s vehicles as it doesnot depend on the optional Local Communication Module.
The main drawback for this strategy is that frequentconnection through the cellular network is costly in terms ofenergy and should be restricted in terms of quantity of datadue to economic costs.
While the power consumption is not a major issue dueto the fact that nodes installed are connected to the vehiclebattery in order to guarantee permanent and almost endlessaccess to energy, the economic cost associated with thisreporting strategy should not be neglected. The solutionadopted to minimize the impact and keep these costs toa minimum while maintaining the experimental facilitygrade of service was to negotiate the commercial contractfor the mobile nodes deployment in conjunction with theSantander municipality mobile phone lines service. Thisway it was possible to get competitive fees as economiesof scale apply. However, it is clear that although it waspossible to minimize the communication costs, reachinga trade-off between observations reporting freshness andcost, it is important to develop other observations reportingstrategies that reduce the costs while increasing the amountof information retrieved.
4.2. V2I-Based Opportunistic Observations Reporting
4.2.1. Strategy Description. As the vehicles circulate aroundthe city, they might come close to some of the fixed IoTdevices. As it has been introduced in Section 3, IoT devicesinstalled on the Santander’s public transportation buses wereequipped with a Local Communication Module which in themajority of cases included an IEEE 802.15.4. This modulewas installed on the roofs of the buses in order to enable
Table 1: Mean number and standard deviation of fixed-mobiledevices encounters per day.
Mean number of encounters Std. deviationWeekday 4550 117.43Weekend 3530.4 153.32
direct communication between the embarked IoT devicesand the fixed ones as long as they come close enough.Taking advantage of this condition another observationsreporting strategy has been implemented exploiting Vehicle-to-Infrastructure (V2I) opportunistic networking.
Observations gathered by mobile IoT devices that arenot immediately reported through theWAN-based reportingstrategy are kept at the Local Persistence Storage repositoryinside the IoT device. IoT devices on the buses oppor-tunistically try to report observations on this repository bybroadcasting them as soon as they come close to any of thefixed IoT devices. Once one of these broadcasted reportsreaches one of the fixed IoT devices, this device acknowledgesits reception. Upon the reception of this acknowledgementthe device that originated the observation should considerit reported and remove it from the Local Persistence Storagerepository.
4.2.2. Strategy Experimental Assessment. Figure 7(a) showsan excerpt of the fixed IoT devices locations. Devices arerepresented in the figure with blue dots. These devices arethe ones that, among all the deployed ones, are located atstreets coinciding with buses lines. As it can be seen, they arebasically deployed along both sides of Santander’s main citycentre avenues. Correspondingly, Figure 7(b) shows the loca-tions where IoT devices embarked on the buses came acrossone of the fixed nodes, thus being able to opportunisticallyreport one or more locally stored observations.The meetingspresented were detected just on a single day (September 1,2014).
The results on the figure can be extrapolated to anyweekday. Table 1 presents the results of the analysis done tothis parameter during the first fifteen days of September 2014analysing the number of reporting opportunities from allthe mobile devices. Public transportation timetable is slightlymodified on weekends affecting the distribution and overallnumber of fixed-mobile devices encounters. The meetingpoints shown in Figure 7(b) are colour-coded on a permobileIoT device manner; this is, every device is assigned a colouron the blue to green range.
The aggregated number of encounters presented inTable 1 does not reflect the fact that they are not uniformlydistributed among all the devices embarked on the differentbuses. While there are buses which are assigned to linesthat regularly pass through the streets on which the fixedIoT devices are installed, others do it less frequently orjust do not circulate on the fixed deployment area. Figure 8shows the probability density function for the number ofobservations reporting opportunities per day among all themobile IoT devices during the analysed period (first fifteendays of September 2014). As it can be seen, it follows a

International Journal of Distributed Sensor Networks 11
43,463∘N43,462∘N43,461∘N43,459∘N43,458∘N43,46∘N
3,83∘W
3,82∘W
3,825∘W
3,81∘W
3,815∘W
3,805∘W
3,8∘W
3,795∘W
(a)
43,463∘N43,462∘N43,461∘N43,459∘N43,458∘N43,46∘N
3,83∘W
3,82∘W
3,825∘W
3,81∘W
3,815∘W
3,805∘W
3,8∘W
3,795∘W
(b)
Figure 7: (a) Fixed IoT devices location at city centre; (b) mobile IoT devices opportunistic reporting positions.
260240220200180160140120100806040200
0
0.02
0.04
0.06
0.08
0.1
0.12
Prob
abili
ty d
ensit
y
Number of observations reporting opportunities
Figure 8: Observations reporting opportunities per mobile IoTdevice probability density function.
Time of the day
3:00
:00
4:00
:00
5:00
:00
6:00
:00
7:00
:00
8:00
:00
9:00
:00
10
:00
:00
11
:00
:00
12
:00
:00
13
:00
:00
14
:00
:00
15
:00
:00
16
:00
:00
17
:00
:00
18
:00
:00
19
:00
:00
20
:00
:00
21
:00
:00
22
:00
:00
23
:00
:00
Id = 3010Id = 3044
Num
ber o
f obs
erva
tions
repo
rtin
g op
port
uniti
es
12
10
8
6
4
2
0
= 3048Id= 3078Id
Figure 9: Time distribution of mobile IoT devices reportingopportunities.
normal distributionwith themean around 82 encounters anda standard deviation of 43.
Figure 9 shows the observation reporting opportunitiestime distribution of four different devices during one of thedays analysed (September 1). Thirty-minute interval analysisis performed. It presents the amount of encounters betweenthe mobile device and any of the fixed ones on that particularinterval.
4.2.3. Strategy Discussion. The main drawback of this solu-tion is that it does not provide any guarantee on the timelymanner in which observations are reported.
As it has been experimentally demonstrated, encountersoccur on a time-scattered way. This is, for the same mobiledevice they concentrate on a, typically reduced, numberof consecutive intervals (so-called opportunity periods) fol-lowed by several intervals in which no reporting oppor-tunity is detected (so-called silent periods). These periods,respectively, correspond to the timeframes in which the busescirculate around the city centre (where SmartSantander’sfixed infrastructure is deployed) and those that their linesmake them drive outside the downtown area. The analysisdone has been conducted over the reporting opportunitiesthat the devices installed on vehicles have. However, it isimportant to note that it might be possible to report severalobservations per opportunity.
The result of this kind of behaviour is that while obser-vations gathered during the opportunity periods might havethe chance to be timely reported using V2I-based strategy,those gathered during silent periods will have to wait tillthe next opportunity period to be reported. Moreover, storedobservations gathered during silent periods will be reportedfirst during the next opportunity period thus delaying thoseobservations gathered during that opportunity period. Typ-ically opportunity periods are large enough to report theobservations gathered during the previous silent period andcatch up with the ones gathered in that opportunity period.
In contrast, this approach allows for large amount ofinformation to be made available at no additional commu-nication costs.
From the analysis of these results, we can conclude thateven when this reporting strategy might not be used as thebaseline reporting solution, it provides an efficient mannerto enrich the sensing capacity of such a vehicular-basedinfrastructure without having to rely on mobile networks.
Moreover, it is also important to highlight that sincebuses follow a predictive trajectory, the time when datacould be reported could be forecast. So reporting date canbe predictive and periodic. Thus, although the solutionassessment has not analysed the actual delay statistics (i.e.,mean delay for observations reported using this method), theresults let us envisaging, without losing generality, that fornoncritic, delay-tolerant applications it could actually be usedas the default approach.
4.3. Batched Observations Reporting
4.3.1. Strategy Description. The last of the observationsreporting strategies implemented is also based on the ability

12 International Journal of Distributed Sensor Networks
Table 2: Application requirements key performance indicators.
Capacity Delay Cost Power consumption Real-time support SecurityWAN-based Restricted Negligible High N/A Yes HighV2I-based Unbounded Restricted Zero N/A No HighBatched Unbounded High Zero N/A No High
of the mobile devices to locally store the observations whichthey produce but which have not been reported. In this case,the fixed infrastructure will not be composed by the fixed IoTdevices rolled out in the city but mobile IoT devices will tryto connect to IEEE 802.11b hotspots in order to upload all theobservations in their local storage.
Low data rate of IEEE 802.15.4 interfaces made it onlypossible to report observations one by one. However, batchedmode can be used thanks to the relative high data rate of IEEE802.11b. It is important to note that every observation is justsome bytes long so even in the worst case the batch will bejust some kilobytes.
The current implementation of this strategy is limited tothe WiFi hotspot at the bus depot. This way, when buses endtheir shift every night and come back to the depot they candownload the observations stored throughout the day.
4.3.2. Strategy Discussion. Similar to the case of the V2I-based reporting strategy, the main advantage associatedwith this mode of sending the gathered observations to theSmartSantander platform is the possibility of reporting a bigamount of data in a costless manner. Bearing in mind thatpower consumption is not a problem thanks to the way thenodes were installed connected to the large batteries of thevehicles, frequency of the observations gathering (note thecontrast between gathering and reporting) could be increasedas much as necessary.
Likewise, the drawback for this reporting strategy isclearly the impossibility of guaranteeing timely transfer ofdata to the SmartSantander platform server tier. In this sense,applications with strict requirements in terms of delay couldnot be supported using this way of reporting observationsgathered by mobile devices.
Extending this implementation to other hotspots aroundthe city would be possible by enabling dynamic hotspotdiscovery and connection. This would enhance the time-related behaviour of this solution but would not completelysolve the problem nor would it enable the support of event-based applications.Thus, it would be necessary to assess if theperformance improvement compensates the costs of rollingout and managing these hotspots.
4.4. Data Distribution Strategies Discussion. One of thelessons learnt through the operation of SmartSantander IoTinfrastructure is the crucial need, whichmight become a fatalbottleneck, for efficient data distribution solutions that takethe information from the devices out in the wild towardsthe IoT platforms. Data gathering and disseminating are fun-damental mechanisms of smart services and infrastructureswhich stresses the need for efficient, city-wide, and manifoldcommunication networks.
Besides the individual discussions at the end of eachof the above sections which had focused on presenting themain advantages and drawbacks for the proposed reportingstrategies, it is also interesting to analyse them with regard tothe application requirements. Table 2 presents the evaluationof some of the main key performance indicators in termsof requirements imposed by applications making use of theinformation gathered by the mobile devices deployed.
The capacity of cellular networks, even those that are nowbeing planned, will be really challenged by the increasingdemands of IoT-like infrastructures. Besides the raw capacitydiscussion, what is clear is that it is advisable to exploit othernetworking strategies in order to accommodate the reportingof sensor observations in the most efficient manner.
The assessment made to the opportunistic strategy hasconfirmed that while applications with real-time demandscould not be handled due to the potential delays in whichthis approach incurs, these delays might be bearable forapplications with relaxed time constraints. They compensatethis with an unbounded capacity at no additional cost andkeeping confidentiality and integrity of information.
In this sense, combining traditional Wide Area Net-work (WAN) networks such as broadband mobile networkswith less-conventional networking solutions such as hotspotconnectivity or multihop communications is an appealinganswer to broadcasting geolocalized information efficiently.
Analysis performed to real data traces obtained from theembarked devices has demonstrated the benefits that, undercertain conditions, the implementedmechanisms could bringto the data distribution challenge in this kind of networks.
5. Smart City Applications
Deploying the devices and gathering the information theycontinuously generate are just the first step towards the finalaim of the testbed described in previous sections. It goeswithout saying that the key aspect of an IoT infrastructure isits capacity to enrich the understanding of the city behaviour.This advanced knowledge makes it possible to optimizethe city management procedures as well as to enable moreinformed, and thus smarter, decisions by the citizens. A briefdescription of two potential applications for the informationgathered through themobile sensing infrastructure rolled outin Santander will be presented in this section.
5.1. Environmental Monitoring. As it has been introducedin Section 3, the sensors with which mobile IoT devicesare equipped are mainly aimed at measuring air qualityparameters like carbon monoxide, nitrogen dioxide, ozone,or dust particles in suspension. Additionally, they also count

International Journal of Distributed Sensor Networks 13
(a) (b)
(c) (d)
Figure 10: Real-time environmental monitoring Santander area heatmaps. (a) Temperature (∘C); (b) relative humidity (%); (c) dust particles(mg/m3); and (d) carbon monoxide (mg/m2).
with general weather sensors like temperature and relativehumidity.
Besides more professional and skilled use of the infor-mation gathered by weather and environment techniciansin complex studies that can be used in forecasting orpublic safety, citizens can be directly informed by meansof applications including general city conditions dashboardsin which panels like the ones shown in Figure 10 can bepresented. Easily understandable graphical representations,like heatmaps, of almost real-time data would be warmlywelcome by citizens interested in knowing about their city.
Despite the actual values of the parameters observedand shown in each of the maps in Figure 10, the aim ofthese maps is to show to the reader the capacity of coveringthe city area with a certainly limited number of devices.Observations carried out by the mobile devices could, in acost-effective way, feed mathematical estimation algorithmswhich are used nowadays with a twofold objective, firstly,to assess current algorithms that with a little number offixed sensors extrapolate the conditions in other areas and,secondly, to fine-tune the values resulting frommathematicalinterpolation with values gathered from physical observationof the corresponding parameter.
5.2. Traffic Conditions Assessment. Nowadays, most of thetraffic conditions assessment applications are based oninformation gathered from inductive loops buried in thecity streets. While this infrastructure provides consistentinformation, it has two main drawbacks. Firstly, real-timeinformation gathering is not provided. Secondly, deploymentand management costs are not negligible as they includeroad works every now and then to keep the infrastructureoperational.
Figure 11: Smarter Travel [34] screenshot.
It is already possible to find in the literature [32, 33] expe-riences in which Floating Car Data paradigm is employed toperform traffic estimation. With a good number of vehiclesmoving around the city it would be possible to enrichcurrently available traffic condition assessment applicationswith the information on speed and course gathered by themobile IoT devices as they circulate across the city. Figure 11shows colour-coded (green for fluid, yellow for moderate,and red for dense) assessment of the Santander streets’ trafficconditions. This map is part of a smartphone app which iscurrently using the information from the inductive loops butis being extended to receive also the information from themobile IoT devices.
6. Conclusions
Vehicular networking will be inevitably part of the IoTscenario and smart cities are one of themost evident examplesof the IoT applicability potential. This paper focuses onthe description of a large-scale IoT testbed deployed atthe city of Santander with special emphasis on the devices

14 International Journal of Distributed Sensor Networks
that have been installed on 140 vehicles that circulate allover the city daily. It presents the detailed description ofthe embarked devices and analyses the experimentationalternatives that they enable. In this sense, particular stressis put on the mobile IoT devices features enabling, throughshort-range low-power radio technologies, the interactionnot only among them but also with the fixed infrastructuredeployed at Santander streets.We expect that this descriptionwill promote a better knowledge of the testbed featuresand experimentation scenarios that it enables and assist IoTexperimenters to prepare such experiments.
Three differentmobile sensing data distribution strategieshave been implemented in the testbed and they have beendescribed in this paper, while the main data dissemina-tion strategy implemented for the SmartSantander mobilesensing deployment is based on periodic reporting usingcellular access network. However, opportunistic offloadingof sensed data through short- and medium-range wirelessaccess technologies such as IEEE 802.15.4 and IEEE 802.11has also been used. Future work in this area will focuson complementing the analysis with a detailed study ofthe delay conditions for V2I-based strategy. Moreover, thepractical implementation of opportunistic batched reportingat hotspots different from bus depot will also complementcurrently implemented solutions.
Finally, a brief description of two smart city applicationsfor the information gathered through the mobile sensinginfrastructure has been presented as easily understandableexamples of the added value that can be obtained thanks toreal-world roll-outs of IoT (fixed and mobile) technology.
Conflict of Interests
The authors declare that there is no conflict of interestsregarding the publication of this paper.
Acknowledgments
This work has been partially funded by Research ProjectSmartSantander, under FP7-ICT-2009-5 of the 7th Frame-work Programme of the European Community. The authorswould like to acknowledge the collaboration with the restof partners within the consortium leading to the resultspresented in this paper.The authors would also like to expresstheir gratitude to the Spanish government for the funding inthe following project: “Connectivity as a Service: Access forthe Internet of the Future,” COSAIF (TEC2012-38574-C02-01).
References
[1] WHO, “Urbanization and health,” Bulletin of the World HealthOrganization, vol. 88, no. 4, pp. 245–246, 2010.
[2] H. Schaffers, N. Komninos, M. Pallot, B. Trousse, M. Nilsson,and A. Oliveira, “Smart cities and the future internet: towardscooperation frameworks for open innovation,” in The FutureInternet, vol. 6656 of Lecture Notes in Computer Science, pp. 431–446, Springer, Berlin, Germany, 2011.
[3] J. M. Hernandez-Munoz, J. B. Vercher, L. Munoz et al., “Smartcities at the forefront of the future internet,” in The FutureInternet, pp. 447–462, Springer, Berlin, Germany, 2011.
[4] Project SmartSantander FP7-ICT-2009-5-257992, 2015, http://www.smartsantander.eu/.
[5] A. S. Tonneau, N. Mitton, and J. Vandaele, “How to choosean experimentation platform for wireless sensor networks? Asurvey on static andmobilewireless sensor network experimen-tation facilities,” Ad Hoc Networks, vol. 30, pp. 115–127, 2015.
[6] A. Gluhak, S. Krco, M. Nati, D. Pfisterer, N. Mitton, andT. Razafindralambo, “A survey on facilities for experimentalinternet of things research,” IEEE Communications Magazine,vol. 49, no. 11, pp. 58–67, 2011.
[7] B. Hull, V. Bychkovsky, Y. Zhang et al., “CarTel: a distributedmobile sensor computing system,” in Proceedings of the 4thInternational Conference on Embedded Networked Sensor Sys-tems (SenSys ’06), pp. 125–138, ACM, Boulder, Colo, USA,November 2006.
[8] T. Nadeem, S. Dashtinezhad, C. Liao, and L. Iftode, “Traf-ficView: traffic data dissemination using car-to-car communi-cation,”ACM SIGMOBILEMobile Computing and Communica-tions Review, vol. 8, no. 3, pp. 6–19, 2003.
[9] U. Lee, B. Zhou, M. Gerla, E. Magistretti, P. Bellavista, and A.Corradi, “Mobeyes: smart mobs for urban monitoring with avehicular sensor network,” IEEE Wireless Communications, vol.13, no. 5, pp. 52–57, 2006.
[10] T.Willke, P. Tientrakool, andN.Maxemchuk, “A survey of inter-vehicle communication protocols and their applications,” IEEECommunications Surveys and Tutorials, vol. 11, no. 2, pp. 3–20,2009.
[11] W. Chen, R. K. Guha, T. J. Kwon, J. Lee, and Y.-Y. Hsu, “A surveyand challenges in routing and data dissemination in vehicularad hoc networks,” IEEE Wireless Communications and MobileComputing, vol. 11, no. 7, pp. 787–795, 2011.
[12] D. Toppeta, The Smart City Vision: How Innovation andICT Can Build Smart, Livable, Sustainable Cities, The Inno-vation Knowledge Foundation, 2015, http://www.inta-aivn.org/images/cc/Urbanism/background%20documents/ToppetaReport 005 2010.pdf.
[13] L. Sanchez, L. Munoz, J. A. Galache et al., “SmartSantander: IoTexperimentation over a smart city testbed,”Computer Networks,vol. 61, pp. 217–238, 2014.
[14] T. Bakıcı, E. Almirall, and J. Wareham, “A smart city initiative:the case of Barcelona,” Journal of the Knowledge Economy, vol.4, no. 2, pp. 135–148, 2013.
[15] T. Ojala, “Open urban testbed for ubiquitous computing,” inProceedings of the International Conference on Communicationsand Mobile Computing (CMC ’10), pp. 442–447, April 2010.
[16] R. N. Murty, G. Mainland, I. Rose et al., “CitySense: an urban-scale wireless sensor network and testbed,” in Proceedings ofthe IEEE International Conference on Technologies for HomelandSecurity, pp. 583–588, Waltham, Mass, USA, May 2008.
[17] C.Outram,C. Ratti, andA. Biderman, “TheCopenhagenwheel:an innovative electric bicycle system that harnesses the powerof real-time information and crowd sourcing,” in Proceedingsof the EVER Monaco International Exhibition & Conference onEcologic Vehicles & Renewable Energies, March 2010.
[18] K. Kloeckl, O. Senn, and C. Ratti, “Enabling the real-time city:LIVE Singapore!,” Journal of Urban Technology, vol. 19, no. 2, pp.89–112, 2012.
[19] Cab Spotting, 2015, http://cabspotting.org/.

International Journal of Distributed Sensor Networks 15
[20] C. B. des Roziers, G. Chelius, T. Ducrocq et al., “Using sensLABas a first class scientific tool for large scale wireless sensornetwork experiments,” in Proceedings of the 10th InternationalIFIP TC 6 Conference on Networking (NETWORKING ’11), pp.147–159, Valencia, Spain, 2011.
[21] Cisco, “Cisco visual networking index: globalmobile data trafficforecast update, 2011–2016,” White Paper, 2012.
[22] U. Lee and M. Gerla, “A survey of urban vehicular sensingplatforms,”Computer Networks, vol. 54, no. 4, pp. 527–544, 2010.
[23] K. Lee, J. Lee, Y. Yi, I. Rhee, and S. Chong, “Mobile dataoffloading: how much can WiFi deliver?” in Proceedings ofthe IEEE/ACM Co-NEXT, pp. 1–12, Philadelphia, Pa, USA,December 2010.
[24] C. Intanagonwiwat, R. Govindan, and D. Estrin, “Directeddiffusion: a scalable and robust communication paradigm forsensor networks,” in Proceedings of the 6th Annual InternationalConference on Mobile Computing and Networking (MOBICOM’00), pp. 56–67, August 2000.
[25] S. B. Eisenman, G.-S. Ahn, N. D. Lane, E. Miluzzo, R. A.Peterson, and A. T. Campbell, “MetroSense project: people-centric sensing at scale,” in Proceedings of the 1st Workshop onWorld-Sensor-Web (WSW ’06), Boulder, Colo, USA, 2006.
[26] R. C. Shah, S. Roy, S. Jain, and W. Brunette, “Data mules:modeling and analysis of a three-tier architecture for sparsesensor networks,” Ad Hoc Networks, vol. 1, no. 2-3, pp. 215–233,2003.
[27] W. Vandenberghe, B. Vermeulen, P. Demeester et al., “Archi-tecture for the heterogeneous federation of future internetexperimentation facilities,” in Proceedings of the Future Networkand Mobile Summit, pp. 1–11, Lisbon, Portugal, July 2013.
[28] Digimesh routing protocol, 2015, http://www.digi.com/tech-nology/digimesh/.
[29] SigFox homepage, 2015, http://www.sigfox.com/en/.[30] L. Alliance, “Wide Area Networks for IoT,” 2015, http://lora-
alliance.org/.[31] A. Zanella andM. Zorzi, “Applying internet of things paradigm
to smart city: communication model and experimentation,”IEEE ComSoc MMTC E-Letter, vol. 9, no. 5, 2014.
[32] B. S. Kerner, C. Demir, R. G. Herrtwich et al., “Traffic statedetection with floating car data in road networks,” in Pro-ceedings of the 8th International IEEE Conference on IntelligentTransportation Systems (ITSC ’05), pp. 44–49, IEEE, Vienna,Austria, September 2005.
[33] C. De Fabritiis, R. Ragona, and G. Valenti, “Traffic estimationand prediction based on real time floating car data,” in Pro-ceedings of the 11th International IEEE Conference on IntelligentTransportation Systems (ITSC ’08), pp. 197–203, Beijing, China,October 2008.
[34] Smarter Travel App, 2015, https://play.google.com/store/apps/details?id=es.heritas.smartertravel2.

Submit your manuscripts athttp://www.hindawi.com
VLSI Design
Hindawi Publishing Corporationhttp://www.hindawi.com Volume 2014
International Journal of
RotatingMachinery
Hindawi Publishing Corporationhttp://www.hindawi.com Volume 2014
Hindawi Publishing Corporation http://www.hindawi.com
Journal ofEngineeringVolume 2014
Hindawi Publishing Corporationhttp://www.hindawi.com Volume 2014
Shock and Vibration
Hindawi Publishing Corporationhttp://www.hindawi.com Volume 2014
Mechanical Engineering
Advances in
Hindawi Publishing Corporationhttp://www.hindawi.com Volume 2014
Civil EngineeringAdvances in
Acoustics and VibrationAdvances in
Hindawi Publishing Corporationhttp://www.hindawi.com Volume 2014
Hindawi Publishing Corporationhttp://www.hindawi.com Volume 2014
Electrical and Computer Engineering
Journal of
Hindawi Publishing Corporationhttp://www.hindawi.com Volume 2014
Distributed Sensor Networks
International Journal of
The Scientific World JournalHindawi Publishing Corporation http://www.hindawi.com Volume 2014
SensorsJournal of
Hindawi Publishing Corporationhttp://www.hindawi.com Volume 2014
Modelling & Simulation in EngineeringHindawi Publishing Corporation http://www.hindawi.com Volume 2014
Hindawi Publishing Corporationhttp://www.hindawi.com Volume 2014
Active and Passive Electronic Components
Hindawi Publishing Corporationhttp://www.hindawi.com Volume 2014
Chemical EngineeringInternational Journal of
Control Scienceand Engineering
Journal of
Hindawi Publishing Corporationhttp://www.hindawi.com Volume 2014
Antennas andPropagation
International Journal of
Hindawi Publishing Corporationhttp://www.hindawi.com Volume 2014
Hindawi Publishing Corporationhttp://www.hindawi.com Volume 2014
Navigation and Observation
International Journal of
Advances inOptoElectronics
Hindawi Publishing Corporation http://www.hindawi.com
Volume 2014
RoboticsJournal of
Hindawi Publishing Corporationhttp://www.hindawi.com Volume 2014