7.3 sediment delivery analysis - fm diversion€¦ · 7.3 sediment delivery analysis in order to...
TRANSCRIPT
7.3 Sediment Delivery Analysis In order to evaluate potential changes in sedimentation patterns that could occur due to impacts from the FCP and LPP alignments, sediment assessment models were constructed using the SIAM (Sediment Impact Assessment Model) feature in HEC-RAS. SIAM compares the annual sediment transport capacity of a reach to the annual sediment supply and provides an indication of whether aggradation, degradation, or equilibrium may occur. A schematic showing the sediment balance algorithm in SIAM is provided in Figure 7-1. The SIAM feature was applied for all general study reaches under current conditions. For the LPP alignment scenario, SIAM was applied for the diversion channel and those rivers that would be affected by the LPP diversion. These include: Red River, Sheyenne River, Wild Rice River, and Maple River. Although the LPP alignment crosses the Rush and Lower Rush Rivers it is expected that the diversion would have no impact on the upper reaches (Rush 2 and Lower Rush 2). The diversion is designed to intercept all flow in the lower reaches of Rush 1 and Lower Rush 1, negating the need for comparison; therefore, no SIAM modeling was conducted for either the Rush River or Lower Rush River. Similarly, for the FCP alignment SIAM was applied for the diversion channel plus those rivers that could be impacted by the FCP diversion. These include: Red River, Rush River, Sheyenne River, and Wild Rice River. Though the FCP alignment does not intersect the Rush River, Sheyenne River or Wild Rice River, minor changes in the hydraulic model output were noted for the downstream reaches of these rivers due to backwater effects on the Red River and Sheyenne River from the FCP alignment.
WEST Consultants, Inc. P-1 USACE Geomorphology Study October 25, 2012

Figure 7-1. SIAM Sediment Balance Schematic (Mooney, 2006)
7.3.1 Sediment Reaches Sediment reaches in SIAM should be based on similar sediment and hydraulic properties, recognizing any significant geomorphic changes, changes in channel gradient, planform and geometry, and shifts in sediment composition. Based on these parameters and field observations, the SIAM sediment reach divisions were based on the general study reaches that were selected using similar criteria. The FCP diversion channel was subdivided into four sediment reaches based on channel gradient and changes in the channel geometry. The LPP diversion was subdivided into twelve sediment reaches based on changes in channel gradient and locations of significant flow changes, and structures that significantly impact hydraulic properties. Diversion channel sediment reaches are shown in Figure 7-2.
WEST Consultants, Inc. P-2 USACE Geomorphology Study October 25, 2012
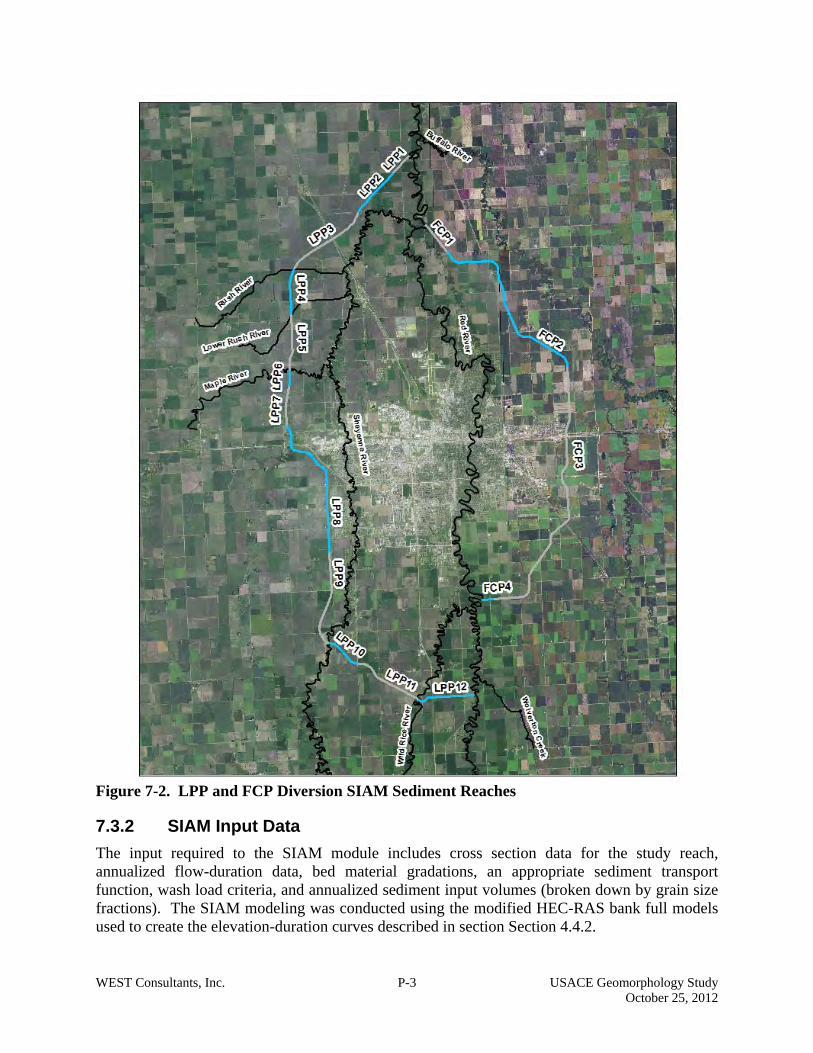
Figure 7-2. LPP and FCP Diversion SIAM Sediment Reaches
7.3.2 SIAM Input Data The input required to the SIAM module includes cross section data for the study reach, annualized flow-duration data, bed material gradations, an appropriate sediment transport function, wash load criteria, and annualized sediment input volumes (broken down by grain size fractions). The SIAM modeling was conducted using the modified HEC-RAS bank full models used to create the elevation-duration curves described in section Section 4.4.2.
WEST Consultants, Inc. P-3 USACE Geomorphology Study October 25, 2012

7.3.2.1 Annualized Flow Distributions Sediment transport estimates developed by SIAM are based on annualized flow-duration curves created from mean daily discharges. The flow-duration curves provided by the St Paul District and those developed by WEST for the detailed study reaches, used in developing the elevation-duration curves, were input into SIAM. The various flows that define the flow-duration curves were automatically imported by HEC-RAS into SIAM. The corresponding exceedence percentage was used to compute the number of days in a year that each discharge value applies (Table 7-1 & Table 7-2). The total duration must equal 365 days because SIAM predicts annual trends. The discharges associated with each profile in Table 7-1 & Table 7-2 for current and future conditions can be found in Appendix Q. Table 7-1. Duration of SIAM Discharge Profiles for Study Rivers
Profile (% time equaled or exceeded)
Duration (days)
Buffalo River
Lower Rush River
Maple River
Red River
Rush River
Sheyenne River
Wild Rice River
Wolverton Creek
0.001% 0.004 0.004 0.004 0.004 0.004 0.004 0.004 0.004 0.05% 0.18 0.18 0.18 0.18 0.18 0.18 0.18 0.18 0.10% 0.18 0.18 0.18 0.18 0.18 0.18 0.18 0.18 0.15% 0.18 0.18 0.18 0.18 0.18 0.18 0.18 0.18 0.20% 0.18 0.18 0.18 0.18 0.18 0.18 0.18 0.18 0.25% 0.18 0.18 0.18 0.18 0.18 0.18 0.18 0.18 0.30% 0.18 0.18 0.18 0.18 0.18 0.18 0.18 0.18 0.35% 0.18 0.18 0.18 0.18 0.18 0.18 0.18 0.18 0.40% 0.18 0.18 0.18 0.18 0.18 0.18 0.18 0.18 0.45% 0.18 0.18 0.18 0.18 0.18 0.18 0.18 0.18 0.50% 0.18 0.18 0.18 0.18 0.18 0.18 0.18 0.18 0.60% 0.37 0.37 0.37 0.37 0.37 0.37 0.37 0.37 0.70% 0.37 0.37 0.37 0.37 0.37 0.37 0.37 0.37 0.80% 0.37 0.37 0.37 0.37 0.37 0.37 0.37 0.37 0.90% 0.37 0.37 0.37 0.37 0.37 0.37 0.37 0.37 1.00% 0.37 0.37 0.37 0.37 0.37 0.37 0.37 0.37 1.20% 0.73 0.73 0.73 0.73 0.73 0.73 0.73 0.73 1.40% 0.73 0.73 0.73 0.73 0.73 0.73 0.73 0.73 1.60% 0.73 0.73 0.73 0.73 0.73 0.73 0.73 0.73 1.80% 0.73 0.73 0.73 0.73 0.73 0.73 0.73 0.73 2.00% 0.73 0.73 0.73 0.73 0.73 0.73 0.73 0.73 2.20% 0.73 0.73 0.73 0.73 0.73 0.73 0.73 0.73 2.40% 0.73 0.73 0.73 0.73 0.73 0.73 0.73 0.73 2.60% 0.73 0.73 0.73 0.73 0.73 0.73 0.73 0.73 2.80% 0.73 0.73 0.73 0.73 0.73 0.73 0.73 0.73 3.00% 0.73 0.73 0.73 0.73 0.73 0.73 0.73 0.73 3.50% 1.83 1.83 1.83 1.83 1.83 1.83 1.83 1.83 4.00% 1.83 1.83 1.83 1.83 1.83 1.83 1.83 1.83 4.50% 1.83 1.83 1.83 1.83 1.83 1.83 1.83 1.83 5.00% 1.83 1.83 1.83 1.83 1.83 1.83 1.83 1.83 6.00% 3.65 3.65 3.65 3.65 3.65 3.65 3.65 3.65 7.00% 3.65 3.65 3.65 3.65 3.65 3.65 3.65 3.65 8.00% 3.65 3.65 3.65 3.65 3.65 3.65 3.65 3.65 9.00% 3.65 3.65 3.65 3.65 3.65 3.65 3.65 3.65
WEST Consultants, Inc. P-4 USACE Geomorphology Study October 25, 2012

10.00% 3.65 3.65 3.65 3.65 3.65 3.65 3.65 3.65 11.00% 3.65 3.65 3.65 3.65 3.65 3.65 3.65 3.65 12.00% 3.65 3.65 3.65 3.65 3.65 3.65 3.65 3.65 13.00% 3.65 3.65 3.65 3.65 3.65 3.65 3.65 3.65 14.00% 3.65 3.65 3.65 3.65 3.65 3.65 3.65 3.65 15.00% 3.65 3.65 3.65 3.65 3.65 3.65 3.65 3.65 20.00% 18.25 18.25 18.25 18.25 18.25 18.25 18.25 18.25 25.00% 18.25 18.25 18.25 18.25 18.25 18.25 18.25 18.25 30.00% 18.25 18.25 18.25 18.25 18.25 18.25 18.25 18.25 35.00% 18.25 255.50 18.25 18.25 18.25 18.25 18.25 18.25 40.00% 18.25 18.25 18.25 18.25 18.25 18.25 18.25 45.00% 18.25 18.25 18.25 219.00 18.25 18.25 18.25 50.00% 18.25 18.25 18.25 18.25 18.25 18.25 55.00% 18.25 18.25 18.25 18.25 18.25 18.25 60.00% 18.25 18.25 18.25 18.25 18.25 18.25 65.00% 18.25 18.25 18.25 18.25 18.25 18.25 66.67% 6.08 6.08 6.08 6.08 6.08 6.08 70.00% 12.17 12.17 12.17 12.17 121.66 12.17 75.00% 18.25 18.25 18.25 18.25 109.50 80.00% 18.25 18.25 18.25 18.25 85.00% 18.25 73.00 18.25 18.25 90.00% 18.25 18.25 18.25 95.00% 18.25 18.25 18.25 99.00% 18.25 18.25 18.25
Total Flow Duration (days) 365.0 365.0 365.0 365.0 365.0 365.0 365.0 365.0
WEST Consultants, Inc. P-5 USACE Geomorphology Study October 25, 2012

Table 7-2. Duration of SIAM Discharge Profiles for LPP and FCP Diversion Canals
Profile (% time equaled
or exceeded)
Duration (days)
Profile (% time equaled
or exceeded)
Duration (days)
LPP Diversion
FCP Diversion
LPP Diversion
(continued)
FCP Diversion
(continued)
0.001% 0.004 0.37 2.60% 0.73 0.05% 0.18 17.89 2.80% 0.73 0.10% 0.18 18.25 3.00% 0.73 0.15% 0.18 18.25 3.50% 1.83 0.20% 0.18 18.25 4.00% 1.83 0.25% 0.18 18.25 4.50% 1.83 0.30% 0.18 18.25 5.00% 1.83 0.35% 0.18 18.25 6.00% 3.65 0.40% 0.18 18.25 7.00% 3.65 0.45% 0.18 18.25 8.00% 3.65 0.50% 0.18 18.25 9.00% 3.65 0.60% 0.37 36.50 10.00% 3.65 0.70% 0.37 36.50 11.00% 3.65 0.80% 0.37 109.50 12.00% 3.65 0.90% 0.37 13.00% 3.65 1.00% 0.37 14.00% 3.65 1.20% 0.73 15.00% 3.65 1.40% 0.73 20.00% 18.25 1.60% 0.73 25.00% 18.25 1.80% 0.73 30.00% 18.25 2.00% 0.73 35.00% 18.25 2.20% 0.73 40.00% 18.25
2.40% 0.73 45.00% 219.00 Total Flow
Duration (days)
365.0 365.0
7.3.2.2 Bed Material Gradations
Development of the SIAM model required bed material gradation information for each reach. The sediment size distribution gained from the bed core samples collected during the field investigation were entered into HEC-RAS as the percent of the total sediment gradation finer than a particular sediment class particle diameter by weight (e.g., see Figure 7-3). Twenty
WEST Consultants, Inc. P-6 USACE Geomorphology Study October 25, 2012
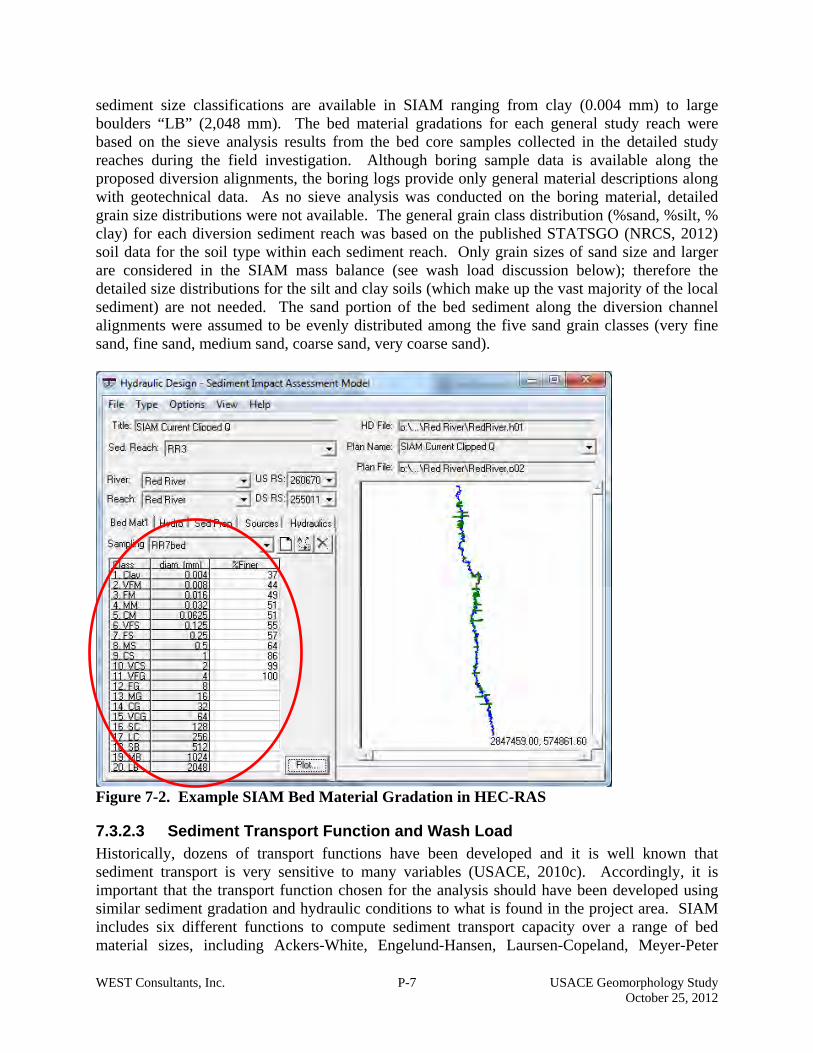
sediment size classifications are available in SIAM ranging from clay (0.004 mm) to large boulders “LB” (2,048 mm). The bed material gradations for each general study reach were based on the sieve analysis results from the bed core samples collected in the detailed study reaches during the field investigation. Although boring sample data is available along the proposed diversion alignments, the boring logs provide only general material descriptions along with geotechnical data. As no sieve analysis was conducted on the boring material, detailed grain size distributions were not available. The general grain class distribution (%sand, %silt, % clay) for each diversion sediment reach was based on the published STATSGO (NRCS, 2012) soil data for the soil type within each sediment reach. Only grain sizes of sand size and larger are considered in the SIAM mass balance (see wash load discussion below); therefore the detailed size distributions for the silt and clay soils (which make up the vast majority of the local sediment) are not needed. The sand portion of the bed sediment along the diversion channel alignments were assumed to be evenly distributed among the five sand grain classes (very fine sand, fine sand, medium sand, coarse sand, very coarse sand).
Figure 7-2. Example SIAM Bed Material Gradation in HEC-RAS
7.3.2.3 Sediment Transport Function and Wash Load Historically, dozens of transport functions have been developed and it is well known that sediment transport is very sensitive to many variables (USACE, 2010c). Accordingly, it is important that the transport function chosen for the analysis should have been developed using similar sediment gradation and hydraulic conditions to what is found in the project area. SIAM includes six different functions to compute sediment transport capacity over a range of bed material sizes, including Ackers-White, Engelund-Hansen, Laursen-Copeland, Meyer-Peter
WEST Consultants, Inc. P-7 USACE Geomorphology Study October 25, 2012

Müller, Toffaleti, and Yang. The dominant bed and bank material for the Red River and its tributaries is cohesive clay. None of the transport functions available in SIAM were developed based on clay size materials. Of the six available transport functions, all but Laursen-Copeland were developed from data based on sand or larger sized particles, making them poor choices for this analysis. While Laursen-Copeland was developed for material sizes that extend to the range of coarse silt, finer silts and clay size particles are outside the range of applicability. The Laursen-Copeland function was selected for all sediment reaches; however, it should be noted that applying this function to predominantly clay-sized material gives results that are extrapolated well beyond the range of the data used to derive the functions. This could result in the compounding of extrapolation errors in addition to the already significant uncertainty that is associated with sediment transport calculations. Further complicating the available transport functions is the cohesive nature of the clay sediments. While the standard sediment transport module (HEC-6) in HEC-RAS does provide the ability to enter erosion parameters manually for cohesive sediments (should that data be known), this feature is not available in SIAM. It would be expected that SIAM would over predict the erosion and transportation of cohesive sediments. The maximum wash load threshold is also required in SIAM. Wash load is sediment in transport derived from sources other than the bed (Biedenharn et al., 2006). SIAM does not apply standard transport equations to compute a mass balance for wash load material (USACE, 2010). Instead, the program automatically passes any particle equal to or smaller than the maximum wash load through the system. Although there is no universally accepted method of selecting a wash load threshold, the material is often considered the fine-sized silt and clay material (particles less than 0.0625 mm in diameter). Einstein (1950) defined wash load as the grain size of which 10 percent of the bed mixture is finer; however, as the dominant sediment in the Red River system are clay sized particles and the sediment load is close to 99% suspended load (USGS, 2011b), the Einstein guideline is not considered to be applicable. Based on an evaluation of the suspended and bedload sediment collection data from the USGS for the project site, the wash load threshold was set at 0.0625mm, corresponding to coarse silt. As a result, the problematic silt- and cohesive clay-sized materials that dominate the system are finer than the wash load threshold and are therefore excluded from the mass balance.
7.3.2.4 Sediment Sources In order to compare sediment transport capacity to sediment supply, SIAM requires sediment supply data to be input for each reach. The sediment supply data are entered by source as annual sediment loads in tons per year per grain class. Three primary sediment sources were identified: channel banks, ground surface, and upstream or tributary inflows. Typically, estimates of bank erosion can be calculated based on annual erosion and/or migration rates as were discussed in Section 6.1.8 of this report. These calculations all resulted in zero or near zero erosion rates. It was therefore assumed that the contribution of bank sediments to the channels due to channel migration occur too slowly to be worth considering as a sediment supply source in the SIAM modeling. As discussed in section Sections 6.1.8, a cyclic pattern of bank deposition, failure, and erosion was observed based on the field investigations and aerial imagery analysis; however, quantifying the net loss rate of sediment from the banks was not considered
WEST Consultants, Inc. P-8 USACE Geomorphology Study October 25, 2012

possible. Therefore, while it is understood that this cycle contributes a portion of the annual sediment supply to the channel, no estimates of the contributions were included in SIAM. It is assumed that annual sediment contributions from the banks are minimal due to the slow rate of this process, the cohesive nature of the dominant bank sediments, and the very small percentage of the bank material that is not considered wash load. The primary sediment supply for the Red River and its tributaries is considered to be the surrounding agricultural fields that compose the majority of the watershed. Sediment is transported from the surrounding fields to the channels through sheet erosion, rills and gullies, drainage canals, and through subsurface drains (e.g.Figure 7-4). Accurately determining surface sediment contribution is difficult. Soil loss equations such as the Revised Universal Soil Loss Equation (RUSLE, Renard, et al., 1997) can provide estimates of soil losses due to rainfall erosion; however, they do not consider wind erosion and also do not give direct sediment yield estimates (Novotny and Olem, 1994). Furthermore, while they can provide estimates of soil losses, soil loss equations such as RUSLE require detailed information on crops, rotation practices, plowing and irrigation methods, and conservation practices that can make application over large areas particularly problematic. The U.S.D.A. Agricultural Non-Point Source Pollution Model (AnnAGNPS) is based on the RUSLE, but is expanded to predict sediment yield by using the Natural Resource Conservation Service Technical Report 55 rain fall-runoff model (TR55). While this model does provide an estimate of sediment yield, it requires a large set of input data and is a significant undertaking.
. Figure 7-3. Sediment Deposition in Wolverton Creek at a Drain Tile Outlet According to the USGS, sediment transported by the Red River and its tributaries during the 2010 and 2011 high flow periods was comprised of 99% suspended load and 1% bedload. Annual surface sediment contribution for SIAM was estimated using the sediment transport
WEST Consultants, Inc. P-9 USACE Geomorphology Study October 25, 2012

rating curves discussed in Section 4.2.2. While suspended and bedload data were collected for most of the study streams during the 2010 and 2011 high flow events, little or no data was available for lower discharges at most locations. Only three gages had a range of sediment measurements that were considered reasonable for creating a sediment rating curve. For each of these three gage sites (Red River at Hickson, Red River at Fargo, and Sheyenne at Kindred), the sediment rating curve was multiplied by the annualized flow duration curve to arrive at an annual total sediment load in tons per year. Despite the availability of good sediment data for the 2010 and 2011 flood season for the remaining sampling locations, the flows during which sediment measurements were taken occur relatively infrequently and make up only a small portion of the annual flow-duration curve; therefore, calculating an annualized sediment yield would require significant extrapolation of sediment transport over the majority of the annual flow-duration curve. The results of the estimates are presented in Table 7-3. For comparative purposes, published studies detailing soil loss estimates for the region were reviewed. A study of sediment production for the south branch of the Buffalo River watershed using AnnAGNPS resulted in an estimate annual sediment yield of 0.05 tons/acre/yr (Lauer et al., 2006). Table 7-3. Estimated Annual Sediment Load
Location Annual Sediment Load
(tons/yr) (tons/acre/yr) Red River at Hickson 51,445 0.02 Red River at Fargo 95,555 0.03 Sheyenne River at Kindred 61,434 0.03
Average 0.03 The selected value of 0.03 tons/acre/year for annual surface contribution was used to estimate two sets of sediment inputs for SIAM, the inflowing sediment load to the most upstream sediment reach of each stream and the inflowing sediment load for each individual sediment reach. The sediment inflow to the upstream end of the uppermost reach of each river is based on the entire contributing watershed area upstream of the inflow point (Figure 7-11). The sediment inflow to the downstream sediment reaches is based on the contributing surface area to each individual sediment reach. The Contributing surface area and annual sediment yield for each sediment reach are provided in Table 7-4.
Tributary sediment inflows were based on SIAM model output for each tributary. Therefore, contributing tributary areas were excluded from the surface area computed for each sediment reach. For example, although sediment reach Sheyenne River 3 (SR3) is below the Maple River, which contributes to SR3, the surface area contributing to SR3 excludes the Maple River basin surface area. Instead, only the portion of the sediment from the Maple River basin that could be passed annually through its downstream most reach (MR1) based on SIAM results, was used as input into SR3.
WEST Consultants, Inc. P-10 USACE Geomorphology Study October 25, 2012

Table 7-4. Sediment Inflows for each General Study Reach
Sediment Reach Contributing Surface Area (acres) Annual Sediment Yield (tons)
Ground Surface Inputs Buffalo River - 1 2,690 269 Lower Rush River - 1 2,240 224 Lower Rush River - 2 3,328 333 Maple River - 1 5,888 589 Maple River - 2 11,392 1,139 Red River - 1 10,893 10,828 Red River - 2 643,346 64,335 Red River - 3 38,919 338,243 Red River - 4 9,631 963 Red River - 5 57,124 137,185 Red River - 6 6,648 7,443 Red River - 7 12,096 1,210 Red River - 8 23,152 2,315 Rush River - 1 2,176 218 Rush River - 2 12,160 1,216 Sheyenne River - 1 25,837 2,577 Sheyenne River - 2 14,496 11,346 Sheyenne River - 3 3,812 4,278 Sheyenne River - 4 1,337 95,082 Sheyenne River - 5 15,903 1,590 Sheyenne River - 6 17,107 1,711 Sheyenne River - 7 13,224 1,322 Sheyenne River - 8 5,028 503 Wild Rice River 1 717 72 Wild Rice River 2 20,224 2,022 Wild Rice River 3 21,632 2,163 Wild Rice River 4 35,412 3,541 Wild Rice River 5 27,092 2,709 Wild Rice River 6 1,135 114 Wolverton Creek 1 283 28 Wolverton Creek 2 9,822 982
Upstream Inflow ContributionBuffalo River - 1 633,084 63,308 Lower Rush River - 2 33,856 3,386 Maple River - 2 931,776 93,178 Red River - 8 2,105,592 210,559 Rush River - 2 84,672 8,467 Sheyenne River - 8 2,170,091 217,009 Wild Rice River - 6 1,176,351 117,635 Wolverton Creek - 2 55,968 5,597
WEST Consultants, Inc. P-11 USACE Geomorphology Study October 25, 2012

WEST Consultants, Inc. P-12 USACE Geomorphology Study October 25, 2012
Since SIAM requires the annual sediment supply to be parsed by grain size, the total supply for each general study reach was distributed based on the 2010/2011 USGS sediment sample distributions. A composite grain size distribution was created for each reach by weighting the mean of the bedload and suspended load samples based on a ratio of 99.5% suspended load and 0.5% bedload. The upstream inflow to sediment reach Red River 8 was based on a ratio of 96% suspended load to 4% bedload. An example grain size distribution for the Maple River is provided in Table 7-5. Grain size distributions for the other study reaches are located in Appendix J.

Table 7-5. Sample Grain Size Distribution for the Maple River
Grain Size Suspended Sediment Bedload
Weighted by % Final
weighted
Final field input values for SIAM
SS (99.5%) Bedload (0.5%) (reach)-> MR1 MR2 Upstream
MR2 (mm) (% finer) (% finer) (% finer) (% finer) (% finer) (acres)-> 5,888 11,392 931,776
0.0625* 97 11 96.52 0.06 96.57
170.6 330.0 26994.5 0.125 98 17 97.51 0.09 96.60 0.1 0.1 8.4 0.25 100 28 99.50 0.14 96.66 0.1 0.2 15.4 0.5 100 52 99.50 0.26 99.76 5.5 10.6 867.9 1 75 0.00 0.38 99.88 0.2 0.4 32.1 2 91 0.00 0.46 99.96 0.1 0.3 22.4 4 98 0.00 0.49 99.99 0.1 0.1 9.8 8 100 0.00 0.50 100.00 0.0 0.0 2.8
* Though the SIAM grain size distribution continues down to 0.004mm, none of the USGS suspended sediment samples contained enough material to determine individual grain class below 0.0625mm Sum 176.6 341.8 27953.3
WEST Consultants, Inc. P-13 USACE Geomorphology Study October 25, 2012

7.3.2.5 Sediment Input Distribution Under the current condition models, sediment inputs in SIAM are a combination of upstream inflow (at the upstream most sediment reach), surface inputs from the area contributing to each sediment reach, and any sediment inflows from tributaries (based on the SIAM results for that tributary). Schematics of assumed sediment inputs for the Red River and Sheyenne River are provided as Figure 7-4 and Figure 7-5. For the FCP models all sediment inputs are the same as current conditions except for the Red River. A constant discharge is assumed along the length of the protected portion of the Red River between the Wild Rice River and the Sheyenne River. To maintain consistency with this assumption, no external (surface) sediment inputs are assumed to be contributing along the protected portion of the Red River (RR3 through RR5). A schematic of inputs for the Red River under the FCP scenario is provided as Figure 7-6. Similarly, for the FCP scenario it has been assumed that no additional inflows occur along the length of the FCP diversion channel. To maintain consistency with this assumption, no additional external (surface) sediment inputs are assumed to be contributing along the FCP diversion. Only sediment from the Red River that enters the FCP diversion channel at its upstream end was included (Figure 7-7). The FCP diversion intercepts flood waters from the Red River. These floodwaters are routed to the diversion over a weir control structure with downstream flow to the Red River being controlled by adjustable gates. While SIAM can do simple accounting of sediment supply and capacity downstream along a watercourse, it does not have the ability to route and distribute sediment between divergent reaches such as the Red River and the FCP diversion channel. Ultimately the exact impact of the flow control structure on sediment routing is unknown and it was conservatively assumed that all sediment in the Red River would continue being transported downstream of the diversion into the next sediment reach and that no sediment would be diverted to the diversion channel. For the FCP diversion model it was assumed that the Red River would be transporting only very fine sand and smaller sized material in suspension. Therefore, only these grain sizes would be able to flow over the weir into the diversion channel. The larger particle sizes were assumed to be moving as bedload and therefore would be prevented from entering the diversion channel via the entrance weir. For the LPP scenario it is assumed that there is a constant discharge along the length of the protected portion of the Red River between its confluence with Wild Rice River and its confluence with the Sheyenne River. Accordingly, it is assumed that no surface sediment inputs contribute to the protected portion of the Red River (RR2 through RR6) aside from what is transported into the Red River via the Wild Rice River and the Sheyenne River (Figure 7-8). A similar assumption of consistent discharge and no surface sediment inputs is made for the protected portions of the Sheyenne River (SR1 through SR6) with the exception of the discharge and sediment contributed by the Maple River (Figure 7-9). The LPP diversion channel intercepts floodwaters from the Red River, Sheyenne River, Wild Rice River, Maple River, Lower Rush River and Rush River. For the Red, Sheyenne, Wild Rice and Maple Rivers, it was
WEST Consultants, Inc. P-14 USACE Geomorphology Study October 25, 2012

conservatively assumed that all sediment would continue being transported downstream of the diversion into the next sediment reach and that no sediment would be diverted to the diversion channel. For the LPP diversion model it was assumed that only very fine sand and finer material would be in suspension in the Sheyenne, Wild Rice and Maple Rivers. Therefore only these grain sizes would be able to flow over the associated weir into the diversion channel. The larger particle sizes were assumed to be moving as bedload and therefore would be prevented from entering the diversion channel via the entrance weir. Since the LPP diversion intercepts 100% of the discharge from the Rush and Lower Rush Rivers, it was assumed that all sediment grain sizes could pass from these rivers into the diversion channel (Figure 7-10).
Figure 7-4. Red River Sediment Inputs (Current Condition)
WEST Consultants, Inc. P-15 USACE Geomorphology Study October 25, 2012

Figure 7-5. Sheyenne River Sediment Inputs (Current and FCP)
WEST Consultants, Inc. P-16 USACE Geomorphology Study October 25, 2012

5 Figure 7-6. Red River Sediment Inputs (FCP Condition)
WEST Consultants, Inc. P-17 USACE Geomorphology Study October 25, 2012

Figure 7-7. FCP Diversion Sediment Inputs
WEST Consultants, Inc. P-18 USACE Geomorphology Study October 25, 2012

Figure 7-8. Red River Sediment Inputs (LPP Condition)
WEST Consultants, Inc. P-19 USACE Geomorphology Study October 25, 2012

Figure 7-9. Sheyenne River Sediment Inputs (LPP Condition)
WEST Consultants, Inc. P-20 USACE Geomorphology Study October 25, 2012

Figure 7-10. LPP Diversion Sediment Inputs
WEST Consultants, Inc. P-21 USACE Geomorphology Study October 25, 2012

7.4 SIAM Results A summary of the local sediment balance results from SIAM are provided in Table 7-6 through Table 7-11. The local sediment balance value indicates whether deposition (positive value) or erosion (negative value) of the sediment reach occurs. Please note that SIAM is not a sediment routing model and that results from SIAM represent general trends of surplus and deficit only and not actual volumes of eroded or deposited material. While SIAM is a very useful sediment management tool, the following limitations should be considered when reviewing the results (Little and Jonas, 2010):
• Channel geometry is not updated in SIAM based on erosion or deposition (i.e., hydraulics are not updated or changed over time during a model run)
• No time frame for sediment impacts is computed • Reach-averaged values are used in all computations (localized effects of hydraulic
structures are not considered and include the numerous dams, weirs and gates located throughout the Red River and its tributaries)
• There is no limitation on bed material supply (i.e., SIAM assumes erosion will continue indefinitely from the bed until the sediment transport capacity is satisfied)
Compounding these issues are uncertainties in annual sediment loads which were discussed previously. It is understood that the majority of the sediments found in the system are much smaller in size than was used to develop the available sediment transport functions in SIAM and are therefore based on extrapolations. Furthermore, SIAM does not have the ability to address cohesive sediment, which is a distinguishing characteristic of the majority of the sediment in the study reaches. Lastly, while SIAM limits its calculations to the channel portion of the model cross sections, the HEC-RAS models used for the analysis are simplified versions of the unsteady HEC-RAS models provided by the St. Paul District, which have extremely complex overbank hydraulics and flood storage. The discharge duration curves used in the SIAM models have been limited at their upper ends (as described in Section 4.4.2) at the point where the flood discharges are large enough to produce possibly erroneous results in the simplified hydraulic models. This effectively removes a portion of the annual sediment transport capacity from the models that would occur during larger flood events. While the effective annual durations of these extreme events are relatively short, this does potentially affect the SIAM results. Additionally, the increased water surface elevations due to flood staging for those reaches of Wolverton Creek, Wild Rice River and Red River that are located in the staging area upstream of the LPP alignment, were not considered in the SIAM analysis because the simplified bankfull models are not able to accurately represent the potentially complex hydraulic conditions associated with the storage of flood waters. Accordingly, the results presented herein are considered adequate for the determination of general trends and for comparisons between the LPP, HCP and current conditions results but should not be used to estimate actual sediment transport volumes. It should also be noted that model boundary effects are likely to have an impact on results for some of the sediment reaches. Typically, with subcritical HEC-RAS modeling the location of the upstream limit of the hydraulic model can coincide with the beginning of the area of interest, as the upstream boundary limit will not affect results. However, when using the SIAM module
WEST Consultants, Inc. P-22 USACE Geomorphology Study October 25, 2012

the location of the upstream limit of the model in relation to the overall length of the river can be of greater importance depending on local hydraulic conditions and the magnitude of the available upstream sediment inflows. As previously discussed, two sediment sources were entered into SIAM for all sediment reaches. Surface sediment based on the basin area contributing along the length of the sediment reach was input for all reaches. The upstream most sediment reach on each river also included sediment inflow from upstream which, for lack of better information, was based on the entire contributing drainage area upstream of that point (Figure 7-11). For example, the basin area that contributes to the upper end of the Wild Rice study reach (Wild Rice 6) is 1,176,350 acres. Based on 0.03 tons/acre/yr the calculated annual upstream sediment inflow at this point is 35,291 tons. Of this, 1,198 tons are of a grain size greater than the wash load threshold of 0.0625 mm (only sediment larger than the washload threshold is part of the sediment mass balance). The surface sediment inflow component for Wild Rice 6 is 34 tons with only 1 ton being above the washload threshold. The total non-washload component for both sources amounts to 1,199 tons of which 948 tons are deposited based on SIAM results. The calculated deposition is partially an artifact of the arbitrary location for the start of the analysis and the spike in available sediment. Had the model boundary been located further upstream, SIAM would likely have deposited some of this material upstream of Wild Rice 6, possibly resulting in a different SIAM result. While the nature of SIAM precludes trying to interpret results as volumes of sediment, it is still important to consider the possible effect of the boundary location on the SIAM result. An artificially large supply from upstream could result in SIAM predicting deposition when in fact this may not be occurring. The SIAM local balance results for the Existing Conditions, FCP, and LPP diversion alternatives are provided in Table 7-4 through Table 7-13 and in Figure 7-13 through Figure 7-15. A summary of predicted trends between the FCP and LPP alignments and Existing Conditions is presented in Table 7-16. For the purposes of this discussion, trend shifts between Existing Conditions and the FCP and LPP diversion alternatives are defined as a shift from aggradation to degradation or vice versa, not as changes in magnitude of aggradation or degradation. Figure 7-16 and Figure 7-17 show the sediment trend shifts that are predicted to occur under the FCP and LPP alignment alternatives, respectively.
WEST Consultants, Inc. P-23 USACE Geomorphology Study October 25, 2012

Figure 7-11. Wild Rice Sediment Contributing Basins For the Buffalo River, SIAM predicts a sediment deficit and net erosion. The LPP and FCP diversions will not impact the Buffalo River and therefore no SIAM modeling was conducted.
WEST Consultants, Inc. P-24 USACE Geomorphology Study October 25, 2012

Table 7-4. Local Sediment Balance Results for Buffalo River
Study Reach
Local Sediment Balance : Bed Material Current LPP FCP
- = Degradation (red) - = Degradation (red) - = Degradation (red)
+ = Aggradation (blue) + = Aggradation (blue) + = Aggradation (blue)
(tons/yr) (tons/ft/yr) (tons/yr) (tons/ft/yr) (tons/yr) (tons/ft/yr) Buffalo River 1 -246 -0.01 1/ 1/ 1/ 1/
Net
Deposition: Average: Net Deposition: Average: Net
Deposition: Average:
-246 -0.01 1/ 1/ 1/ 1/
1/ Not affected by diversion channel - not modeled in SIAM For the Lower Rush River, SIAM predicts some aggradation in the upstream reach (possibly influenced by boundary conditions) and minor degradation in the downstream reach. The FCP diversion will not impact the Lower Rush River and therefore no SIAM modeling was conducted. The LPP diversion will intercept 100% of the flow from the Lower Rush River. Therefore, SIAM modeling was not conducted. Table 7-5. Local Sediment Balance Results for Lower Rush River
Study Reach
Local Sediment Balance : Bed Material
Current LPP FCP
- = Degradation (red) - = Degradation (red) - = Degradation (red)
+ = Aggradation (blue) + = Aggradation (blue) + = Aggradation (blue)
(tons/yr) (tons/ft/yr) (tons/yr) (tons/ft/yr) (tons/yr) (tons/ft/yr) Lower Rush River
1 -5.53 0.00 1/ 1/ 1/ 1/
Lower Rush River 2 261 0.01 2/ 2/ 1/ 1/
Net
Deposition: Average: Net Deposition: Average: Net
Deposition: Average:
255 0.01 1/ 1/ 1/ 1/
1/ Not affected by diversion channel - not modeled in SIAM 2/ No upstream inflow to reach, local inflow unknown - not modeled in SIAM For the Maple River, SIAM predicts net degradation in both sediment reaches, with more significant degradation occurring in the Reach 1. For the LPP scenario, SIAM predicts a decrease in degradation for Reach 2 and minimal change in Reach 1 when compared with current conditions. The reduction in degradation in Reach 2 is an artifact of the truncated duration curves described earlier. Because of backwater effects from diversion channel flood flows under the LPP scenario go out of bank at lower recurrence intervals than under current conditions. Accordingly, to prevent erroneous results in the hydraulic model the duration curve for the LPP condition was truncated at smaller flows (resulting in lower cumulative annual flows). This results in an artificially lower annual transport capacity and less degradation of the channel in
WEST Consultants, Inc. P-25 USACE Geomorphology Study October 25, 2012

Reach 2. The FCP diversion will not impact the Maple River and therefore no SIAM modeling was conducted. Table 7-6. Local Sediment Balance Results for Maple River
Study Reach
Local Balance : Bed Material
Current LPP FCP
- = Degradation (red) - = Degradation (red) - = Degradation (red)
+ = Aggradation (blue) + = Aggradation (blue) + = Aggradation (blue)
(tons/yr) (tons/ft/yr) (tons/yr) (tons/ft/yr) (tons/yr) (tons/ft/yr) Maple River 1 -23,500 -0.65 -22,200 -0.61 1/ 1/ Maple River 2 -1,364 -0.04 -822 -0.02 1/ 1/
Net
Deposition: Average: Net Deposition: Average: Net
Deposition: Average:
-24,864 -0.34 -23,022 -0.32 1/ 1/ 1/ Not affected by bypass canal - not modeled in SIAM For the Red River under current conditions, SIAM predicts degradation in Reaches 1, 3, 4 and 8 and aggradation in Reaches 2, 5, 6 and 7. The most significant aggradation is predicted to occur in Reach 2 which is located immediately downstream of confluence with the Sheyenne River. For the LPP scenario, SIAM predicts the sedimentation patterns will remain generally consistent for all reaches except that the aggradation in Reach 2 will be reduced. This reduction in aggradation is an artifact of the assumption that there is no surface sediment contribution along the protected portion of the Red River. The lack of surface sediment for this reach results in a much lower value of aggradation compared to current conditions For the FCP alignment alternative, sedimentation patterns are predicted to remain relatively consistent compared to current conditions, though Reach 2 shows a noticeable increase in aggradation. This increase is the result of increased sediment loading from the FCP diversion channel. While the steeper channel gradient in the lower reach of the diversion channel (FCP1) is likely to result in degradation which will cause significant additional sediment inputs to Red River Reach 2, the magnitude of the change predicted by SIAM is likely an artifact of the unlimited bed sediment supply assumed made by the model. Under flood conditions, the downstream most reach (FCP1) of the diversion channel has a relatively large sediment transport capacity compared to the upstream reaches. Also, since it is assumed that there are no significant lateral sediment inputs to the diversion channel, there is significant excess transport capacity in FCP1 compared to the upstream sediment supply. As previously discussed, SIAM assumes an unlimited supply of bed material is available to be removed from the bed. Therefore, the excess transport capacity is satisfied by erosion of the bed. While some degradation of Reach FCP 1 would be expected under these conditions, the cohesive nature of the clay soils underlying the diversion channel and the limited supply of sand found within these soils would likely preclude the relatively large amount of degradation predicted by SIAM. Consequently, the relatively large amount of aggradation predicted for Red River Reach 2 would not occur.
WEST Consultants, Inc. P-26 USACE Geomorphology Study October 25, 2012

Table 7-7. Local Sediment Balance Results for Red River
Study Reach
Local Sediment Balance : Bed Material
Current LPP FCP
- = Degradation (red) - = Degradation (red) - = Degradation (red)
+ = Aggradation (blue) + = Aggradation (blue) + = Aggradation (blue)
(tons/yr) (tons/ft/yr) (tons/yr) (tons/ft/yr) (tons/yr) (tons/ft/yr) Red River 1 -30,000 -0.46 -25,300 -0.39 -19,900 -0.30 Red River 2 91,900 1.64 10,700 0.19 248,000 4.41 Red River 3 -38,200 -0.35 -22,700 -0.21 -20,300 -0.19 Red River 4 -723 -0.02 -851 -0.02 -811 -0.02 Red River 5 843 0.01 196 0.00 458 0.01 Red River 6 12,600 0.18 11,000 0.16 11,000 0.16 Red River 7 47,400 0.64 45,700 0.62 45,700 0.62 Red River 8 -49,500 -0.36 -46,000 -0.33 -45,900 -0.33
Net
Deposition: Average: Net
Deposition:
Average: Net Deposition: Average:
34,320 0.16 -27,255 0.00 218,247 0.54
For the Rush River, SIAM predicts aggradation in the upstream reach and degradation in the downstream reach. The FCP scenario was modeled in SIAM as there were some very minor backwater effects from the Sheyenne River under this scenario. However, SIAM predicted identical results for the FCP alignment alternative as for existing conditions. The LPP diversion will intercept 100% of the flow from the Rush River. Therefore, SIAM modeling was not conducted. Table 7-8. Local Sediment Balance Results for Rush River
Study Reach
Local Sediment Balance : Bed Material
Current LPP FCP
- = Degradation (red) - = Degradation (red) - = Degradation (red)
+ = Aggradation (blue) + = Aggradation (blue) + = Aggradation (blue)
(tons/yr) (tons/ft/yr) (tons/yr) (tons/ft/yr) (tons/yr) (tons/ft/yr) Rush River 1 -39 0.00 1/ 1/ -39 0.00 Rush River 2 158 0.00 2/ 2/ 158 0.00
Net
Deposition: Average: Net Deposition: Average: Net
Deposition: Average:
119 0.00 1/ 1/ 119 0.00
1/ Not affected by diversion channel - not modeled in SIAM 2/ No upstream inflow to reach, local inflow unknown - not modeled in SIAM For the Sheyenne River under Existing Conditions, SIAM predicts degradation in Reaches 2, 3, 4 and 7 and aggradation in Reaches 1, 5, 6 and 8. For the LPP alignment alternative, SIAM
WEST Consultants, Inc. P-27 USACE Geomorphology Study October 25, 2012

predicts degradation in Reachs 2, 4, and 7 and aggradation in Reaches 1, 3, 5, 6, and 8. The trend shift from degradation to aggradation in SR3 is likely due to the reduction transport capacity as the majority of the Maple River flows that join the Sheyenne at the upstream end of SR3 are intercepted by the LPP diversion. The exception to this trend in the protected portion of the Sheyenne is Reach 3, for which aggradation is predicted. The aggradation noted in Reach 3 is the result of sediment inflow from the Maple River. While SIAM predicts equilibrium for several of the Sheyenne reaches, this should be considered cautiously, as this is partially a function of the underlying assumptions regarding sediment inputs. While it is assumed that there are no local sediment inputs in the protected area aside from the Maple River, it is likely that some sediment will be contributed to the river which could result in aggradation. However, given that the local soils only contain a minimal component of material larger than the washload threshold, aggradation is expected to be minimal. The increase in deposition predicted for SR8 is again an artifact of having a different truncation point on the LPP discharge duration curve than on the Current Conditions discharge duration curve, as was discussed previously in the Maple River results. For the FCP diversion alternative, the diversion channel only affects the Sheyenne River along its downstream reaches due to minor backwater effects associated with the diversion channel inflows to the Red River. Sediment inputs for the Sheyenne under the FCP scenario are the same as under current conditions and the predicted SIAM trends for the Sheyenne River are predicted to be essentially the same as Existing Conditions. Table 7-9. Local Sediment Balance Results for Sheyenne River
Study Reach
Local Balance : Bed Material
Current LPP FCP
- = Degradation (red) - = Degradation (red) - = Degradation (red)
+ = Aggradation (blue) + = Aggradation (blue) + = Aggradation (blue)
(tons/yr) (tons/ft/yr) (tons/yr) (tons/ft/yr) (tons/yr) (tons/ft/yr) Sheyenne River 1 9,383 0.16 3565 0.06 9,365 0.16 Sheyenne River 2 -4,365 -0.49 -1364 -0.15 -4,387 -0.49 Sheyenne River 3 -9,386 -0.28 12600 0.37 -9,401 -0.28 Sheyenne River 4 -23,200 -1.00 -25100 -1.08 -23,200 -1.00 Sheyenne River 5 2,378 0.07 2156 0.07 2,378 0.07 Sheyenne River 6 10,700 0.18 8097 0.13 10,700 0.18 Sheyenne River 7 -7,398 -0.17 -4956 -0.11 -7,398 -0.17 Sheyenne River 8 8,566 0.09 8731 0.09 8,566 0.09
Net
Deposition: Average: Net Deposition: Average: Net
Deposition: Average:
-13,322 -0.18 3,729 -0.08 -13,377 -0.18
For Wild Rice River under Existing Conditions, SIAM predicts aggradation in Reach 1 and Reach 4 through 6, and degradation in Reaches 2 and 3. For the LPP and FCP alignment
WEST Consultants, Inc. P-28 USACE Geomorphology Study October 25, 2012

alternatives, sedimentation patterns are predicted to remain relatively consistent compared to current conditions. Table 7-10. Local Sediment Balance Results for Wild Rice River
Study Reach
Local Sediment Balance : Bed Material
Current LPP FCP
- = Degradation (red) - = Degradation (red) - = Degradation (red)
+ = Aggradation (blue) + = Aggradation (blue) + = Aggradation (blue)
(tons/yr) (tons/ft/yr) (tons/yr) (tons/ft/yr) (tons/yr) (tons/ft/yr)Wild Rice River 1 948 0.02 529 0.02 962 0.04 Wild Rice River 2 -510 -0.02 -282 -0.01 -709 -0.01 Wild Rice River 3 -506 -0.01 -293 -0.01 -527 -0.02 Wild Rice River 4 232 0.01 171 0.00 233 0.00 Wild Rice River 5 437 0.03 348 0.01 437 0.01 Wild Rice River 6 590 0.07 741 0.05 589 0.04
Net
Deposition: Average: Net Deposition: Average: Net
Deposition: Average:
1,191 0.02 1,214 0.01 985 0.01
For Wolverton Creek under Existing Conditions, SIAM predicts aggradation in the upstream reach and degradation in the downstream reach. SIAM modeling was not conducted for the LPP diversion condition as the diversion is not expected to impact the lower reach of Wolverton Creek, while Reach 2 is located in the staging area for which SIAM modeling is not possible due to the uncertainties involved with channel hydraulics under inundated conditions. The FCP diversion will not impact Wolverton Creek and therefore no SIAM modeling was conducted and no changes in sedimentation trends are expected. Table 7-11. Local Sediment Balance Results for Wolverton Creek
Study Reach
Local Sediment Balance : Bed Material
Current LPP FCP
- = Degradation (red) - = Degradation (red) - = Degradation (red)
+ = Aggradation (blue) + = Aggradation (blue) + = Aggradation (blue)
(tons/yr) (tons/ft/yr) (tons/yr) (tons/ft/yr) (tons/yr) (tons/ft/yr) Wolverton Creek 1 565 0.07 1/ 1/ 2/ 2/ Wolverton Creek 2 -653 -0.03 1/ 1/ 2/ 2/
Net
Deposition: Average: Net Deposition: Average: Net
Deposition: Average:
-88 0.02 1/ 1/ 2/ 2/ 1/ Not modeled in SIAM 2/ Not affected by diversion channel - not modeled in SIAM
WEST Consultants, Inc. P-29 USACE Geomorphology Study October 25, 2012

For the FCP diversion channel, SIAM predicts degradation along sediment Reaches 1, 3 and 4, and aggradation in Reach 2. Notably, significantly greater degradation is predicted for Reach 1 than for the other reaches of the FCP diversion. This is due to the increase in bed slope and velocities at the downstream end of the channel. The magnitude of the predicted degradation is partially an artifact of the unlimited bed assumption as was discussed previously in the Red River results. Table 7-12. Local Balance Results for FCP Alignment
Study Reach US XS DS XS
Local Balance : Bed Material
FCP Alignment
- = Degradation (red)
+ = Aggradation (blue)
(tons/yr) (tons/ft/yr) FCP 1 8744 271 -174,000 -20.54 FCP 2 56554 9849 19,900 0.43 FCP 3 127463 57375 -27,500 -0.39
FCP 4 130278 128453 -6,011 -3.29
Net Deposition: Average:
-187,611 -5.95
For the LPP diversion channel, SIAM predicts degradation for Reaches 1-3 and 9, and aggradation for Reaches 4-8 and 10-12.
WEST Consultants, Inc. P-30 USACE Geomorphology Study October 25, 2012

Table 7-13. Local Balance Results for LPP Alignment
Study Reach US XS DS XS
Local Balance : Bed Material
LPP Alignment
- = Degradation (red)
+ = Aggradation (blue)
(tons/yr) (tons/ft/yr) LPP 1 5500 100 -152 -0.03
LPP 2 19000 6500 -102 -0.01
LPP 3 41000 20000 -50 0.00
LPP 4 53000 42000 31 0.00
LPP 5 67390 53500 1,481 0.11
LPP 6 71000 67550 51 0.01
LPP 7 81230 72000 400 0.04
LPP 8 118500 81370 78 0.00
LPP 9 143000 119500 -94 0.00
LPP 10 152440 143500 17 0.00
LPP 11 170100 152600 294 0.02
LPP 12 184590 171975 6,585 0.52
Net Deposition: Average:
1,660 0.01
WEST Consultants, Inc. P-31 USACE Geomorphology Study October 25, 2012
WEST Consultants, Inc. P-32 USACE Geomorphology Study October 25, 2012
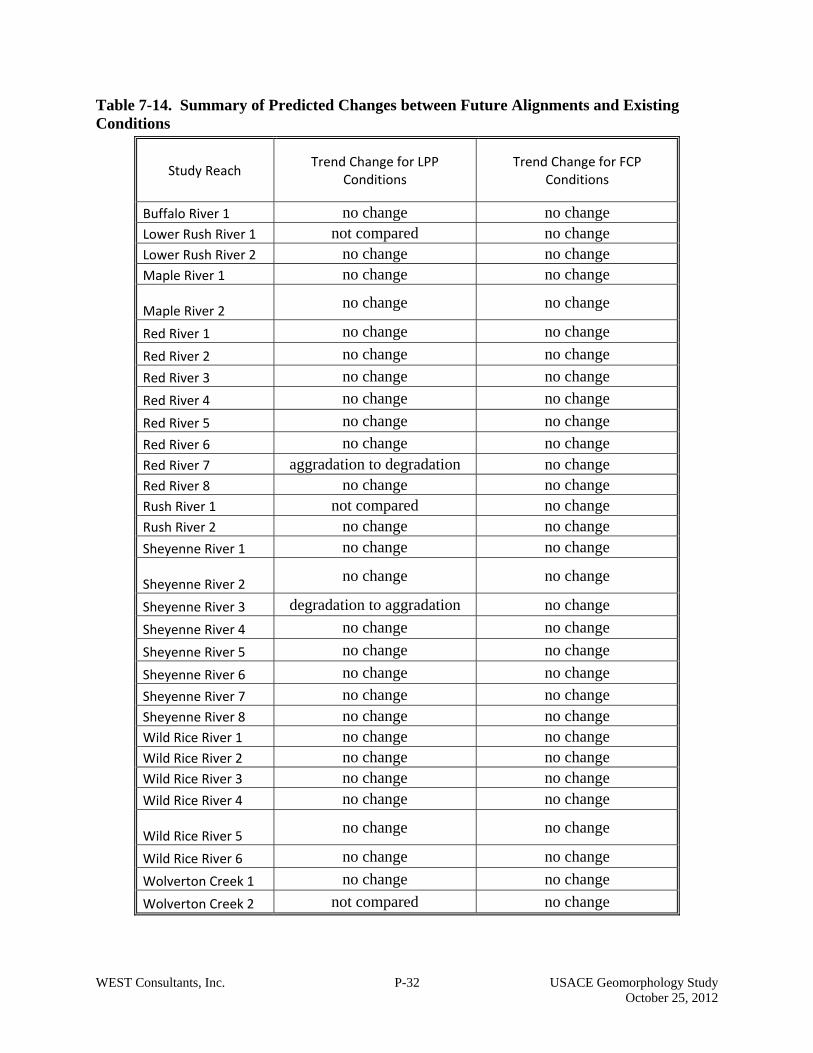
Table 7-14. Summary of Predicted Changes between Future Alignments and Existing Conditions
Study Reach Trend Change for LPP Conditions
Trend Change for FCP Conditions
Buffalo River 1 no change no change Lower Rush River 1 not compared no change Lower Rush River 2 no change no change Maple River 1 no change no change
Maple River 2 no change no change
Red River 1 no change no change Red River 2 no change no change Red River 3 no change no change Red River 4 no change no change Red River 5 no change no change Red River 6 no change no change Red River 7 aggradation to degradation no change Red River 8 no change no change Rush River 1 not compared no change Rush River 2 no change no change Sheyenne River 1 no change no change
Sheyenne River 2 no change no change
Sheyenne River 3 degradation to aggradation no change Sheyenne River 4 no change no change Sheyenne River 5 no change no change Sheyenne River 6 no change no change Sheyenne River 7 no change no change Sheyenne River 8 no change no change Wild Rice River 1 no change no change Wild Rice River 2 no change no change Wild Rice River 3 no change no change Wild Rice River 4 no change no change
Wild Rice River 5 no change no change
Wild Rice River 6 no change no change Wolverton Creek 1 no change no change Wolverton Creek 2 not compared no change

Figure 7-12. Predicted SIAM Trends (Current Conditions)
WEST Consultants, Inc. P-33 USACE Geomorphology Study October 25, 2012
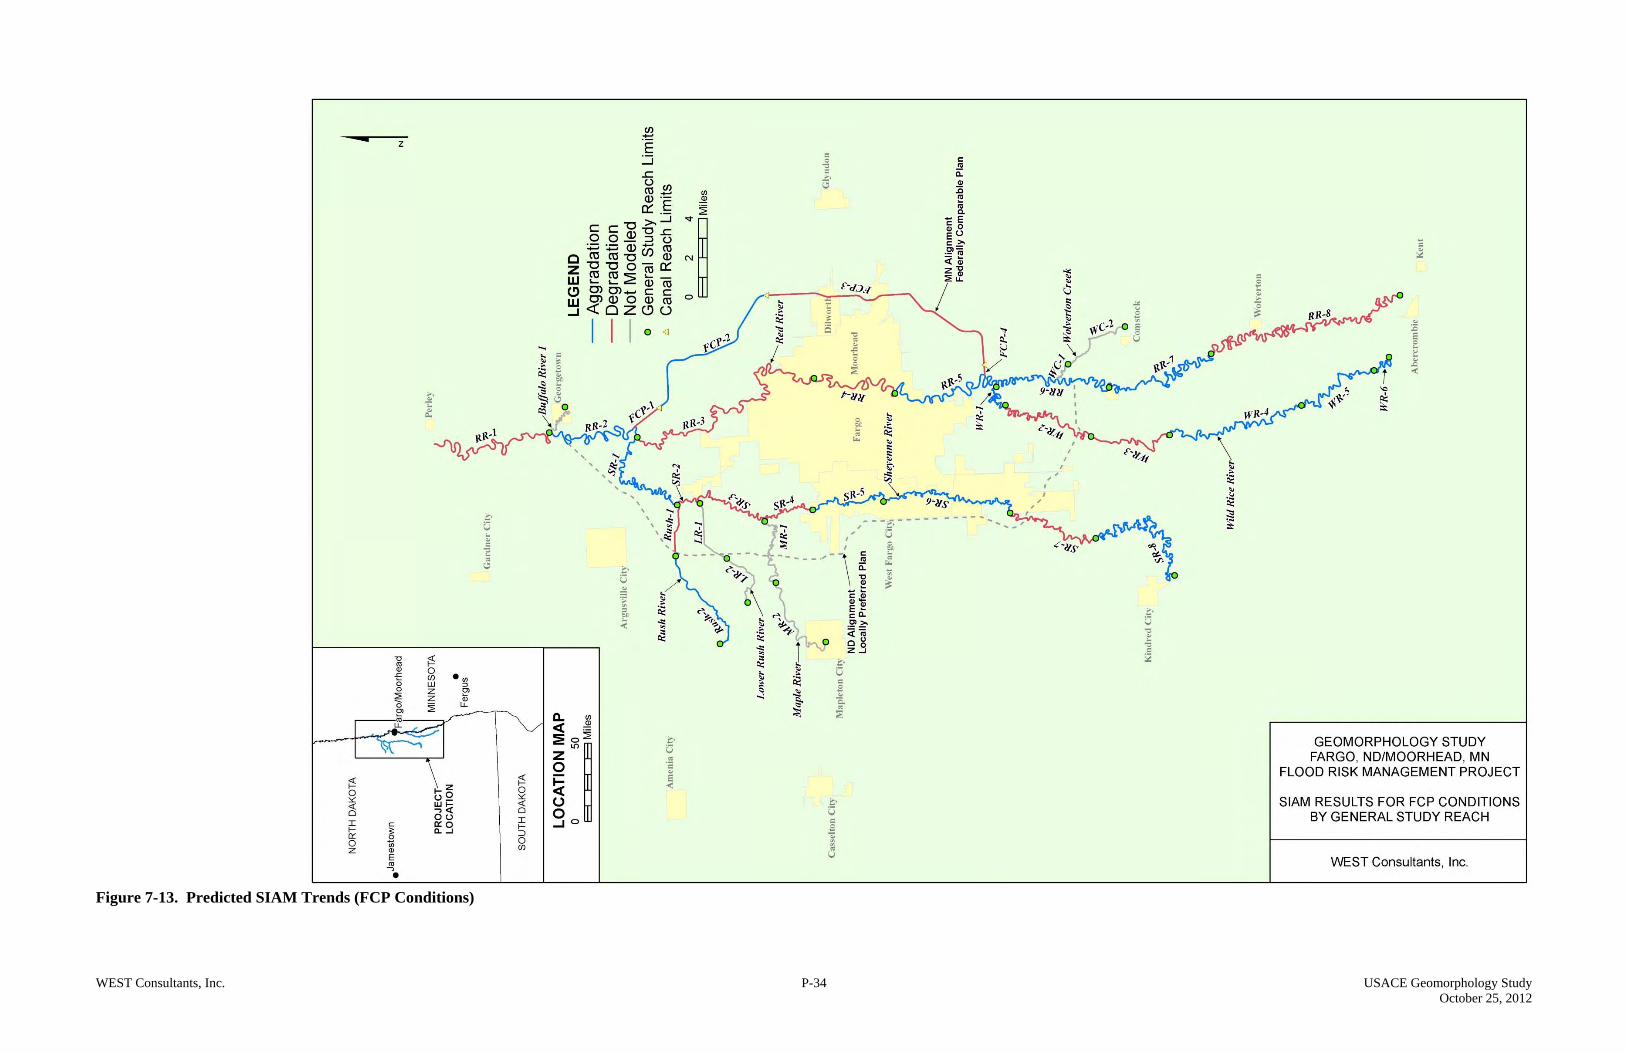
Figure 7-13. Predicted SIAM Trends (FCP Conditions)
WEST Consultants, Inc. P-34 USACE Geomorphology Study October 25, 2012
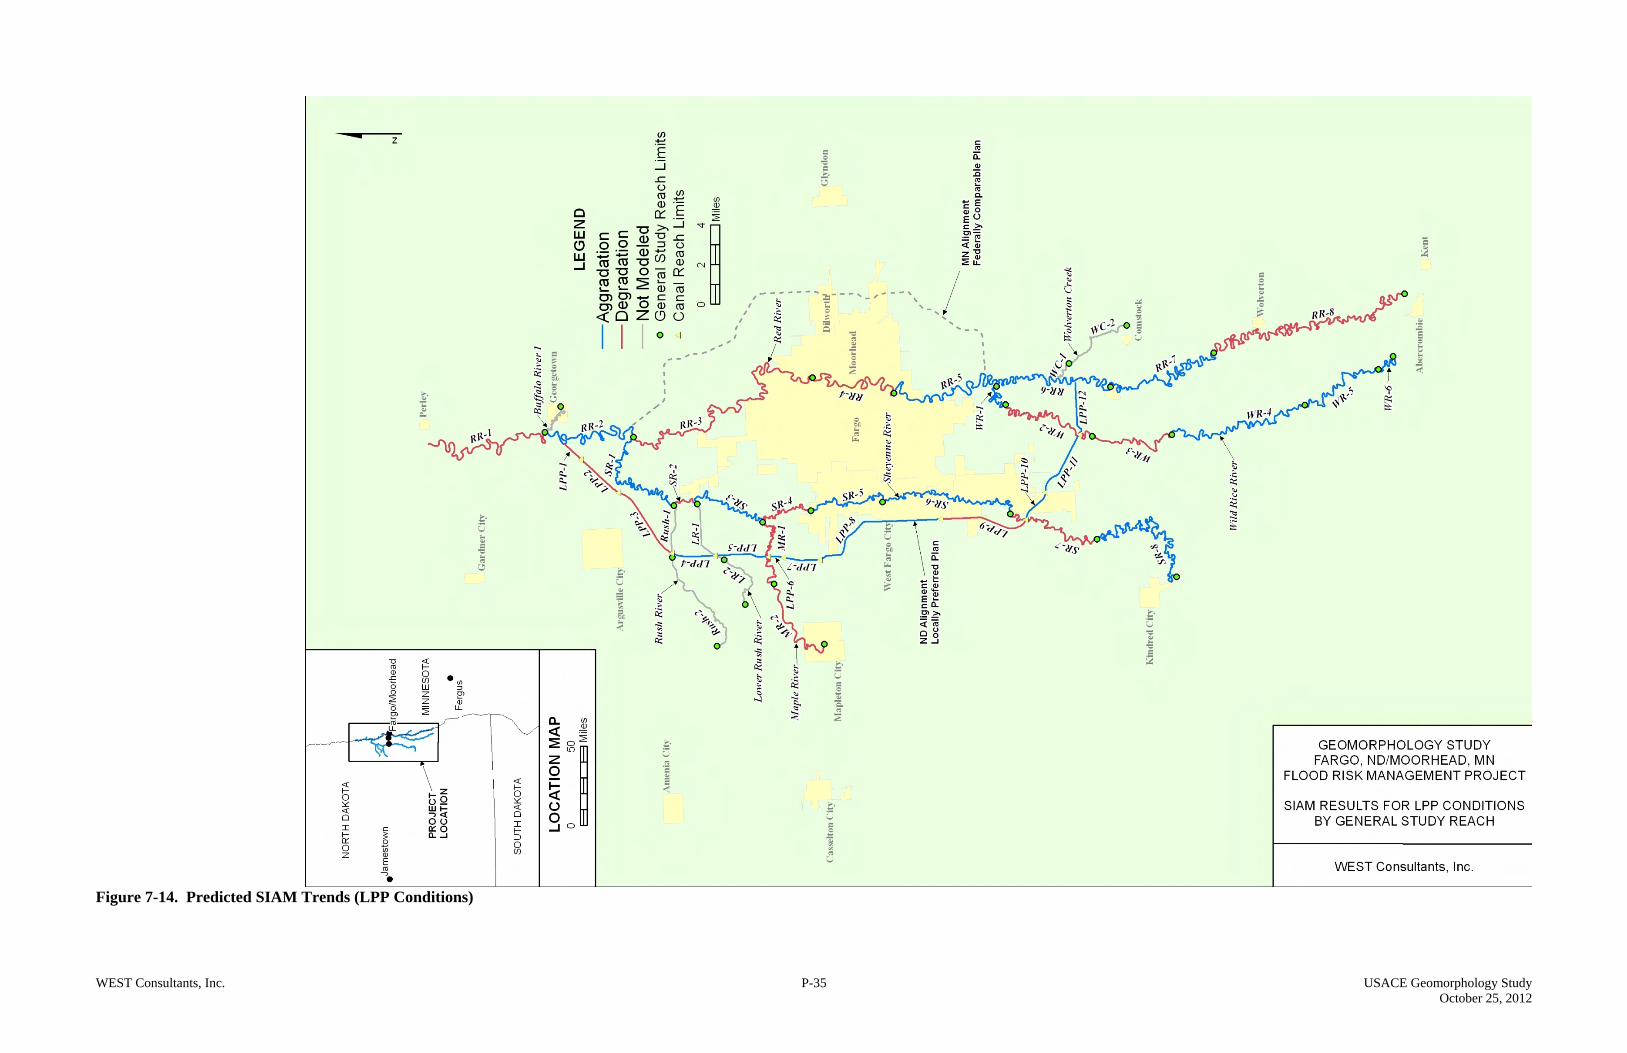
Figure 7-14. Predicted SIAM Trends (LPP Conditions)
WEST Consultants, Inc. P-35 USACE Geomorphology Study October 25, 2012

Figure 7-15. Predicted Shift in Trends between LLP and Current Conditions
WEST Consultants, Inc. P-36 USACE Geomorphology Study October 25, 2012

WEST Consultants, Inc. P-37 USACE Geomorphology Study October 25, 2012
Figure 7-16. Predicted Shift in Trends between FCP and Current Conditions
7.5 Sediment Impact Analysis Conclusions The main purpose of SIAM analysis is to understand if the FCP and LPP alignment alternatives would result in significant alterations to the sediment transport conditions along the study streams. The results of the analysis allow for a better understanding of the potential for the various sediment reaches to shift sedimentation trends from aggradation to degradation or vice versa. Although the output of the SIAM analysis provide magnitudes of aggradation or degradation, it should be recognized that the model’s inherent limitations and the simplifying assumptions required for data input yields values that are not expected to be representative of actual sediment transport rates. Conclusions regarding the results of the SIAM analysis are as follows:
7.5.1 FCP scenario For the FCP alignment alternative, the SIAM model results indicate that there will be no sedimentation trend shifts for any of the study streams. The magnitude of deposition and erosion for most of the sediment reaches are generally similar between the Existing Conditions and FCP alignment alternative. However, Red River Reach 2 is predicted to have a significant increase in deposition for the FCP alternative. This increase is the result of increased sediment loading from the FCP diversion channel. While the steeper channel gradient in the lower reach of the diversion channel (FCP1) is likely to result in degradation, which will cause significant additional sediment inputs to Red River Reach 2, the magnitude of the change predicted by SIAM is likely an artifact of the unlimited bed sediment supply assumed made by the model. Under flood conditions, the downstream most reach (FCP1) of the diversion channel has a relatively large sediment transport capacity compared to the upstream reaches. Also, since it is assumed that there are no significant lateral sediment inputs to the diversion channel, there is significant excess transport capacity in FCP1 compared to the upstream sediment supply. As previously discussed, SIAM assumes an unlimited supply of bed material is available to be removed from the bed. Therefore, the excess transport capacity is satisfied by erosion of the bed. While some degradation of Reach FCP 1 would be expected under these conditions, the cohesive nature of the clay soils underlying the diversion channel and the limited supply of sand found within these soils would likely preclude the relatively large amount of degradation predicted by SIAM. Consequently, the relatively large amount of aggradation predicted for Red River Reach 2 would not occur. However, the results do suggest that FCP Reach 1 would likely require mitigation to increase its long-term stability.
7.5.2 LPP Scenario For the LPP alignment alternative, the SIAM model results indicate that there will be no sedimentation trend shifts for any of the study streams except the Sheyenne River. For the Sheyenne River, SIAM predicts that all of the protected reaches (SR1 – SR6) with the exception of SR3 will experience equilibrium conditions. However, some amount of sediment deposition is likely to occur within these reaches. Deposition would be expected to occur immediately downstream of local inflow drains which are not accounted for in the SIAM model. The deposition predicted for SR3 is due to the introduction of sediments from the Maple River into
WEST Consultants, Inc. P-38 USACE Geomorphology Study October 25, 2012

WEST Consultants, Inc. P-39 USACE Geomorphology Study October 25, 2012
the Sheyenne which has no bedload transport capability due to reduced flows under the LPP scenario.