source area lithological control on sediment … file91 abstract: dumitriu d., source area...
TRANSCRIPT

91
ABSTRACT: DUMITRIU D., Source area lithological control on sedimentdelivery ratio in Trotur drainage basin (Eastern Carpathians). (IT ISSN0391-9838, 2014).
Depending on their response to erosion, we documented the occur-rence of three distinct lithological groups within Trotur drainage basin.The classification criteria were: the petrographic composition of geologi-cal formations, rock hardness, the relative relief and the longitudinal pro-file gradients for 2nd and 3rd order streams in the Strahler classificationsystem. The two parameters employed in computing the sediment deliv-ery ratio (i.e. the gross erosion and the sediment yield) were estimated foreach lithological group based on the multiple regression equations intro-duced by Ichim & alii (1986). The aggregation of gross erosion estimatesfor each lithological group resulted in a total amount of approx. 107x105
t of sediments eroded annually from the entire area of Trotur drainagebasin, of which 0.7x10⁵ tyr–1 were removed from the erosion resistantrocks area, 20.3x10⁵ tyr–1 from the area with moderate resistance to ero-sion, and 86x105 tyr–1 from the area with low resistance to erosion. Thesediment yield derived by using multiple regression was converted tothe specific sediment yield, thus obtaining the following classes: 39-50tkm–2yr–1 for high resistance areas; 220-350 tkm–2yr–1 for moderate resis-tance areas, and 800-1,900 tkm–2yr–1 for areas with low resistance to ero-sion. The values of the sediment delivery ratio reveal the increasinglylarger sediment storage as we approach the junction with Siret river.Thus, in Lunca de Sus gauging station (located 14 km from the headwa-ter) the delivery ratio is as high as 40%, as compared to 23% in Goioasa(54 km from the headwater), 15% in Târgu Ocna (90 km from the head-water), and just 7.6% of the total amount of eroded sediment evacuatedannually in the drainage basin outlet.
KEY WORDS: Lithological control, Sediment delivery ratio, Streamorder, Multiple regression equations, Eastern Carpathians.
REZUMAT: DUMITRIU D., Influen†a litologiei ariilor sursa asupra ra-portului de efluen†a al aluviunilor din bazinul râului Trotur (Carpa†iiOrientali).
În func†ie de comportamentul la eroziune, în cadrul bazinului hidro-grafic al râului Trotur, au fost separate trei grupe litologice. Criteriile deseparare au fost: compozi†ia petrografica a forma†iunilor geologice, duri-tatea rocilor, energia de relief ri gradientul profilelor longitudinale alrâurilor de ordinul 2 sau 3 în sistem Strahler. Cei doi parametri implica†iîn calculul raportului de efluen†a al aluviunilor (eroziunea efectiva sau totala ri produc†ia de aluviuni sau evacuata din bazin) au fost estima†ipentru fiecare grupa litologica în parte cu ajutorul ecua†iilor de regresiemultipla elaborate de catre Ichim & alii (1986. Prin cumularea valorilorestimative ale eroziunii efective ob†inute pentru fiecare grupa litologica, arezultat faptul ca de pe întreaga suprafa†a a bazinului râului Trotur pot fierodate într-un an aproximativ 107x105 din care 0.7x10⁵ tyr–1 pentru arealulcu roci rezistente la eroziune, 20.3x10⁵ tyr–1 t pentru arealul cu rezisten†amoderata la eroziune ri 86x105 tyr–1 pentru arealul cu rezisten†a slaba laeroziune. Valorile raportului de efluen†a pun în eviden†a stocajul din ceîn ce mai mare al sedimentelor, pe masura ce ne apropiem de confluen†acu Siretul. Astfel, la sta†ia hidrometrica Lunca de Sus (situata la 14 kmfa†a de izvor) raportul de efluen†a este de 40%, la Goioasa (la 54 km fa†ade izvor) de 23%, la Târgu Ocna (la 90 km fa†a de izvor) de 15%, iar laierirea din bazin sunt evacuate doar 7.6% din totalul materialelor erodateîntr-un an.
CUVINTE CHEIE: Control litologic, Raport de efluen†a, Ordinul re†eleihidrografice, Ecua†ii de regresie, Carpa†ii Orientali.
INTRODUCTION
Sediment production/delivery is considered one of themost important characteristics of a drainage basin (Ver-straeten, 2006; de Vente & alii, 2007, 2011). This processhas a major influence on riverbed morphology (Prosser& alii, 2001), on sediment deposition rates in reservoirs(Radoane & Radoane, 2005; Vanmaercke & alii, 2011)and, last but not least, on water quality, in general. The useof the term sediment delivery can be traced back at least asfar as the work of Maner & Barnes (1953) and Glymph(1954) (Parsons & alii, 2006). Later on, the terms Sedi-ment Delivery Ratio (SDR) defined as the ratio betweenthe sediment yield (Sy, tkm–2year–1, estimated in a certainriver section) and gross erosion (E, tkm–2year–1, from thedrainage basin upstream the section), during a given time
Geogr. Fis. Dinam. Quat. DOI 10.4461/GFDQ.2014.37.0837 (2014), 91-100, 6 figg., 3 tabb.
DAN DUMITRIU (*)
SOURCE AREA LITHOLOGICAL CONTROL ON SEDIMENT DELIVERYRATIO IN TROTUR DRAINAGE BASIN (EASTERN CARPATHIANS)
(*) Al. I. Cuza University of Iari, Faculty of Geography and Geology22, Carol I Boulevard, Iari RO - 700505 - [email protected]
Part of this work was supported by the Faculty of Geography and Geo-logy, Alexandru Ioan Cuza University of Iasi and by CNCSIS - UEFISCSU,project PNII - IDEI number 436/2007. We are grateful to the reviewersand to P.R. Federici for their suggestions and constructive comments on theearlier draft of this manuscript.

92
interval (Roehl, 1962; Walling, 1983), was introduced anddeveloped. Therefore, the sediment delivery ratio (SDR%)can be calculated using the equation:
SySDR = — x100 (1)
E
where Sy is average annual sediment yield per unit areaand E is average annual erosion over that same area. Inessence, SDR is a scaling factor used to accommodatedifferences in areal averaged sediment yields betweenmeasurement scales. It accounts for the amount of sedi-ment that is actually transported from the eroding sourcesto the catchment outlet compared to the amount of soilthat is detached over the same area above (Hua Lu &alii, 2006). The SDR value is closely related to severalfactors, such as: the nature of sediment sources, their po-sition relative to the riverbed, the hillslope gradients andchannel-bed slope, land use/land cover and rainfall-runofffactors (Klaghofer & alii, 1992; Molina & alii, 2008). SDRestimation methods can generally be grouped into threecategories.
The first range of methods is based on data obtainedby direct measurements on the sediment yield, the waterdischarge and water speed (Gregory & Walling, 1973).Unfortunately, these estimates can only be applied insmall-sized catchments, since such detailed measurementscannot be extended to larger scale basins.
The second, and most commonly employed category ofmethods to date, is based on empirical regression equa-tions which relate SDR to the most important morphologi-cal characteristics of drainage basins, such as the catch-ment area (Roehl, 1962; Walling, 1983; Wasson, 1994;Avendaño & alii, 1997; Onyando & alii, 2005; Boomer &alii, 2008). In this case, the most widely used is the SDR-catchment area power function:
SDR = aAb (2)
where A is the catchment area (km2), a and b are empiricalparameters. This category also includes several models(among which the ones employed by us) taking into ac-count not only the catchment area, but also a combinationof drainage basin factors (Flaxman, 1972; Onstad, 1984;Ichim & Radoane, 1987; Radoane & Ichim, 1987; Neil &Mazari, 1993; Verstraeten & Poesen, 2001; Restrepo &alii, 2006; Grauso & alii, 2008; de Vente & alii, 2011).These models have emerged as a result of research show-ing that the sediment yield is in fact related not only to thecatchment area, but also to the topography, climate, geolo-gy, soil, vegetation and land use/landcover, which in turninfluence hydrologic processess.
Third category comprises of process-based physicalmodels. Most of these estimate the sediment yield and de-position based on runoff data, erosion and depositionprocessess, river transport capacity and sediment residencetime (de Roo & alii, 1989 - LISEM; Flanagan & Nearing,1995 - WEPP; Morgan & alii, 1998 - EUROSEM; Schoorl &
Veldkamp, 2001 - LAPSUS; Kirkby & alii, 2004 - PESERA)(Van Rompaey & alii, 2001, 2005, Verstraeten, 2006; Ver-straeten & Prosser, 2008, Lu & Richard, 2008; de Vente &alii, 2011).
STUDY AREA
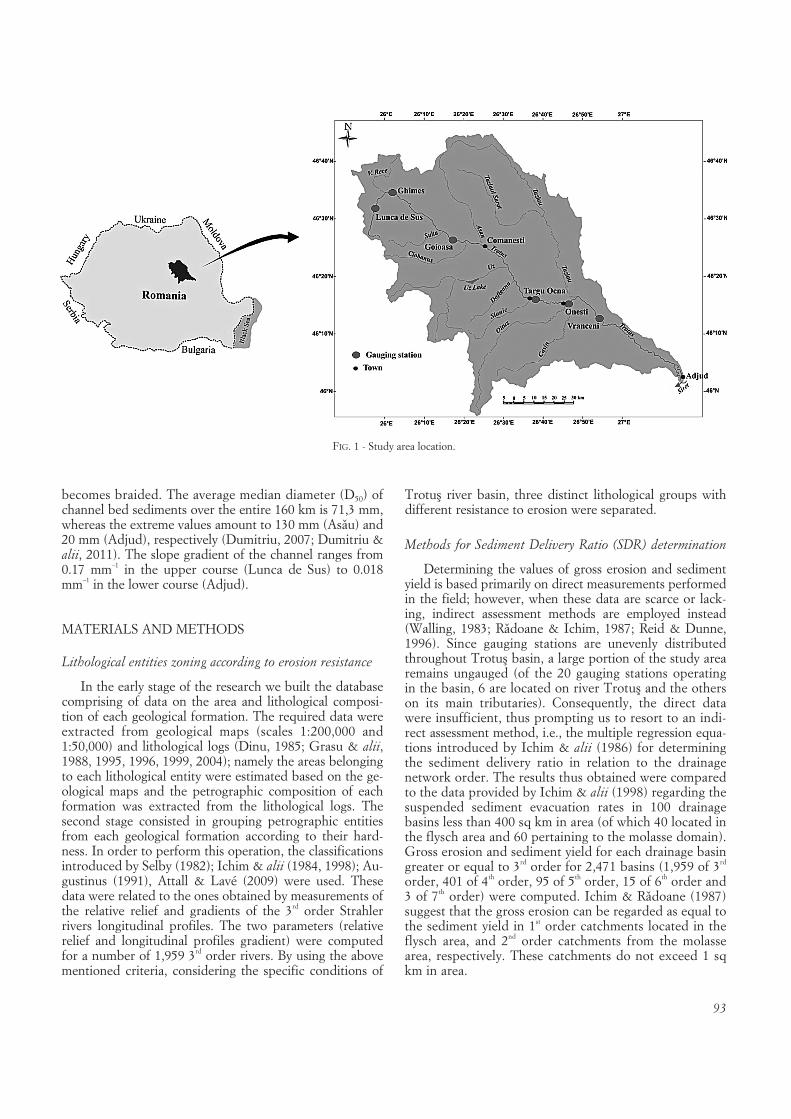
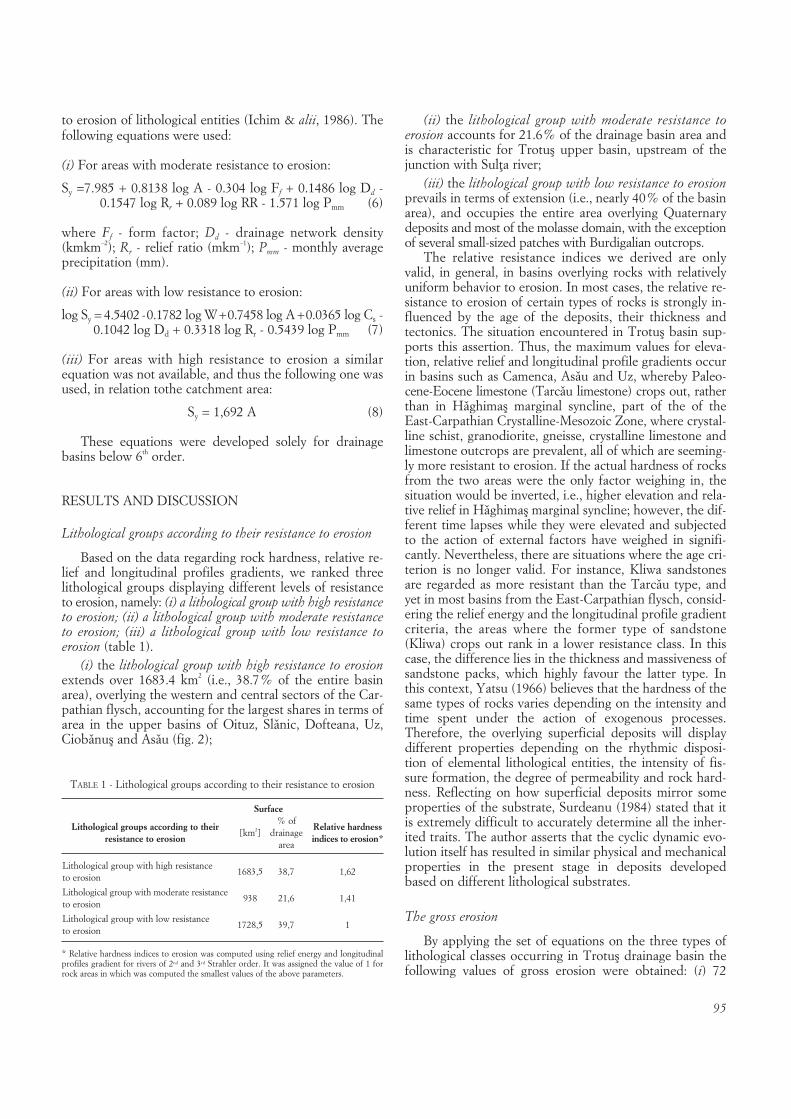
Trotur drainage basin is located in the central-easternsectors of the Eastern Carpathians and the Moldova Sub-carpathians, and extends over 4,350 sq km (1/10 of Siretbasin area) (fig. 1). According to Strahler’s classification,Trotur river basin is ranked as 8th order (Strahler, 1952,1980). The basin overlies four distinct structural and litho-logical units, i.e., the marginal syncline, the Carpathian fly-sch, the peri-Carpathian molasse and the foredeep (s.str.)zone (fig. 2). 57,5% of the basin area (i.e., the upper andmiddle sectors) is occupied by rock outcrops pertaining tothe Carpathian flysch (sandstone, conglomerate, marl andclay). The East-Carpathian flysch consists of five nappesextending eastward as follows: Ceahlau, Teleajen, Audia,Tarcau and Vrancei; the peri-Carpathian molasse domaninaccounts for 23% of the basin area, i.e. the middle to low-er basin transition zone (marl, clay, sand); 17,5% of thebasin area consists of Quaternary deposits which prevail inthe lower basin (gravel, sand, loess deposits); 1,7% of thebasin pertains to the crystalline-Mesozoic area, located inthe upper course, and comprising of crystalline schists, in-trusive rocks and limestone. The slope gradients rangingfrom 15° to 30° are largely prevalent in this area, whereasslope gradients above 30° are rather infrequent. In theeastern part of the mountain area gradients ranging from5° to 15° are the most common, while the lowlands aredominated by slope gradients below 5°. The thermalregime features annual average temperatures ranging from3 to 7°C in the mountain area, 7 to 8.5°C in DarmanertiDepression and 8.5 to 9.5°C in the Subcarpathian area.The average annual precipitation ranges from 722 mmyr–1
in Trotur Valley to nearly 1,000 mmyr–1 in the highermountain area. These value drop by approx. 100 mmyr–1 inthe central part of Darmanerti Depression and towards theSubcarpathian limit. The average annual discharge on Tro-tur river recorded in Vrânceni gauging station is 35 m3s–1,whereas the maximum recorded value was 3,720 m3s–1, onJuly 29, 1991.
In the upper and middle sections of Trotus basin theforests cover nearly 61% of the area, the agricultural landaccounts for 34% (of which 95% pastures and meadows,and 5% arable land), and the remaining 5% is allotted toother uses (i.e., buildings, roads, degraded land etc.). Inthe lower basin forests cover 31% of the total area, agri-cultural land, 49% (of which 15% arable land), whereasthe remaining 20% corresponds to river channels, unpro-ductive areas within the floodplains, built-up areas andhighly degraded hillslopes (Dumitriu, 2007). The totallength of Trotur river is approx. 160 km. Over nearly 130km from the headwater, the river comprises of a well-de-lineated single-thread channel, with a 1,5 average sinuosityindex. In the lower course, i.e. the last 30 km, the channel
93
becomes braided. The average median diameter (D50) ofchannel bed sediments over the entire 160 km is 71,3 mm,whereas the extreme values amount to 130 mm (Asau) and20 mm (Adjud), respectively (Dumitriu, 2007; Dumitriu &alii, 2011). The slope gradient of the channel ranges from0.17 mm–1 in the upper course (Lunca de Sus) to 0.018mm–1 in the lower course (Adjud).
MATERIALS AND METHODS
Lithological entities zoning according to erosion resistance
In the early stage of the research we built the databasecomprising of data on the area and lithological composi-tion of each geological formation. The required data wereextracted from geological maps (scales 1:200,000 and1:50,000) and lithological logs (Dinu, 1985; Grasu & alii,1988, 1995, 1996, 1999, 2004); namely the areas belongingto each lithological entity were estimated based on the ge-ological maps and the petrographic composition of eachformation was extracted from the lithological logs. Thesecond stage consisted in grouping petrographic entitiesfrom each geological formation according to their hard-ness. In order to perform this operation, the classificationsintroduced by Selby (1982); Ichim & alii (1984, 1998); Au-gustinus (1991), Attall & Lavé (2009) were used. Thesedata were related to the ones obtained by measurements ofthe relative relief and gradients of the 3rd order Strahlerrivers longitudinal profiles. The two parameters (relativerelief and longitudinal profiles gradient) were computedfor a number of 1,959 3rd order rivers. By using the abovementioned criteria, considering the specific conditions of
Trotur river basin, three distinct lithological groups withdifferent resistance to erosion were separated.
Methods for Sediment Delivery Ratio (SDR) determination
Determining the values of gross erosion and sedimentyield is based primarily on direct measurements performedin the field; however, when these data are scarce or lack-ing, indirect assessment methods are employed instead(Walling, 1983; Radoane & Ichim, 1987; Reid & Dunne,1996). Since gauging stations are unevenly distributedthroughout Trotur basin, a large portion of the study arearemains ungauged (of the 20 gauging stations operatingin the basin, 6 are located on river Trotur and the otherson its main tributaries). Consequently, the direct datawere insufficient, thus prompting us to resort to an indi-rect assessment method, i.e., the multiple regression equa-tions introduced by Ichim & alii (1986) for determiningthe sediment delivery ratio in relation to the drainagenetwork order. The results thus obtained were comparedto the data provided by Ichim & alii (1998) regarding thesuspended sediment evacuation rates in 100 drainagebasins less than 400 sq km in area (of which 40 located inthe flysch area and 60 pertaining to the molasse domain).Gross erosion and sediment yield for each drainage basingreater or equal to 3rd order for 2,471 basins (1,959 of 3rd
order, 401 of 4th order, 95 of 5th order, 15 of 6th order and3 of 7th order) were computed. Ichim & Radoane (1987)suggest that the gross erosion can be regarded as equal tothe sediment yield in 1st order catchments located in theflysch area, and 2nd order catchments from the molassearea, respectively. These catchments do not exceed 1 sqkm in area.
FIG. 1 - Study area location.

94
Upland gross erosion assessment
Hillslope gross erosion is regarded as the sum of sheeterosion, rill erosion, gully erosion and channel erosion insmall catchments (Onstad, 1984). In the case of Troturbasin, the equations of gross erosion developed by Ichim& alii (1986) were applied separately to the three types ofareas classified in terms of the resistance to erosion. Theequations used for estimating gross erosion in certain areas,by taking into account the rock resistance to erosion, areas follows:
(i) For areas with moderate resistance to erosion:
E = [–4493.45 + 5825.65 W (–671.06 W2)] / W2 (3)(n = 36; r = 0.606)
where W - is the drainage basin order.
(ii) For areas with low resistance to erosion:
E = [–17918.84 + 25062.81 W (–3563.21 W2)] / W2, (4)(n = 63; r = 0.557)
(iii) Since a function was not available for areas with highresistance to erosion, the following formula was used:
Sy = 72.443 A– 0.100 (5)
Sediment yield assessment by using river network magni-tude order
The second parameter required for computing the sed-iment delivery ratio is the sediment yield at the exit fromcatchment area. For determining this parameter we tookinto account the basin zoning according to the resistance
FIG. 2 - Bedrock geology of Trotusdrainage basin and percentage of
the main geological formations.
95
to erosion of lithological entities (Ichim & alii, 1986). Thefollowing equations were used:
(i) For areas with moderate resistance to erosion:
Sy =7.985 + 0.8138 log A - 0.304 log Ff + 0.1486 log Dd - 0.1547 log Rr + 0.089 log RR - 1.571 log Pmm (6)
where Ff - form factor; Dd - drainage network density(kmkm–2); Rr - relief ratio (mkm–1); Pmm - monthly averageprecipitation (mm).
(ii) For areas with low resistance to erosion:
log Sy = 4.5402 - 0.1782 log W+ 0.7458 log A + 0.0365 log Cs -0.1042 log Dd + 0.3318 log Rr - 0.5439 log Pmm (7)
(iii) For areas with high resistance to erosion a similarequation was not available, and thus the following one wasused, in relation tothe catchment area:
Sy = 1,692 A (8)
These equations were developed solely for drainagebasins below 6th order.
RESULTS AND DISCUSSION
Lithological groups according to their resistance to erosion
Based on the data regarding rock hardness, relative re-lief and longitudinal profiles gradients, we ranked threelithological groups displaying different levels of resistanceto erosion, namely: (i) a lithological group with high resistanceto erosion; (ii) a lithological group with moderate resistanceto erosion; (iii) a lithological group with low resistance toerosion (table 1).
(i) the lithological group with high resistance to erosionextends over 1683.4 km2 (i.e., 38.7% of the entire basinarea), overlying the western and central sectors of the Car-pathian flysch, accounting for the largest shares in terms ofarea in the upper basins of Oituz, Slanic, Dofteana, Uz,Ciobanur and Asau (fig. 2);
(ii) the lithological group with moderate resistance toerosion accounts for 21.6% of the drainage basin area andis characteristic for Trotur upper basin, upstream of thejunction with Sul†a river;
(iii) the lithological group with low resistance to erosionprevails in terms of extension (i.e., nearly 40% of the basinarea), and occupies the entire area overlying Quaternarydeposits and most of the molasse domain, with the exceptionof several small-sized patches with Burdigalian outcrops.
The relative resistance indices we derived are onlyvalid, in general, in basins overlying rocks with relativelyuniform behavior to erosion. In most cases, the relative re-sistance to erosion of certain types of rocks is strongly in-fluenced by the age of the deposits, their thickness andtectonics. The situation encountered in Trotur basin sup-ports this assertion. Thus, the maximum values for eleva-tion, relative relief and longitudinal profile gradients occurin basins such as Camenca, Asau and Uz, whereby Paleo-cene-Eocene limestone (Tarcau limestone) crops out, ratherthan in Haghimar marginal syncline, part of the of theEast-Carpathian Crystalline-Mesozoic Zone, where crystal-line schist, granodiorite, gneisse, crystalline limestone andlimestone outcrops are prevalent, all of which are seeming-ly more resistant to erosion. If the actual hardness of rocksfrom the two areas were the only factor weighing in, thesituation would be inverted, i.e., higher elevation and rela-tive relief in Haghimar marginal syncline; however, the dif-ferent time lapses while they were elevated and subjectedto the action of external factors have weighed in signifi-cantly. Nevertheless, there are situations where the age cri-terion is no longer valid. For instance, Kliwa sandstonesare regarded as more resistant than the Tarcau type, andyet in most basins from the East-Carpathian flysch, consid-ering the relief energy and the longitudinal profile gradientcriteria, the areas where the former type of sandstone(Kliwa) crops out rank in a lower resistance class. In thiscase, the difference lies in the thickness and massiveness ofsandstone packs, which highly favour the latter type. Inthis context, Yatsu (1966) believes that the hardness of thesame types of rocks varies depending on the intensity andtime spent under the action of exogenous processes.Therefore, the overlying superficial deposits will displaydifferent properties depending on the rhythmic disposi-tion of elemental lithological entities, the intensity of fis-sure formation, the degree of permeability and rock hard-ness. Reflecting on how superficial deposits mirror someproperties of the substrate, Surdeanu (1984) stated that itis extremely difficult to accurately determine all the inher-ited traits. The author asserts that the cyclic dynamic evo-lution itself has resulted in similar physical and mechanicalproperties in the present stage in deposits developedbased on different lithological substrates.
The gross erosion
By applying the set of equations on the three types oflithological classes occurring in Trotur drainage basin thefollowing values of gross erosion were obtained: (i) 72
TABLE 1 - Lithological groups according to their resistance to erosion
Surface
Lithological groups according to their % of Relative hardnessresistance to erosion [km2] drainage indices to erosion*
area
Lithological group with high resistanceto erosion
1683,5 38,7 1,62
Lithological group with moderate resistanceto erosion
938 21,6 1,41
Lithological group with low resistance to erosion
1728,5 39,7 1
* Relative hardness indices to erosion was computed using relief energy and longitudinalprofiles gradient for rivers of 2nd and 3rd Strahler order. It was assigned the value of 1 forrock areas in which was computed the smallest values of the above parameters.
96
tkm–2yr–1 for the area with high resistance to erosion; (ii)1255 tkm–2yr–1 for the area with moderate resistance to ero-sion; and (iii) 5180 tkm–2yr–1 for the area with low resis-tance to erosion. By summing up the gross erosion valuesderived for each of the three lithological groups we deter-mined that the amount of sediments removed annuallyfrom the entire Trotur basin can be as high as 107x105 t, ofwhich 0.7x10⁵ tyr–1 were displaced from the area with highresistance to erosion, 20.3x10⁵ tyr–1 from the area withmoderate resistance, and 86x105 tyr–1 from the area withlow resistance to erosion. Based on this data, we can con-clude that about 80% of the overall gross erosion is gener-ated by the area with low resistance to erosion, which ac-counts for just about 40% of Trotur drainage basin area.
The sediment yield
By applying the regression equations we obtained val-ues that were further converted to the sediment specificyield (SSY), resulting in the following spectrum for thesediment yield: (i) 39-50 tkm–2yr–1 in the area with high re-sistance to erosion; (ii) 220-350 tkm–2yr–1 in the area withmoderate resistance to erosion and (iii) 800-1,900 tkm–2yr–1
in the area with low resistance to erosion.For validation purposes, these values were compared to
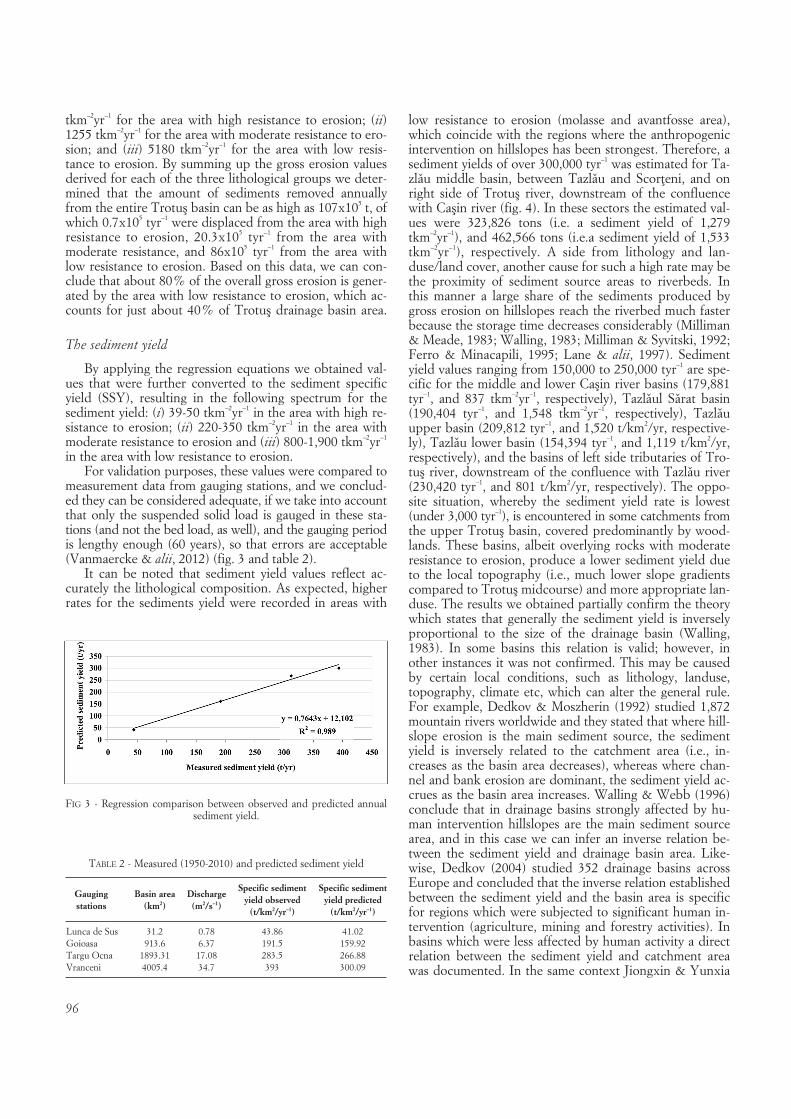
measurement data from gauging stations, and we conclud-ed they can be considered adequate, if we take into accountthat only the suspended solid load is gauged in these sta-tions (and not the bed load, as well), and the gauging periodis lengthy enough (60 years), so that errors are acceptable(Vanmaercke & alii, 2012) (fig. 3 and table 2).
It can be noted that sediment yield values reflect ac-curately the lithological composition. As expected, higherrates for the sediments yield were recorded in areas with
low resistance to erosion (molasse and avantfosse area),which coincide with the regions where the anthropogenicintervention on hillslopes has been strongest. Therefore, asediment yields of over 300,000 tyr–1 was estimated for Ta-zlau middle basin, between Tazlau and Scor†eni, and onright side of Trotur river, downstream of the confluencewith Carin river (fig. 4). In these sectors the estimated val-ues were 323,826 tons (i.e. a sediment yield of 1,279tkm–2yr–1), and 462,566 tons (i.e.a sediment yield of 1,533tkm–2yr–1), respectively. A side from lithology and lan-duse/land cover, another cause for such a high rate may bethe proximity of sediment source areas to riverbeds. Inthis manner a large share of the sediments produced bygross erosion on hillslopes reach the riverbed much fasterbecause the storage time decreases considerably (Milliman& Meade, 1983; Walling, 1983; Milliman & Syvitski, 1992;Ferro & Minacapili, 1995; Lane & alii, 1997). Sedimentyield values ranging from 150,000 to 250,000 tyr–1 are spe-cific for the middle and lower Carin river basins (179,881tyr–1, and 837 tkm–2yr–1, respectively), Tazlaul Sarat basin(190,404 tyr–1, and 1,548 tkm–2yr–1, respectively), Tazlauupper basin (209,812 tyr–1, and 1,520 t/km2/yr, respective-ly), Tazlau lower basin (154,394 tyr–1, and 1,119 t/km2/yr,respectively), and the basins of left side tributaries of Tro-tur river, downstream of the confluence with Tazlau river(230,420 tyr–1, and 801 t/km2/yr, respectively). The oppo-site situation, whereby the sediment yield rate is lowest(under 3,000 tyr–1), is encountered in some catchments fromthe upper Trotur basin, covered predominantly by wood-lands. These basins, albeit overlying rocks with moderateresistance to erosion, produce a lower sediment yield dueto the local topography (i.e., much lower slope gradientscompared to Trotur midcourse) and more appropriate lan-duse. The results we obtained partially confirm the theorywhich states that generally the sediment yield is inverselyproportional to the size of the drainage basin (Walling,1983). In some basins this relation is valid; however, inother instances it was not confirmed. This may be causedby certain local conditions, such as lithology, landuse,topography, climate etc, which can alter the general rule.For example, Dedkov & Moszherin (1992) studied 1,872mountain rivers worldwide and they stated that where hill-slope erosion is the main sediment source, the sedimentyield is inversely related to the catchment area (i.e., in-creases as the basin area decreases), whereas where chan-nel and bank erosion are dominant, the sediment yield ac-crues as the basin area increases. Walling & Webb (1996)conclude that in drainage basins strongly affected by hu-man intervention hillslopes are the main sediment sourcearea, and in this case we can infer an inverse relation be-tween the sediment yield and drainage basin area. Like-wise, Dedkov (2004) studied 352 drainage basins acrossEurope and concluded that the inverse relation establishedbetween the sediment yield and the basin area is specificfor regions which were subjected to significant human in-tervention (agriculture, mining and forestry activities). Inbasins which were less affected by human activity a directrelation between the sediment yield and catchment areawas documented. In the same context Jiongxin & Yunxia
FIG 3 - Regression comparison between observed and predicted annual sediment yield.
TABLE 2 - Measured (1950-2010) and predicted sediment yield
Gauging Basin area Discharge Specific sediment Specific sediment
stations (km2) (m2/s–1) yield observed yield predicted(t/km2/yr–1) (t/km2/yr–1)
Lunca de Sus 31.2 0.78 43.86 41.02Goioasa 913.6 6.37 191.5 159.92Targu Ocna 1893.31 17.08 283.5 266.88Vranceni 4005.4 34.7 393 300.09
97
(2005) and de Vente & Poesen (2005) introduce exampleswhich demonstrate that the sediment yield increase at first,and then subsequently decreases along with the area ofdrainage basins depending on the lithology of substrateand surface deposits, on the transformations undergone bythe basin in time and space etc.
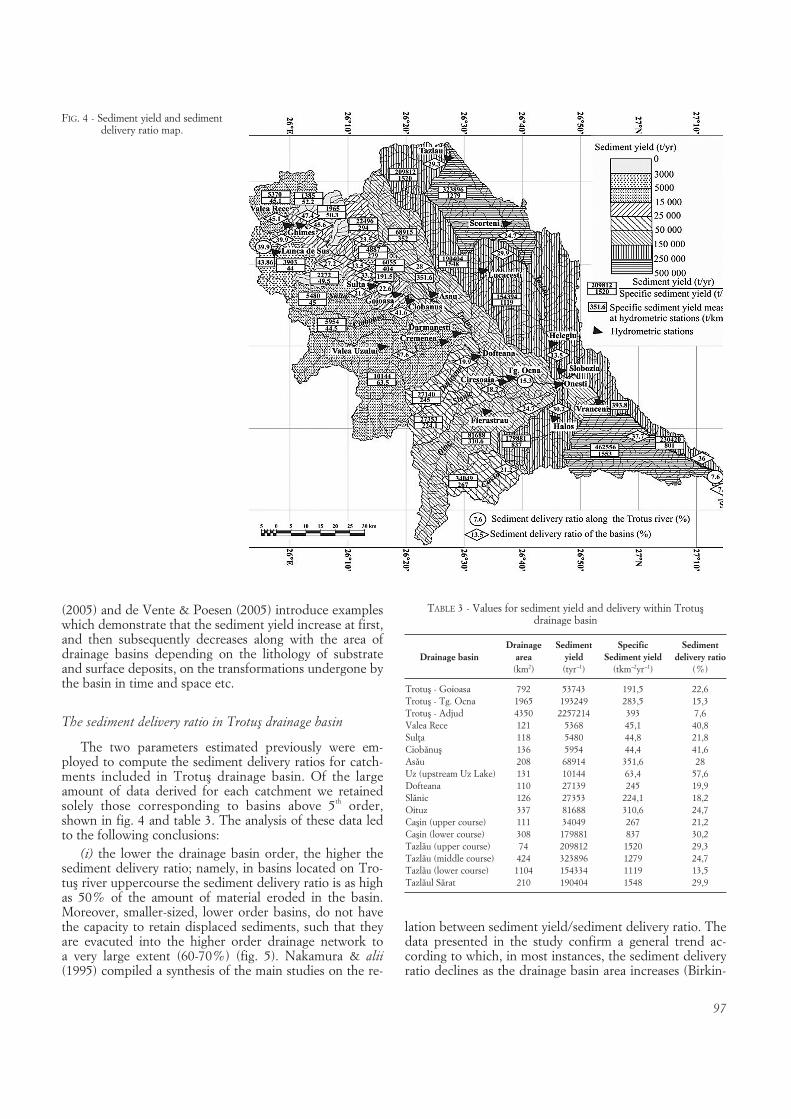
The sediment delivery ratio in Trotur drainage basin
The two parameters estimated previously were em-ployed to compute the sediment delivery ratios for catch-ments included in Trotur drainage basin. Of the largeamount of data derived for each catchment we retainedsolely those corresponding to basins above 5th order,shown in fig. 4 and table 3. The analysis of these data ledto the following conclusions:
(i) the lower the drainage basin order, the higher thesediment delivery ratio; namely, in basins located on Tro-tur river uppercourse the sediment delivery ratio is as highas 50% of the amount of material eroded in the basin.Moreover, smaller-sized, lower order basins, do not havethe capacity to retain displaced sediments, such that theyare evacuted into the higher order drainage network to a very large extent (60-70%) (fig. 5). Nakamura & alii(1995) compiled a synthesis of the main studies on the re-
lation between sediment yield/sediment delivery ratio. Thedata presented in the study confirm a general trend ac-cording to which, in most instances, the sediment deliveryratio declines as the drainage basin area increases (Birkin-
FIG. 4 - Sediment yield and sedimentdelivery ratio map.
TABLE 3 - Values for sediment yield and delivery within Troturdrainage basin
Drainage Sediment Specific SedimentDrainage basin area yield Sediment yield delivery ratio
(km2) (tyr–1) (tkm–2yr–1) (%)
Trotur - Goioasa 792 53743 191,5 22,6Trotur - Tg. Ocna 1965 193249 283,5 15,3Trotur - Adjud 4350 2257214 393 7,6Valea Rece 121 5368 45,1 40,8Sul†a 118 5480 44,8 21,8Ciobanur 136 5954 44,4 41,6Asau 208 68914 351,6 28Uz (upstream Uz Lake) 131 10144 63,4 57,6Dofteana 110 27139 245 19,9Slanic 126 27353 224,1 18,2Oituz 337 81688 310,6 24,7Carin (upper course) 111 34049 267 21,2Carin (lower course) 308 179881 837 30,2Tazlau (upper course) 74 209812 1520 29,3Tazlau (middle course) 424 323896 1279 24,7Tazlau (lower course) 1104 154334 1119 13,5Tazlaul Sarat 210 190404 1548 29,9

98
shaw & Bathurst, 2006). In basins with areas ranging from2,000 to 7,000 km2 the sediment delivery ratio is commonlyaround 4%, whereas in basins smaller than 100 km2 nearlyhalf of the amount of material eroded in basin is evacuatedfrom the basin. Similar conclusions regarding this inverserelation were reported by Strand & Pemberton (1987),Morris & Fan (1997) for drainage basins from USA, Aven-daño & alii (1997) who used measurements made on 60reservoirs in Spain, whereby the areas of drainage basinsranged from 31 km2 to 17,000 km2. They explain that asthe basin area augments, the slope and channel gradientsdecrease (along with the sediment transport energy),which in turn favors sediment deposition in channel beds.Therefore, the distance between the hillslope sedimentsource areas and the channel increases (which leads to adecrease in the sediment delivery ratio) and localizedstorms (which cause erosion) have proportionally smallerspatial effect.
(ii) The decrease in the sediment delivery ratio is in-versely related to the drainage network order and the sizeof drainage basins (Ichim, 1988; Ichim & alii, 1986, 1992).Large basins such as Oituz, Tazlau, Carin have sedimentdelivery ratios below 30%, thus the eroded sediment stor-age capacity increases. These results are similar to the out-come of studies by Radoane & Ichim (1987) and Ichim(1987, 1990), who studied drainage basins from the FlyschMountains and the Moldavian Tableland and showed thatwithin same order basins, lithology is the main factor lead-ing to variations in the magnitude of both gross erosion (4times higher in the Subcarpathian area) and sediment de-livery (approx. 1,5 higher in the Subcarpathian area). Oneof the causes for this situation is likely linked to geomor-phology, namely, the broad extension of areas affected bylandsliding and gully erosion, which transfer hillslope de-posits towards river channels, whereas the high percentageof clay within the lithological composition of this regionresults in the removal of a larger amount of sediments. Indrainage basins above 5th order an attenuation of differ-ences in the magnitude of the sediment delivery ratio inthe two types of lithology (i.e., flysch and molasse) hasbeen documented.
(iii) The values of the sediment delivery ration revealthe increasingly larger sediment storage as we near thejunction with Siret river. Thus, in Lunca de Sus gauging
station (located 14 km from the headwaters) the sedimentdelivery ratio is as high as 40%, as compared to 23% inGoioasa (54 km from the headwater), 15% in Târgu Ocna(90 km from the headwater), and just 7.6% of the totalamount of eroded sediment evacuated annually in thedrainage basin outlet. These results are consistent withthose reported in the literature (Roehl, 1962; Williams &Berndt, 1972; Malmon & alii, 2005; Lu & alii, 2005; Ala-torrea & alii, 2010; Porto & alii, 2011; Lopez-Tarazon &alii, 2012), according to which there is an inverse relationbetween SDR and the drainage basin area (fig. 6).FIG. 5 - Sediment delivery ratio related to drainage basin area.
FIG. 6 - Sediment delivery along the Trotus River.
CONCLUSIONS
In order to determine the sediment delivery ratio inTrotur drainage basin a set of regression equations wereused for each of the three relevant lithological groups clas-sified according to their resistance to erosion. By applyingthese equations we determined that 80% of the gross ero-sion occurs in the areas comprising of rocks with low resis-tance to erosion which account for 40% of Trotur basinarea. Moreover, the values estimated for the sediment de-livery closely reflect the lithological composition of thesubstrate. As expected, the highest rates were documentedin areas with rocks with lower resistance to erosion (mo-lasse and avant fosse areas), which also coincide with theregions where the anthropogenic intervention on hillslopeshas been strongest. The values of the sediment delivery ra-tio fall within the general range of values reported in otherdrainage basins evolving under similar natural conditions.In basins from the Subcarpathian sector or overlying Qua-ternary deposits, local factors such as topography, climateconditions, landuse/land cover and the occurrence rockswith low resistance to erosion, enhance erosion and as aresult the sediment yield ranges from 150,000 to 500,000t/yr, whereas the sediment delivery ratio amounts to 80%in 3rd order basins, and 30% in 4th order basins, respective-ly. In drainage basins from the flysch area, despite therather significant runoff and high speed of streams in 4th
and 5th order basins, the occurence of resistant rocks andthe more adequate use of terrains resulted in lower ratesfor gross erosion, sediment yield, and subsequently for thesediment delivery ratio. Of the entire amount of sediments
99
eroded in Trotur drainage basin only 7.6% are dischargedinto Siret river. Thus, we can conclude that the sedimentdelivery ratio in Trotur drainage basin is inversely propor-tional to the drainage network order and to the size of thebasin area. By comparing these results with direct measure-ment data from selected gauging stations, they can be con-sidered acceptable, taking into account that only the sus-pended sediment load is recorded, but not the bed load.
REFERENCES
ALATORREA L.C., BEGUERÍA S. & GARCÍA-RUIZ J.M. (2010) - Regional sca-le modeling of hillslope sediment delivery: A case study in the Bara-sona Reservoir watershed (Spain) using WATEM/SEDEM. Journal ofHydrology, 391, 109-123.
ATTAL M. & LAVÉ J. (2009) - Pebble abrasion during fluvial transport: Ex-perimental results and implications for the evolution of the sedimentload along rivers. Journal of Geophysical Research: Earth Surface114, F4, DOI: 10.1029/2009JF001328.
AUGUSTINUS P.C. (1991) - Rock resistance to erosion: Some further consi-derations. Earth Surface Processes and Landforms, 16, 6, 563-569.
AVENDAÑO S.C., SANZ M.E., COBO R.R. & GÓMEZ M.J.L. (1997) - Sedi-ment yield at Spanish reservoirs and its relationship with the drainagebasin area. In: «Proceedings of Nineteenth Congress - InternationalCommission on Large Dams», Florence, Italy, Q.74-R.54, 863-874.
BIRKINSHAW S.J. & BATHURST J.C. (2006) - Model study of the relationshipbetween sediment yield and river basin area. Earth Surface Processesand Landforms, 31, 750-761.
BOOMER K.B., WELLER D.E. & JORDAN T.E. (2008) - Empirical modelsbased on the universal soil loss equation fail to predict sediment di-scharges from Chesapeake Bay catchments. Journal EnvironmentalQuality, 37, 79-89.
DEDKOV A.P. (2004) - The relationship between sediment yield and drai-nage basin area. In: «Sediment Transfer through the Fluvial System».Publication 288, International Association of Hydrological Scien-ces,Wallingford, 197-204.
DEDKOV A.P. & MOSZHERIN V.I. (1992) - Erosion and sediment yield inmountain regions of the world. In: «Erosion, Debris Flows and Envi-ronment in Mountain Regions». Publication 209, International Asso-ciation of Hydrological Sciences, Wallingford, 29-36.
DE ROO A.P.J., HAZELHOFF L. & BURROUGH P.A. (1989) - Soil erosionmodeling using ANSWERS and geographical information systems.Earth Surface Processes and Landforms, 14, 517-532.
DE VENTE J. & POESEN J. (2005) - Predicting soil erosion and sedimentyield at the basin scale: Scale issues and semi-quantitative models.Earth-Science Reviews, 71, 95-125.
DE VENTE J., POESEN J., ARABKHEDRI M. & VERSTRAETEN G. (2007) - Thesediment delivery problem revisited. Progress in Physical Geography,31, 155-178.
DE VENTE J., VERDUYN R., VERSTRAETEN G., VANMAERCKE M. & POESEN
J. (2011) - Factors controlling sediment yield at the catchment scale inNW Mediterranean geoecosystems. Journal of Soils and Sediments,11, 690-707.
DINU C. (1985) - Geologic Study of the Cretaceous Flysch deposits in theUpper Course of the Trotur Valley (East Carpathians). Anuarul Insti-tutului de Geologie si Geofizica, 65, 1-135.
DUMITRIU D. (2007) - Sistemul aluviunilor din bazinul raului Trotus. Edi-tura Universitatii Suceava, 260 pp.
DUMITRIU D., CONDORACHI D. & NICULIÏA M. (2011) - Downstream va-riation in particle size: a case study of the Trotur River, Eastern Car-pathians (Romania). Analele Universitatii Oradea, Geografie, t. XXI(2), 222-232.
FERRO V. & MINACAPILLI M. (1995) - Sediment delivery processes at basinscale. Hydrological Sciences Journal, 40, 703-717.
FLANAGAN D.C. & NEARING M.A. (1995) - USDA-water erosion predic-tion project: hillslope profile and watershed model documentation.NSERL Report 10, USDA-ARS National Soil Erosion Research La-boratory, West Lafayette, IN, USA.
FLAXMAN E.M. (1972) - Predicting sediment yield in western United Sta-tes. Proceedings of the ASCE, Journal of the Hydraulics Division, 98,2073-2085.
GLYMPH L.M. (1954) - Studies of sediment yields from watersheds. In: As-semblée Général de Rome 1954, IAHS Publ., 36, 173-191.
GRAUSO S., FATTORUSO G., CROCETTI C. & MONTANARI A. (2008) - Esti-mating the suspended sediment yield in a river network by means ofgeomorphic parameters and regression relationships. Hydrology andEarth System Sciences, 12, 177-191.
GRASU C., CATANA C. & GRINEA D. (1988) - Carpathian Flysch. Petrogra-phy and economic considerations. Editura Tehnica, Bucurerti, 208 pp.
GRASU C., TURCULEÏ I., CATANA C. & NIÏA M. (1995) - Petrography ofthe Mesosoic from the External Marginal Syncline. Editura Acade-miei, Bucurerti, 192 pp.
GRASU C., CATANA C. & BOBOR I. (1996) - Petrology of Formations fromInner Flysch - Romanian Eastern Carpathians. Editura Tehnica, Bucu-rerti, 178 pp.
GRASU C., CATANA C., MICLAUR C. & BOBOR I. (1999) - Eastern Car-pathian Molasse.Petrography and Sedimentogenesis. Editura Tehnica,Bucurerti, 227 pp.
GRASU C., MICLAUR C., SCUTARU C., RARAMET M. & BOBOR I. (2004) -Geology of Comanesti Basin. Editura Tehnica, Bucurerti, 240 pp.
GREGORY K.J. & WALLING D.E. (1973) - Drainage basin form and process.Edward Arnold, London, 458 pp.
HUA L.U., MORAN C.J. & PROSSER I.P. (2006) - Modelling sediment deli-very ratio over the Murray Darling Basin. Environmental Modelling &Software, 2, 1297-1308.
ICHIM I. (1987) - Semnifica†ia marimii suprafe†ei bazinului hidrografic înmodelarea reliefului. Lucrarile Seminarului Geografic «D. Cantemir»,7, 275-282.
ICHIM I. (1988) - Semnifica†ia marimii suprafe†ei bazinului hidrografic îndinamica proceselor fluviale. Hidrotehnica, 33, 17-28.
ICHIM I. (1990) - The relationship between sediment delivery ratio andstream order: a Romanian case study. In: «Erosion, Transport andDeposition Processes - Proceedings of the Jerusalem Workshop»,March-April 1987, IAHS Publ. 189, 79-86.
ICHIM I., RADOANE M., DOMRA D., DUMITRESCU GH. & URSU C. (1984) -O posibilitate de modelare matematica pentru evaluarea ratei de tran-sport a aluviunilor din bazine hidrografice mici. Lucrarile celei de aIV-a Conferinte INFOTEC, III, 772-779.
ICHIM I., RADOANE M., URSU C. & DUMITRESCU GH. (1986) - Model deregresie multipla progresiva pentru evaluarea produc†iei de aluviuni înbazine hidrografice mici. Hidrotehnica, 31, 10-17.
ICHIM I. & RADOANE M. (1987) - A multivariate statistical analysis sedimentyield and prediction in Romania. Catena Suplements, 10, 137-146.
ICHIM I., RADOANE M. & RADOANE N. (1992) - Some problems sedimentfrom Romania: Sources, Impact and Delivery Ratio. Case studies. In:5th International Symposium on River Sedimentation, Karlsruhe,113-119.
ICHIM I., RADOANE M., RADOANE N., GRASU C. & MICLAUR C. (1998) -Sediment Dynamics. Application to Putna River-Vrancea. EdituraTehnica, Bucurerti, 192 pp.
JIONGXIN X. & YUNXIA Y. (2005) - Scale effects on specific sediment yieldin the Yellow River basin and geomorphological explanations. Journalof Hydrology, 307, 219-232.
KIRKBY M.J., JONES R.J.A., IRVINE B., GOBIN A., GOVERS G., CERDAN O.,VAN ROMPAEY A.J.J., LE BISSONNAIS Y., DAROUSSIN J., KING D.,MONTANARELLA L., GRIMM M., VIEILLEFONT V., PUIGDEFABREGAS J.,BOER M., KOSMAS C., YASSOGLOU N., TSARA M., MANTEL S. & VAN

100
LYNDEN G. (2004) - Pan-European soil erosion risk assessment: thePESERA Map, Version 1 October 2003. Explanation of Special Publi-cation. No.73 (S.P.I.04.73). European Soil Bureau Research ReportNo.16, EUR 21176, Office for Official Publications of the EuropeanCommunities, Luxembourg.
KLAGHOFER E., SUMMER W. & VILLENEUVE J.P. (1992) - Some remarkson the determination of the sediment delivery ratio. International As-sociation of Hydrological Sciences Publication, 209, 113-118.
LANE J.L., HERNANDEZ M. & NICHOLS M. (1997) - Processes controllingsediment yield from watersheds as functions of spatial scale. Environ-mental Modelling & Software, 12, 355-369.
LOPEZ-TARAZON J.A., BATALLA R.J., VERICAT D. & FRANCKE T. (2012) -The sediment budget of a highly dynamic mesoscale catchment: TheRiver Isábena. Geomorphology, 138, 15-28.
LU H., MORAN C.J. & SIVAPALAN M. (2005) - A theoretical explorationof catchment-scale sediment delivery. Water Resources Research, 41,1-15.
LU H. & RICHARD K. (2008) - Sediment delivery: new approaches tomodelling an old problem. In: Rice S., Roy A. & Rhoads B., (Eds.),«River Confluences, Tributaries and the Fluvial Network», Ch. 16,Wiley & Sons, 352 pp.
MALMON D.V., RENEAU S.L., DUNNE T., KATZMAN D. & DRAKOS P.G.(2005) - Influence of sediment storage on downstream delivery of con-taminated sediment. Water Resources Research, 41, W05008, 1-17.
MANER S.B. & BARNES L.H. (1953) - Suggested criteria for estimating grosssheet erosion and sediment delivery rates for the blackland praries pro-blem area in soil conservation. US Department of Agriculture SoilConservation Service, Fort Worth.
MILLIMAN J.D. & MEADE R.H. (1983) - World wide delivery of river sedi-ment to the oceans. Journal of Geology, 91, 1-21.
MILLIMAN J.D. & SYVITSKI J.P.M. (1992) - Geomorphic/tectonic control ofsediment discharge to the ocean: the importance of small mountainousrivers. Journal of Geology, 100, 525-544.
MOLINA A., GOVERS G., POESEN J. & VAN HEMELRYCK H. (2008) - Envi-ronmental factors controlling spatial variation in sediment yield in acentral Andean mountain area. Geomorphology, 98, 176-186.
MORGAN R.P.C., QUINTON J.N., SMITH RE., GOVERS G., POESEN J.,AUERSWALD K., CHISCI G., TORRI D. & STYCZEN M.E. (1998) - TheEuropean Soil Erosion Model (EUROSEM): a dynamic approach forpredicting sediment transport from fields and small catchments. EarthSurface Processes and Landforms, 23, 527-544.
MORRIS G.L. & FAN J. (1997) - Reservoir Sedimentation Handbook: Designand Management of Dams, Reservoirs and Watersheds for SustainableUse. McGraw-Hill, 736 pp.
NAKAMURA F., MAITA H. & ARAYA T. (1995) - Sediment routing analysesbased on chronological changes in hillslope and riverbed morphologies.Earth Surface Processes and Landforms, 20, 333-346.
NEIL D.T. & MAZARI R.K. (1993) - Sediment yield mapping using smalldam sedimentation surveys, Southern Tablelands, New South Wales.Catena, 20, 13-25.
ONSTAD C.A. (1984) - Sediment yield modeling. In: Hadley R.F. & WallingD. (Eds.), Erosion and Sediment Yield: Some Methods of Measure-ment and Modelling, GeoBooks, Norwich, England, 71-89.
ONYANDO J.O., KISOYAN P. & CHEMELIL M.C. (2005) - Estimation ofpotential soil erosion for River Perkerra catchment in Kenya. WaterResources Management, 19, 133-143.
PARSONS A.J., WAINWRIGHT J., BRAZIER R.E. & POWELL D.M. (2006) - Issediment delivery a fallacy? Earth Surface Processes and Landforms,31, 1325-1328.
PORTO P., WALLING D.E. & CALLEGARI G. (2011) - Using 137Cs mea-surements to establish catchment sediment budgets and explore scaleeffects. Hydrological Processes, 25, 886-900.
PROSSER I.P., RUSTOMJI P., YOUNG W.J., MORAN C.J. & HUGHES A.O.(2001) - Constructing river basin sediment budgets for the NationalLand and Water Resources Audit. CSIRO Land and Water TechnicalReport 15/01, CSIRO Land and Water, Canberra, Australia.
RADOANE M. & ICHIM I. (1987) - Problema efluen†ei aluviunilor condi†io-nata de ordinul re†elei hidrografice. Hidrotehnica, 2, 44-49.
RADOANE M. & RADOANE N. (2005) - Dams, sediment sources and reser-voir silting in Romania. Geomorphology, 71, 112-125.
RESTREPO J.D., KJERFVE B., HERMELIN M. & RESTREPO J.C. (2006) -Factors controlling sediment yield in a major South American drainagebasin: the Magdalena River, Colombia. Journal of Hydrology, 316,213-232.
REID L.M. & DUNNE T. (1996) - Rapid evaluation of sediment budgets.Catena Verlag GMBH, Reiskirchen, 165 pp.
ROEHL J.E. (1962) - Sediment source areas, delivery ratios and influencingmorphological factors. International Association of HydrologicalSciences Publication, 59, 202-213.
SCHOORL J.M. & VELDKAMP A. (2001) - Linking land use and landscapeprocess modelling: a case study for the Alora region (south Spain).Agriculture, Ecosystems & Environment, 85, 281-292.
SELBY M.J. (1982) - Hillslope materials and processes. Oxford UniversityPress, New York, 264 pp.
STRAHLER A.N. (1952) - Hypsometric (Area-Altitude) analysis of erosionaltopography. Geological Society of America Bulletin, 63, 1117-1142.
STRAHLER A.N. (1980) - Systems theory in physical geography. PhysicalGeography, 1, 1-27.
STRAND R.I. & PEMBERTON E.L. (1987) - Reservoir sedimentation. TechnicalGuideline for Bureau of Reclamation, US Bureau of Reclamation,Denver, Colorado.
SURDEANU V. (1984) - Considera†ii asupra caracteristicilor fizice ale depo-zitelor deluviale (zona mun†ilor flirului). Buletin rtiin†ific, Suceava,Geografie, 33-39.
VANMAERCKE M., POESEN J., RADOANE M., GOVERS G., OCAKOGLU F. &ARABKHEDRI M. (2012) - How long should we measure? An explora-tion of factors controlling thr inter-annual variation of catchment sedi-ment yield. Journal of Soils and Sediments 12, 603-619.
VANMAERCKE M., POESEN J., VERSTRAETEN G., DE VENTE J. & OCAKO-GLU F. (2011) - Sediment yield in Europe: Spatial patterns and scaledependency. Geomorphology, 130, 142-161.
VAN ROMPAEY A., VERSTRAETEN G., VAN OOST K., GOVERS G. & POESEN J. (2001) - Modelling mean annual sediment yield using adistributed approach. Earth Surface Processes and Landforms, 26,1221-1236.
VAN ROMPAEY A., BAZZOFFI P., JONES R.J.A. & MONTANARELLA L.(2005) - Modeling sediment yields in Italian catchments. Geomorpho-logy, 65, 157-169.
VERSTRAETEN G. (2006) - Regional scale modelling of hillslope sedimentdelivery with SRTM elevation data. Geomorphology, 81, 128-140.
VERSTRAETEN G. & POESEN J. (2001) - Factors controlling sediment yieldsfrom small intensively cultivated catchments in a temperate humid cli-mate. Geomorphology, 40, 123-144.
VERSTRAETEN G. & PROSSER I.P. (2008) - Modelling the impact of land-usechange and farm dam construction on hillslope sediment delivery to rivers at the regional scale. Geomorphology, 98, 199-212.
WILLIAMS J.R. & BERNDT H.D. (1972) - Sediment yield computed withuniversal equation. Journal of the Hydraulics Division, 98 (12), 2087-2098.
WALLING D.E. (1983) - The sediment delivery problem. Journal of Hydro-logy, 65, 209-237.
WALLING D.E. & WEBB B.W. (1996) - Erosion and sediment yield: a glo-bal overview. In: «Erosion and Sediment Yield-Global and RegionalPerspectives», 236, International Association of Hydrological Scien-ces, 3-19.
WASSON R.J. (1994) - Annual and decadal variation in sediment yield inAustralia, and some global comparisons. International Association ofHydrological Sciences Publication, 224, 269-279.
YATSU E. (1966) - Rock control in geomorphology. Sozosha, Tokio, 135 pp.
(Ms. received 1 June 2013; accepted 31 March 2014)