7.0 nonmotorized facilities - sound transit nonmotorized facilities 7.0 nonmotorized facilities 7-2...
TRANSCRIPT

East Link Project Final EIS 7-1 7.0 Nonmotorized Facilities July 2011
7.0 Nonmotorized Facilities
7.1 Section Overview This section describes the existing conditions and any identified future impacts with the project on nonmotorized facilities within the study area. Data were collected and analyzed for impacts on nonmotorized facilities—including sidewalks, designated bicycle routes, marked bicycle lanes, and regional multiuse trails. Sidewalk inventory extended 0.5 mile from potential stations; bicycle-route inventory extended 1 mile from potential stations. Regional multiuse trails were inventoried within 1 mile of potential stations. These trails provide regional mobility for nonmotorized users and allow East Link riders to transfer to nonmotorized modes. School walk routes were inventoried and analyzed for potential impacts on general walkability, based on their proximity to station alternatives. Land uses within 0.5 mile from the proposed stations were included in the nonmotorized analysis to evaluate the pedestrian activity surrounding the stations. The evaluation of nonmotorized facilities indicated that the East Link Project would generally increase the pedestrian activity in and around the proposed stations, compared with existing conditions.
In the no-build condition, pedestrian and bicycle facilities are likely to improve with numerous planned improvements included in agency long-range plans. East Link would support, and in most cases enhance, these improvements as the project proposes a number of nonmotorized amenities in and adjacent to the stations to minimize impacts on pedestrian and bicycle circulation during both East Link construction and operation. Sound Transit would provide enhancements, if needed, to the sidewalk adjacent to East Link stations. These enhancements would provide comfortable and safe pedestrian and bicycle access to and from the stations and areas surrounding the stations. Treatments for safe and effective pedestrian access might include crosswalks, signals, street lighting, safety gates, warning lights, signage, and other elements that might provide standard features to facilitate safe and accessible transfers for transit customers from one type of public transportation to another. In addition to pedestrian and bicycle circulation improvements, the project would provide station amenities such as bicycle racks and lockers.
There are crosswalks at all arterial study intersections within the corridor, and street-crossing access would generally remain similar to existing conditions or improve with light rail. For at-grade stations (either on the side of the roadway or in the median), crosswalks would be maintained or added to connect pedestrians and bicyclists with the station platform. For tunnel and elevated stations, stair and elevator access would be provided to connect pedestrians and bicyclists with the station platform. For elevated or at-grade alternatives, crosswalks might have slightly longer pedestrian walking distances across the roadway. Where there is at-grade light rail track crossing a sidewalk or crosswalk, either a traffic signal or light rail crossing gates and warning signals would be provided for pedestrians and bicyclists safety. Currently, there are few mid-block pedestrian crosswalks within the study area, and the East Link Project would maintain these existing crossings if directly affected, while not creating any new mid-block crossings.
Because some of the East Link stations would be located near local and regional trails, nonmotorized regional mobility would be enhanced by the project. The East Link Project would provide access and mobility to transit facilities and improved connections to the regional nonmotorized system. Without the project, pedestrian and bicycle facilities located where stations are proposed might remain disconnected, with little or no improvements and lacking amenities. Without light rail, some nonmotorized connections would continue to lack access to surrounding neighborhoods and urban centers.
7.2 Affected Environment Pedestrian circulation and sidewalks were inventoried and evaluated along arterial streets within 0.5 mile of the proposed stations. In addition, pedestrian LOS was calculated to evaluate pedestrian crowding at intersections near (within 300 feet) the proposed stations. Gaps in the sidewalk network surrounding stations were identified on either one or both sides of arterial streets to assess the general walking conditions of pedestrian circulation paths leading to and from the stations. Land uses within 0.5 mile walking distance of the proposed stations were

7.0 Nonmotorized Facilities
7.0 Nonmotorized Facilities 7-2 East Link Project Final EIS July 2011
included in the analysis to provide understanding of the existing and future pedestrian circulation surrounding the stations. Bicycle facilities within a 1-mile radius of stations were identified to determine bicycle circulation patterns and if there are any impacts. Regional multiuse trails were identified, as well as school walk routes recommended by local agencies. Appendix A of this Transportation Technical Report (Appendix H1 of this Final EIS) provides greater detail on the analysis methodology.
7.2.1 Pedestrian Activity, Sidewalks, and School Walk Routes Sidewalks are available along most arterial streets within the study area, providing sufficient pedestrian connections. Generally, there are only a few areas that are missing sidewalks on one or both sides of the street. Streets that lack sidewalks are typically in residential neighborhoods, on local access streets, or on streets with low pedestrian volumes. The following subsections describe the pedestrian activity, sidewalks, and crosswalks in each segment of the East Link Project. Bicycle routes and facilities, and regional multiuse trails are discussed in Section 7.2.2.
7.2.1.1 Segment A Sound Transit inventoried nonmotorized facilities located in Segment A within the City of Seattle and the City of Mercer Island. Generally, there are sidewalks surrounding Rainier Station and Mercer Island Station. A few small segments with missing sidewalks, less than one-quarter mile, were identified along Rainier Avenue South and some arterials along Mercer Island where sidewalk was provided on one side of the roadway. Table 7-1 and Exhibits 7-1 and 7-2 show missing sidewalk facilities identified within 0.5 mile of stations.
The Rainier Station in Segment A is located between the Central Area and North Rainier Valley neighborhoods in Seattle. Pedestrians using bus facilities in this area mostly originate from or are destined for the surrounding neighborhoods, including the International District. A few small segments with missing sidewalks, less than one-quarter mile in length, were identified along Rainier Avenue South. Crosswalks are present at most arterial intersections in this area. Sidewalks are present along both sides of Rainier Avenue South, south of I-90. North of I-90, sidewalks are present along the western side of Rainier Avenue South. On the east side of Rainier Avenue South, under I-90, the sidewalk terminates and connects to a paved trail that continues into Judkins Park and Playfield. The sidewalk and crosswalk configuration in this area is discontinuous and therefore can create slightly longer walking distances for pedestrians. Additionally, there is a midblock crossing on 23rd Avenue South connecting South Day Street to the western portion of the I-90 Lid Park and the Rainier Station. Generally, pedestrian and bicycle circulation in this area is from residents and some commercial users as well as recreational users where Judkins Park connects to the I-90 Trail.
TABLE 7-1 Missing Arterial Sidewalk Segments within Segment A
Map IDa Roadway From To Missing Sideb
SWG1 Martin Luther King, Jr. Way South South Dearborn Street South Norman Street Both
SWG2 Martin Luther King, Jr. Way South Irving Street Sam Smith Park Entrance Both
SWG3 Rainier Avenue South South State Street South Grand Street Both
SWG4 Rainier Avenue South South Holgate Street South Plum Street Both
SWG5 17th Avenue South South Massachusetts Street South College Street Irregular
SWG6 SE 24th Street 72nd Avenue SE 76th Avenue SE One
SWG7 SE 26th Street Island Crest Way North Mercer Way One
SWG8 North Mercer Way 76th Avenue SE SE 26th Street One
SWG9 Island Crest Way North Mercer Way SE 34th Place Irregular
a Corresponds to ID numbers in Exhibits 7-1 and 7-2. b Irregular portions might occur on one or both sides of street.

!!
!!
!!
!!
!!
!!
$1
n
n
n
n
n
n
@ @
ElliotBay
§̈5
§̈90
§̈5
To Sea-TacAirport
To Universityof Washington
RainierStation
Segment A
Airport/SpokanePark & Ride
S E A T T L E
RAINIER AVE S 23RD AVE S
31ST AVE S
S COLLEGE ST
17TH AVE S
15TH AVE S
BEACON AVE S
S ROYAL BROUGHAM WAY
S DEARBORN ST
JAMES STE JEFFERSON ST
14TH AVE
BROADWAY AVE
AIRPORT WAY S
LAKE WASHINGTON BOULEVARD
SAM SMITH PARK
JUDKINS PARK AND
PLAYFIELD
STURGUSPARK
TAEJONPARK
I-90 LID
JUDGECHARLES
M. STOKES\OVERLOOK
I-90 LID
BLUEDOG
POND
ATLANTICSTREET
PARK
EASTPORTAL
VIEWPOINT
SOUTH DAYSTREET PARK
6TH AVE S
15TH
AVE S
5TH AVE
3RD AVE
E UNION ST
M L KING JR WAY S
7TH AVE
E CHERRY ST
23RD
AVE
S
1ST AVE
E YESLER WAY
BROA
DWAY
AVE
9TH AVE
YESLER WAY
S JACKSON ST
1ST AVE S
M L KING JR WAY
S LANDER ST
5TH AVE S
S MC CLELLAN ST
S HOLGATE ST
SENECA ST
WESTERN AVE
12TH AVE S
S FOREST ST
2ND AVE S
SWG5
SWG1
SWG4
SWG2
SWG3
Lake Wa sh in g ton
0 0.25 Mile§Exhibit 7-1 Existing and FutureNo Build Sidewalk and TrailFacilitiesSegment A - SeattleEast Link Project
Sidewalk Gap (SWG)Sidewalk Study Area (1/2 mile)Arterial StreetProposed Station
!!Central LinkAlignment and Station
Source: Data from City of Seattle (2002), King County (2005 and 2006) modified by CH2M HILL, and Sound Transit (2007).
Existing FacilitiesSidewalkMulti-Use Trail
Future Improvements@ Intersection Improvement
Sidewalk ImprovementMulti-Use Trail Improvement
Points of Interest
$1 City Hall
n Public School
NOTE:Phase II SR 519 nonmotorizedimprovements include S RoyalBrougham Way only.
§̈5 §̈405
§̈90
¿À520
¿À202
¿À202
¿À908
L a k e W a s h i n g to n
L a k e Sa m m a m i s h
SeattleSeattle
BellevueBellevue
RedmondRedmondVicinity Map
NOTES:1) Non-motorized facilities shown in the maps are only displayed for arterials orhigher classification roadways within the sidewalk and bicycle study areas. 2) Sidewalk gaps were determined when sidewalk was not present along both sides of the road.

")
")
")
$1
#0
n
n
n
n
n
Lake Wa sh in g ton
§̈90
Segment BSegment A
MercerIslandStation
Mercer Island
United Methodist
ChurchPark & Ride
Mercer Island Presbyterian Church
Park & Ride
Mercer Island Park & Ride
M E R C E RI S L A N D
72ND AVE SE
SE 36TH ST
N MERCER WAY
78TH AVE SE
76TH AVE SE ISLAND CREST WAY
W MERCER WAY
100TH AVE SE
104TH AVE SE
SE 25TH ST
108TH AVE SE
SE 24TH ST
§̈90
UPPER LUTHER
BURBANK PARK
PARK ONTHE LID
SE 40TH ST
ISLAND CREST WAY
77TH AVE SE
80TH AVE SE
SE 27TH ST
SWG11
SWG7
SWG8SWG6
SWG9
SWG10
0 0.25 Mile§Sidewalk Gap (SWG)Sidewalk Study Area (1/2 mile)Arterial StreetProposed Station
Source: Data from King County (2005 and 2006) modified by CH2M HILL.
Exhibit 7-2 Existing and FutureNo Build Sidewalk and TrailFacilitiesSegment A - Mercer IslandEast Link Project
Existing FacilitiesSidewalkMulti-Use Trail
Future ImprovementsSidewalk ImprovementMulti-Use Trail Improvement
Points of Interest$1 City Hall#0 Town Center
n Public School
§̈5
§̈405
§̈90
¿À520
¿À202
¿À202
¿À908
L a k e Wa s h in g to n L a k e
Sa m m a m is hSeattleSeattle BellevueBellevue
RedmondRedmondVicinity MapNOTES:1) Non-motorized facilities shown in the maps are only displayed for arterials or higher classification roadways within the sidewalk and bicycle study areas. 2) Sidewalk gaps were determined when sidewalk was not present along both sides of the road.

7.0 Nonmotorized Facilities
East Link Project Final EIS 7-5 7.0 Nonmotorized Facilities July 2011
In Mercer Island, recent mixed-use developments at the Mercer Island Town Center, completion of the new Mercer Island Park-and-Ride Lot, and improvements in pedestrian connectivity have resulted in a more walkable area between the Town Center and North Mercer Island. Nearly all of the commercial activity in Mercer Island is centralized at the Mercer Island Town Center, making it a common destination for residents and pedestrians. The Mercer Island I-90 Lid Park provides multiple connections across I-90 between North Mercer Island and the Town Center and provides the largest area of nonmotorized recreational use on Mercer Island. Sidewalks located along 76th Avenue SE, 77th Avenue SE, and 80th Avenue SE provide pedestrian and bicycle connectivity across I-90. Crosswalks and wider sidewalks are present throughout most of the commercial area in Mercer Island, in addition to some pedestrian-friendly roadway elements such as bulb-outs and street trees. There are school walk routes for Beacon Hill Elementary School and Thurgood Marshall Elementary School within 0.5 mile of Rainier Station. However, these walk routes are located on collector and local streets and are not present on arterial streets within the Seattle area of Segment A. There are no school walk routes in Mercer Island within 0.5 mile of the Mercer Island Station.
7.2.1.2 Segment B Generally, there is less pedestrian activity in Segment B than in the other segments because of the surrounding residential neighborhoods of Enatai, Surrey Downs, and Wilburton and Mercer Slough Nature Park, topography, and street configuration. In addition, high traffic volumes on 112th Avenue SE, Bellevue Way SE, and near the SE 8th Street/I-405 interchange can discourage pedestrians and bicycle activities. Even so, common walking origins or destinations in this area include the Enatai neighborhood, nearby office parks, and the Mercer Slough recreational area. There are generally sidewalks along arterial and residential collector streets within Segment B. There are missing sidewalk facilities, located on one side, both sides scattered on most arterials within 0.5 mile of the potential stations mainly because of topographical constraints. Table 7-2 and Exhibit 7-3 list these missing sidewalk sections.
TABLE 7-2 Missing Arterial Sidewalk Segments within Segment B
Map IDa Roadway From To Missing Sideb
SWG10 106th Avenue SE SE 30th Street 108th Avenue SE Both
SWG11 SE 25th Street 104th Avenue SE 108th Avenue SE One
SWG12 SE 34th Street 108th Avenue SE 111th Avenue SE Both
SWG13 Bellevue Way SE 112th Avenue SE 113th Avenue SE One
SWG14 118th Avenue SE SE 8th Street I-90 Entrance One
SWG15 SE 8th Street 114th Avenue SE Lake Hills Connector One
SWG16 Lake Hill Connector Road SE 6th Street Kelsey Creek Park One
SWG17 121st Avenue SE SE 8th Street SE 20th Place One
a Corresponds to ID numbers in Exhibit 7-3. b Irregular portions might occur on one or both sides of street.
The South Bellevue Park-and-Ride Lot is located approximately 0.5 mile north of I-90. Most of the surrounding land use consists of open recreational spaces between I-90 and the South Bellevue Park-and-Ride Lot. Office parks are located north of the park-and-ride lot, along 112th Avenue SE. As a result, high pedestrian volumes are relatively uncommon around the park-and-ride area. Crosswalks are located at the signalized intersection entrance to the park-and-ride lot. Sidewalk is absent along the western side of Bellevue Way, south of 112th Avenue SE, because of right-of-way constraints associated with the topography.
The existing sidewalks surrounding the proposed 118th Avenue and SE 8th Street stations are generally located along arterial streets, although sidewalks are absent on the east side of 114th Avenue NE (along I-405) and 118th Avenue SE because of right-of-way constraints. At the interchange of SE 8th Street and I-405, crosswalks are marked along the north side of SE 8th Street, although they are absent along the south side of SE 8th Street.

ÂΡ
ÂΡ
")
n
n
n
n
n
n
n
South Bellevue Park & Ride
WilburtonPark &
Ride
Grace LutheranChurchPark & Ride
B E L L E V U E
B E A U X A R T S
Segment B
Segment A
§̈90
§̈405
§̈90
§̈405
SWG15
SWG24
SWG14
SWG17
SWG23
SWG13
SWG16
SWG10
SWG26
SWG12
SWG11
SWG21
SWG22
SWG 20
SWG19
SouthBellevueStation
SE 8thStation
118thStation
108thStation E.
MainStation
BellevueTransitCenterStation
Segment CSegment B
OldBellevueStation
108TH AVE SE
MAIN ST
118TH AVE SE
BELLEVUE WAY SE
SE 8TH ST
104TH AVE SE
112TH
AVE S
E123RD AVE SE
LAKE HILLS CONNECTOR
MERCER SLOUGH NATURE
PARK
SURREY DOWNS
Sidewalk Gap (SWG)Sidewalk Study Area (1/2 mile)Arterial StreetProposed StationCity Limits
ÂΡ New and/or ExpandedPark-and-Ride Lot
0 0.2 Mile§Source: Data from City of Bellevue (2003, 2004, 2005, 2007 and 2010) and King County (2005 and 2006).
Existing FacilitiesSidewalkMulti-Use Trail
Future ImprovementsSidewalk ImprovementMulti-Use Trail ImprovementFuture Roadway Extension
Points of Interest
n School
Exhibit 7-3 Existing and FutureNo Build Sidewalk and Trail Facilities, Segment BEast Link Project
§̈5
§̈405
§̈90
¿À520
¿À202
¿À908
L a k e W a s h in g to n L a k e
Sa m m a m i s h
SeattleSeattle BellevueBellevue
RedmondRedmondVicinity Map
NOTES:1) Non-motorized facilities shown in the maps are generally displayed for arterials or higher classification roadways within the sidewalk and bicycle study areas, as provided by the City of Bellevue for Segments B, C, and D. 2) Sidewalk gaps were determined when sidewalk wasnot present along both sides of the road.
Lake Wa sh in g ton

7.0 Nonmotorized Facilities
East Link Project Final EIS 7-7 7.0 Nonmotorized Facilities July 2011
Within one-mile of the stations in Segment B, there are few local or collector east-west streets that connect the arterial streets to each other. Lake Hills Connector Road and SE 8th Street are the main east-west arterials providing connection between the South Bellevue and Wilburton neighborhoods.
A missing sidewalk was identified on SE 25th Street, which serves the school walk route for Enatai Elementary School. Most of the school walk routes for this school are located on collector and local residential streets.
7.2.1.3 Segment C Downtown Bellevue is a major destination in the eastern Puget Sound region, and pedestrian circulation is higher in Downtown Bellevue than in the other segments. Sidewalks and crosswalks are generally present throughout Segment C and surrounding Bellevue Transit Center as indicated in Table 7-3 and shown in Exhibit 7-4. Full sidewalks are present at locations nearest to the proposed stations, indicating that pedestrian circulation would be generally well supported by existing sidewalks, although topography reduces the ease of pedestrian east-west movements in the eastern edge of downtown. Sidewalks are also provided on the arterials that connect Downtown Bellevue with Segments B and D.
TABLE 7-3 Missing Arterial Sidewalk Segments within Segment C
Map IDa Roadway From To Missing Sideb
SWG18 102nd Avenue NE NE 10th Street NE 8th Street One
SWG19 114th Avenue NE NE 6th Street SE 8th Street One
SWG20 Main Street 1st Street 124th Avenue NE Both
SWG21 Main Street 106th Avenue NE 108th Avenue NE One
SWG22 NE Lake Washington
Boulevard 97th Avenue NE 100th Avenue NE One
SWG23 108th Avenue NE NE 12th Street NE 24th Street Irregular
a Corresponds to ID numbers in Exhibit 7-4. b Irregular portions might occur on one or both sides of street.
The highest pedestrian activity in Segment C and in the study area is focused around Bellevue Transit Center. There are major pedestrian crossings at Bellevue Transit Center, where there is dense pedestrian activity during the PM peak periods, when commuters are traveling to bus loading areas. Currently, almost 700 pedestrians during the PM peak hour cross through the intersection of 108th Avenue NE and NE 6th Street (adjacent to Bellevue Transit Center). Many pedestrians using this transit center originate from or are destined to nearby employers throughout downtown. An east-west pedestrian pathway provides connectivity between Bellevue Transit Center and Bellevue Square Mall/Lincoln Square and surrounding retail uses. Generally, within the downtown area, pedestrian activity is denser between Bellevue Way and 110th Avenue NE and between NE 8th Street and NE 4th Street, where retail and business office destinations are predominant. The City of Bellevue has also installed or signalized several midblock crosswalks within the downtown area to improve the connectivity between major destinations and land uses.
East of I-405, pedestrian activity occurs mostly near Overlake Hospital. Crosswalks are present along 116th Avenue NE allowing pedestrians access between the Overlake Hospital and the smaller retail areas east of 116th Avenue NE. Pedestrian connectivity between Downtown Bellevue and the Overlake Hospital area is limited to a few connections across I-405. Sidewalk is present along both sides of each crossing; however, pedestrians crossing NE 8th Street must use caution crossing the network of freeway ramp terminals at either ends of the bridge because crosswalks and signals are not present at all the ramp terminals. Crosswalks are also present along NE 8th Street, east of I-405, at 116th Avenue NE and at 120th Avenue NE intersections, although the distance between these crossings is considerable.
Sidewalks are present along arterials that serve the Bellevue High school walk route in Segment C. Similarly to the other segments, much of the school walk routes are located on collector and local streets.

ÂΡ
")
")
ÂΡ
Æc
$1
n
n
n
n
n
n
n
WilburtonPark &
Ride
Grace LutheranChurchPark & Ride
B E L L E V U E
Lake Washington
LakeBe l l evue
CSegment
DSegment
§̈405
SWG15
SWG20
SWG20
SWG19
SWG16
SWG24 SWG25
SWG22
SWG30SWG23
SWG31
SWG21
SWG18
SWG17
SWG29
SE 8thStation
118thStation
108thStation E.
MainStation
HospitalStation
Bellevue Transit Center Station
Segment CSegment B
Segment C
Segment D
Ashwood/HospitalStation
OldBellevue
Station
108TH AVE NE
BELLEVUE WAY NE
NE 12TH ST
NE 8TH ST
MAIN ST
118TH AVE SE
SE 8TH ST
BEL-RED RD
Sidewalk Gap (SWG)Sidewalk Study Area (1/2 mile)Arterial StreetProposed StationCity Limits
ÂΡ New and/or ExpandedPark-and-Ride Lot
0 0.2 Mile§Source: Data from City of Bellevue (2003, 2004, 2005, 2007 and 2010) and King County (2005 and 2006).
Existing FacilitiesSidewalkMulti-Use Trail
Future ImprovementsSidewalk ImprovementMulti-Use Trail ImprovementFuture Roadway Extension
Points of Interest$1 City Hall
n Public School
Æc Library
Exhibit 7-4 Existing and FutureNo Build Sidewalk and Trail Facilities, Segment CEast Link Project
§̈5
§̈405
§̈90
¿À520
¿À202
¿À908
L a k e W a s h in g to n L a k e
Sa m m a m i s h
SeattleSeattle BellevueBellevue
RedmondRedmondVicinity Map NOTES:1) Non-motorized facilities shown in the maps are generally displayed for arterials or higher classification roadways within the sidewalk and bicycle study areas, as provided by the City of Bellevue for Segments B, C, and D. 2) Sidewalk gaps were determined when sidewalk wasnot present along both sides of the road.
Lake Wa sh in g ton

7.0 Nonmotorized Facilities
East Link Project Final EIS 7-9 7.0 Nonmotorized Facilities July 2011
7.2.1.4 Segment D Pedestrian activity in Segment D is generally lower than in the other segments. Most of the pedestrian activity in Segment D occurs east of 140th Avenue NE near the area surrounding Overlake Village, where retail, medical, and commercial uses are more predominant, and between Overlake Transit Center and the surrounding commercial and office land uses. More sidewalks and traffic signals are present in these areas than in the western part of Segment D. Pedestrian activity in the Bel-Red area between 116th Avenue NE and 140th Avenue NE is minimal because much of the land use consists of light industrial, office park, and commercial uses. Either no sidewalk is provided or large portions of missing sidewalk occur on both sides of the arterial streets in this area (120th, 124th, 130th, and 136th Avenues NE), as listed in Table 7-4 and shown in Exhibit 7-5. Additionally, long walking distances between the two east-west arterials, Bel-Red Road and NE 20th Street, discourage pedestrian activity in this area. However, there are sidewalk facilities on both sides of these two streets. Crosswalks are located at all signalized intersections in Segment D. There are no school walk routes on arterial streets within Segment D.
TABLE 7-4 Missing Arterial Sidewalk Segments within Segment D
Map IDa Roadway From To Missing
Sideb
SWG24 120th Avenue NE NE Bel-Red Road Northup Way Irregular
SWG25 124th Avenue NE NE Bel-Red Road Northup Way Irregular
SWG26 130th Avenue NE NE Bel-Red Road Northup Way Irregular
SWG27 132nd Avenue NE NE Bel-Red Road NE 16th Street Irregular
SWG28 136th Place NE NE Bel-Red Road NE 20th Street Both
SWG29 NE 8th Street/Old Bel-Red Road Near former BNSF Railway tracks 120th Avenue NE One
SWG30 NE Bel-Red Road 156th Avenue NE NE 30th Street One
SWG31 148th Avenue NE NE 24th Street NE 35th Place One
a Corresponds to ID numbers in Exhibit 7-5. b Irregular portions might occur on one or both sides of street.
7.2.1.5 Segment E In Segment E, pedestrian and bicycle activity is relatively higher than in other segments within the Downtown Redmond, Redmond Town Center and Marymoor Park areas because sidewalks, bicycle lanes, and recreational facilities have contributed to a more walkable area. Sidewalks are on most arterial streets in Segment E, with a small area of missing sidewalk on one side of the street, along 166th Avenue NE, as listed in Table 7-5 and shown in Exhibit 7-6. Although Redmond Town Center and Marymoor Park are popular pedestrian destinations, they are separated by SR 520, which presents a barrier for pedestrians wishing to cross between the two areas. The Sammamish River Trail passes beneath SR 520 at the West Lake Sammamish Parkway interchange and provides a pedestrian connection between the park and Downtown Redmond. Crosswalks are provided at all signalized intersections in Segment E, with the exception of the SR 520 entrance/exit ramps along NE 76th Street and NE Redmond Way. A school walk route for Redmond Elementary School is located within a 0.5-mile radius of the Redmond Town Center Station.
TABLE 7-5 Missing Arterial Sidewalk Segments within Segment E
Map IDa Roadway From To Missing Side
SWG32 166th Avenue NE Redmond Way Avondale Road One
a Corresponds to ID numbers in Exhibit 7-6.

")
")
ÂΡ
ÂΡÂΡ
n
n
n
n
n
n
n
n
n
n
n
Æc
@
@
B E L L E V U E
B E L L E V U E
MAIN ST
NE 2ND ST
114T
H AVE
NE
108T
H AVE
NE
106T
H AVE
NE
116T
H AVE
NE
112T
H AVE
NE
LakeBe l l evue
Segment DSegment E
§̈405
SWG24
SWG23
SWG24
SWG25
SWG26
SWG27
SWG27
SWG25
SWG21
SWG22
SWG28
SWG31SWG30
SWG29
Main St.Station
E.MainStation
HospitalStationBellevue
TransitCenterStation
Segment C
Segment D120th
Station130th
Station
OverlakeVillageStation
OverlakeTransitCenterStation
Ashwood/HospitalStation
108TH AVE NE
BELLEVUE WAY NE
NE 12TH ST
NE 8TH ST
MAIN ST
120T
H AV
E NE
130T
H AV
E NE
132N
D AV
E NE
140T
H AV
E NE
NE 24TH ST
NE 8TH ST
NORTHUP WAY
156T
H AV
E NE
NE 20TH ST
124T
H AV
E NE
116T
H AVE
NE
NE BELLEVUE-REDMOND RD
NE 40TH ST
NORTHUP WAY
156T
H AV
E NE
148T
H AV
E NE
NE 8TH ST
112T
H AVE
NE
NE BELLEVUE-REDMOND RD
116T
H AVE
NE
NE 8TH ST
148T
H AV
E NE
Sidewalk Gap (SWG)Sidewalk Study Area (1/2 mile)Arterial StreetProposed StationCity Limits
ÂΡ New and/or ExpandedPark-and-Ride Lot
") Existing Park & Ride / No expansion
0 0.2 Mile§Source: Data from City of Bellevue (2003, 2004, 2005, 2007 and 2010) and King County (2005 and 2006).
Existing FacilitiesSidewalkMulti-Use Trail
Future Improvements@
Intersection ImprovementSidewalk ImprovementMulti-Use Trail ImprovementFuture Roadway Extension
Points of Interest
n School
Exhibit 7-5 Existing and FutureNo Build Sidewalk and Trail Facilities, Segment DEast Link Project
§̈5 §̈405
§̈90
¿À520
¿À202
¿À202
¿À908
L a k e W a s h i n g to n
L a k e Sa m m a m i s h
SeattleSeattle
BellevueBellevue
RedmondRedmondVicinity Map
NOTES:1) Non-motorized facilities shown in the maps are generally displayed for arterials or higher classification roadways within the sidewalk and bicycle study areas, as provided by the City of Bellevue for Segments B, C, and D. 2) Sidewalk gaps were determined when sidewalk wasnot present along both sides of the road.

")
ÂΡ
ÂΡÂΡ
")
ÂΡ
@
@
@
Æc
#0
n
n
n
n
n
n¾À202
¾À520
¾À908
Lake Sammam ish
Segment
SegmentDE
S a m m a m i s h R i v e r
RedmondTransit CenterStation
OverlakeTransitCenterStation
RedmondTown CenterStation
SE RedmondStation
MF 5for E1
DowntownRedmondStation
Bear CreekPark & Ride
RedmondTransit Center
OverlakeTransitCenter
R E D M O N D
B E L L E V U E
BELL
EVUE
166TH AVE NE
NE 76TH ST
NE 51ST ST
156TH AVE NE
NE 85TH ST
NE OLD REDMOND RD
NE UNION HILL RD
NE BELLEVUE-REDMOND RD
NE 40TH ST
LEARY WAY
BEAR CREEK PKWY
BEL-RED RD
148T
H AV
E NE
NE REDMOND WAY
154TH AVE NE
CLEVELAND ST
AVONDAL
E RD NE
WOODINVI LLE -REDMOND RD
161ST AVE NE
148T
H AV
E NE
NE REDMOND WAY
152ND AVE NE
WEST LAKE SAMMAMISH PKWY NE
180TH AVE NE
NE 60TH ST
¾À202
NE 80TH ST
171ST AVE NE
WILLOWS RD NE
BNSF Railway
MARYMOORPARK
TOWN CENTER OPEN SPACE
SAMMAMISHRIVER
TRAIL SITE
DUDLEY CARTERPARK
THE EDGESKATE PARK
SWG37
SWG36
SWG32
0 0.25 Mile§Sidewalk Gap (SWG)Sidewalk Study Area (1/2 mile)Arterial StreetProposed StationCity Limits
ÂΡ New and/or ExpandedPark-and-Ride Lot
") Existing Park & Ride / No expansion
Source: Data from City of Redmond (2007) and King County (2005 and 2006) modified by CH2M HILL.
Exhibit 7-6 Existing and FutureNo Build Sidewalk and TrailFacilities, Segment EEast Link Project
Existing FacilitiesSidewalkMulti-Use Trail
@ Intersection ImprovementSidewalk ImprovementMulti-Use Trail ImprovementFuture Roadway Extension
Points of Interest#0 Town Center
n Public School
Æc Library
§̈5 §̈405
§̈90
¿À520
¿À202
¿À908
L a k e W a s h i n g t o n L a k e
Sa m m a m i s hSeattleSeattle
BellevueBellevue
RedmondRedmondVicinity Map
NOTES:1) Non-motorized facilities shown in the maps are only displayed for arterials or higher classification roadways within the sidewalk and bicycle study areas. 2) Sidewalk gaps were determined when sidewalk was not present along both sides of the road.

7.0 Nonmotorized Facilities
7.0 Nonmotorized Facilities 7-12 East Link Project Final EIS July 2011
7.2.2 Bicycle Routes and Lanes and Multiuse Trails
7.2.2.1 Bicycle Routes and Lanes Throughout the East Link study area, while there are bicycle lanes on some arterials, designated and signed bicycle routes are located on most arterial or collector streets. Some arterials in the study area also have a wide shoulder that allows bicycle activity. Designated bicycle routes do not necessarily have marked lanes, although signage typically is present along these routes as an indicator to motorists that bicyclists are likely to share the roadway with vehicles. Designated bicycle routes, marked bicycle lanes, and regional multiuse trails in the study area include 12th Avenue South in Seattle; the I-90 Trail (includes North Mercer Way) on Mercer Island; Bellevue Way, 108th Avenue SE, 112th Avenue SE, 118th Avenue SE, NE 20th and NE 24th Street, and 140th Avenue NE in Bellevue; and 156th Avenue, West and East Lake Sammamish Parkway, and SR 202/Redmond Way in Redmond.
In Seattle, 12th Avenue South is a designated bicycle route, and there are marked bicycle lanes on South Dearborn Street and Martin Luther King Jr. Way South. East-west bicycle connectivity to these streets is achieved primarily through routes on collector and local streets. There are bicycle facilities facilities on both sides of most arterial streets on Mercer Island, including North Mercer Way, Island Crest Way, and 78th Avenue SE. Bicycle activity in Segment B occurs more frequently along the I-90 Trail through Bellevue, within the local street network in the Enatai and Beaux Arts neighborhoods, and within the Mercer Slough recreational area. There are designated routes on some arterial streets in Segment C along 112th Ave NE and 116th Ave NE that connect to the SR 520 multiuse trail. Within Segment D, designated bike routes are present on some local and arterial streets north of NE 24th Street in the Cherry Crest neighborhood. The SR 520 multiuse trail provides most of the continuous bicycle coverage through Segment D. In the City of Redmond, bicycle facilities are present along segments of NE 85th Street, NE 83rd Street, and 171st Avenue NE. Most other streets through Downtown Redmond are designated bicycle routes. The Sammamish River Trail, Bear Creek Parkway Trail, and Marymoor Park trail network are bicycle facilities. Exhibits 7-7 (Rainier Station), 7-8 (Mercer Island Station), 7-9 (Segment B), 7-10 (Segment C), 7-11 (Segment D), and 7-12 (Segment E) show arterials within the study area where existing bicycle facilities are present.
7.2.2.2 Multiuse Trails Multiuse trails provide regional mobility for nonmotorized users. There are several regional multiuse trails within the study area, and some of the accesses to these trails are located within close walking or bicycling distance to the proposed stations, providing transit riders with a location to easily transfer to and from nonmotorized modes. Regional multiuse trails located in the project vicinity include the I-90 Multiuse Regional Trail (Mountains to Sound Greenway), Mercer Slough Nature Park, and multiuse trails, SR 520 Regional Trail, Bridle Crest Trail, Sammamish River Trail, East Lake Sammamish Trail, and Bear Creek Trail. These trails are connected to one another by local, designated bicycle routes.
The I-90 Trail originates at Sturgus Park in Seattle and crosses Lake Washington along the westbound side of I-90. A portion of the trail terminates at Mercer Slough Nature Park in south Bellevue. Trail users can also follow a paved portion of the trail that continues east of I-405, adjacent to I-90. An internal trail network within Mercer Slough Nature Park provides trail connectivity to the 118th Trail and other nonmotorized facilities that are beyond the 1-mile radius of the proposed South Bellevue Station. The I-90 Trail is a popular bicycle facility among recreational users and bicycle commuters, and it is the only nonmotorized facility that provides pedestrian and bicycle access across Lake Washington and to Mercer Island. In 2009, approximately 60 bicycle users were counted during the AM peak, and 100 bicycle users were counted during the PM peak at the intersection of the I-90 Trail entrance at Enatai Park in Bellevue. At the I-90 Trail/12th Avenue South in Seattle, approximately 110 bicyclists were counted in the AM peak and 130 in the PM peak (WSDOT, 2009b).
In Segments D and E, the SR 520 Regional Trail is a major multiuse trail facility that follows SR 520 to the Redmond Town Center. The trail is primarily accessible through public park areas, although there are few access points along the trail from designated bicycle routes on arterial streets.
Trails that are used only for recreation are not addressed in this section. (For information about recreational facilities, see Section 4.17, Parkland and Open Space, of the Final EIS.)

!!
!!
!!
!!
!!
$1
n
n
n
n
n
n
@ @
ElliotBay
§̈5
§̈90
§̈5To Sea-Tac
Airport
To Universityof Washington
RainierStation
Segment A
Airport/SpokanePark & Ride
S E A T T L E
RAINIER AVE S 23RD AVE S
31ST AVE S
S COLLEGE ST
17TH AVE S
15TH AVE S
BEACON AVE S
S ROYAL BROUGHAM WAY
S DEARBORN ST
JAMES STE JEFFERSON ST
14TH AVE
BROADWAY AVE
AIRPORT WAY S
LAKE WASHINGTON BOULEVARD
SAM SMITH PARK
JUDKINS PARK AND
PLAYFIELD
STURGUSPARK
TAEJONPARK
I-90 LID
JUDGECHARLES M. STOKES\OVERLOOK
I-90 LID
BLUEDOG
POND
ATLANTICSTREET
PARK
EASTPORTAL
VIEWPOINT
SOUTH DAYSTREET PARK
6TH AVE S
15TH
AVE S
5TH AVE
M L KING JR WAY S
7TH AVE
E CHERRY ST
23RD
AVE
S
E YESLER WAY
BROA
DWAY
AVE
9TH AVE
YESLER WAY
S JACKSON ST
1ST AVE S
M L KING JR WAY
5TH AVE S
S MC CLELLAN ST
S SPOKANE ST
S HOLGATE ST
SENECA ST
12TH AVE S
ALAS
KAN
WAY S
2ND AVE S
Lake Wa sh in g ton
0 0.25 Mile§Exhibit 7-7 Existing and FutureNo Build Bicycle FacilitiesSegment A - SeattleEast Link Project
Bicycle Study Area (1 mile)Arterial StreetProposed Station
!!Central LinkAlignment and Station
Source: Data from City of Seattle (2002), King County (2005 and 2006) modified by CH2M HILL, and Sound Transit (2007).
Existing FacilitiesBicycle Lane/Shared RouteBicycle Route
Future Improvements@ Intersection Improvement
Proposed Bicycle Improvement
Points of Interest$1 City Hall
n Public School
§̈5 §̈405
§̈90
¿À520
¿À202
¿À202
¿À908
Lake Washington
Lake Sammamish
SeattleSeattle
BellevueBellevue
RedmondRedmondVicinity Map
NOTES:1) Non-motorized facilities shown in the maps are only displayed for arterials or higher classification roadways within the sidewalk and bicycle study areas.

")
")
")
$1
#0
n
n
n
n
n
Lake Wa sh in g ton
§̈90
Segment BSegment A
MercerIslandStation
Mercer Is. United
Methodist Church
Park & Ride
Mercer Island Presbyterian Church
Park & Ride
Mercer Island Park & Ride
M E R C E RI S L A N D
B E A U XA R T S
72ND AVE SE
SE 36TH ST
N MERCER WAY
78TH AVE SE
76TH AVE SE ISLAND CREST WAY
W MERCER WAY
100TH AVE SE
104TH AVE SE
SE 25TH ST
108TH AVE SE
SE 24TH ST
UPPERLUTHERBURBANKPARK
PARK ONTHE LID
SE 40TH ST
ISLAND CREST WAY
77TH AVE SE
80TH AVE SE
SE 27TH ST
§̈90
0 0.25 Mile§Bicycle Study Area (1 mile)Arterial StreetProposed Station
Source: Data from King County (2005 and 2006) modified by CH2M HILL.
Exhibit 7-8 Existing and FutureNo Build Bicycle FacilitiesSegment A - Mercer IslandEast Link Project
Existing FacilitiesBike LaneBike Route
Future ImprovementsProposed Bicycle LaneProposed Off-Street Path
Points of Interest$1 City Hall#0 Town Center
n Public School
§̈5
§̈405
§̈90
¿À520
¿À202
¿À908
L a k e W a s h in g to n
L a k e Sa m m a m i s h
SeattleSeattle BellevueBellevue
RedmondRedmondVicinity Map
NOTE:1) Non-motorized facilities shownin the maps are only displayed for arterials or higher classification roadways within the sidewalk and bicycle study areas.

ÂΡ
ÂΡ
")
n
n
n
n
n
n
n
South Bellevue Park & Ride
WilburtonPark & Ride
Grace LutheranChurchPark & Ride
B E L L E V U E
B E A U X A R T S
Segment B
Segment A §̈90
§̈405
§̈90
SouthBellevueStation
SE 8thStation
118thStation
108thStation E.
MainStation
BellevueTransitCenterStation
Segment CSegment B
OldBellevue
Station
108TH AVE SE
MAIN ST
118TH AVE SE
BELLEVUE WAY SE
SE 8TH ST
Exhibit 7-9 Existing and FutureNo Build Bicycle Facilities,Segment BEast Link Project0 0.2 Mile§
Source: Data from City of Bellevue (2003, 2004, 2005, 2007 and 2010) and King County (2005 and 2006).Bicycle Study Area (1 mile)Arterial StreetProposed StationCity Limits
ÂΡ New and/or ExpandedPark-and-Ride Lot
§̈5
§̈405
§̈90
¿À520
¿À202
¿À908
L a k e W a s h in g to n
L a k e Sa m m a m i s h
SeattleSeattle BellevueBellevue
RedmondRedmondVicinity Map
Existing FacilitiesBike RouteBike Lane
Future ImprovementsProposed Bicycle LaneProposed Off-Street Path (Includes Bike Routes)Future Roadway Extension
Points of Interest
n School
NOTES:1) Non-motorized facilities shown in the maps are generally displayed for arterials or higher classification roadways within the sidewalk and bicycle study areas as provided by the City of Bellevue for Segments B, C, and D.
Lake Wa sh in g ton
MERCER SLOUGH NATURE
PARK

ÂΡ
")
")
ÂΡ
Æc
$1
n
n
n
n
n
n
n
WilburtonPark & Ride
Grace LutheranChurchPark & Ride
B E L L E V U E
Lake Washington
LakeBe l l evue
CSegment
DSegment
§̈405
SE 8thStation
118thStation
E.MainStation
HospitalStation
Bellevue Transit Center Station
Segment CSegment B
Segment C
Segment D
OldBellevue
Station
Ashwood/HospitalStation
108thStation
120thStation
108TH AVE NE
BELLEVUE WAY NE
NE 12TH ST
NE 8TH ST
MAIN ST
118TH AVE SE
SE 8TH ST
BEL-RED RD
116TH AVE NE
124TH AVE NE
Exhibit 7-10 Existing and FutureNo Build Bicycle Facilities, Segment CEast Link Project0 0.2 Mile§
Source: Data from City of Bellevue (2003, 2004, 2005, 2007 and 2010) and King County (2005 and 2006).
Bicycle Study Area (1 mile)Arterial StreetCity Limits
ÂΡ New and/or ExpandedPark-and-Ride Lot
§̈5
§̈405
§̈90
¿À520
¿À202
¿À908
L a k e W a s h i n g to n
L a k e Sa m m a m i s h
SeattleSeattle BellevueBellevue
RedmondRedmondVicinity MapExisting FacilitiesBike RouteBike Lane
Future ImprovementsProposed Bicycle LaneProposed Off-Street Path (Includes Bike Routes)Future Roadway Extension
Points of Interest$1 City Hall
n Public School
Æc Library
NOTES:1) Non-motorized facilities shown in the maps are generally displayed for arterials or higher classification roadways within the sidewalk and bicycle study areas as provided by the City of Bellevue for Segments B, C, and D.
Lake Wa sh in g ton

")
")
ÂΡ
ÂΡÂΡ
n
n
n
n
n
n
n
n
n
n
n
B E L L E V U E
L a k eBe l le v u e
Segment DSegment E
§̈405
Main St.Station
HospitalStationBellevue
TransitCenterStation
Segment C
Segment D120th
Station130th
Station
OverlakeVillageStation
OverlakeTransitCenterStation
Ashwood/HospitalStation
108TH AVE NE
NE 12TH ST
NE 8TH ST
BEL-RED RD
NE BELLEVUE-REDMOND RD
NORTHUP WAY
NE 40TH ST
NE 20TH ST
148T
H AVE
NE
150T
H AVE
NE
140T
H AVE
NE
NE 8TH ST
116T
H AV
E NE
120T
H AVE
NE
130T
H AVE
NE
NE 24TH ST
Exhibit 7-11 Existing and FutureNo Build Bicycle Facilities, Segment DEast Link Project0 0.2 Mile§
Source: Data from City of Bellevue (2003, 2004, 2005, 2007 and 2010) and King County (2005 and 2006).
Bicycle Study Area (1 mile)Proposed StationCity Limits
ÂΡ New and/or ExpandedPark-and-Ride Lot
§̈5 §̈405
§̈90
¿À520
¿À202
¿À908
Lake Washington
Lake Sammamish
SeattleSeattleBellevueBellevue
RedmondRedmondVicinity MapExisting FacilitiesBike RouteBike Lane
Future ImprovementsProposed Bicycle LaneProposed Off-Street Path (Includes Bike Routes)Future Roadway Extension
Points of Interest
n School
NOTES:1) Non-motorized facilities shown in the maps are generally displayed for arterials or higher classification roadways within the sidewalk and bicycle study areas as provided by the City of Bellevue for Segments B, C, and D.
B E L L E V U E
R E D M O N D

")
ÂΡ
ÂΡÂΡ
")
ÂΡ
@
@
@
#0
n
n
n
n
n
Æc
¾À202
¾À520
¾À908
Lake Sammam ish
SegmentSegmentD
E
S a m m a m i s h R i v e r
RedmondTransit CenterStation
OverlakeTransitCenterStation
RedmondTown CenterStation
SE RedmondStation
MF 5 for E2, E4
MF 5for E1
DowntownRedmondStation
Bear CreekPark & Ride
RedmondTransit Center
OverlakeTransitCenter
R E D M O N D
B E L L E V U E
BELL
EVUE
166TH AVE NE
NE 76TH ST
NE 51ST ST
156TH AVE NE
NE 85TH ST
NE OLD REDMOND RD
NE UNION HILL RD
NE BELLEVUE-REDMOND RD
NE 40TH ST
LEARY WAY
BEAR CREEK PKWY
BEL-RED RD
148T
H AV
E NE
NE REDMOND WAY
154TH AVE NE
CLEVELAND ST
AVONDALE
RD NE
WOODINVILLE -REDMOND RD
161ST AVE NE
148T
H AV
E NE
NE REDMOND WAY
152ND AVE NE
WEST LAKE SAMMAMISH PKWY NE
180TH AVE NE
NE 60TH ST
¾À202
NE 80TH ST
171ST AVE NE
WILLOWS RD NEBNSF Railway
MARYMOORPARK
TOWN CENTER OPEN SPACE
SAMMAMISHRIVERTRAIL SITE
DUDLEY CARTERPARK
THE EDGESKATE PARK
0 0.25 Mile§Bicycle Study Area (1 mile)Arterial StreetProposed StationCity Limits
ÂΡ New and/or ExpandedPark and Ride
Source: Data from City of Redmond (2007) and King County (2005 and 2006) modified by CH2M HILL.
Exhibit 7-12 Existing and FutureNo Build Bicycle FacilitiesSegment EEast Link Project
Existing FacilitiesBike LaneBike Route
@ Intersection ImprovementProposed Bicycle LaneProposed Off-Street PathFuture Roadway Extension
Points of Interest#0 Town Center
n Public School
Æc Library
§̈5 §̈405
§̈90
¿À520
¿À202
¿À908L a k e
W a s h i n g t o n
L a k e Sa m m a m i s h
SeattleSeattle BellevueBellevue
RedmondRedmondVicinity Map
NOTES:1) Non-motorized facilities shown in the maps are only displayed for arterials or higher classification roadways within the sidewalk and bicycle study areas.

7.0 Nonmotorized Facilities
East Link Project Final EIS 7-19 7.0 Nonmotorized Facilities July 2011
7.3 Environmental Impacts This section describes the impacts on nonmotorized facilities and pedestrian access surrounding the stations. This includes identifying any sidewalk, bicycle and crosswalk impacts related to the project, impacts on recommended school walk routes and impacts during construction and mitigation.
To evaluate the ease and flexibility of nonmotorized activity in the areas surrounding proposed stations and the station’s potential to attract walk and bike trips, the percent of existing and future sidewalk and bicycle facility coverage was inventoried and measured surrounding each proposed station. Major land uses within 0.5 mile of proposed stations were included in the analysis to identify types of nonmotorized activities that would occur among the stations. Additionally, at each proposed station, barriers to walking and biking were identified (such as topography and long distances between crosswalks), as well as posted roadway speeds, crosswalk locations, and average block lengths. Future sidewalk and bicycle facility coverage was obtained using GIS data from each municipality’s nonmotorized Capital Improvement Plan (CIP) and long-range planned projects. Appendix G in this Transportation Technical Report lists nonmotorized transportation improvement projects in the study area.
Pedestrian LOS for sidewalks and intersection crossings near station entrances was evaluated using methodology from the Highway Capacity Manual (TRB, 2000) and the TCQSM (TRB, 2003). Pedestrian LOS is a measure of the walking conditions on a sidewalk, route, or path. LOS A represents ample spacing between pedestrians on a sidewalk or path allowing for free-flow walk speeds. LOS F represents unavoidable crowding between pedestrians on a sidewalk or path, preventing free-flow walking speed and movement. Table B-9 in Appendix B of this Transportation Technical Report contains the LOS definitions, criteria, and descriptions for walkways and sidewalks.
Existing pedestrian data were obtained from intersection volume counts collected for the project and evaluated for 15-minute flow rates. To analyze 2020 and 2030 no-build pedestrian volumes, existing pedestrian volumes were increased by the forecast annual traffic growth rates expected for each segment. For the build condition, the PM peak-period ridership forecasts were used to develop a station’s pedestrian forecasts. Pedestrians were distributed to intersection crossings based on existing and future land uses. Pedestrian LOS is summarized for each segment in Tables F-1 to F-10 in Appendix F of this Transportation Technical Report [Appendix H1 of the FEIS]). Although the East Link Project would substantially increase the number of pedestrians in and around most of the stations, sidewalks and intersection crossings throughout the study area were shown to operate at LOS C or better in the future no-build and build conditions. This indicates that there is sufficient spacing between pedestrians on the sidewalk for them to walk freely at their own speed, with the ability to cross paths with other pedestrians without causing conflicts in most instances.
The project proposes a number of improvements in and around stations to minimize impacts on pedestrian and bicycle circulation, both during construction and during light rail operation. Transit facility designs would be flexible, allowing each station to reflect and fit into the community it serves, while providing standard features to facilitate smooth and accessible transfers for transit customers from one type of transportation to another. Standard design features would include the following:
Security and safety design standards
Easy-to-read and consistent signs
Pedestrian-friendly design and full access for people with disabilities
Bicycle access and secure storage
Sidewalks immediately adjacent to stations (as shown on the conceptual design drawings in Appendix G1 of the East Link Final EIS)
Each station would provide bicycle storage, including racks and often lockers. The proposed number of bicycle racks and lockers at each station is provided in the following sections. Stations would include additional capacity for expansion of bicycle racks and lockers in the future. Because of the proximity of some stations to regional trails, such as the I-90 Trail, the East Lake Sammamish Trail, and the potential BNSF Railway trail, wayfinding signage for nearby regional trails and other local destinations could be incorporated into station site design elements.

7.0 Nonmotorized Facilities
7.0 Nonmotorized Facilities 7-20 East Link Project Final EIS July 2011
7.3.1 Segment A In Segment A, Preferred Alternative A1 would serve the Rainier and Mercer Island Stations.
7.3.1.1 Pedestrian Circulation Preferred Interstate 90 Alternative (A1) As shown in Table 7-6, there are minimal planned improvements that would affect the sidewalk coverage surrounding the Rainier Station. Pedestrian and bicycle connectivity to the I-90 Lid Park and I-90 Trail from the Rainier Station is provided by the mid-block crosswalk on 23rd Avenue South. Crosswalks at Rainier Station and the I-90 ramp areas would be maintained, and walking distances surrounding the station would not change from existing conditions. Adding wayfinding signage along Rainier Avenue South would help pedestrians navigate through the I-90 ramp area as there are long distances between crosswalks. Other existing pedestrian access locations with the I-90 Trail would not be affected.
The access to the Mercer Island Station would be located along 80th Avenue SE. If the passenger drop-off/pick-up area is located along 77th Avenue SE, station access would also be provided along this street. If the passenger drop-off/pick-up area is not located along 77th Avenue SE, then it would remain in the Mercer Island Park-and-Ride lot. An additional station access is being evaluated that would provide a pedestrian bridge extending over eastbound I-90. This bridge would accommodate about 25 percent of the riders at the station during the 3-hour peak period. Because the Mercer Island Station is located within I-90, walking distances, sidewalks, and crosswalks on the arterial streets are expected to remain similar to no-build conditions. Compared to existing, conditions, a few new sidewalks are planned in the future; therefore, the sidewalk coverage area surrounding the Mercer Island Station increases in Table 7-6. Overcrowding on sidewalks is not expected near Mercer Island Station. Appendix D of this Transportation Technical Report (Appendix H1 of this Final EIS) presents the pedestrian LOS results.
Nearby school walk routes along local and collector streets near Rainier Station would not likely be affected because transit bus routes servicing Rainier Station would not use these residential local and collector streets. There are no school walk routes within walking distance of the Mercer Island Station.
As shown in Table 7-7, the year 2030 PM peak-period pedestrian activity at the Rainier Station would be split evenly between people boarding and alighting (exiting) light rail and is a little less than half of the total person-trips at this station. This indicates that the land uses surrounding the station are mixed between riders destined for the surrounding residential neighborhoods and riders boarding from commercial areas. Overcrowding on sidewalks or at crosswalks is not expected as a result of activity in the station area. Pedestrian LOS results are shown in tables in Appendix D of this Transportation Technical Report (Appendix H1 of this Final EIS).
At Mercer Island Station, the PM peak-period pedestrian activity would be split evenly between people boarding and aligning light rail, indicating there would be people destined to the surrounding residential areas and people boarding from the commercial land uses at Mercer Island Town Center. Close to 30 percent of the total person-trips at the station would be people walking or biking to or from the surrounding residential and commercial land uses. Table 7-7 provides the forecasted pedestrian and bicycle trips at Mercer Island Station.
7.3.1.2 Bicycle Circulation There is no expected change in bicycle circulation in Segment A with the East Link Project, although an increased number of bicycle commuters transferring to and from light rail can be expected because both the Rainier and Mercer Island stations are conveniently located close to the I-90 Multiuse Regional Trail. Wayfinding signage to and from the trail is recommended for both stations. Table 7-6 provides a preliminary estimate of the bicycle storage facilities (bicycle racks and lockers) at the Rainier and Mercer Island stations.
With East Link, an access location to the I-90 Trail at the 23rd Avenue South entrance to the Rainier Station would be created, increasing the transferability between transit and nonmotorized modes at this location and likely resulting in increased recreational or commuter bicycle activity surrounding the station. The addition of planned bicycle capital improvements on local and collector streets, as shown in Exhibit 7-7 and indicated in Table 7-6, would enhance the circulation near the station by providing greater connectivity between streets.

7.0 Nonmotorized Facilities
East Link Project Final EIS 7-21 7.0 Nonmotorized Facilities July 2011
TABLE 7-6 Nonmotorized Characteristics and Facilities Adjacent to Station Areas in Segment A
Station/Alternative Station Type
Bicycle Facility Capacitiesa
Adjacent Roadway Speed Limits b Walkability Barriers Crosswalks
Average Block
Length(feet)
Sidewalkc
(percent) Bicycle Facilitiesd
(percent) Major Existing Land
Usese Racks Lockers Existing Future Existing Future
Rainier Station
Preferred Alternative A1 At-grade 56 4
Rainier Avenue South: 35 mph
23rd Avenue South: 30 mph
Long distance between crosswalks; high traffic volumes
Present 325 80 80 30 95
Multifamily: 47% Single-family: 20% Commercial 12% Park 12% Industrial/Commercial: 5%
Mercer Island Station
Preferred Alternative A1 At-grade 56 4 North Mercer Way: 30 mph
Within the I-90 freeway
Present 425 70 75 85 85
Single-family: 42% Park: 19% Town Center: 16% Public Institution: 12% Multifamily: 8%
Notes: Existing and future sidewalks were analyzed on arterial streets within 0.5-mile walking distance of station locations; existing and future bicycle and trail facilities were analyzed on arterial streets within 1 mile of station locations.
a The rack and locker values represent the available capacity at each station; this does not indicate the number of facilities provided by year of opening. At the current level of design, it is expected that approximately 50 to 65 percent of the available capacity would be provided within the project’s timeframe. b Speed limit of road(s) adjacent to light rail station. c Percent of sidewalk coverage within 0.5 mile of light rail station. d Percent of bicycle facility coverage within 1 mile of light rail station. e Existing major land uses within 0.5 mile of light rail station. Percentages might not sum to 100 percent because of minor land uses and/or rounding.

7.0 Nonmotorized Facilities
7.0 Nonmotorized Facilities 7-22 East Link Project Final EIS July 2011
TABLE 7-7 PM Peak-Period (3-hour) Walk and Bicycle Trips Generated by Segment A Stations
Stationa (Associated Alternatives)
2020 2030
Boarding Alightingb Total Boarding Alightingb Total
Rainier Station (Preferred Alternative A1) 250 350 600 330 340 660
Mercer Island Station (Preferred Alternative A1) 190 170 360 240 250 490
Note: Because of rounding, in and out walk and bicycle trips might not sum exactly to total walk and bicycle trips. aPerson-trips for alternative with highest ridership. b Alighting is defined as people exiting the light rail vehicle.
On Mercer Island, locally designated bicycle routes are present on N Mercer Way, 77th Avenue SE, and 80th Avenue SE. Bicycle circulation surrounding the Mercer Island Station would be similar to existing and no build conditions.
7.3.2 Segment B In Segment B, Preferred 112th SE Modified Alternative (B2M), 112th SE At-Grade (Alternative B2A), 112th SE Elevated (Alternative B2E), 112th SE Bypass (Alternative B3), and B3 - 114th Extension Design Option (B3 – 114th Design Option) would serve the elevated South Bellevue Station. The at-grade South Bellevue Station would be served by the Bellevue Way Alternative (B1]). Preferred Alternative B2M (with connections to Preferred Alternative C9T), the 112th SE At-Grade Alternative (B2A), and the 112th SE Elevated Alternative (B2E) would serve the SE 8th Street Station. The BNSF Alternative (B7) would serve the 118th Avenue Station.
7.3.2.1 Pedestrian Circulation Future Pedestrian LOS in Segment B would be at an acceptable pedestrian LOS under all Segment B alternatives, as listed in Appendix D of this Transportation Technical Report (Appendix H1 of this Final EIS).
Preferred 112th SE Modified Alternative (B2M) With Preferred Alternative 112th SE Modified (B2M), about 95 percent of the transit riders at the South Bellevue Station would consist of people making transfers among different motorized modes (automobile or bus); therefore, most of the pedestrian activity at the South Bellevue Station would occur within the station and park-and-ride lot areas. This is indicated in Table 7-8 with a relatively low number of pedestrian and bicycle activity generated at the South Bellevue Station.
Much of the land use surrounding the station is a combination of residential and recreational uses as identified in Table 7-9). Generally, the pedestrian circulation between the South Bellevue Station and the surrounding
TABLE 7-8 PM Peak-Period (3-hour) Walk and Bicycle Trips Generated by Segment B Stations
Station (Associated Alternatives)
2020 2030
Boarding Alightingb Total Boarding Alightingb Total
South Bellevue (Preferred Alternative B2M and Alternatives B1, B2A, B2E, B3, and B3 – 114th Extension Design Option) a 20 80 90 20 100 130
SE 8th ( Preferred Alternative B2M connecting to Preferred Alternative C9T and Alternatives B2A and B2E)a 190 60 240 220 80 290
118th (Alternative B7)a 220 60 280 320 100 420
Note: Because of rounding, in and out walk and bicycle trips might not sum exactly to total walk and bicycle trips. a Person-trips for alternative with highest ridership. b Alighting is defined as people exiting the light rail vehicle.

7.0 Nonmotorized Facilities
East Link Project Final EIS 7-23 7.0 Nonmotorized Facilities July 2011
neighborhoods would continue to be disconnected because of the uphill terrain west of the station and the limited connections with the Enatai neighborhood, although there are a few connections between the southern Enatai neighborhood and the park-and-ride lot. Pedestrian circulation and safety surrounding the South Bellevue Station would improve compared with existing conditions with City of Bellevue’s planned sidewalk improvements on 108th and 113th Avenues SE. In addition, the East Link project would not preclude future improvements planned along Bellevue Way SE.
With Preferred Alternative B2M (connecting to either Preferred Alternative C9T or Preferred Alternative C11A connection) a pedestrian and bicycle access to Lincoln Plaza on the east side of 112th Avenue SE would be closed. Alternative access would be available within 300 feet of the existing driveway on SE 6th Street. An option with Preferred Alternative B2M connecting to Preferred Alternative C9T would close the east approach at SE 15th Street to Bellefield Office Park. This closure would recirculate pedestrians entering or exiting the office park to the intersection of 114th Avenue SE and SE 8th Street.
Most (about 75 percent) of the estimated PM peak-period person-trips indicated in Table 7-8 at SE 8th Station, with Preferred Alternative B2M connecting to Preferred Alternative C9T, would consist of pedestrians accessing the station and headed from the surrounding office parks or the South Bellevue neighborhoods. Similar to the other stations in South Bellevue, the SE 8th Street Station presents longer walking distances because the average block length surrounding this station is longer than other segments, as shown in Table 7-9. Pedestrian circulation and safety surrounding SE 8th Street Station would improve compared with existing conditions, with planned City of Bellevue sidewalk improvements on SE 8th Street. Access to the at-grade SE 8th Street Station under Preferred Alternative B2M connecting to Preferred Alternative C9T would be improved with a new crosswalk on the north leg of SE 8th Street.
Overcrowding on sidewalks near the South Bellevue and SE 8th Street stations is not expected to occur with the Preferred Alternative B2M. Crosswalks would be maintained at signalized intersections; therefore, new mid-block pedestrian crossings would not be needed within Segment B. Pedestrian LOS results are presented in tables in Appendix D of this Transportation Technical Report (Appendix H1 of this Final EIS). Road widening at intersections related to the at-grade median profile of the Preferred Alternative B2M connecting to Preferred Alternative C11A would cause increases in walking distances and wait times at crosswalks along 112th Avenue SE.
Other Segment B Alternatives For Alternatives B2A, B2E, B3, and B3 – 114th Design Option, pedestrian access and circulation at the South Bellevue Station would be similar to conditions under Preferred Alternative B2M. The at-grade South Bellevue Station in Alternative B1 would require an increase in crossing times for pedestrian to walk safely across Bellevue Way at South Bellevue Station (and throughout the segment).
With Alternative B7, pedestrian crossings would not be affected because most of this alternative is outside the roadway right-of-way. At 118th Station, approximately 80 percent of the estimated future PM peak-period person-trips would be riders transferring between East Link other motorized modes. The proximity of I-405 and lack of residential land use immediately surrounding the station do not encourage walk routes. Therefore, substantial pedestrian activity beyond the immediate station area is not expected, except to the commercial land uses along SE 8th Street. Pedestrian circulation and safety surrounding 118th Station would improve compared with existing conditions, because of planned City of Bellevue sidewalk improvements on 114th and 118th Avenues SE at locations immediately surrounding the station.
The existing crosswalk locations would not change with any of the Segment B alternatives, except with the new crosswalk on the north leg of 112th Avenue SE and SE 8th Street to improve pedestrian mobility with the SE 8th Station. Overall, crosswalks are adjacent to the South Bellevue and SE 8th Street stations but are not adjacent to the 118th Station, limiting pedestrian mobility.
The missing sidewalk segment on SE 25th Street in the Enatai neighborhood is part of a school walk route to Enatai Elementary School. The East Link project is not expected to affect this school walk route because it would be located west of the project, and the volume of riders walking to and from this station is not expected to be substantial enough to impact the school walk route.

7.0 Nonmotorized Facilities
7.0 Nonmotorized Facilities 7-24 East Link Project Final EIS July 2011
TABLE 7-9 Nonmotorized Characteristics and Facilities Adjacent to Station Areas – Segment B
Station/Alternative Station Type
Bicycle Facility Capacitiesa Adjacent
Roadway Speed Limits b Walkability Barriers Crosswalks
Average Block
Length (feet)
Sidewalkc
(percent) Bicycle Facilitiesd
(percent) Major Existing
Land Usese Racks Lockers Existing Future Existing Future
South Bellevue Station
Preferred Alternative B2M and Alternatives B2A, B2E, B3, B3 - 114th Design Option
Elevated 180 20
Bellevue Way: 40 mph
Topography with Enatai neighborhood
Present 805 60 85 40 65
Single-family: 50% Park: 43% Multifamily: 6% Office: 1% Alternative B1 At-grade
SE 8th Station
Preferred Alternative B2M connecting with Preferred Alternative C9T and Alternative B2A
At-grade
56 4
112th Avenue SE: 35 mph
SE 8th Street: 35 mph
Limited Surrey Downs connections
Present 800 60 90 20 70
Single family: 40% Office: 40% Multifamily: 7% Park: 6% Light Industrial: 5%
Alternative B2E Elevated
118th Station
Alternative B7 Elevated 56 4
118th Avenue SE: 30 mph
SE 8th Street: 35 mph
Proximity to I-405 None
present near station
910 45 80 25 65
Single-family: 33% Office: 31% Park: 15% Multifamily: 11% Light Industrial: 7%
Notes: Existing and future sidewalks were analyzed on arterial streets within 0.5 mile walking distance of station locations; existing and future bicycle and trail facilities were analyzed on arterial streets within 1 mile of station locations.
a The rack and locker values represent the available capacity at each station; this does not indicate the number of facilities provided by year of opening. At the current level of design, it is expected that approximately 50 to 65 percent of the available capacity would be provided within the project’s timeframe. b Speed limit of road(s) adjacent to light rail station. c Percent of sidewalk coverage within 0.5 mile of light rail station. d Percent of bicycle facility coverage within 1 mile of light rail station. e Existing major land uses within 0.5 mile of light rail station. Percentages might not sum to 100 percent because of minor land uses and/or rounding.

7.0 Nonmotorized Facilities
East Link Project Final EIS 7-25 7.0 Nonmotorized Facilities July 2011
7.3.2.2 Bicycle Circulation Bicycle circulation within Segment B is likely to improve in the no-build condition compared with existing conditions, with planned improvements along 108th Avenue SE, Bellevue Way SE, 112th Avenue SE, SE 8th Street, 114th Avenue SE, and the former BNSF Railway. The City of Bellevue 2009 Pedestrian and Bicycle Transportation Plan Report identifies future connections between the I-90 Trail and other existing regional and local trails that might increase the number of trail users (City of Bellevue, 2009). The proposed BNSF Railway Trail, a major multiuse trail, would follow the former BNSF Railway corridor located along the easternmost boundary of Segment B, proceed through Segments C and D, and terminate in Segment E where it would connect with the East Lake Sammamish Trail. Sound Transit is currently coordinating with the Port of Seattle and King County to cooperatively plan the future trail, possibly including passenger rail and light rail in the same right-of-way while maintaining the ability to provide future freight use.
In general, bicycle circulation with the project would remain similar to the no-build conditions. Bicycle storage and wayfinding at Segment B stations would be provided. Table 7-9 provides a preliminary estimate of the bicycle storage facilities at the stations.
Preferred 112th SE Modified Alternative (B2M) With Preferred Alternative B2M, the South Bellevue station would be located near the Mercer Slough, where bicyclists could connect to the I-90 Trail and the 118th Avenue SE Regional Multiuse Trail. As a result, an increase in bicycle activity on these trails would likely occur. Impacts on trails in Segment B would include acquiring right-of-way along 112th Avenue SE for Preferred Alternative B2M. This alternative would require using a narrow portion of the Mercer Slough Park’s western boundary, requiring a portion of the Heritage Trail that is within Mercer Slough to be relocated. Impacts on the I-90 Trail at the I-405 interchange are not expected with Preferred Alternative B2M.
A pedestrian and bicycle access to Lincoln Plaza on the east side of 112th Avenue SE would be closed with Preferred Alternative B2M. Alternative access would be available within 300 feet on SE 6th Street. An option with the Preferred Alternative B2M connecting to Preferred Alternative C9T would close the east approach at SE 15th Street to the Bellefield Office Park. This closure would recirculate bicyclists entering or exiting the Bellefield Office Park to the intersection of 114th Avenue SE and SE 8th Street. This would affect bicycle mobility between the Bellefield office park and areas to the south.
Other Segment B Alternatives Similarly to Preferred Alternative B2M, impacts to trails along Bellevue Way and near the South Bellevue Station would occur under Alternatives B1, B2A, B2E, B3, and B3 – 114th Design Option. Alternatives B2A and B2E would close the pedestrian and bicycle access to the Lincoln Plaza on the east side of 112th Avenue SE, similarly to Preferred Alternative B2M. Under Alternative B7, existing bicycle access to the east side of Mercer Slough along 118th Ave SE would be maintained and would connect to the Mercer Slough trails and I-90 Regional Trail.
7.3.3 Segment C The East Link project would serve Downtown Bellevue; one of the major business and employment centers in the Puget Sound region. Compared to the other segments of the East Link Project, pedestrian activity is much higher in Downtown Bellevue. Within downtown, major employers and surrounding retail and commercial businesses, as well as existing and planned residential areas, will continue to create dense pedestrian circulation activity in the future. To provide adequate sidewalk circulation, future development projects or planned city capital improvements are expected to fill in the identified missing sidewalk segments within the downtown area, although nearly all the streets in Downtown Bellevue already provide continuous sidewalks on both sides of the street. Table 7-10 provides the year 2020 and 2030 pedestrian and bicycle activity for each of the Segment C stations.

7.0 Nonmotorized Facilities
7.0 Nonmotorized Facilities 7-26 East Link Project Final EIS July 2011
TABLE 7-10 PM Peak-Period (3-hour) Walk and Bicycle Trips Generated by Segment C Stations
Station (Associated Alternatives)
2020 2030
Boarding Alightingb Total Boarding Alightingb Total
108th (Preferred Alternative C11A) 570 400 970 770 440 1,210
East Main (Preferred Alternatives C11A and C9T and Alternatives C2T, C3T, C4A, C7E, C8E, and C9A) a
600 380 970 960 490 1,450
Old Bellevue (Alternative C1T) 530 360 890 780 420 1,200
Bellevue Transit Center (Preferred Alternatives C11A and C9T and Alternatives C1T, C2T, C3T, C4A, C7E, C8E, C9A, and C14E)a
2,300 850 3,150 2,890 880 3,770
Ashwood/Hospital (Alternatives C3T, C4A, C7E, and C8E) a 440 140 580 440 140 580
Hospital (Preferred Alternatives C11A and C9T and Alternatives C1T, C2T, C9A, and C14E) a
250 120 380 670 240 910
Note: Because of rounding, in and out walk and bicycle trips might not sum exactly to total walk and bicycle trips. a Person-trips for alternative with highest ridership. b Alighting is defined as people exiting the light rail vehicle.
A pedestrian walkway located on NE 6th Street between 108th Avenue NE and Bellevue Way is a major east-west pedestrian walkway that provides connectivity among popular pedestrian generators, which include major retail and civic centers, Bellevue Square Mall, Lincoln Square, Bellevue Transit Center, Meydenbauer Convention Center, and Bellevue City Hall. Sidewalks and pedestrian crossings within Downtown Bellevue would not operate below LOS C with any of the project alternatives, indicating that impacts on pedestrian flow or circulation are not anticipated. In general, pedestrian circulation conditions under any Segment C alternative would not differ substantially except for the changes described in the following subsections. Street widening would generally be minimal because of right-of-way constraints, therefore pedestrian crossing distance are generally similar to the no-build condition. All the Segment C alternatives would have a Bellevue Transit Center Station and either a Hospital or an Ashwood/Hospital Station, depending on where the alignment crosses I-405. Many of the alternatives would also include a station in the south downtown area, Old Bellevue, East Main Station or 108th Station depending on their Segment B connection.
As shown in Exhibit 7-13, among the proposed stations in Segment C, the light rail stations located closer to the existing Bellevue Transit Center would be expected to attract more riders because they would better serve Downtown Bellevue as a result of their proximity to denser employment and residential areas. The farther east that the stations are located from Downtown Bellevue, the less pedestrian activity would be expected. Because the Ashwood/Hospital Station would be within walking distance from both Overlake Hospital and Downtown Bellevue, it would have more pedestrian activity in connection with downtown than the Hospital Station, but the Hospital Station would have the potential for higher pedestrian activity in conjunction with the planned redevelopment of the Wilburton area. These trends are discussed in Section 4.3 Light Rail Ridership.
7.3.3.1 Pedestrian Circulation Preferred 108th NE At-Grade Alternative (C11A) Preferred Alternative C11A would not impact pedestrian facilities. The midblock crossing on 108th Avenue NE between NE 2nd and 4th Streets would be maintained and signalized to provide a safe crossing. At the 112th Avenue SE, and SE 6th Street intersection, pedestrians and bicyclists would cross the at-grade light rail tracks on the west side of 112th Avenue SE. Similarly, pedestrians would cross the at-grade light rail tracks on the southeast corner of Main Street and 108th Avenue. Features such as fencing, signing, pavement markings, warning bells and traffic signals would be provided at these locations for pedestrian safety.

"""
"
"
"
"
""
"
"
""Lake
Washington
LakeBellevue
D2AD2ED5
§̈405
SegmentCSegmentD
130thStation
Ashwood/HospitalStation
HospitalStationBellevue
TransitCenterStation
OldBellevueStation
EastMainStation
108thStation
120thStation
Segment CSegment B
WilburtonPark & Ride
Grace LutheranChurchPark & Ride
SURREYDOWNS
DOWNTOWNPARK
MCCORMICKPARK
ASHWOODPARK
CL
YD
E H
ILL
BellevueTransitCenter
¾À520
B E L L E V U E
West Tributary of Kelsey Creek
Goff Creek
Kelsey C
reek
120TH AVE NE
130TH AVE NE
132ND AVE NE
120TH AVE NE
140TH AVE NENE 20TH ST
124TH AVE NE
NE 8TH ST
BEL-RED RD
NE 4TH ST
NE 16TH ST
NE 24TH ST
116TH AVE NE
114TH AVE NE
112TH AVE SE112TH AVE NE
SE 6TH ST
MAIN ST
108TH AVE NE
BELLEVUE WAY NE
NE 8TH ST
NE 4TH ST
NE 2ND ST
100TH AVE NE
NE 10TH ST
NE 12TH ST
BELLEVUE WAY SE
108TH AVE SE
116TH AVE SE
HIGHLAND PARK &
COMMUNITY CENTER
BNSF Railway
0 0.25 Mile
§
Pedestrian Walking AreaSegment C (0.35 mile)Pedestrian Walking AreaSegment D (0.35 mile)
" Traction Power SubstationProposed Station
ÂΡ New and/or Expanded Park-and-Ride Lot
Source: Data from City of Bellevue (2005), City of Redmond (2005), and King County (2006).
Exhibit 7-13 Pedestrian Walking Areasby Stations in Downtown Bellevueand Bel-Red AreaSegments C and DEast Link ProjectNOTE: To account for a street grid system, a radius of
0.35 mile was used in place of a radius of 0.50 mile.
Preferred AlternativeAt-Grade RouteElevated Route
! ! ! ! Retained-Cut Route! ! ! ! Retained-Fill Route
Tunnel RouteOther Alternatives
At-Grade RouteElevated Route
! ! ! ! Retained-Cut or Retained-Fill RouteTunnel Route

7.0 Nonmotorized Facilities
7.0 Nonmotorized Facilities 7-28 East Link Project Final EIS July 2011
Although this alternative is an at-grade profile, street widening would be minimal because of right-of-way constraints; therefore, relatively small changes to the pedestrian crossing times are proposed. However, some increase in crosswalk distances would occur at Main Street and 108th Avenue NE and along NE 6th Street to accommodate the light rail track. The 108th Station location with Preferred Alternative C11A would not affect pedestrian facilities because it is located off-street, south of Main Street. This station’s location would be convenient to a higher percentage of the Downtown Bellevue residents and employment centers compared with the East Main Station location and have fewer barriers as shown in Table 7-11.
The Bellevue Transit Center Station area would have the highest estimated PM peak-period pedestrian trips compared with other East Link stations; as close to 3,800 pedestrians and bicyclists would use the Bellevue Transit Center Station in year 2030. This would be about 60 percent of the total PM peak-period person-trips estimated at this station. Most pedestrian activity at this station would be people boarding light rail in the PM peak period, walking from the surrounding office and commercial land uses. This degree of activity would be consistent with an urban downtown environment that is expected to become denser and continue to grow in the future.
Major pedestrian crossings and sidewalks near the Bellevue Transit Center Station area for Preferred Alternative C11A would provide sufficient pedestrian space, although sidewalks and intersections connecting to entrances to Bellevue Transit Center Station on 108th and 110th Avenues NE would experience some pedestrian crowding during peak periods. As shown in Appendix F of this Transportation Technical Report, the sidewalks in the no-build condition near the Bellevue Transit Center would degrade to LOS C but would continue to operate well as pedestrian activity is expected to continue moving freely. In the build condition, the pedestrian LOS near the Bellevue Transit Center would continue to operate no worse than LOS C. Any crowding would generally be contained within the station near the platforms. The location of the Bellevue Transit Center Station with Preferred Alternative C11A would be the most convenient for transit connections and would serve the majority of Downtown Bellevue residents and employment centers.
Preferred Alternative C11A also would serve the Hospital Station located north of NE 8th Street, east of 116th Avenue NE. The location of the Hospital Station is near the Overlake Hospital area and other retail and commercial land uses (Table 7-11). It is estimated pedestrian and bicycle trips comprise about 60 percent of the future PM peak-period person-trips and primarily include people leaving Overlake Hospital and the surrounding office, retail, and commercial areas and boarding light rail. This station’s location would also serve the Wilburton neighborhood, where future nonmotorized improvements are planned by others near the station to improve the connectivity for pedestrians and bicyclists navigating along NE 8th Street (sidewalk improvements) and along the former BNSF corridor (BNSF Railway regional multiuse trail) which would create a direct nonmotorized connection between the Hospital Station and the Bel-Red area.
With the connections to Alternatives B3, B7, or B3 – 114th Design Option, Preferred Alternative C11A would serve the East Main Station. It is estimated that pedestrian trips would comprise close to 70 percent of the future PM peak-period person trips, with most of them boarding light rail. These pedestrians are expected to originate from the adjacent residential and commercial areas. Topography constraints to the west into central downtown Bellevue might limit the pedestrian activity.
Preferred 110th NE Tunnel Alternative (C9T) Because Preferred Alternative C9T profiles would be mostly elevated and tunnel north of Main Street, there would be minimal impacts on pedestrian circulation. Impacts on crosswalks are not expected with Preferred Alternative C9T, except along NE 6th Street, which would be widened to accommodate the tunnel portal and, therefore, would require slightly longer distances for pedestrians to cross. At the at-grade light rail crossing at the SE 6th Street and 112th Avenue SE intersection, pedestrians and bicyclists would cross over the tracks on both sides of 112th Avenue SE. Features such as fencing, signing, pavement markings, warning bells and traffic signals would be provided for pedestrian safety.

7.0 Nonmotorized Facilities
East Link Project Final EIS 7-29 7.0 Nonmotorized Facilities July 2011
TABLE 7-11 Nonmotorized Characteristics and Facilities Adjacent to Station Areas – Segment C
Station/ Alternative
Station Type
Bicycle Facility Capacitiesa
Adjacent Roadway Speed Limitsb
Walkability Barriers Crosswalks
Average Block
Length (feet)
Sidewalkc (percent)
Bicycle Facilitiesd
(percent) Major Existing
Land Usese Racks Lockers Existing Future Existing Future
East Main Station (connecting from Alternatives B3 and B7)
Preferred Alternative C9T and Alternatives C4A, C7E, C8E, and C9A
Elevated 56 4
114th Avenue NE: 30 mph
Topography to central Downtown Bellevue, adjacent to I-405
Present 655 60 85 10 65
Office: 46% Commercial: 20% Single family: 20% Multifamily: 7% Park: 6% Alternatives C2T and C3T Retained cut
108th Station
Preferred Alternative C11A At-grade 56 4 Main Street: 30 mph No major barriers Present 685 75 90 10 70
Office: 41% Commercial: 24% Single-family: 20% Multifamily: 8% Park: 5%
Old Bellevue Station
Alternative C1T Tunnel 56 4 Bellevue Way: 35 mph No major barriers Present 685 75 90 10 70
Commercial: 28% Single-family: 24% Multifamily: 20% Office: 18% Park: 6%
Bellevue Transit Center Station
Preferred Alternative C11A At-grade
88f 14 f
NE 6th Street: 30 mph No major barriers Present 640 75 90 10 70
Office: 49% Commercial: 33% Multifamily: 6% Single-family: 5%
Preferred Alternative C9T Tunnel 110th Avenue NE: 30 mph
No major barriers Present 650 70 90 10 70
Office: 44% Commercial: 34% Single-family: 9% Multifamily: 7%
Alternatives C1T, C2T, and C3T Tunnel NE 6th Street: 30 mph No major barriers Present 615 80 95 10 70
Office: 39% Commercial: 38% Multifamily: 10% Single-family: 6%
Alternative C4A At-grade NE 6th Street: 30 mph108th Avenue NE: 30 mph
No major barriers Present 690 75 90 10 70
Office: 42% Commercial: 36% Single-family: 8% Multifamily: 7%

7.0 Nonmotorized Facilities
7.0 Nonmotorized Facilities 7-30 East Link Project Final EIS July 2011
TABLE 7-11 Nonmotorized Characteristics and Facilities Adjacent to Station Areas – Segment C
Station/Alternative Station Type
Bicycle Facility Capacitiesa
Adjacent Roadway Speed Limitsb
Walkability Barriers Crosswalks
Average Block
Length (feet)
Sidewalkc (percent)
Bicycle Facilitiesd
(percent) Major Existing
Land Usese Racks Lockers Existing Future Existing Future
Bellevue Transit Center Station contd.
Alternative C7E Elevated
88f 14 f
112th Avenue NE: 30 mph
Topography to central Downtown Bellevue
Present 710 70 9 10 70
Office: 48% Commercial: 34% Multifamily: 6% Single-family: 6%
Alternative C8E Elevated 110th Avenue NE: 30 mph
No major barriers Present 645 75 90 10 70
Office: 43% Commercial: 35% Single-family: 8% Multifamily: 7%
Alternative C9A At-grade and
elevated
NE 6th Street/110th Avenue NE/112th Avenue NE: 30 mph
No major barriers Present 640 70 90 10 70
Office: 44% Commercial: 38% Multifamily: 5% Single-family: 5%
Alternative C14E Elevated 114th Avenue NE: 30 mph
Adjacent to I-405 Present 735 70 90 10 70
Office: 49% Commercial: 33% Multifamily: 6% Single-family: 5%
Ashwood/Hospital Station
Alternatives C3T, C4A, C7E, and C8E
At-grade 72 8 NE 12th Street: 30 mph
Adjacent to I-405 Present 775 60 90 10 70
Office: 38% Commercial: 27% Light Industrial: 10% Multifamily: 10% Single-family: 8%
Hospital Station
Preferred Alternatives C11A and C9T and Alternatives C1T, C2T, C9A, and C14E
Elevated 72 8 116th Avenue NE: 35 mph NE 8th Street: 35 mph
No connections south of NE 8th Street
None present near
station 780 65 90 10 65
Office: 40% Commercial: 25% Light Industrial: 13% Multifamily: 10% Single-family: 5%
Notes: Existing and future sidewalks were analyzed on arterial streets within 0.5 mile walking distance of station locations; existing and future bicycle and trail facilities were analyzed on arterial streets within 1 mile of station locations. a The rack and locker values represent the available capacity at each station; this does not indicate the number of facilities provided by year of opening. At the current level of design, it is expected that approximately 50 to 65 percent of the available capacity would be provided within the project’s timeframe. b Speed limit of road(s) adjacent to light rail station. c Percent of sidewalk coverage within 0.5 mile of light rail station. d Percent of bicycle facility coverage within 1 mile of light rail station. e Existing major land uses within 0.5 mile of light rail station. Percentages might not sum to 100 percent because of minor land uses and/or rounding. f At the Bellevue Transit Center Station, 18 bicycle parking spaces would be designed for either bike racks or lockers. These 18 spaces are not included in the total in this table.

7.0 Nonmotorized Facilities
East Link Project Final EIS 7-31 7.0 Nonmotorized Facilities July 2011
Major pedestrian crossings and sidewalk near the Bellevue Transit Center Station area for Preferred Alternative C9T provide sufficient pedestrian space, although sidewalks and intersections connecting to entrances to Bellevue Transit Center Station along 110th Avenue NE would experience some pedestrian crowding during peak periods. Pedestrian access between the Bellevue Transit Center Station and the Bellevue Transit Center would be through the northern station entrance on the north side of NE 4th Street, with a crossing at NE 6th Street and 110th Avenue NE to access the Bellevue Transit Center bus platform. A design option to provide an additional northern entrance of the Bellevue Transit Center Station to the west side of 110th Avenue NE would provide a more direct bus transfer connection between the Bellevue Transit Center Station and the Bellevue Transit Center bus platforms.
Preferred Alternative C9T would also serve the Hospital Station. Pedestrian activity in and around this station would be similar to that of Preferred Alternative C11A. With the connections to Alternatives B3, B7, or B3 – 114th Design Option, Preferred Alternative C9T would serve the East Main Station and the nonmotorized activity would be similar to Preferred Alternative C11A. Nonmotorized activity for the East Main Station design option under Preferred Alternative C9T would be similar to a connection with Alternative B3, B3 - 114th Extension Design Option, or B7 that have an East Main Station.
Other Segment C Alternatives The Bellevue Way Tunnel Alternative (C1T) is the only alternative that would include the underground Old Bellevue Station. It is estimated that pedestrian trips would comprise approximately 85 percent of future PM peak-period person trips. Much of the pedestrian activity at the Old Bellevue Station would be well served with sidewalks and pedestrian-oriented shopping in the historic Downtown Bellevue area of Main Street. The location of this station is also expected to capture a portion of pedestrian activity on the fringe of Downtown Bellevue that would otherwise require farther walking distance to the Bellevue Transit Center.
The 106th NE Tunnel (C2T), 108th NE Tunnel (C3T), Couplet (C4A), 112th NE Elevated (C7E), 110th NE Elevated (C8E), 110th NE At-Grade (C9A) Alternatives would serve the elevated East Main Station when they connect to the 112th SE Bypass (B3), 114th SE design option (B3 – 114th Design Option), and BNSF (B7) Alternatives. Pedestrian activity at this station would be similar to that of Preferred Alternative C9T (with connections to Alternatives B3, B3– 114th Design Option, or B7). Alternative C14E would not serve an East Main Station.
Pedestrian circulation at the Bellevue Transit Center Station for Alternatives C1T, C2T, and C3T would be similar to that of Preferred Alternative C9T, although Alternatives C1T and C2T would have a more direct connection to the Bellevue Transit Center. At-grade Alternatives C4A and C9A would have slightly different pedestrian circulation and access at the Bellevue Transit Center Station than Preferred Alternative C11A. While both of these alternatives are within one block of the Bellevue Transit Center, the station is not directly integrated with the Bellevue Transit Center; therefore, connections with other transit services are not as convenient as with Preferred Alternative C11A. Additionally, Alternative C4A includes two stations: one on 108th Avenue NE and one on 110th Avenue NE as track is only provided in one direction along each of these two streets. Pedestrian access between the Bellevue Transit Center Station and the Bellevue Transit Center for Alternative C9A would be through the western station entrance located at NE 6th Street and 110th Avenue NE, with one crossing during the pedestrian-only phase at NE 6th Street and 110th Avenue NE to connect the station with the bus platforms at the Bellevue Transit Center. With any of these alternatives, major pedestrian crossings and sidewalks near the Bellevue Transit Center Station would experience some pedestrian crowding during peak periods. Alternative C8E would have similar pedestrian circulation at Bellevue Transit Center Station under Preferred Alternative C9T. Even though it is an elevated station and Alternative C9T is a tunnel station, both would have similar pedestrian effects.
Alternatives C7E and C14E are both elevated profiles outside the downtown core; therefore, minimal impacts on the pedestrian circulation and connectivity in Downtown Bellevue are expected. To provide a connection between Bellevue Transit Center and the Bellevue Transit Center Station (along 112th Avenue NE [C7E] or 114th Avenue NE [C14E]), an elevated and covered moving walkway would be constructed as part of these two alternatives. With the Bellevue Transit Center station location further east than other Segment C alternatives, the pedestrian connections would not be as convenient and the distances to many locations in Downtown Bellevue would be greater with these two alternatives. This would require additional time for pedestrians and bicyclists to reach their destination.
It is estimated that pedestrian and bicycle trips would comprise about 80 percent of the future PM peak-period person-trips at the Ashwood/Hospital Station. These trips would be primarily people leaving Overlake Hospital

7.0 Nonmotorized Facilities
7.0 Nonmotorized Facilities 7-32 East Link Project Final EIS July 2011
and the surrounding office and commercial areas. Pedestrian access to this station would be provided on both sides of I-405. The Hospital Station would have a similar amount of pedestrian activity as the Ashwood/Hospital Station because they both capture the land uses along 116th Avenue NE. Alternatives C3T, C4A, C7E, and C8E would serve the Ashwood/Hospital Station, while alternatives C1T, C2T, C9A, and C14E would serve the Hospital Station. Pedestrian activity at the Hospital Station would be similar to that of Preferred Alternative C11A and Preferred Alternative C9T.
Similarly to Preferred Alternative C11A, portions of Alternatives C4A, C8E, and C9A would be within the roadway right-of-way in Downtown Bellevue. Even so, these alternatives would generally not increase the pedestrian crossing distances at intersections because roadway widening is constrained by the available right-of-way. Crosswalk locations along 108th and 110th Avenues NE with the Couplet Alternative (C4A) would remain but would require signal-phasing adjustments. Similar to Preferred Alternative C9T, crosswalk impacts are not expected with the tunnel alternatives (C1T, C2T, and C3T) because these alternatives would be mainly underground in Downtown Bellevue. Alternatives C1T, C2T, and C9A would become elevated on NE 6th Street, east of 110th Avenue NE; and similar to Preferred Alternatives C11A and C9T, some roadway widening is proposed. This would lengthen the pedestrian crossing distances on this street. Alternatives C7E and C14E would not impact pedestrian crossings because most of these alternatives would be elevated outside the roadway right-of-way. The school walk route along 108th Avenue SE is not expected to be affected by any of the Segment C alternatives because it is located south of Main Street.
7.3.3.2 Bicycle Circulation With East Link, bicycle circulation through Downtown Bellevue would remain similar to the existing and no-build conditions. Currently, most arterial streets in the downtown area are designated bicycle routes. The City of Bellevue plans to provide bicycle improvements along 112th Avenue NE, north of NE 6th Street, and on 108th Avenue NE in Downtown Bellevue. Table 7-11 provides a preliminary estimate of the bicycle storage facilities at the stations. The Bellevue Transit Center would provide the most bicycle storage facilities of all the stations in Segment C.
Preferred 108th NE At-Grade Alternative (C11A) Preferred Alternative C11A would not likely affect bicycle facilities as a wide vehicle lane in both directions would be provided on 108th Avenue NE to accommodate bicyclists. Additionally, the location of the 108th, Bellevue Transit Center, and Hospital Stations are not expected to affect bicycle facilities. At the at-grade crossings, the light rail tracks would be designed so bicyclists along designated bicycle routes cross the light rail tracks, to the extent possible, at a perpendicular angle for bicyclist safety. With a connection to Alternative B3, B7, or B3 - 114th Design Option, Preferred Alternative C11A would not affect bicycle facilities along 112th Avenue SE.
Preferred 110th NE At-Grade Alternative (C9T) Preferred Alternative C9T mostly comprised of elevated and tunnel profiles north of Main Street and an at-grade profile south of Main Street, thereby resulting in minimal bicycle circulation impacts. The at-grade crossing at SE 6th Street and 112th Avenue SE, would be designed so bicyclists cross the light rail tracks at a perpendicular angle for bicyclist safety. With a connection to Alternatives B3, B7, or B3 - 114th Design Option, Preferred Alternative C9T would not affect bicycle facilities along 112th Avenue SE.
Other Segment C Alternatives The other Segment C alternatives with elevated profiles (Alternatives C7E, C8E, and C14E) and tunnel profiles (Alternatives C1T, C2T, and C3T) would have minimal impacts on downtown bicycle circulation. Crosswalk access for bicyclists would operate under the same pedestrian access conditions previously described. The Couplet Alternative (C4A) would change circulation patterns for bicyclists traveling on 108th and 110th Avenues NE by converting these streets to a one-way vehicle couplet. This could create some recirculation of bicycle activity because cyclists would not have the ability for two-way travel on these streets. The Alternative C4A side-track alignment would create the potential for bicyclists to turn across the light rail tracks. Alternative C9A would not affect planned bicycle facilities, similar to Preferred Alternative C11A. With any of the Segment C alternatives that include a connection to Alternative B3, B7, or B3 - 114th Design Option, similar effects on bicycle facilities along 112th Avenue SE would occur as with the Preferred Alternative C11A.

7.0 Nonmotorized Facilities
East Link Project Final EIS 7-33 7.0 Nonmotorized Facilities July 2011
7.3.4 Segment D Preferred Alternative D2A and the NE 16th Elevated (D2E) and NE 20th (D3) Alternatives would serve 120th Station. Preferred Alternative D2A, Alternative D2E, and Alternative D3 would serve 130th Station. The Overlake Village and Overlake Transit Center stations would be served by all the Segment D alternatives. Table 7-12 provides the year 2020 and 2030 pedestrian and bicycle activity for each of the Segment D stations.
TABLE 7-12 PM Peak-Period (3-hour) Walk and Bicycle Trips Generated by Segment D Stations
Station (Associated Alternatives)
2020 2030
Boarding Alightingb Total Boarding Alightingb Total
120th (Preferred Alternative D2A and Alternatives D2A - NE 24th Design Option, D2E, and D3)a
130 230 360 180 250 430
130th (Preferred Alternative D2A and Alternatives D2E and D3) a 270 60 320 560 170 730
Overlake Village (Preferred Alternative D2A, and Alternatives D2A - NE 24th Design Option, D2E, D3, and D5) a
160 60 220 350 150 500
Overlake Transit Center (Preferred Alternative D2A and Alternatives D2E, D3, and D5) a
440 280 730 640 480 1,120
Note: Because of rounding, in and out walk and bicycle trips might not sum exactly to total walk and bicycle trips. a Person-trips for alternative with highest ridership b Alighting is defined as people exiting the light rail vehicle.
7.3.4.1 Pedestrian Circulation Preferred NE 16th At-Grade Alternative (D2A) In the Bel-Red area, near the 120th and 130th Stations, pedestrian and bicycle facilities planned as part of the transportation and land use projects included in the City of Bellevue’s Bel-Red Subarea Plan (City of Bellevue, 2008a) would support and connect to these stations, as indicated by the substantial increase in sidewalk coverage area shown in Table 7-13. Implementing the Bel-Red Subarea Plan would improve the pedestrian and bicycle connections in this area, as the planned high-density, transit-oriented land uses would be expected to substantially increase the pedestrian and bicycle activity.
With light rail, approximately 75 percent of the PM peak-period person-trips generated at the 120th Station would be walk and bicycle trips. These trips would likely be people coming from the surrounding commercial, retail and offices land uses and boarding light rail. The D2A – 120th Design Option would provide a slightly more convenient pedestrian and bicycle access to the street system because it is at-grade, compared with the Preferred Alternative D2A retained-cut 120th Station.
At the 130th Station, close to 60 percent of the people using the station during the PM peak period would be either pedestrians or bicyclists, with the majority boarding light rail. During the PM peak period, many of the light rail boardings would likely originate from nearby commercial, retail, and office parks planned as part of redevelopment strategy in the Bel-Red Subarea Plan. The 120th and 130th Stations are within moderately close walking distance of each other. This is illustrated in Exhibit 7-13. Pedestrians would access the station that is closest to their walk route. The western edge of the 120th Station walking area is constrained by terrain and presents a barrier to effectively connect potential pedestrians from the west with this station. These factors would likely be the cause of the lower level of pedestrian activity at 120th Station.
At the Overlake Village Station, the future PM peak volumes of pedestrians would primarily consist of riders transferring between light rail and other modes. Many of the pedestrian trips would be coming from the nearby office parks, commercial, and mixed land uses. For improved bicycle and pedestrian connections between the Overlake Village Station (associated with Preferred Alternative D2A) and the commercial properties north of SR 520, the City of Redmond could build a new, nonmotorized, multiuse bridge over SR 520.

7.0 Nonmotorized Facilities
7.0 Nonmotorized Facilities 7-34 East Link Project Final EIS July 2011
TABLE 7-13 Nonmotorized Characteristics and Facilities Adjacent to Station Areas – Segment D
Station/Alternative Station Type
Bicycle Facility Capacitiesa Adjacent
Roadway Speed Limits b Walkability Barriers Crosswalks
Average Block
Length (feet)
Percent Sidewalkc
(percent) Bicycle Facilitiesd
(percent) Major Existing Land
Usese Racks Lockers Existing Future Existing Future
120th Station
Preferred Alternative D2A and D2A – 120th Station Design Option
Retained cut (at-
grade for design option)
54 6 NE 16th Street: 30 mph
Until planned projects, limited areas with continuous sidewalk
Not present until planned NE 15th/16th Street extension
845 45 95 10 65
Light Industrial: 60% Office: 19% Commercial: 9% Multifamily: 6% Medical Institution: 2%
130th Station
Preferred Alternative D2A and Alternatives D2E and D3
At-grade 54 6 NE 16th Street: 30 mph
Until planned projects, limited areas with continuous sidewalk
Not present until planned NE 15th/16th Street extension
880 60 100 15 60
Light Industrial: 48% Single family: 16% Commercial: 14% Office: 10% Multifamily: 7%
Overlake Village Station
Preferred Alternative D2A At-grade
54 6
152nd Avenue NE: 40 mph NE 24th Street: 30 mph
Proximity to SR 520
Present at Overlake Village Park-and-Ride and at 152nd Avenue NE/24th Street NE
695 90 90 20 50 Mixed use: 23% Office: 8% Commercial: 50%
D2A - 24th Design Option and Alternatives D2E and D3
At-grade 665 90 95 20 50 Mixed use: 28% Commercial: 40% Multifamily: 6% Alternative D5 At-grade 675 90 95 20 50
Overlake Transit Center Station
All Segment D alternatives
188 12
NE 40th Street: 35 mph 156th Avenue NE: 35 mph
Proximity to SR 520
Present; new crosswalk on south leg of NE 38th Street and 156th Avenue NE
615 80 85 30 55
Commercial: 80% Multifamily: 8% Light Industrial: 6% Single family: 4%
Notes: Existing and future sidewalks were analyzed on arterial streets within 0.5 mile walking distance of station locations; existing and future bicycle and trail facilities were analyzed on arterial streets within 1 mile of station locations.
a The rack and locker values represent the available capacity at each station; this does not indicate the number of facilities provided by year of opening. At the current level of design, it is expected that approximately 50 to 65 percent of the available capacity would be provided within the project’s timeframe. b Speed limit of road(s) adjacent to light rail station. c Percent of sidewalk coverage within 0.5 mile of light rail station. d Percent of bicycle facility coverage within 1 mile of light rail station. e Existing major land uses within 0.5 mile of light rail station. Percentages might not sum to 100 percent because of minor land uses and/or rounding.

7.0 Nonmotorized Facilities
East Link Project Final EIS 7-35 7.0 Nonmotorized Facilities July 2011
At the Overlake Transit Center Station, about two-thirds of the transit riders would transfer among modes, and the remaining third would be pedestrian and bicyclists. The majority of the pedestrian activity at this station in the PM peak period would consist of commuters coming from large employment centers near the station and boarding light rail. To help facilitate pedestrian movements across 156th Avenue NE, the project would provide another crosswalk at the intersection of NE 38th Street with the Overlake Transit Center Station is provided with the project. For improved bicycle and pedestrian connections between the Overlake Transit Center Station and the properties west of SR 520, a new nonmotorized, multiuse bridge over SR 520 could be constructed by others.
Currently, there are limited sidewalks and crosswalks on NE 16th Street between 132nd Street and 136th Place NE and on 136th Place NE between NE 16th Street and NE 20th Street. Preferred Alternative D2A would provide sidewalks on both streets, and crosswalks would be located at the NE 16th Street and 132nd Avenue NE and at the NE 16th Street and 136th Place NE intersections. Increases in the pedestrian crossing distance at signalized intersections would occur along NE 16th Street and 136th Place NE. Additionally, planned improvements included in the Bel-Red Subarea Plan would provide sidewalks and crosswalks near both 120th and 130th Stations with the 15th Street Roadway Extension Project being designed by the City of Bellevue.
Sidewalks at the intersections nearest to all station entrances for Preferred Alternative D2A would operate at LOS A in the no-build and build conditions, indicating that pedestrian flows to and from the station would occur without crowding (see Appendix F of this Transportation Technical Report). There would be no impacts on any school walk routes with Preferred Alternative D2A.
Other Segment D Alternatives Similarly to Preferred Alternative D2A, the pedestrian facilities planned as part of the City of Bellevue’s Bel-Red Subarea Plan (City of Bellevue, 2008a) would support and connect to the 120th and 130th Stations for Alternatives D2E and D3. Because neither 120th Station nor 130th Station is considered with Alternative D5, there would be no nonmotorized benefits for this alternative with the Bel-Red Subarea Plan. The PM peak-period pedestrian trips generated at the 120th and 130th Stations for Alternatives D2E and D3 would be similar to the trips generated at 120th Station with Preferred Alternative D2A.
Pedestrian circulation to and from the private properties west of 152nd Avenue NE, near the Overlake Village Station, would be relocated to 151st Avenue NE with the D2A – NE 24th Design Option, Alternatives D2E and D5 as these alternatives would prohibit pedestrians from crossing the tracks. This would create some out-of-direction or circuitous travel for pedestrians to and from the east. Alternative D3 would provide an additional crosswalk north of the Overlake Village Station at NE 26th Street to accommodate pedestrian movements to and from the station platform. Pedestrian circulation at Overlake Transit Center for Alternatives D2E, D3, and D5 is similar to the conditions for Preferred Alternative D2A.
Similarly to Preferred Alternative D2A sidewalks would be provided on NE 16th Street between 132nd Street and 136th Place NE and on 136th Place NE between NE 16th Street and NE 20th Street for Alternatives D2E and D3. Increases in the pedestrian crossings distances would occur at the signalized intersections along NE 16th Street and 136th Place NE (similarly to Preferred Alternative D2A) and at NE 24th Street and 152nd Avenue NE with Alternatives D2E and D3. In addition, with Alternative D3, increases in pedestrian crossings distances would occur along NE 20th Street between 136th Place NE and 152nd Avenue NE.
Similar to Preferred Alternative D2A, sidewalks at the intersections nearest to all the Alternatives D2E, D3, and D5 station entrances would operate at LOS A in the no-build and build conditions (see Appendix F of this Transportation Technical Report).There would be no impacts on any school walk routes with Alternatives D2E, D3, and D5.
7.3.4.2 Bicycle Circulation The stations in Segment D would have minimal to no impacts on existing bicycle circulation. All arterial streets are part of a designated bicycle route system; however, bicycle circulation is currently limited because designated bicycle lanes are not present on arterial streets. Bicycle circulation in Segment D would also be limited by the presence of higher traffic volumes on wider arterials such as Bel-Red Road and NE 20th Street. As indicated in the Pedestrian Circulation section (Section 7.3.4.1), the substantial bicycle improvements included in the City of Bellevue’s Bel-Red Subarea Plan (City of Bellevue, 2008a) would support and connect the 120th and 130th Stations. Bicycle storage and wayfinding at Segment D stations would be provided. The proposed bicycle facilities at the Segment D stations are shown in Table 7-13.

7.0 Nonmotorized Facilities
7.0 Nonmotorized Facilities 7-36 East Link Project Final EIS July 2011
Preferred NE 16th At-Grade Alternative (D2A) In the Bel-Red area near the 120th and 130th Stations, bicycle facilities planned as part of the transportation and land use projects included in the City of Bellevue’s Bel-Red Subarea Plan (City of Bellevue, 2008a) would support and connect to these stations. Both of these stations would be close to the SR 520 Multiuse Regional Trail; however, trail access would be limited to public park areas, and direct access from arterial streets would be constrained by terrain and private property.
Bicycle circulation conditions near the Overlake Village Station and the Overlake Transit Center Station would be similar to existing conditions. To improve nonmotorized connections between Overlake Village Station (associated with Preferred Alternative D2A) and the commercial properties north of SR 520, the City of Redmond could build a new, nonmotorized, multiuse bridge over SR 520. Additionally, improved bicycle and pedestrian connections between the Overlake Transit Center Station and the properties west of SR 520, could occur if a new nonmotorized, multiuse bridge over SR 520 were built by others.
Although the Overlake Village Station and Overlake Transit Center Station stations are located close to the SR 520 Regional Multiuse Trail, access between the trail and these stations would be indirect as trail users would need to cross SR 520 unless the nonmotorized bridges proposed by others were to be built.
Other Segment D Alternatives All other Segment D alternatives (D2A – 120th and NE 24th Design Options, D2E, and D3) except Alternative D5 would have bicycle impacts at the 120th and 130th Stations similar to those of Preferred Alternative D2A. Similar to the pedestrian circulation, because neither 120th Station nor 130th Station is considered with Alternative D5, there would be no nonmotorized benefits with this alternative in conjunction to the Bel-Red Subarea Plan. All of the other Segment D alternatives would have similar bicycle impacts at the Overlake Village and Overlake Transit Center to those of the Preferred Alternative D2A.
7.3.5 Segment E The Redmond Town Center is a major commercial destination within the East Link Project corridor and the Downtown Redmond and Redmond Town Center stations would generates the highest pedestrian activity among the proposed Segment E stations, as indicated in Table 7-14. Pedestrian and bicycle circulation and connectivity within Segment E would be improved with development projects or planned city capital improvements, as indicated by the increase in planned sidewalks listed in Table 7-15.
TABLE 7-14 PM Peak-Period (3-hour) Walk and Bicycle Trips Generated by Segment E Stations
Station (Associated Alternatives)
2020 2030
Boarding Alighting Total Boarding Alighting Total
Redmond Town Center (Alternative E1, E2 – Redmond Transit Center Station Design Option, Alternative E4)
160 120 280 220 100 320
SE Redmond (E1, Preferred Alternative E2, Alternative E4)
50 20 70 50 20 70
Downtown Redmond (Preferred Alternative E2) 220 100 320 270 110 380
Redmond Transit Center (E2 – Redmond Transit Center Station Design Option)
50 60 110 70 80 140
a Person-trips for alternative with highest ridership. Note: Because of rounding, in and out walk and bicycle trips might not sum exactly to total walk and bicycle trips. Alighting – people exiting the light rail vehicle.
Preferred Marymoor Alternative (E2) would serve Downtown Redmond Station, while Alternative E1, E2 – Redmond Transit Center Design Option, and Alternative E4 would serve Redmond Town Center Station, and all Segment E alternatives would include SE Redmond Station. The E2 – Redmond Transit Center Design Option would also serve Redmond Transit Center Station.

7.0 Nonmotorized Facilities
East Link Project Final EIS 7-37 7.0 Nonmotorized Facilities July 2011
7.3.5.1 Pedestrian Circulation Preferred Marymoor Alternative (E2) Preferred Marymoor Alternative (E2) would be the only alternative that would serve the at-grade Downtown Redmond Station. This station would have the highest number of PM peak-period bicycle and pedestrian trips compared with the other Segment E stations as it surrounds major commercial and retail areas. If light rail riders were to park at the Redmond Transit Center they would need to cross SR 202 to access this station. Most light rail riders at this station are expected to make bus transfers or walk to and from the surrounding commercial and retail areas.
Preferred Alternative E2 would also serve the SE Redmond Station. The pedestrian activity at the SE Redmond Station would primarily be within the facility and occur at the park-and-ride area as a result of many people transferring from light rail to autos. This travel pattern would be expected because the surrounding land uses include industrial and commercial buildings. Pedestrian circulation near this station would also be limited by wide, multilane arterials with heavy traffic volumes and by the proximity to SR 520, which is a physical barrier to travel to and from Downtown Redmond.
The future BNSF Railway regional multiuse trail would provide pedestrian access to and from both of these stations. With Preferred Alternative E2, crossings at 161st, 164th, 166th, and 170th Avenues NE, and NE Leary Way would be maintained. Light rail crossing gates would be installed at the at-grade intersections and driveways along the BNSF Railway corridor through Downtown Redmond to provide safe vehicle and pedestrian movements across the tracks. Pedestrian crosswalks at these locations would be maintained.
Other Segment E Alternatives The Redmond Way Alternative (E1), E2 – Redmond Transit Center Station Design Option, and Leary Way Alternative (E4) would serve the at-grade Redmond Town Center Station. Most light rail pedestrian activity at the Redmond Town Center Station would be similar to activity at the Downtown Redmond Station with Preferred Alternative E2. Close to one-third of the riders at Redmond Town Center Station would likely walk to and from the surrounding commercial and retail areas.
With Alternative E2 – Redmond Transit Center Station Design Option, while 35 percent of the future PM peak-period person-trips at the Redmond Transit Center Station would be pedestrians or bicyclists there are less than 150 walk and bike trips forecasted at this station. This is likely because of the nearby Redmond Town Center Station. This indicates a lower degree of circulation extending beyond the station area to the residential and commercial areas. The highest pedestrian activity at Redmond Transit Center Station would occur within the station at the park-and-ride lot, because many riders would be transferring between modes.
Pedestrian circulation and connectivity at SE Redmond Station for Alternatives E1 and E4 would be similar to those discussed for Preferred Alternative E2. In terms of pedestrian crosswalk conditions, increases in walking distances across streets are only expected with Alternative E2 – Redmond Transit Center Station Design Option along 161st Avenue NE from Cleveland Street to NE 85th Street.
Similarly to Preferred Alternative E2, Alternatives E1 and E4 would use the former BNSF Railway right-of-way. Both of these alternatives would have street crossings at 164th, 166th, and 170th Avenues NE. Alternative E1 would have additional crossings at 161st Avenue NE and NE Leary Way, similar to Preferred Alternative E2. Alternative E4 would have additional crossings at Bear Creek Parkway and NE 76th Street. Pedestrian crosswalks at these locations would be maintained. To provide safe vehicle and pedestrian movements across the tracks, light rail crossing gates would be installed at at-grade intersections and driveways along the corridor through Downtown Redmond. At the Redmond Transit Center Station, pedestrian access to the station platform would occur at the crosswalks at NE 80th and 83rd Streets.
Sidewalks at the intersections near entrances of the Downtown Redmond, Redmond Town Center, SE Redmond, and Redmond Transit Center Stations would operate at LOS A, as shown in Appendix F of this Transportation Technical Report, indicating that pedestrian crowding on sidewalks is not expected. The recommended walk route for Redmond Elementary School consists of collector and local streets in residential areas and impacts on the walk route are not expected as none of the East Link alternatives would cross these routes.

7.0 Nonmotorized Facilities
7.0 Nonmotorized Facilities 7-38 East Link Project Final EIS July 2011
7.3.5.2 Bicycle Circulation With the East Link project, circulation for bicyclists in Segment E would likely not differ greatly from circulation under the no-build condition. Future bicycle improvement projects would enhance bicycle circulation with or without the project by improving access to Marymoor Park and the Sammamish Regional Multiuse Trail system. These bicycle facilities would be close to the proposed stations; however, SR 520 would hinder direct access to them, especially from the Redmond Town Center. With the close location of the regional trail system surrounding the proposed stations in Segment E, bicycle storage facilities are proposed at the stations, as shown in Table 7-15.
Preferred Marymoor Alternative (E2) The Preferred Alternative E2 would not preclude the potential development of a multiuse trail located along the former BNSF Railway tracks parallel to light rail tracks. Developing a multiuse trail in this corridor would create a pedestrian and bicycle connection between Bear Creek Trail and Lake Sammamish. The trail would be directly accessible from the SE Redmond Station and Downtown Redmond Station and allow nonmotorized commuters to transfer to light rail.
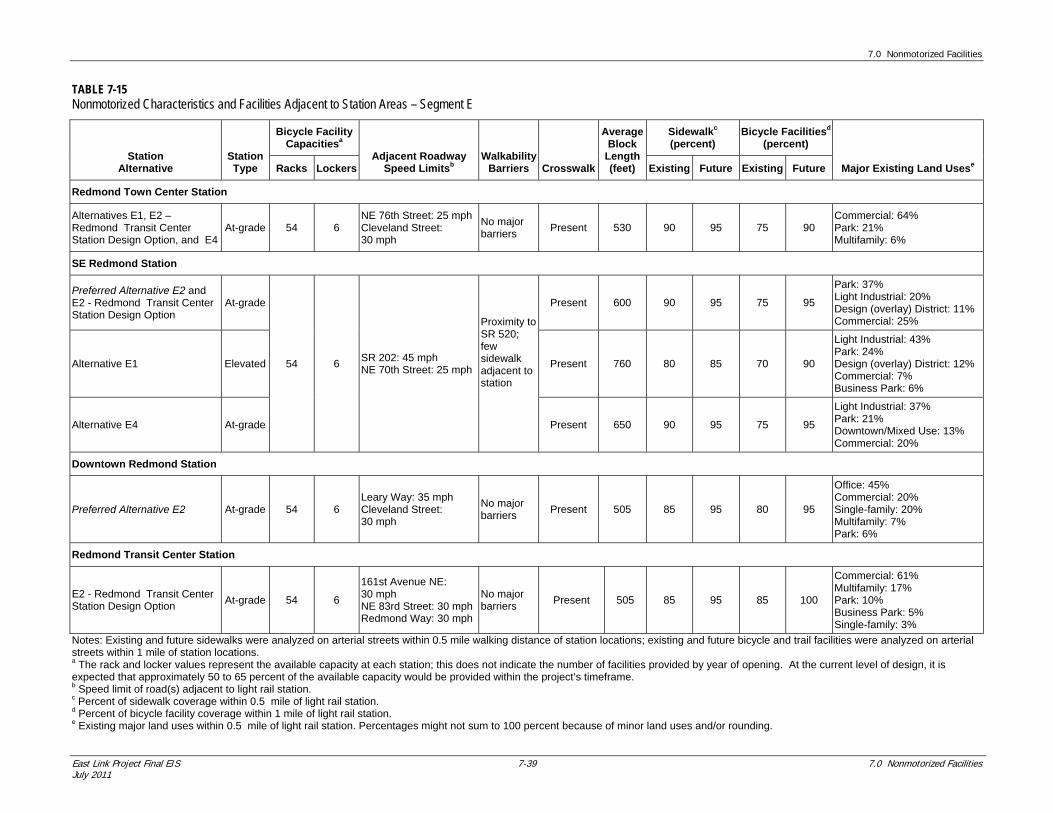
7.0 Nonmotorized Facilities
East Link Project Final EIS 7-39 7.0 Nonmotorized Facilities July 2011
TABLE 7-15 Nonmotorized Characteristics and Facilities Adjacent to Station Areas – Segment E
Station Alternative
Station Type
Bicycle Facility Capacitiesa
Adjacent Roadway Speed Limitsb
WalkabilityBarriers Crosswalk
Average Block
Length (feet)
Sidewalkc
(percent) Bicycle Facilitiesd
(percent)
Major Existing Land Usese Racks Lockers Existing Future Existing Future
Redmond Town Center Station
Alternatives E1, E2 – Redmond Transit Center Station Design Option, and E4
At-grade 54 6 NE 76th Street: 25 mphCleveland Street: 30 mph
No major barriers
Present 530 90 95 75 90 Commercial: 64% Park: 21% Multifamily: 6%
SE Redmond Station
Preferred Alternative E2 and E2 - Redmond Transit Center Station Design Option
At-grade
54 6 SR 202: 45 mph NE 70th Street: 25 mph
Proximity to SR 520; few sidewalk adjacent to station
Present 600 90 95 75 95
Park: 37% Light Industrial: 20% Design (overlay) District: 11%Commercial: 25%
Alternative E1 Elevated Present 760 80 85 70 90
Light Industrial: 43% Park: 24% Design (overlay) District: 12%Commercial: 7% Business Park: 6%
Alternative E4 At-grade Present 650 90 95 75 95
Light Industrial: 37% Park: 21% Downtown/Mixed Use: 13% Commercial: 20%
Downtown Redmond Station
Preferred Alternative E2 At-grade 54 6 Leary Way: 35 mph Cleveland Street: 30 mph
No major barriers
Present 505 85 95 80 95
Office: 45% Commercial: 20% Single-family: 20% Multifamily: 7% Park: 6%
Redmond Transit Center Station
E2 - Redmond Transit Center Station Design Option
At-grade 54 6
161st Avenue NE: 30 mph NE 83rd Street: 30 mphRedmond Way: 30 mph
No major barriers
Present 505 85 95 85 100
Commercial: 61% Multifamily: 17% Park: 10% Business Park: 5% Single-family: 3%
Notes: Existing and future sidewalks were analyzed on arterial streets within 0.5 mile walking distance of station locations; existing and future bicycle and trail facilities were analyzed on arterial streets within 1 mile of station locations. a The rack and locker values represent the available capacity at each station; this does not indicate the number of facilities provided by year of opening. At the current level of design, it is expected that approximately 50 to 65 percent of the available capacity would be provided within the project’s timeframe. b Speed limit of road(s) adjacent to light rail station. c Percent of sidewalk coverage within 0.5 mile of light rail station. d Percent of bicycle facility coverage within 1 mile of light rail station. e Existing major land uses within 0.5 mile of light rail station. Percentages might not sum to 100 percent because of minor land uses and/or rounding.

7.0 Nonmotorized Facilities
7.0 Nonmotorized Facilities 7-40 East Link Project Final EIS July 2011
Other Segment E Alternatives The bicycle lanes along 161st Avenue NE would be maintained with Alternative E2 – Redmond Transit Center Station Design Option to ensure nonmotorized connectivity between Redmond Transit Center Station, the nearby Sammamish Regional Multiuse Trail and the proposed multiuse trail located along the former BNSF Railway corridor. Similarly to the Preferred Alternative E2, Alternatives E2 – Redmond Transit Center Station Design Option and Alternatives E1 and E4 would not preclude the potential multiuse trail located along the former BNSF Railway corridor. The trail would be directly accessible from SE Redmond Station and Redmond Town Center Station and would allow nonmotorized commuters to transfer to light rail.
7.3.6 Construction Impacts Potential construction impacts for pedestrian and bicycle circulation could occur along streets with partial or full closures because these types of construction areas might restrict or provide detour routes for pedestrians and/or bicyclists. Section 6.4 discusses and lists the streets with expected closures during construction. Sound Transit would minimize disruptions to the sidewalk or bicycle network and provide detours as practical during construction.
In Bellevue, a number of bicycle facilities are planned as part of the City’s future transportation improvement projects (Exhibits 7-9, 7-10, and 7-11) within the study area. If these projects are completed before light rail construction, these new bicycle lanes and routes that are located within or adjacent to light rail construction areas could be temporarily affected during construction, and they would be closed or detours would be provided, depending on the type of construction activity. In Redmond, most arterials are designated as existing bicycle routes or lanes. Similarly to the potential impacts on bicycle facilities in Bellevue, bicycle facilities in Redmond would be temporarily closed or detours would be provided during construction.
Regional multiuse trails might experience some temporary construction impacts because of their proximity to the alternatives. In Segments B, C, D and E, the potential multiuse trail along the former BNSF Railway corridor would be affected in some areas if constructed prior to East Link.
7.3.6.1 Segment A The portion of the I-90 Multiuse Regional Trail on the I-90 bridge would not be affected by light rail construction as most of the construction activities would occur in reversible center roadway.
7.3.6.2 Segment B Near the I-90 and Bellevue Way interchange, the I-90 Multiuse Regional Trail could be temporarily affected by construction associated with any of the Segment B alternatives. During construction, temporary trail closures or detours could occur where the trail is close to the I-90 and Bellevue Way ramps, and near the western boundary of Mercer Slough Nature Park. During the civil construction period for alternatives along Bellevue Way (Preferred Alternative B2M and Alternatives B1, B2A, B2E, and B3) sidewalk on the eastern side of Bellevue Way SE and 112th Avenue SE would likely close and require detours. A portion of the Periphery Loop Trail would be closed during construction and require detours. Sidewalk along Bellevue Way, north of 112th Avenue SE, would likely be closed on one side during the Alternative B1 civil construction period. The 118th Avenue Regional Multiuse Trail could be temporarily affected near I-90 by construction associated with the BNSF Alternative (B7). Also with Alternative B7, short-term, nonmotorized construction impacts would occur with the construction of the elevated profile along 118th Avenue SE.
7.3.6.3 Segment C During the civil construction period of Preferred Alternative C11A, sidewalks along 112th Avenue SE, Main Street, and 108th Avenue NE and NE 6th Street would likely remain open on one side, to the extent possible, pedestrian connections would be maintained at intersections. Pedestrian access to buildings would also be maintained. During the civil construction period for Preferred Alternative C9T, sidewalks along 112th Avenue SE, Main Street, and 110th Avenue NE and NE 6th Street would likely remain open on one side, to the extent possible, pedestrian connections would be maintained at intersections. Pedestrian access to buildings would also be maintained.
Civil construction activities with Alternatives C1T, C2T, and C3T would likely close sidewalks on at least one side of the street along the construction route; pedestrian connections would be maintained, to the extent possible, at intersections. The pedestrian connections along NE 6th Street would be maintained with Alternative C1T and
7.0 Nonmotorized Facilities
East Link Project Final EIS 7-41 7.0 Nonmotorized Facilities July 2011
Alternative C2T construction either along this route or nearby roads, depending on the construction activity. The civil construction period of Alternative C4A, the sidewalk would likely be closed on one side of 108th and 110th Avenues NE and along one side of Main Street and NE 12th Street between 108th and 112th Avenues NE. Civil construction activities associated with Alternative C9A would have nonmotorized impacts similar to Preferred Alternative C9T.
There would be minimal impacts on pedestrians and bicyclists during the civil construction of Alternatives C7E and C14E. The bicycle route along 114th Avenue SE between SE 6th and Main streets would likely be rerouted along SE 6th Street and 112th Avenue SE during construction of Alternative C14E. Construction associated with Alternative C8E would likely close sidewalks on one side of the street along the construction route of NE 2nd Street, 110th Avenue NE, and NE 12th Street.
7.3.6.4 Segment D During the civil construction period, the SR 520 Multiuse Regional Trail in Segment D is located along the north side of SR 520, and construction impacts are not expected because the alternatives in Segment D would be located on the south side of SR 520 and therefore do not require widening or realignment of SR 520 that could require relocating the trail. The construction of a pedestrian bridge across SR 520 to the Overlake Village Station with the Preferred Alternative D2A and the Overlake Transit Center (all Segment D alternatives) would create short-term lane closures on SR 520.
Sidewalk, for Preferred Alternative D2A (and both the D2A - 120th and NE 24th Design Options) and Alternatives D2E and D3, would likely remain open on one side of the road along NE 16th Street between 132nd Street NE and 136th Place NE, 136th Place NE and Microsoft Road. Along the proposed NE 15th Street extension between 120th Avenue NE and 124th Avenue NE, sidewalk closures would be likely under Alternatives D2E and D3. Sidewalk on one side of 24th Street between 148th Avenue NE and 152nd Avenue NE would likely be closed with D2A – NE 24th Design Option and Alternative D2E. Alternative D3 would likely have sidewalk closures along NE 20th Street between 136th Place NE and 152nd Avenue NE and along 152nd Avenue NE. Alternative D5 would likely have sidewalk closures along the westside of 152nd Avenue NE and Microsoft Road.
7.3.6.5 Segment E The elevated alternatives in Segment E would cross the Sammamish River Trail, resulting in minor short-term detours. The Segment E alternatives would also cross the Bridle Crest Trail and the Bear Creek Trail, resulting in minor short-term detours. Alternative E1 would also require minor realignment of the East Lake Sammamish Trail in the area along the former BNSF Railway tracks. With Alternative E2 – Redmond Transit Center Station Design Option, sidewalk along 161st Avenue NE would be closed.
7.4 Potential Mitigation No adverse impacts have been identified due to the East Link operations and therefore no mitigation to nonmotorized facilities is proposed. As described in Section 3.7.3, Sound Transit would provide pedestrian and bicycle improvements at East Link stations. Sound Transit would work with the local agencies regarding alternatives and stations located within the median of roadways so that the most appropriate treatments would be provided for safe and effective pedestrian crossings and access. These treatments could include painted crosswalks or signals, street lighting, warning lights or bells, or signage.
During construction, Sound Transit would minimize potential impacts on pedestrian and bicycle facilities by providing detours within construction areas, such as protected walkways, and notify the public as determined appropriate by the project. For instance, with the sidewalk closed along Bellevue Way SE and 112th Avenue SE during the construction of Preferred Alternative B2M, methods to maintain pedestrian access could include using a protected walkway adjacent to the construction area or similar provision and notifying the public, as determined appropriate by the project. Multiuse trails that might be affected by construction would generally be kept open for use, but detours would be provided when trails are closed, unless they are closed for short durations or in areas where a detour option is not feasible. Public notification efforts would be conducted for temporary trail closures during construction.


East Link Project Final EIS 8-1 8.0 Freight Mobility and Access July 2011
8.0 Freight Mobility and Access
8.1 Section Overview This section describes the affected environment for freight and describes any impacts on freight during East Link construction and light rail operation within the study area. Freeways, arterials, and local streets throughout the East Link Project vicinity are vital to moving freight and goods between major transportation hubs such as the Port of Seattle, Sea-Tac Airport, and other business and consumer destinations. Within the East Link study area, only roadways are used as freight transportation.
About 140,000 vehicles travel on the I-90 bridge across Lake Washington every day. Of this number, about 6,300 are trucks, or 4.5 percent of the total vehicles on the bridge. About two-thirds of these trucks travel outside of the AM and PM peak periods to avoid the more heavily congested times of the day. Due to weight and access restrictions, slightly more than 1 percent of the total traffic on the reversible center roadway of I-90 is considered to be trucks.
The East Link Project would have an overall slight beneficial impact on trucks traveling on I-90. As people choose to use light rail, the travel time of trucks during the morning peak hour are comparable and improve by an average of 5 minutes in the afternoon compared with the No Build Alternative. Trucks volumes across Lake Washington on I-90 during East Link operations are comparable in both the morning and the afternoon peak hours when compared with the No Build Alternative.
On the arterial and local street network, the East Link alternatives are not anticipated to negatively affect truck circulation or truck routes. The light rail at-grade profiles that cross or travel along designated truck routes are not expected to impact trucks because intersection operations with East Link would be similar or improved compared with the No Build Alternative. On the regional highway and arterial street networks, truck travel outside of the peak periods is expected to remain similar between the No Build Alternative and East Link Project because congestion would be substantially less than in the peak periods and therefore the roadways would operate below their capacity in both conditions.
8.2 Affected Environment Truck mobility within the Puget Sound region is largely supported by a system of designated truck routes consisting of freeways and arterial streets that connect major freight destinations. Within the East Link study area, there are key freight corridors that serve not only the Puget Sound region but also national and international markets. These corridors include I-90 and I-405, as well as many local truck routes with a primary purpose of facilitating the flow of deliveries to local businesses. To prioritize these truck routes, WSDOT adopted the Freight Goods Transportation System (FGTS), which classifies roadways according to the amount of annual tonnage transported along these roads. The classifications range from roadways that carry more than 20,000 tons in 60 days to more than 10,000,000 tons annually (Table 8-1). Jurisdictions determine their designated truck route system on arterial streets according to the FGTS classifications. Exhibits 8-1 through 8-3 show the location of truck routes in each jurisdiction within the study area. Within the East Link study area, only roadways are used for freight transportation, although some of the freight transportation on I-90 and other highways (I-405 and SR 520) in the study area are associated with rail and marine facilities, such as the Port of Tacoma and Port of Seattle.
8.2.1 Regional Highways In Segment A, I-90 is an east-west key truck route connecting local, interstate, and regional freight activity with the Ports of Seattle and Tacoma and surrounding industrial areas across Lake Washington. I-90 serves the international and national markets and is the second most heavily used highway, following I-5, for truck movement in Washington (WSDOT, 2008). From 1993 to 2003, truck traffic on I-90 grew by 72 percent (WSDOT, 2008).

"
"
"
"
LakeWa sh in g ton
ElliotBay
§̈5
§̈90
§̈405
§̈5¾À99
Segment BSegment A
To Sea-TacAirport
To Universityof Washington
Segment A
Segment CSegment B
SE 24TH ST
W ME
RCER
WY
ISLAND CREST WY SE 36TH ST
International District/Chinatown Station
NE 6TH
S E A T T L E
M E R C E RI S L A N D
B E L L E V U E6T
H AV
E S
15TH
AVE S
5TH AVE
E UNION ST
M L K
ING
JR W
AY S
3RD AVE
E PINE ST
E CHERRY ST
23RD
AVE
S
BROA
DWAY
AVE
9TH AVE
E PIKE ST
7TH AVE
SE 40TH ST
8TH AVE
BEACON AVE S
S GENESEE ST
YESLER WAY
1ST AVE
ISLAND CREST WAY
S JACKSON ST
1ST A
VE S
M L K
ING
JR W
AY
100T
H AV
E NE
S LANDER ST
S MC CLELLAN ST
77TH
AVE S
E
S SPOKANE ST
S HOLGATE ST
SENECA ST
12TH
AVE S
50TH
AVE S
N MERCER WAY
80TH
AVE S
E
MAIN ST
NE 4TH ST
E THOMAS ST E JOHN ST
NE 1ST ST
S FOREST ST
NE 12TH ST
PINE ST
2ND
AVE
S
GOLF DR S
15TH
AVE S
NE 12TH ST
0 10.5 Mile
§At-Grade RouteElevated Route
! ! ! ! Retained-Cut Route! ! ! ! Retained-Fill Route
Tunnel Route
" Traction Power Substationú Proposed Station!! Central Link Alignment and Station
Source: Data from King County (2006) modified by CH2M HILL.
Exhibit 8-1 Existing FreightRoutes and ClassificationsSegment AEast Link Project
Local Truck RouteFreight and Goods TransportationSystem Classification(Annual Gross Tonnage)
T-1 (over 10,000,000)T-2 (4,000,000 - 10,000,000)T-3 (300,000 - 4,000,000)T-4 (100,000 - 300,000)T-5 (over 20,000 in 60 days)

!!
!!
!!
!!
!!
!!
!!
!
! !
!!!!
!
!!!
!!
!!
!!
!!
!!
!!
!!
!
!!
!!!
!
! !
! ! ! ! !
!!!
! !! !! !
! ! ! ! !! ! ! ! !! ! ! ! !
!!!
!
!!!
!
! ! !
!!!!!
!!
!!!
!!!
!!
!!
! ! !
!!!!!
!!
!!!
!!!
!!
!!
!
! ! !
!
!!!
!!
!!
!!
!!
!!
!!
!!
!
!
!!!
!!
!!
!!
!!
!!
!!
!
!
!
!!!!!!!!!!
!
!!!!!!!!!!!!
!!
!!
!
! ! !
!!
!!
!
! ! !
!!
!!
!
! ! !
!!
!!
!
!!!
! ! !
!!
!!
!
"""
"
"
"
"
"
"
"
"""""
"
"
"
"
"""
"
"
"
"""""
""
"
B E L L E V U E
B E A U X A R T S
114TH AVE SE
114T
H AVE
NE
SE 6TH ST
BELLEVUE WAY SE
SE 8TH ST
Lake Washington
LakeBellevue
Mercer Slough East
BSegment
Segment A
CSegmentBSegment
CSegment
DSegment
§̈90§̈90
§̈405
NE 4TH ST
NE 4TH ST
108T
H AV
E SE
BELL
EVUE
WAY
NE
MAIN STMAIN ST
SE 8TH ST
NE 4TH STNE 4TH ST
NE 4TH ST
NE 2ND ST10
6TH
AVE
NE
116T
H AVE
NE
112T
H AVE
SE
112T
H AVE
SE
118TH AVE SE
SE 25TH ST
RICHA
RDS R
D
"
Traction Power Substation
ú Proposed StationÂΡ New and/or Expanded
Park-and-Ride LotLocal Truck Route
Freight and Goods TransportationSystem Classification(Annual Gross Tonnage)
T-1 (over 10,000,000)
T-2 (4,000,000 - 10,000,000)T-3 (300,000 - 4,000,000)T-4 (100,000 - 300,000)T-5 (over 20,000 in 60 days)
0 0.25 Mile
§Source: Data from King County (2006).
Preferred AlternativeAt-Grade RouteElevated Route
! ! ! ! Retained-Cut Route! ! ! ! Retained-Fill Route
Tunnel RouteOther Alternatives
At-Grade RouteElevated Route
! ! ! !
Retained-Cut or Retained-Fill RouteTunnel Route
Exhibit 8-2 Existing FreightRoutes and ClassificationsSegments B and CEast Link Project

!!!!
!!
!!
!
!!
!!
!!
!!
!!
!!
!!
!!
!!
!!
!!
!!
!!
!!
!!
!!
! !!!!!
!!
!!
!!
!!
!!!
!!
!!
!!
!!!!
!!
!!
!!
!
! ! ! ! ! ! ! ! ! ! ! ! ! ! ! !
!!
!!
!!!!!!
!!
!!
!!
!!!! ! ! ! ! ! ! !
!!!!!
!!
!!
!!
!!!!
!!
!!
!!
!
! ! ! !
!!!!!
!!
!!
!!
! ! ! ! ! ! ! ! ! ! ! !
!!
!!
!
!!!! ! ! ! ! ! ! !
!!!!!
!!
!!
!!
!!
!!
!!
!!
!!!
!!
!!
!!
!!
!!!
!!
!!
!!
!!
!
!!
!!
!!
!
!!
!!!
!
!
!
!!!!
!!
!!
!!
!!
!!
!!
!!!
!!
!!
!!
!
!!!!!!!
!
!!!
!!
!!
!!
!!
!!
!!
!
! !
!!
!
! !
!!
!
! !
!!
!
!!
! !
!!
!
!!
ÂΡ
ÂΡÂΡ
ÂΡ
ÂΡ
ÂΡ
ÂΡÂΡ
""
"
"
"
"
"
"
"
"
"
""
"
"
"
"
"
"
"
"
LakeSammamish
§̈405
¾À202
¾À520
¾À908
M erce
r Slough West
¾À202
Segment ESegment D
Segment DSegment C
B E L L E V U E
R E D M O N D
LakeSammamish
132N
D AV
E NE
156T
H AV
E NE
NE 40TH ST
NE BELLEVUE-REDMOND RD
NORTHUP WAY
NE UNION HILL RD
NE 80TH ST
166T
H AV
E NE
NORTHUP WAY
NE 80TH ST
" Traction Power Substationú Proposed Station
Maintenance Facilityand Access Track
ÂΡ New and/or ExpandedPark-and-Ride Lot
0 0.5 Mile§Source: Data from King County (2006).
Local Truck RouteFreight and Goods TransportationSystem Classification(Annual Gross Tonnage)
T-1 (over 10,000,000)T-2 (4,000,000 - 10,000,000)T-3 (300,000 - 4,000,000)T-4 (100,000 - 300,000)T-5 (over 20,000 in 60 days)
Preferred AlternativeAt-Grade RouteElevated Route
! ! ! ! Retained-Cut Route! ! ! ! Retained-Fill Route
Tunnel RouteOther Alternatives
At-Grade RouteElevated Route
! ! ! ! Retained-Cut or Retained-Fill RouteTunnel Route
Exhibit 8-3 Existing FreightRoutes and ClassificationsSegments D and EEast Link Project

8.0 Freight Mobility and Access
East Link Project Final EIS 8-5 8.0 Freight Mobility and Access July 2011
TABLE 8-1 Freight and Goods Transportation System Classification
FGTS Classification Annual Gross Tonnage
T-1 Over 10,000,000
T-2 4,000,000 to 10,000,000
T-3 300,000 to 4,000,000
T-4 100,000 to 300,000
T-5 Over 20,000 in 60 days
Source: Washington State Legislative Transportation Committee, Resolution 516, March 16, 1995. FGTS Freight and Goods Transportation System
Over the course of a year, more than 31 million tons of freight are hauled across I-90, resulting in its designating under the T-1 FGTS Classification. As shown in Table 8-2, of the approximate 140,000 daily vehicles that cross Lake Washington about 6,300 (or 4.5 percent) of them are truck trips (based on traffic counts conducted on May 1 and 2, 2007) occur on I-90, many of which travel over the I-90 bridge en route to or from the Port of Seattle or other major transportation hubs ,such as Sea-Tac Airport, and to other business and consumer destinations. Many of these truck trips between these transportation hubs are considered long-haul trips across Snoqualmie Pass to or from eastern Washington and beyond (WSDOT, 2005). Within the study area, I-405 is also designated as T-1 freight route, and SR 520 is classified as a T-2 freight route.
TABLE 8-2 Current Peak-Period and Daily Truck Volumes on I-90 Bridge
Time Period
Small Trucks Medium Trucks Large Trucks
Total Trucksa
Total VehiclesCount
Trucks (percent)
Vehicles (percent) Count
Trucks (percent)
Vehicles (percent) Count
Trucks (percent)
Vehicles (percent)
Eastbound
AM Peakb 330 49.4 2.3 252 37.5 1.8 89 13.1 0.6 671 (4.7%) 14,150
PM Peakb 241 59.2 1.6 149 36.4 1.0 18 4.4 0.1 408 (2.7%) 14,850
Off Peak 1,125 53.1 2.8 732 34.5 1.8 263 12.4 0.7 2,120 (5.3%) 39,900
Daily 1,696 53.0 2.5 1,132 35.4 1.6 369 11.5 0.5 3,197 (4.6%) 68,900
Westbound
AM Peakb 323 48.8 2.0 256 38.8 1.6 82 12.4 0.5 661 (4.1%) 15,950
PM Peakb 219 53.9 1.5 164 40.3 1.1 24 5.8 0.2 407 (2.8%) 14,350
Off Peak 972 46.3 2.5 848 40.5 2.2 279 13.3 0.7 2,099 (5.4%) 39,100
Daily 1,514 47.3 2.2 1,268 39.7 1.8 384 12.0 0.6 3,166 (4.6%) 69,400
Note: Data compiled from two-day vehicle classification count in Mercer Island (May 1 and 2, 2007). a Values in parentheses are percentage of total vehicles that are trucks. b AM peak period is 6:00 to 9:00 a.m., and the PM peak period is 3:00 to 6:00 p.m.
About half of the trucks that cross Lake Washington on I-90 are considered smaller-sized trucks, which include vehicles such as delivery vans and recreational vehicles. About 750 trucks (about 12 percent of the total daily trucks) are large-sized tractor-trailer trucks. Because much of the truck travel avoids the more heavily congested times of the day, about two-thirds of the trucks travel during nonpeak hours. Truck volumes are highest on I-90 crossing Lake Washington from the end of the AM peak period through the midday period (from 9:00 a.m. to 1:00 p.m.). During the early afternoon, truck volumes dramatically decrease to avoid the congestion during the PM peak period because only about 3 percent of total traffic is considered to be trucks during this period. This differs from general volume peaking patterns on I-90, where 50 percent of the total daily volume occurs during the AM and PM peak periods. Exhibit 8-4 provides a chart of the truck volumes throughout the day, and Table 8-2 shows truck volumes during the AM and PM peak periods, along with off-peak and daily totals.

8.0 Freight Mobility and Access
8.0 Freight Mobility and Access 8-6 East Link Project Final EIS July 2011
I-90 24-Hour Truck Volumes
0
50
100
150
200
250
300
350
12:00
AM
1:00
AM
2:00
AM
3:00
AM
4:00
AM
5:00
AM
6:00
AM
7:00
AM
8:00
AM
9:00
AM
10:00
AM
11:00
AM
12:00
PM
1:00
PM
2:00
PM
3:00
PM
4:00
PM
5:00
PM
6:00
PM
7:00
PM
8:00
PM
9:00
PM
10:00
PM
11:00
PM
Hour
Ho
url
y T
ruck
Vo
lum
e
Westbound
Eastbound
Exhibit 8-5 provides the percentage of trucks compared with the total volumes on I-90, as well as the truck volume as a percentage of the total daily trucks crossing I-90. This exhibit further indicates that trucks patterns shift to avoid the typical morning and afternoon congested periods of the day. This exhibit also indicates that the percentage of trucks, compared with the total number of vehicles on I-90 is lowest during the AM peak period and the PM peak period through the evening. Truck volumes are less than 5 percent of the total traffic from 6 a.m. through 9:00 a.m. and from 3:00 p.m. through the rest of the day. Truck volumes are more than 7 percent of the total traffic from midnight to 4:00 a.m. and from 10:00 a.m. to 1:00 p.m.
Additional truck data was collected in July 2008 to identify the number of trucks that cross Lake Washington on I-90 heading to or from east of I-405 compared with the total number of trucks heading to or from I-405 (Table 8-3). During the AM peak period about 40 percent of the trucks crossing Lake Washington on I-90 are heading to or from east of I-405, with many passing over Snoqualmie Pass. This percentage of trucks continuing east on I-90 increases in the PM peak period to just over 50 percent, but the total number of trucks decreases dramatically in this period as stated previously.
Vehicle weight restrictions established for I-90 require vehicles over 10,000 pounds (for example, tractor-trailers) to only travel on the outer I-90 mainline roadways—vehicles over 10,000 pounds are prohibited from using the reversible center lanes. In addition, trucks less than 10,000 pounds (for example, delivery and recreational vehicles) are allowed to use the center roadway only if they either are an HOV or are heading to or from Mercer Island. Therefore, only a small percentage of trucks travel in the reversible center roadway compared with the I-90 outer mainline roadways. Based on the traffic data collected in May 2007, slightly more than 100 smaller-sized trucks use the center roadway. This is about 1 percent of all the vehicles in this roadway. Table 8-4 provides the truck use in the reversible center roadway.
Source: Sound Transit, 2007b EXHIBIT 8-4 Note: I-90 total daily volume is approximately 140,000. I-90 Existing 24-Hour Truck Volumes

8.0 Freight Mobility and Access
East Link Project Final EIS 8-7 8.0 Freight Mobility and Access July 2011
TABLE 8-3 Existing Two-Hour Peak-Period Long Haul Truck Volume on I-90
Peak Period and Direction Trucks on I-90 Mainline Trucks To and From I-405 Truck Percent East of I-405
AM Peak Perioda
Eastbound 450 235 48
Westbound 370 255 31
AM peak period total 820 490 40
PM Peak Perioda
Eastbound 195 115 41
Westbound 200 70 65
PM peak period total 395 185 53
Note: Data compiled from two-day vehicle classification count on I-90 (July 2008). a AM peak period is from 6:00 to 9:00 a.m., and PM peak period is from 3:00 to 6:00 p.m.
Source: Sound Transit, 2007b. EXHIBIT 8-5 I-90 Existing 24-Hour Truck Percentages of Daily Traffic Total and Truck Volumes
I-90 Truck Percentages
0.0%
2.0%
4.0%
6.0%
8.0%
10.0%
12.0%
14.0%
12:00
AM
1:00
AM
2:00
AM
3:00
AM
4:00
AM
5:00
AM
6:00
AM
7:00
AM
8:00
AM
9:00
AM
10:00
AM
11:00
AM
12:00
PM
1:00
PM
2:00
PM
3:00
PM
4:00
PM
5:00
PM
6:00
PM
7:00
PM
8:00
PM
9:00
PM
10:00
PM
11:00
PM
Hour
Per
cen
tag
e
Truck Percentage to Total Traffic Volume Percentage of Daily Truck Total

8.0 Freight Mobility and Access
8.0 Freight Mobility and Access 8-8 East Link Project Final EIS July 2011
TABLE 8-4 Current Peak-Period and Daily Truck Volumes on I-90 Reversible Center Roadway
Reversible Center Roadway
Direction
AM Peak Perioda PM Peak Perioda Daily
Trucks Total
Vehicles
Percent of Total
Vehicles Trucks Total
Vehicles
Percent of Total
Vehicles Trucks Total
Vehicles
Percent of Total
Vehicles
Westbound 36 2,390 1.5 N/A N/A N/A 61 3,350 1.8
Eastbound N/A N/A N/A 27 3,260 0.8 50 5,900 0.9
Note: Data compiled from two-day vehicle classification count on I-90 (May 1 and 2, 2007). a AM peak period is from 6:00 to 9:00 a.m., and PM peak period is from 3:00 to 6:00 p.m.
N/A not applicable
8.2.2 Arterials and Local Streets In Seattle, most of the arterial streets within the study area (such as Rainier Avenue South, 4th Avenue South, and South Dearborn Street) are designated as Major Truck Streets, for which standards for design provide for higher volume truck travel. On Mercer Island, no roadways are designated as truck routes. Many of the truck routes on arterial roadways in Segment B have access to and from either I-90 or I-405. Bellevue Way SE, 112th Avenue SE, and SE 8th Street are all designated truck routes in Bellevue. In Segment C, the key truck routes connect with I-405 at NE 8th Street and NE 4th Street. In addition, NE 12th Street is a truck route connecting Bellevue Way, 112th Avenue NE, and 116th Avenue NE, which are also truck routes in Bellevue. Within Segment C, trucks mainly serve the commercial, office, and retail areas for delivery trips. Within Segment D, truck routes connect the commercial and industrial land uses in the Bel-Red corridor along 116th Avenue NE, 120th Avenue NE, 124th Avenue NE and 148th Avenue NE with access to and from SR 520. Bel-Red Road is also identified as a truck route by the City of Bellevue and City of Redmond. In Segment E, SR 520 is identified as a T-2 route by the State of Washington, and the City of Redmond has designated 148th Avenue NE and a small section of NE 51st Street as truck routes. Near Downtown Redmond, West Lake Sammamish Road and SR 202 are designated truck routes that serve the commercial, retail, and office land uses. SR 202 is further defined as either a T-2 or T-3 route, depending on the section of road.
8.2.3 Rail Freight Within the study area, the only rail line is the former BNSF Railway, which has track through Segments B, C, and D. There are no rail freight operations within Segments A and E. The Port of Seattle acquired the former BNSF Railway right-of-way from Snohomish to north Renton, including a spur from Woodinville to Redmond. The Port of Seattle intends to secure the corridor for potential future freight rail use but is interested in optimizing the use of this corridor for other transportation modes compatible with freight rail (Port of Seattle, 2008). As the BNSF Railway is no longer used for freight movements, the Wilburton Tunnel, which crosses over southbound I-405, was recently removed and therefore the rail corridor is no longer continuous.
8.3 Environmental Impacts Future truck travel was evaluated as part of this study to understand future conditions with and without the project on I-90. With the East Link Project, trucks would continue to use the eastbound and westbound outer roadways, similarly to the No Build Alternative. Truck access to and from these roadways would be unchanged because none of the general-purpose ramps to and from I-90 would be modified with the project.
8.3.1 Impacts During Operation As further described in this section, the East Link Project would have an overall beneficial impact on trucks traveling on I-90. As people choose to ride light rail, truck travel times during peak hours would be maintained or improve, and the ability for trucks to cross Lake Washington on I-90 would be maintained.

8.0 Freight Mobility and Access
East Link Project Final EIS 8-9 8.0 Freight Mobility and Access July 2011
In the future, a higher percentage of trucks is expected to cross the bridge during off-peak periods of the day to avoid traffic congestion in the peak periods. PSRC forecasts show that the average annual growth of truck traffic during the AM and PM peak periods on the I-90 bridge will slow for the decade after 2020, compared with years before 2020 (PSRC, 2007). This is because, by 2030, traffic congestion on I-90 will be much worse than it is today, and, therefore, a higher percentage of trucks are expected to cross Lake Washington during off-peak times. With more congestion in the future, there will be fewer uncongested off-peak hours available for truck travel in the no-build condition. Table 8-5 presents expected annual truck growth rates for the AM and PM peak periods by years 2020 and 2030. The result of increasing congestion in the future no-build condition will be an increase in future truck travel times on I-90. As indicated in Table 8-6, under either no-build condition (with Stages 1 and 2 of the I-90 Two-Way Transit and HOV Operations Project, or with Stages 1 through 3), travel times are expected to take 35 to 75 percent longer than the existing AM and PM conditions. Overall, average (combined westbound and eastbound travel) peak period truck travel times would take approximately 24 minutes in the AM peak period and 27 minutes in the PM peak period to travel between I-405 and I-5 in the no-build condition.
With the East Link project, truck access to and from the I-90 westbound and eastbound outer roadways would be unchanged because none of the general-purpose ramps to and from I-90 would be modified with the project. Regarding truck travel times, the average truck travel time with the project is expected to either remain similar or improve by up to 5 minutes compared with either of the no-build conditions as it would take 23 minutes in the AM peak period and 22 minutes in the PM peak period to travel between I-405 and I-5. Most of the improved travel time is a result of people shifting to ride light rail as their transportation mode. By direction, truck travel with the East Link Project would be faster than in either of the two no-build condition in all directions except for the AM eastbound direction, where travel time would be 1 minute longer when compared with the No Build Alternative with Stages 1 through 3 of the I-90 Two-Way Transit and HOV Operations Project completed. Even though truck travel times might be slightly longer in this direction, more trucks are able to travel on I-90 with the project as there is less congestion compared with the No Build Alternative. Truck travel times would have the largest improvement (up to an 7-minute travel time savings) compared with the no-build condition in the westbound direction during the PM peak period as congestion is expected to noticeably decrease in this direction as people shift from driving to riding light rail.
In addition to truck travel times, Table 8-6 provides information on how many trucks would travel on I-90 during the peak periods in 2030. Overall, the number of trucks traveling on I-90 in the AM and PM peak periods would be more in the build condition compared with the No Build Alternative, when Stages 1 through 2 of the I-90 Two-Way Transit and HOV Operations Project are completed, and similar when compared with the No Build Alternative, when Stages 1 through 3 of the I-90 Two-Way Transit and HOV Operations Project are completed.
More trucks would cross I-90 in the nonpeak directions (eastbound in the morning and westbound in the afternoon) because congestion would improve with people riding light rail instead of driving. In the peak directions, a similar to less number of trucks would cross I-90 because congestion would remain similar with the project as the reversible center roadway would be closed to vehicles. Currently, during nonpeak periods, auto congestion on I-90 is substantially reduced, even though truck traffic is at much higher levels than during the peak periods. Because congestion is less during these periods, the East Link Project, compared with the No Build Alternative, is not expected to have an impact on truck travel during these periods. Thus, the bulk of the truck traffic would remain unaffected by the project.
The design options to potentially close the eastbound HOV direct-access off-ramp or westbound HOV direct-access on-ramp with Bellevue Way and design options for the eastbound HOV off-ramp at Mercer Island are not expected to cause impacts or circulation changes for trucks because these ramps are restricted to HOV and transit use. Similarly, the closure of the Mercer Island ramps to and from the reversible center roadway is not expected to cause truck-circulation impacts because similar access would be provided on the westbound and eastbound mainline roadways.
TABLE 8-5 Forecast Peak-Period Annual Truck Growth Rates on I-90
Peak Period
Average Annual Growth Rate (percent)
2007 to 2020 AM 2007 to 2030 AM
AM Peak Period 1.1 1.2
PM Peak Period 2.8 2.3
Source: PSRC, 2007.

8.0 Freight Mobility and Access
8.0 Freight Mobility and Access 8-10 East Link Project Final EIS July 2011
TABLE 8-6 Existing and Forecast 2030 AM and PM 2-Hour Peak-Period I-90 Bridge Truck Volumes and Travel Times
Period Direction
Existing No Builda No Buildb Build
Number of
Trucksc
Travel Timed
(minutes)
Number of
Trucksc
Travel Timed
(minutes)
Number of
Trucksc
Travel Timed
(minutes)
Number of
Trucksc
Travel Timed
(minutes)
AM Peak (6:00 to 9:00 a.m.)
Westbound 480 13 410 30 440 27 430 25
Eastbound 470 16 480 18 570 21 620 22
AM peak total 950 14 890 24 1,010 24 1,060 23
PM Peak (3:00 to 6:00 p.m.)
Westbound 430 20 450 33 470 32 660 25
Eastbound 360 19 340 21 570 22 370 20
PM peak total 790 20 790 27 1,040 27 1,020 22
a With Stages 1 and 2 of the I-90 Two-Way Transit and HOV Operations Project. b With Stages 1 through 3 of the I-90 Two-Way Transit and HOV Operations Project. c Screenline 2 (Lake Washington) throughput data from the traffic analysis presented in section 5.0. d Travel distance is between I-405 and I-5 (Seattle).
8.3.1.1 Freight on Arterials and Local Streets The East Link Project is not anticipated to negatively affect truck circulation or change the truck route designations on the local street network. In some locations, local designated truck routes would cross or travel alongside at-grade light rail profiles. At these locations, intersection conditions with East Link would be similar to those under the No Build Alternative. Some intersection operations might improve through mitigation for the East Link Project. Additionally, many of the at-grade alternatives that travel through intersections would be accommodated within the existing traffic signal operations. Therefore, disturbances caused by the light rail would be minimized, although slight delays could occur on side streets when light rail travels through an intersection. Where an at-grade alternative intersects a street and is controlled by gates, these locations are also not expected to create noticeable delays to trucks.
8.3.1.2 Rail Freight Within Segment A, no rail freight impacts are expected. Within Segments B, C, and D, rail freight along the former BNSF Railway corridor is not anticipated to occur in the near-term future because of the recent I-405 expansion that removed a segment of rail line. The project, however, would not preclude future rail freight operations on the former BNSF Railway tracks. There are no rail freight operations within Segment E.
8.3.2 Impacts During Construction This section discusses activities that could occur during East Link construction and the associated impacts on freight. These impacts would mainly consist of changes in travel time, truck routes and business access for deliveries and other freight-associated activities. Rail freight would not be affected in any segment during construction. Sound Transit would coordinate with WSDOT on incident management, construction staging and traffic control permitting where the light rail construction might affect freight traffic. Sound Transit would also coordinate with WSDOT to disseminate construction closure information to the freight community.
8.3.2.1 Interstate 90 The I-90 Two-Way Transit and HOV Operations Project would be completed before the construction of East Link on I-90. Therefore, truck travel times during the East Link construction period for the AM and PM peak periods would be similar to or less than truck travel times with the No Build Alternative, when only Stages 1 and 2 of the I-90 Two-Way Transit and HOV Operations Project are built. Similarly, compared to the No Build Alternative, when Stages 1 through 3 of the I-90 Two-Way Transit and HOV Operations Project are built, truck travel times during East Link construction would be similar or improved. Overall, a similar or an increased number of trucks would cross Lake Washington during the East Link construction period compared with either of the No Build

8.0 Freight Mobility and Access
East Link Project Final EIS 8-11 8.0 Freight Mobility and Access July 2011
Alternatives. Truck volumes and travel times with the two No Build Alternatives and East Link construction period are provided in Table 8-7.
TABLE 8-7 2020 AM and PM Peak-Hour Truck Volumes and Travel Times on I-90 During Construction
Hour Direction
No Builda No Buildb Construction
Number of Trucksc
Travel Timed (minutes)
Number of Trucksc
Travel Timed (minutes)
Number of Trucksc
Travel Timed (minutes)
AM Peak (6:00 to 9:00 a.m.)
Westbound 160 29 180 27 320 24
Eastbound 240 18 280 19 210 19
AM Peak-Hour Total 400 22 460 22 530 22
PM Peak (3:00 to 6:00 p.m.)
Westbound 200 32 210 31 310 23
Eastbound 220 17 280 20 160 17
PM Peak-Hour Total 420 24 490 24 480 21
a With Stages 1 and 2 of the I-90 Two-Way Transit and HOV Operations Project. b With Stages 1 through 3 of the I-90 Two-Way Transit and HOV Operations Project. c Screenline 2 (Lake Washington) throughput data from the traffic analysis presented in section 5.0. d Travel distance is between I-405 and I-5 (Seattle).
Most truck trips currently travel on I-90 during nonpeak periods, when congestion is substantially reduced. Since congestion is less during these periods, project construction is not expected to have an impact on travel times for most truck traffic.
The D2 Roadway would also be closed for light rail construction of Preferred Alternative A1. This closure would not impact trucks because they are prohibited from using the D2 Roadway. At the I-90 and Bellevue Way interchange, the I-90 westbound mainline, HOV direct-access ramps, and ramps to and from I-90 to the east would experience short-term partial closures (likely during the nighttime) to construct the elevated structures for Preferred Alternative B2M and Alternatives B2A, B2E, B3, and B7. Alternative B1 would not require these closures because it is at-grade underneath the westbound mainline. These closures are not expected to cause impacts on trucks because alternative routes are available and truck traffic using these ramps is relatively low.
8.3.2.2 Other Regional Freeways Elevated portions of the Segment C alternatives over I-405 would likely result in multiple lane closures of I-405 at night, causing trucks to potentially detour and be delayed. Likewise, elevated portions of Alternatives E1 and E4 that cross over SR 520 near the Lake Sammamish Parkway interchange and the elevated portion of Alternative E1 that crosses over SR 520 near the SR 202 interchange would close multiple lanes of SR 520 at night, possibly causing trucks to detour and adding delay. With Preferred Alternative E2 and E4, the SR 520 on and off-ramps at SR 202 would be rebuilt and therefore trucks may need to possibly detour and adding delay.
8.3.2.3 Arterials and Local Streets Segment A No truck impacts are expected on the arterial and local streets because light rail construction of the Preferred Alternative A1 would be on the D2 Roadway and the I-90 reversible center roadway. Closing ramps to and from the I-90 reversible center roadway and constructing the Rainier and Mercer Island Stations are not expected to affect trucks along the arterials and local streets.
Segment B Constructing all Segment B alternatives, except the BNSF Alternative (B7), would cause detours and lane closures on arterials and local streets, which could delay truck traffic on Bellevue Way and 112th Avenue SE. However, most of the businesses along each alternative are professional offices that do not rely heavily on trucks.

8.0 Freight Mobility and Access
8.0 Freight Mobility and Access 8-12 East Link Project Final EIS July 2011
Segment C Segment C at-grade (Preferred Alternative C11A and Alternatives C4A and C9A) and tunnel (Preferred Alternative C9T and Alternatives C1T and C2T) alternatives that require substantial cut-and-cover would have similar impacts on freight mobility and access on their construction routes. For these alternatives, traffic detours and lane closures are expected. These might affect trucks and could require temporary alternate business access. Constructing the Alternative C1T along Bellevue Way and NE 6th Street and Alternative C2T along Main Street, 106th Avenue NE, and NE 6th Street would require the largest amount of cut-and-cover tunnel construction. Converting 108th and 110th Avenues NE to one-way operations under Alternative C4A would detour traffic and close lanes that might affect trucks and might temporarily alter business access. Along elevated routes in Segment C, such as Alternative C7E, some impacts are anticipated as a result of lane closures and access restrictions needed the elevated structure construction. For Alternative C8E, impacts could occur along 110th Avenue NE because of lane closures. For any of the Segment C Alternatives, access to the businesses along streets with construction activities would be maintained to the extent possible either through existing or alternative access. Any access closures would be coordinated with the affected businesses.
Segment D In Segment D, loss of parking, construction traffic, and lane closures could affect trucks along portions of NE 16th Street, 136th Place NE, NE 20th Street, 152nd Avenue NE, and NE 24th Street. Each alternative within Segment D would cause temporary detours and lane closures along some of these streets. Alternative D3 is expected to have the longest impact because it includes at-grade and/or retained-cut construction in the median of NE 20th Street and 152nd Avenue NE. This construction would create longer truck impacts than with other alternatives because the other alternatives do not travel along NE 20th Street. Alternative D5 would be built adjacent to SR 520; therefore, the impacts on access, parking, and circulation would be less compared with the other Segment D alternatives. The Preferred Alternative D2A would have the second least impacts on trucks, with impacts mainly along NE 16th Street and 136th Place NE. For the portions of the Segment D and E alternatives adjacent to SR 520, streets that currently provide access to properties would be rebuilt, as appropriate. D2A – NE 24th Design Option and Alternative D2E would have impacts to businesses access along NE 24th Street and 152nd Avenue NE, north of NE 24th Street.
Segment E In Segment E, the potential loss of lanes on Leary Way with Alternative E4 and 161st Avenue NE between Redmond Way and NE 85th Street with the E2 – Redmond Transit Center Design Option could have a slight impact on trucks; otherwise, no significant impacts are expected with the other Segment E alternatives.
8.3.2.4 Maintenance Facilities Each maintenance facility alternative is located within the current industrial areas in Segments D and E, except for the SR 520 Maintenance Facility (MF3), which would be located on a mix of retail and industrial property along NE 20th Street. The SE Redmond Maintenance Facility (MF5) would likely have the least freight-related impacts because it would be surrounded by fewer businesses and located near regional transportation facilities. Overall, the impacts on trucks from constructing the maintenance facility (potential detours and/or lane closures) are considered minimal because construction is expected to occur for about 1 year or less.
8.3.2.5 Rail Freight Rail freight would not be affected in any segment during construction because the only rail line near East Link construction—the former BNSF Railway line in Segments B, C, and D—is closed.
8.4 Potential Mitigation The East Link Project is not expected to require mitigation during operation to improve freight mobility and access because truck routes would be maintained and mobility would be improved with the project.
During East Link construction, adverse truck impacts would likely be associated with delays and restricted access for business deliveries on arterials and local streets near surface construction activities. The cut-and-cover tunnels and stations in Segment C would likely have the greatest impact on nearby businesses in terms of restricted access. To minimize these impacts, Sound Transit would work specifically with affected businesses throughout the construction period to maintain business access as much as possible.

8.0 Freight Mobility and Access
East Link Project Final EIS 8-13 8.0 Freight Mobility and Access July 2011
During East Link construction associated with I-90, SR 520, or I-405, Sound Transit would coordinate with freight stakeholder groups by providing construction information to WSDOT for use in the state’s freight notification system. Sound Transit would provide information in a format required by WSDOT and compensate WSDOT for any direct costs associated with use of the freight notification system for East Link construction.


East Link Project Final EIS 9-1 9.0 Navigable Waterways July 2011
9.0 Navigable Waterways
9.1 Section Overview This section describes the potential impacts on navigable waterways within the study area. The East Link Project would use the reversible center roadway on I-90, a portion of which crosses Lake Washington, the largest navigable waterway within the study area. Other water bodies located within the study area include smaller lakes, streams, and rivers, which except for the Mercer Slough and Sammamish River, are not navigable. The analysis concludes that along I-90 the East Link project would not affect the navigability on Lake Washington. East Link alternatives crossing the Mercer Slough and the Sammamish River would be elevated profiles and would also not affect navigability of these waterways except for short-term periods during construction as described further in this section.
9.2 Affected Environment Lake Washington is the largest navigable waterway in the study area. Most of the waterfront land use on Lake Washington is residential and not for commercial use. Navigation on Lake Washington is restricted to recreational users, and commercial activity is prohibited. However, the Muckleshoot Tribe, as part of the Tribe’s Usual and Accustomed Treaty Rights, conducts a fishing event in July in consultation with the Washington Department of Fish and Wildlife. Public boat launch access is limited to several public parks along the east and west sides of the lake. The King County Sheriff’s Office and the Mercer Island Marine Patrol regulate navigability among recreational users. Boaters can cross under I-90 at two locations on Lake Washington: under the east end of the I-90 floating bridge between Seattle and Mercer Island and under the East Channel Bridge between Mercer Island and Bellevue.
Other water bodies located in the study area include smaller lakes, streams, and river bodies, including Mercer Slough, Mercer Slough East Creek, East Lake Bellevue, Sturtevant Creek, Kelsey Creek, Goff Creek, Sears Creek, Bear Creek, and the Sammamish River. Mercer Slough Nature Park, located in the south Bellevue area of Segment B, is a protected recreational nature park where nonmotorized boating is permitted along Mercer Slough within the park. An I-90 overpass crosses the Mercer Slough East Creek at the southern end of the park. East Lake Bellevue, located near the Overlake Hospital in Segment C, is a small, built water pond entirely surrounded by residential and commercial land uses where boating is prohibited. Kelsey Creek, Sturtevant Creek, and several smaller tributary creeks that are located in Segment D are not navigable. Within Segment E, parts of the Sammamish River and Bear Creek are located adjacent to SR 520 and in urbanized and recreational areas in the City of Redmond. The Sammamish River is navigable to nonmotorized boating types. Table 9-1 lists water bodies in the study area and their navigability.
9.3 Environmental Impacts
9.3.1 Operational Impacts
The roadway changes that occur with the East Link project on the portions of I-90 that cross Lake Washington would not affect navigation on Lake Washington. Impacts on navigability in Segment B are not anticipated, because the Segment B alternatives that travel along Bellevue Way SE (Preferred Alternative B2M and Alternatives B1, B2A, B2E, B3, and B3 - 114th Extension Design Option ) are located outside the navigable waterways of Mercer Slough Nature Park. The elevated profile of Alternative B7, adjacent to the I-90 overpass, would cross Mercer Slough East; however, recreational navigability on the Mercer Slough under I-90 would not be affected by this alternative.

9.0 Navigable Waterways
9.0 Navigable Waterways 9-2 East Link Project Final EIS July 2011
TABLE 9-1 Navigability of Water Bodies within the Study Area
Name Segment Navigability
Lake Washington Segment A, Segment B Navigable to motorized and nonmotorized boating types
Mercer Slough Segment B Navigable to nonmotorized boating types
East Bellevue Lake Segment C Nonnavigable
Sturtevant Creek Segment C Nonnavigable
Kelsey Creek Segment D Nonnavigable
West Tributary of Kelsey Creek Segment D Nonnavigable
Goff Creek Segment D Nonnavigable
Sears Creek Segment D Nonnavigable
Sammamish River Segment E Navigable to nonmotorized boating types
Bear Creek Segment E Nonnavigable
The project alternatives in Segments D and E are not expected to impact navigability on water bodies crossed by these alternatives because most of these water bodies are not navigable. Alternatives that would cross the Sammamish River would be elevated, thus maintaining recreational navigability.
9.3.2 Construction Impacts
Some in-water work is anticipated to occur in Lake Washington along I-90, and some construction work could be conducted from a barge. Neither of these activities would affect lake navigability. Over-water construction of Alternative B7 might result in short durations of restricted recreational boating inside Mercer Slough near and under the Alternative B7 crossing. Similarly, constructing the Preferred Alternative E2, Alternative E1, and Alternative E4 might restrict nonmotorized boating on Sammamish River crossings for short periods.
9.4 Potential Mitigation During East Link operation, no mitigation of impacts on navigable waterways would be required. During construction, Sound Transit would minimize impacts on the navigability of the Mercer Slough (Alternative B7) and the Sammamish River (all Segment E alternatives) waterway crossings by minimizing work from within the waterways. If any barging of construction equipment or materials is required on Lake Washington in July, Sound Transit would consult with the Muckleshoot Indian Tribe to avoid conflict with their tribal fishing event.

East Link Project Final EIS 10-1 10.0 References July 2011
10.0 References
Bay Area Rapid Transit. 2008. 2008 BART Station Profile Study. http://www.bart.gov/about/reports/profile.aspx. Prepared by Corey, Canapary & Galanis Research, San Francisco, California and Bay Area Rapid Transit, Marketing and Research Department, San Francisco, California.
CH2M HILL. 2010. East Link Project Transportation Methods and Assumptions Report. Prepared for Sound Transit, Seattle, Washington. July.
City of Bellevue. 2003. Final Report on the Downtown Plan Update. http://www.bellevuewa.gov/ downtown_planning.htm. City of Bellevue, Planning and Community Development, Washington. June.
City of Bellevue. 2007a. Bel-Red Corridor Project Final Environmental Impact Statement. Bellevue, Washington. July.
City of Bellevue. 2007b. Intersection Accident Data (2004-2006). City of Bellevue, Planning and Community Development, Washington.
City of Bellevue. 2008a. Bel-Red Subarea Plan. http://www.bellevuewa.gov/bel-red_intro.htm. City of Bellevue, Planning and Community Development, Washington.
City of Bellevue. 2008b. City of Bellevue Comprehensive Plan: Volume 2, Subarea Plans and Transportation Facility Plans. City of Bellevue, Planning and Community Development, Washington.
City of Bellevue. 2009. 2009 City of Bellevue Pedestrian and Bicycle Transportation Plan Report. http://www.bellevuewa.gov/pedbikeplan.htm. City of Bellevue, Planning and Community Development, Washington. February.
City of Bellevue. 2010. City of Bellevue Pedestrian and Bicycle Count Report. http://www.bellevuewa.gov/walking_biking.htm. City of Bellevue, Transportation Department, Bellevue, Washington.
City of Mercer Island, City of Bellevue, King County Metro, City of Seattle, and Washington State Highway Commission. 1976. Memorandum Agreement. December 21, 1976.
City of Mercer Island. 2005. Comprehensive Plan of the City of Mercer Island. http://www.mercergov.org/ page.asp?navid=1579. City of Mercer Island, Washington.
City of Mercer Island. 2007. Intersection Accident Data (2004-2006). City of Mercer Island, Washington.
City of Redmond. 2006. City of Redmond Machine Count Report. www.redmond.gov/connectingredmond/ resources/pdfs/redmondmachinecounts.pdf. June 2006. Accessed 2007.
City of Redmond. 2007. Overlake Neighborhood Plan Update and Implementation Project Final Supplemental Environmental Impact Statement.
City of Redmond, 2010. Redmond Transportation Master Plan. City of Redmond, Washington.
City of Seattle, City of Mercer Island, City of Bellevue, King County Metro, Washington State Highway Commission, and Sound Transit. 2004. Amendment to the 1976 I-90 Memorandum Agreement. August 2004.
City of Seattle. 2005. City of Seattle Comprehensive Plan: Toward a Sustainable Seattle. http://www.seattle.gov/dpd/Planning/Seattle_s_Comprehensive_Plan/Overview/. City of Seattle, Department of Planning and Development. Washington.
City of Seattle. 2007. Intersection Accident Data (2004-2006). City of Seattle, Washington.
King County Metro and Sound Transit. 2007. 2020 and 2030 East Link Transit Service Integration Plan.
King County Metro. 2004. Looking to the Future: Six-Year Transit Development Plan for 2002 to 2007. King County Metro, Department of Transportation, Metro Transit Division, Seattle, Washington. November.

10.0 References
10.0 References 10-2 East Link Project Final EIS July 2011
King County Metro. 2007a. Transit bus routes and schedules. www.kingcounty.gov. Accessed September 2006 and February 2007.
King County Metro. 2007b. King County Metro Transit Park-and-Ride Utilization Report, Second Quarter 2007. July 2007.
King County Metro. 2008a. Automatic Passenger Counter Data. Average weekday daily passenger loads across Lake Washington, February 9 through May 30, 2008. February.
King County Metro. 2008b. Personal Communication, Robin Anderson, Senior Transportation Planner, King County Metro. February 25.
King County Metro. 2009. Strategic Plan for Public Transportation 2007-2016. Transit Now. King County Metro, Department of Transportation, Metro Transit Division, Seattle, Washington. November.
Port of Seattle. 2008. Eastside Rail Corridor. http://www.portseattle.org/business/realestate/eastsiderail.shtml. Last accessed September 5, 2008.
PSRC. 2001. Destination 2030. Puget Sound Regional Council, Seattle, Washington.
PSRC. 2004. Central Puget Sound Region High-Capacity Corridor Assessment. Puget Sound Regional Council, Seattle, Washington. August.
PSRC. 2007. Destination 2030 Update: Metropolitan Transportation Plan for the Central Puget Sound Region. Puget Sound Regional Council, Seattle, Washington.
PSRC. 2008. Vision 2040 Final Environmental Impact Statement. 2008 Update. April. http://psrc.org/projects/ vision/index.htm. Accessed May 2009.
PSRC. 2010a. Transportation 2040: Toward a Sustainable Transportation System. Puget Sound Regional Council, Seattle, Washington.
PSRC. 2010b. Transportation Demand Model. Puget Sound Regional Council, Seattle, Washington.
Sound Transit. 1996. The Regional Transit Long-Range Vision. Central Puget Sound Regional Transit Authority, Seattle, Washington.
Sound Transit. 2002. Central Link Light Rail Transit Initial Segment Project Environmental Assessment. Central Puget Sound Regional Transit Authority, Seattle, Washington. February.
Sound Transit. 2006. North Link Final Supplemental Environmental Impact Statement. Central Puget Sound Regional Transit Authority, Seattle, Washington. March.
Sound Transit. 2007a. East Link Transit Integration Plan. Central Puget Sound Regional Transit Authority, Seattle, Washington.
Sound Transit. 2007b. Transit bus routes and schedules. www.soundtransit.org. Accessed September 2006 and February 2007. Central Puget Sound Regional Transit Authority, Seattle, Washington.
Sound Transit. 2007c. Personal Communication. E-mail to CH2M HILL staff transmitting King County Metro passenger load data from 2006. Central Puget Sound Regional Transit Authority, Seattle, Washington. May 15.
Sound Transit. 2007d. Sound Transit 2: The Regional Transit System Plan. Central Puget Sound Regional Transit Authority, Seattle, Washington. May.
Sound Transit. 2010a. Sound Transit Ridership Model. Central Puget Sound Regional Transit Authority, Seattle, Washington.
Sound Transit. 2010b. Downtown Bellevue Light Rail Alternatives Concept Design Report. Central Puget Sound Regional Transit Authority, Seattle, Washington. February.
Sound Transit. 2010c. VISSIM Output for Bellevue, Washington. Central Puget Sound Regional Transit Authority, Seattle, Washington.
Sound Transit. 2011 publication pending. East Link Project Final Environmental Impact Statement. Central Puget Sound Regional Transit Authority, Seattle, Washington.
10.0 References
East Link Project Final EIS 10-3 10.0 References July 2011
TRB. 1996. Integration of Light Rail Transit into City Streets. TCRP Report 17. Transit Cooperative Research Program, Transportation Research Board of the National Academies, Federal Transit Administration, Washington, DC.
TRB. 1999. Light Rail Service, Vehicular and Pedestrian Safety. TCRP Research Results Digest 34. Transit Cooperative Research Program, Transportation Research Board of the National Academies, Federal Transit Administration, Washington, DC. July.
TRB. 2000. Highway Capacity Manual. Transportation Research Board of the National Academies, Federal Transit Administration, Washington, DC.
TRB. 2003. TCRP Report 100: Transit Capacity and Quality of Service Manual. 2nd Edition. Transit Cooperative Research Program, Transportation Research Board of the National Academies, Federal Transit Administration, Washington, DC.
TRB. 2009. Light Rail Vehicle Collisions with Vehicles at Signalized Intersections: A Synthesis of Transit Practice. TCRP Synthesis 79. Transit Cooperative Research Program, Transportation Research Board of the National Academies, Federal Transit Administration. Washington DC.
Tri-Met. 1996. Banfield LRT Station Mode of Access Survey.
USDOT, FTA, and Sound Transit. 2002. Central Link Light Rail Transit Project Environmental Assessment Initial Segment. U.S. Department of Transportation, Federal Transit Administration, and Sound Transit. February.
Washington State Legislative Transportation Committee. 1995. Resolution 516. March 16, 1995.
WSDOT and FHWA. 2010. SR 520, I-5 to Medina: Bridge Replacement and HOV Project Supplemental Draft Environmental Impact Statement and Section 4(f)/6(f) Evaluation. Washington State Department of Transportation, Olympia, Washington, and the Federal Highway Administration, Washington, DC. January.
WSDOT. 2002. I-90 Two Way Transit and HOV Operations Project Transportation Discipline Report. Prepared by HNTB Corporation and Mirai Associates. Prepared for Washington State Department of Transportation, Olympia, Washington. November.
WSDOT. 2004. I-90 Two Way Transit and HOV Operations Project Final Environmental Impact Statement. http://www.wsdot.wa.gov/Projects/I90/TwoWayTransit/. Washington State Department of Transportation, Olympia, Washington. May 21.
WSDOT. 2005. Washington Transportation Plan Update: Freight Movement. Washington State Department of Transportation, Olympia, Washington. December.
WSDOT. 2006. Interstate 90 Center Roadway Study. Washington State Department of Transportation, Olympia, Washington. December.
WSDOT. 2007a. 2006 Roadway Average Daily Traffic Volume Data. http://www.wsdot.wa.gov/Northwest/ Traffic Volume/RampAndRoadway2006.htm. Accessed 2007. Washington State Department of Transportation, Olympia, Washington.
WSDOT. 2007b. Accident data (2004-2006). Washington State Department of Transportation, Olympia, Washington.
WSDOT. 2008a. WSDOT 95 Percent Reliable Travel Times. www.wsdot.wa.gov/Traffic/Seattle/TravelTimes/ reliability. Accessed September 5, 2008. Washington State Department of Transportation, Olympia, Washington.
WSDOT. 2008b. SR 519 Intermodal Access Project Phase 2: Atlantic Corridor Final Environmental Assessment. http://www.wsdot.wa.gov/projects/sr519/sr+519+internodal/. Washington State Department of Transportation, Olympia, Washington.
WSDOT. 2009a. Accident data (2004-2008). Washington State Department of Transportation, Olympia, Washington.
WSDOT. 2009b. Washington State Bicycle and Pedestrian Documentation Project 2009. http://www.wsdot.wa.gov/ bike/count.htm. Prepared by Cascade Bicycle Club, Seattle, Washington. Prepared for Washington State Department of Transportation, Olympia, Washington. December.