7 geographic patterns of crime in england and wales 2009/10 7.2 introduction this chapter presents...
TRANSCRIPT

7 Geographic patterns of crime
Neil Higgins, Paul Robb and Andrew Britton
7.1 SUMMARY
Both the British Crime Survey (BCS) and police recorded crime data indicate that crime is not evenly distributed across England and Wales.
• The 2009/10 BCS found that the risk of being a victim of any household crime was higher in the most deprived areas compared with the least deprived areas in England. Trends in household crime in the most and least deprived areas in England have been broadly similar between 2001/02 and 2009/10, with the exception of trends in burglary. There has been a statistically significant reduction in levels of burglary in the most deprived areas since 2001/02 but no significant change in the least deprived areas.
• As in previous years, the 2009/10 BCS found that the risk of being a victim of any household crime was higher in urban areas than in rural areas. Trends in household crime have been broadly similar in urban and rural areas in England and Wales since 2001/02.
• Police recorded crime figures for England in 2009/10 show that crime rates were higher in areas classified as predominantly urban, than in areas that were classified as predominantly rural.
Variation at regional level shows:
• London was the region with the highest rates of total recorded crime, violence against the person, offences against vehicles and other theft offences. This region also had a higher BCS risk of personal crime than for England and Wales overall.
• The East of England region had the lowest rates of overall recorded crime, violence against the person and amongst the lowest rates of burglary and offences against vehicles.
• In Wales BCS risk of personal and household crime was lower than for England and Wales overall.
Geographic patterns and concentrations of crime varied by crime type.
• Sixty-two per cent of robberies in England and Wales were recorded by just three forces, the Metropolitan Police, Greater Manchester and the West Midlands, that comprise 24 per cent of the population.
• Fifty-four per cent of the total of selected serious offences involving a knife1 were recorded by these same three forces. In more urban forces knives were involved in a greater proportion of recorded serious offences than was the case in more rural forces.
1 Total of selected serious offences only includes the five offence types: Attempted Murder; Threats to Kill; ABH and GBH; Robbery; Rape and Sexual assaults, as shown in Table 7.14. In this table 'offences involving a knife' refers to the use of a knife or sharp instrument. There are other offences not covered by these offence types which may include the use of a knife or sharp instrument.
165

Crime in England and Wales 2009/10
7.2 INTRODUCTION
This chapter presents variations in crime by type of area (including rural and urban areas and by differing levels of deprivation) and by region and police force area. Information is also presented on detections and perceptions of crime and anti-social behaviour by region and police force area.
There are differences in the way that crimes are geographically recorded by the police and the BCS. The BCS crime count is based on the home location of the victim irrespective of where in England and Wales the crime actually took place2. Police recorded crime, however, relates to the location of the incident.
Rates of police recorded crime in London and other cities will be affected by the size of the day-time population relative to the resident population. Therefore rates of crimes expressed on a residents basis will tend to be inflated in such areas. Conversely, commuter areas where the day-time population is lower than the resident population may understate actual rates of crime.
Analysis of BCS crime by type of area focuses on BCS household crimes (burglary, vandalism and vehicle-related theft) which are more likely to take place in or around the victim’s residence than personal crimes which may occur elsewhere.
7.3 CRIME IN THE MOST AND LEAST DEPRIVED AREAS
Consistent with previous years, the 2009/10 BCS shows the risk of being a victim of any household crime was higher for households living in the most deprived areas compared with those in the least deprived areas in England3 (19% compared with 14%, Figure 7.1).
• In the most deprived areas, the risk of households being victims of vandalism is eight per cent as compared with six per cent in the least deprived areas.
• In the most deprived areas, the risk of households being victims of vehicle-related theft is seven per cent as compared with five per cent in the least deprived areas.
• In the most deprived areas the risk of households being victims of burglary is three per cent as compared with one per cent in the least deprived areas
2 The main BCS crime count excludes crimes that occurred outside of England and Wales, e.g. while abroad on holiday. 3 This analysis is restricted to England as the Index of Multiple Deprivation (IMD) does not cover Wales where a separate Index is used and is based on the employment deprivation domain. See Section 7 of the User Guide to Home Office Crime Statistics for details of the IMD.
166

Geographic patterns of crime
Figure 7.1 Risk of crime by level of deprivation in England, 2009/10 BCS
19.2
7.77.0
3.3
16.5
6.8
5.6
2.3
14.4
5.65.0
1.5
0
4
8
12
16
20
24
All household Vandalism Vehicle-related theft Burglary
Perc
enta
ge v
ictim
s on
ce o
r mor
e
20 % most deprived All areas 20% least deprived
Trends in BCS household crime by level of deprivation are presented from 2001/02 onwards4 (Table 7.01). Trends in the rates for component parts of BCS household crime in the most and least deprived areas in England have been broadly similar between 2001/02 and 2009/10, with the exception of trends in burglary (Figure 7.2). While there have been large falls in burglary rates in the most deprived areas since 2001/02 (with the most notable fall occurring between 2003/04 and 2004/05), rates have remained broadly flat in the least deprived areas. Despite this difference in trends, the 2009/10 BCS rate of burglary remained higher in the most deprived areas (464 burglaries per 10,000 households) compared with the least deprived areas in England (a rate of 161 per 10,000).
Figure 7.2 Trends in incidence rates of burglary by level of deprivation in England, 2001/02 to 2009/10 BCS
0
300
600
900
2001/02 2002/03 2003/04 2004/05 2005/06 2006/07 2007/08 2008/09 2009/10
Rat
es p
er 1
0,00
0 ho
useh
olds
All areas 20% most deprived 20% least deprived 4 BCS trends are presented from 2001/02 as this is the year the BCS became continuous and the sample expanded. Prior to 2001/02 the BCS ran at approximately two year intervals See Section 2 of the User Guide for details.
167

Crime in England and Wales 2009/10
7.4 CRIME IN URBAN AND RURAL AREAS
This section presents an analysis of crime in urban and rural areas for BCS and police recorded crime data5.
As in previous years, the 2009/10 BCS found that the risk of being a victim of any household crime was higher in urban areas than rural areas (18% compared with 12%, Figure 7.3) and this is shown for each of the main household crime types.
• Seven per cent had experienced vandalism compared with five per cent in rural areas.
• Six per cent had been victims of vehicle-related theft compared with three per cent in rural areas
• Three per cent of households in urban areas had been victims of burglary compared with one per cent in rural areas.
Within the 2009/10 BCS sample, the weighted proportion of households that are resident in urban areas was 79 per cent with 21 per cent in rural areas.
Figure 7.3 Risk of crime in urban and rural areas, 2009/10 BCS
17.6
7.2
6.2
2.5
16.4
6.7
5.6
2.2
12.0
4.7
3.5
1.1
0
4
8
12
16
20
All household Vandalism Vehicle-related theft Burglary
Perc
enta
ge v
ictim
s on
ce o
r mor
e
Urban All areas Rural
Trends in BCS household crime in urban and rural areas are presented from 2001/02 onwards6 (Table 7.02). Trends in BCS household crime incidence rates have been broadly similar in urban and rural areas in England and Wales see Section 7 of the User Guide for details of the urban/rural classification. Levels of BCS household crime have decreased by 30 per cent in urban areas and 26 per cent in rural areas between the 2001/02 and 2009/10 surveys (Figure 7.4). Burglary, vehicle-related theft and vandalism have shown similar trends in both urban and rural areas, with decreases in all three crime types (Table 7.02).
5 For BCS analysis, the National Statistics rural/urban definition for output areas has been used. For police recorded crime analysis, the National Statistics rural/urban LA classification has been used, which is restricted to England as the classification does not cover Wales. See Section 7 of the User Guide for details. 6 BCS trends are presented from 2001/02 as this is the year the BCS became continuous and the sample expanded. Prior to 2001/02 the BCS ran at approximately two year intervals See Section 2 of the User Guide for details.
168

Geographic patterns of crime
Figure 7.4 Trends in incidence rates of BCS household crime in urban and rural areas, 2001/02 to 2009/10
0
1,500
3,000
4,500
2001/02 2002/03 2003/04 2004/05 2005/06 2006/07 2007/08 2008/09 2009/10
Rat
e pe
r 10,
000
hous
ehol
ds
All areas Urban Rural
Police recorded crime figures for England in 2009/10 show that crime rates were higher in areas classified as predominantly urban, than in areas that were classified as predominantly rural. This is observed at both the police force area level (Table 7.03) and the Community Safety Partnership7 level (Table 7.04). In this section, the analysis is presented at the Community Safety Partnership level, as the more detailed geography enables a greater distinction between rural and urban areas8. Recorded crime rates in urban and rural Community Safety Partnerships varied by offence group type (Figure 7.5, Table 7.04). For all offence groups, recorded crime rates were higher in areas classified as predominantly urban than in areas that were classified as predominantly rural. The differences in crime rates between areas classified as predominantly urban and predominantly rural were highest for robbery offences. Predominantly rural, significant rural and predominantly urban Community Safety Partnerships comprise 24 per cent, 14 per cent and 62 per cent of the population in England respectively. Trends in recorded crime rates in urban and rural areas are detailed in Tables 7.04 and 7.05 and illustrated for offences against vehicles, burglary and violence against the person in Figures 7.6 to 7.8. Trends are presented from 2002/03 onwards9. The trends in levels of recorded crime for these offence groups were similar for areas that were classified as predominantly rural, significant rural and predominantly urban. For burglary and offences against vehicles there is some evidence of a narrowing of the disparity in crime rates between urban and rural areas.
7 Set up under the Crime and Disorder Act 1998 and are, in nearly all cases, coterminous with local authority areas See section 7 of the User Guide for details. 8 For example, Northumbria Police is classified as a predominantly urban force but in 2009/10 it contained six Community Safety Partnerships, five of which are classified as predominantly urban (Newcastle upon Tyne, North Tyneside, South Tyneside, Sunderland) and one classified as predominantly rural (Northumberland County). 9 Recorded crime trends are presented from 2002/03 as the National Crime Recording Standard was introduced in April 2002. Figures before and after that date are not directly comparable See Section 3 of the User Guide for details.
169

Crime in England and Wales 2009/10
Figure 7.5 Recorded crime rates per 10,000 population by Community Safety Partnership rural/urban classification, 2009/10
99
72
68
55
121
17
118
21
8
131
8 5
85
70
155
23
135
27
10
186
1221
116109
220
34
159
53
15
0
50
100
150
200
Violenceagainst the
person
Sexualoffences
Robbery Burglary Offencesagainstvehicles
Other theftoffences
Fraud andforgery
Criminaldamage
Drugoffences
Otheroffences
Rat
e pe
r 10,
000
popu
latio
n
Predominantly rural Significant rural Predominantly urban Figure 7.6 Trends in recorded crime rates for offences against vehicles by Community Safety Partnership rural/urban classification, 2002/03 to 2009/10
0
50
100
150
200
250
300
2002/03 2003/04 2004/05 2005/06 2006/07 2007/08 2008/09 2009/10
Rat
e pe
r 10,
000
popu
latio
n
Predominantly rural Significant rural Predominantly urban
170

Geographic patterns of crime
Figure 7.7 Trends in recorded crime rates for burglary by Community Safety Partnership rural/urban classification, 2002/03 to 2009/10
0
50
100
150
200
250
2002/03 2003/04 2004/05 2005/06 2006/07 2007/08 2008/09 2009/10
Rat
e pe
r 10,
000
popu
latio
n
Predominantly rural Significant rural Predominantly urban Figure 7.8 Trends in recorded crime rates for violence against the person by Community Safety Partnership rural/urban classification, 2002/03 to 2009/10
0
50
100
150
200
250
2002/03 2003/04 2004/05 2005/06 2006/07 2007/08 2008/09 2009/10
Rat
e pe
r 10,
000
popu
latio
n
Predominantly rural Significant rural Predominantly urban
171

Crime in England and Wales 2009/10
7.5 VARIATIONS IN CRIME BY ENGLISH REGIONS, WALES AND POLICE FORCE AREAS
Tables 7.05 to 7.12 present a summary of police recorded crime and BCS figures for the English Government Office Regions, Wales and for each police force area. A supplementary factsheet on crime in Wales is also released as a companion to this volume and can be found at:
http://www.homeoffice.gov.uk/rds/pdfs10/wales10.pdf (English language version)
http://www.homeoffice.gov.uk/rds/pdfs10/walescymru10.pdf (Welsh language version)
Care should be taken when comparing crime rates at sub-national level as some of the differences between areas are likely to reflect variations in the composition of those areas, for example in the degree of urbanisation, level of deprivation and the balance between day-time and resident population. However, some clear patterns are evident and these are highlighted below.
Crime by English Government Office Region
Police recorded crime figures for 2009/10 show:
• London was the region with the highest rates of total recorded crime, violence against the person, robbery, offences against vehicles, fraud and forgery, drug offences and other theft offences.
• The East of England region had the lowest rates of overall recorded crime, violence against the person and amongst the lowest rates of burglary and offences against vehicles.
According to the 2009/10 BCS, the risk of household and personal crime was similar to the overall figures for England and Wales in the majority of the English regions. There were a few exceptions:
• In the London region, risk of personal crime was significantly higher than for England and Wales overall.
• In Wales risk of personal and household crime was significantly lower than for England and Wales overall.
• In the West Midlands region, risk of household crime was significantly lower than for England and Wales overall.
Crime and detections by police force area
The regional crime rates, shown in Tables 7.05 to 7.12, mask further variation at the more local level as crime tends to be geographically concentrated in smaller areas. For example, this is particularly the case for robberies and knife-related offences.
• Sixty-two per cent of robberies in England and Wales were recorded by just three forces, the Metropolitan Police, Greater Manchester and the West Midlands, that comprise 24 per cent of the population.
Tables 7.13 and 7.14 presents a summary of knife and sharp instrument offences recorded by the police for selected offences, for each police force area, English region and Wales, in 2008/09 and 2009/10. Generally, in urban forces a greater proportion of recorded serious offences involve knives than in the more rural forces, with Greater Manchester, Merseyside, West Midlands and the Metropolitan Police being the only forces to record more than eight per cent of such offences involving the use of a knife.
172

Geographic patterns of crime
• Fifty-four per cent of the total of selected serious offences involving a knife10 were recorded by just three forces, comprising 24 per cent of the population: the Metropolitan Police, Greater Manchester and the West Midlands.
Tables 7.15, 7.16 and 7.17 contain a summary of detection rates by method of detection, sanction detection rates for individual offence groups and sanction detection rates over time. Sanction detection rates show some differences between forces (Tables 7.15, 7.16 and 7.17). However, these figures need to be interpreted with care. Sanction detection rates vary a great deal between offence types, so any change in the ‘crime mix’ affects the overall rate of detection (see Chapter 6 for more information).
Perceptions of crime and the police by police force area A detailed analysis of key perception measures by socio-demographic characteristics can be found in Chapter 5. For reference, Tables 7.18 to 7.21 provide breakdowns by police force area for the key perception measures.
10 Total of selected serious offences only includes the five offence types: Attempted Murder; Threats to Kill; ABH and GBH; Robbery; Rape and Sexual assaults, as shown in Table 7.14. In this table 'offences involving a knife' refers to the use of a knife or sharp instrument. Other offences exist that are not shown in this table that may include the use of a knife or sharp instrument.
173

Crime in England and Wales 2009/10
Box 7.1 Sources of Home Office crime dataIn addition to the information provided in this report, tables showing recorded crime figures for the Community Safety Partnerships (CSPs) in England and Wales, for police Basic Command Units (BCUs – see Section 7 of the User Guide to Home Office Crime Statistics) and police force areas are available online at:
http://www.homeoffice.gov.uk/rds/crimeew0910.html
Interactive maps of local authority level police recorded crime data are available on the Home Office website at: http://www.homeoffice.gov.uk/rds/soti.html
This website also allows users to tabulate crime data and to download the results (Figure 7.9).
Figure 7.9 Interactive maps of local authority level police recorded crime data on theHome Office website
Police forces have made more detailed monthly local crime data available to the public on their own websites.
In addition, the National Policing Improvement Agency (NPIA) have produced a new interactive national map giving the public access to local statistics and details on neighbourhood policing in their area: http://maps.police.uk/
Her Majesty's Inspectorate of Constabulary (HMIC) have also published official crime and anti-social behaviour figures together with independent and professional assessments of police forces and police authorities on their website:
http://www.hmic.gov.uk/PoliceReportCard/Pages/home.aspx
174

Rate per 10,000 households in England England, BCS2001/02 2002/03 2003/04 2004/05 2005/06 2006/07 2007/08 2008/09 2009/10
All householdAll areas 3,610 3,480 3,264 3,000 2,953 3,043 2,751 2,866 2,55020% most deprived 4,651 4,285 4,149 3,619 3,895 3,847 3,696 3,787 3,22720% least deprived 2,710 2,780 2,290 2,308 2,258 2,554 2,102 2,415 1,991
VandalismAll areas 1,197 1,157 1,117 1,134 1,191 1,282 1,141 1,175 1,03420% most deprived 1,538 1,287 1,330 1,300 1,470 1,584 1,478 1,569 1,26820% least deprived 862 914 763 855 910 1,071 886 944 766
Vehicle-related theft1
All areas 1,513 1,418 1,257 1,078 962 927 826 810 66820% most deprived 2,213 2,053 1,828 1,476 1,509 1,294 1,267 1,090 89320% least deprived 1,146 1,072 863 772 746 779 562 688 571
BurglaryAll areas 453 450 435 337 321 312 314 317 28720% most deprived 810 779 758 539 516 466 508 522 46420% least deprived 235 286 222 214 212 260 219 252 161
Unweighted base 2
All areas 23,022 25,803 27,075 32,535 34,631 32,277 34,030 33,548 32,52020% most deprived 3,312 3,931 3,902 4,547 4,707 4,358 4,763 4,757 4,66520% least deprived 5,356 6,000 6,621 7,780 8,157 7,710 8,016 7,919 7,6891. Rates for vehicle-related theft are based on vehicle-owning households only.2. Unweighted bases refer to rates of vehicle-related theft. Other bases will be slightly higher.
Rate per 10,000 households England & Wales, BCS2001/02 2002/03 2003/04 2004/05 2005/06 2006/07 2007/08 2008/09 2009/10
All householdAll areas 3,586 3,428 3,217 2,978 2,939 3,038 2,732 2,829 2,525Urban 3,877 3,682 3,484 3,228 3,181 3,289 2,983 3,075 2,728Rural 2,395 2,398 2,205 2,042 1,951 2,034 1,713 1,889 1,762
VandalismAll areas 1,185 1,145 1,104 1,125 1,182 1,281 1,141 1,160 1,024Urban 1,305 1,227 1,201 1,211 1,276 1,384 1,240 1,254 1,097Rural 694 812 736 799 799 867 742 800 750
Vehicle-related theft1
All areas 1,512 1,399 1,239 1,068 957 925 814 805 668Urban 1,667 1,527 1,374 1,199 1,084 1,042 923 904 749Rural 985 958 808 650 513 533 436 485 415
BurglaryAll areas 441 439 422 331 317 311 312 312 280Urban 496 490 480 369 344 341 352 359 322Rural 214 235 204 191 209 191 149 129 125
Unweighted base 2
All areas 25,022 28,106 29,404 35,378 38,016 37,526 37,487 36,882 35,618Urban 18,616 20,636 21,133 25,009 27,612 27,166 26,892 26,264 25,279Rural 6,406 7,470 8,271 10,369 10,404 10,360 10,595 10,618 10,3391. Rates for vehicle-related theft are based on vehicle-owning households only.2. Unweighted bases refer to rates of vehicle-related theft. Other bases will be slightly higher.
Table 7.01 Trends in BCS household incidence rates by level of deprivation in England, 2001/02 to 2009/10
Table 7.02 Trends in BCS household incidence rates in urban and rural areas, 2001/02 to 2009/10
175

Rate per 10,000 population England, Recorded Crime2002/03 2003/04 2004/05 2005/06 2006/07 2007/08 2008/09 2009/10
Violence against the personPredominantly rural 134 145 158 152 147 136 123 121Significant rural 140 167 181 182 185 171 158 151Predominantly urban 182 204 221 224 214 193 182 174All areas 159 182 197 198 193 177 164 158
Sexual offencesPredominantly rural 9 10 10 11 9 9 8 9Significant rural 10 11 12 11 11 10 10 10Predominantly urban 13 13 13 12 11 10 10 11All areas 11 12 12 12 11 10 9 10
RobberyPredominantly rural 6 5 4 4 5 4 4 4Significant rural 11 11 9 9 9 8 8 7Predominantly urban 35 32 29 31 32 26 24 23All areas 22 20 18 19 19 16 15 14
BurglaryPredominantly rural 125 111 94 88 85 77 78 71Significant rural 147 138 116 109 104 98 98 90Predominantly urban 209 187 152 145 138 129 126 117All areas 173 158 130 123 118 110 109 100
Offences against vehiclesPredominantly rural 136 118 99 93 91 78 70 57Significant rural 180 164 138 131 126 107 96 79Predominantly urban 248 224 184 179 171 146 131 110All areas 206 187 154 149 142 122 109 90
Other theft offencesPredominantly rural 204 200 190 187 180 171 164 155Significant rural 219 219 208 208 204 192 187 176Predominantly urban 294 286 265 257 241 227 214 207All areas 253 249 233 228 218 206 197 187
Fraud and forgeryPredominantly rural 40 39 35 30 24 20 17 16Significant rural 55 53 47 40 38 29 29 26
Predominantly urban 79 76 65 53 42 33 35 34All areas 64 62 54 45 38 29 30 28
Criminal damagePredominantly rural 191 206 206 204 207 185 165 139Significant rural 191 214 211 208 212 186 166 142Predominantly urban 236 249 241 236 229 196 175 150All areas 212 229 225 221 219 190 170 146
Drug offencesPredominantly rural 21 22 22 24 23 26 27 26Significant rural 19 20 21 24 26 29 29 29Predominantly urban 34 33 33 43 48 58 61 57All areas 27 26 27 33 36 42 44 42
Other offencesPredominantly rural 10 10 10 12 11 11 11 11Significant rural 10 10 10 12 12 11 11 11Predominantly urban 14 15 14 17 17 15 15 15All areas 12 12 12 14 14 13 13 13
All offencesPredominantly rural 876 867 829 804 783 716 667 609Significant rural 981 1,008 953 936 926 839 792 720Predominantly urban 1,344 1,320 1,217 1,198 1,143 1,033 975 897All areas 1,139 1,137 1,061 1,042 1,009 914 861 788
5. Predominantly rural, significant rural and predominantly urban forces comprise 14 per cent, 39 per cent and 47 per cent of the population in England respectively.
2. Predominantly rural forces are Cambridgeshire, Cumbria, Devon and Cornwall, Durham, Lincolnshire, Norfolk, North Yorkshire, Suffolk and Wiltshire.
Table 7.03 Trends in recorded crime in urban and rural police force areas, 2002/03 to 2009/10
3. Significant rural forces are Avon and Somerset, Bedfordshire, Cheshire, Derbyshire, Dorset, Essex, Gloucestershire, Hampshire, Humberside, Kent, Leicestershire, Northamptonshire, Staffordshire, Sussex, Thames Valley, Warwickshire, and West Mercia.4. Predominantly urban forces are Cleveland, Greater Manchester, Hertfordshire, Lancashire, City of London, Merseyside, Metropolitan Police, Northumbria, Nottinghamshire, South Yorkshire, Surrey, West Midlands and West Yorkshire.
1. The National Statistics rural/urban LA classification has been used, which is restricted to England as the classification does not cover Wales. See Section 7 of the User Guide to Home Office Crime Statistics for details.
176

Rate per 10,000 population England, Recorded Crime2002/03 2003/04 2004/05 2005/06 2006/07 2007/08 2008/09 2009/10
Violence against the personPredominantly rural 103 118 124 123 125 113 105 99Significant rural 116 148 160 164 162 150 135 131Predominantly urban 190 214 233 235 227 207 194 186All areas 159 182 197 198 193 176 164 157
Sexual offencesPredominantly rural 7 8 8 8 8 7 7 7Significant rural 9 10 10 10 9 8 7 8Predominantly urban 13 14 14 14 12 11 11 12All areas 11 12 12 12 11 10 9 10
RobberyPredominantly rural 4 3 3 3 3 3 3 2Significant rural 7 7 5 6 6 5 5 5Predominantly urban 32 29 26 28 29 24 22 21All areas 22 20 18 19 19 16 15 14
BurglaryPredominantly rural 116 104 88 81 78 73 74 68Significant rural 138 131 105 99 96 90 91 85Predominantly urban 203 185 152 145 138 128 126 116All areas 173 158 130 123 118 110 109 100
Offences against vehiclesPredominantly rural 117 107 90 85 81 72 65 55Significant rural 158 145 117 109 108 92 84 70Predominantly urban 251 226 188 182 174 148 131 109All areas 206 186 154 149 142 122 109 90
Other theft offencesPredominantly rural 153 150 143 140 140 132 128 121Significant rural 191 192 181 182 181 169 164 155Predominantly urban 304 297 278 272 255 241 230 220All areas 252 248 232 227 217 205 196 187
Fraud and forgeryPredominantly rural 33 33 31 26 24 19 19 17Significant rural 48 50 44 37 36 25 26 23
Predominantly urban 80 75 65 53 44 34 36 34All areas 64 62 54 44 38 29 30 28
Criminal damagePredominantly rural 153 168 170 167 172 153 136 118Significant rural 182 206 203 204 204 179 158 135Predominantly urban 242 258 251 246 241 207 186 159All areas 212 229 225 221 219 190 170 146
Drug offencesPredominantly rural 16 16 17 18 18 21 21 21Significant rural 19 19 19 22 22 25 27 27Predominantly urban 32 32 32 41 46 54 56 53All areas 27 26 27 33 36 42 44 42
Other offencesPredominantly rural 8 8 8 9 9 8 8 8Significant rural 8 9 9 11 11 10 10 10Predominantly urban 14 15 14 17 16 15 15 15All areas 12 12 12 14 14 13 13 13
All offencesPredominantly rural 709 716 681 660 658 600 566 516Significant rural 875 916 854 843 835 754 708 650Predominantly urban 1,362 1,346 1,254 1,232 1,182 1,069 1,008 923All areas 1,138 1,136 1,061 1,040 1,008 913 860 788
Table 7.04 Trends in recorded crime in urban and rural Community Safety Partnerships, 2002/03 to 2009/10
1. The National Statistics rural/urban LA classification has been used, which is restricted to England as the classification does not cover Wales. See Section 7 of the User Guide to Home Office Crime Statistics for details.2. Predominantly rural, significant rural and predominantly urban Community Safety Partnerships comprise 24 per cent, 14 per cent and 62 per cent of the population in England respectively.
177

Table 7.05 Recorded crime by offence group by police force area, English region and Wales, 2009/10
Numbers England and Wales, 2009/10 Recorded crimePolice force area, English region and Wales
Total Violence against
the person
Sexual offences
Robbery Burglary Offences against
vehicles 1
Other theft
offences
Fraud and
forgery
Criminal damage
Drug offences
Other offences
Cleveland 47,255 9,320 599 286 5,542 4,088 11,513 807 11,183 2,972 945Durham 40,423 6,696 417 162 5,620 4,556 8,965 737 10,856 1,504 910Northumbria 89,700 16,837 1,148 572 9,481 8,624 21,540 2,425 22,551 4,714 1,808North East Region 177,378 32,853 2,164 1,020 20,643 17,268 42,018 3,969 44,590 9,190 3,663
Cheshire 67,032 13,448 704 429 8,671 7,117 16,635 2,018 13,800 3,022 1,188Cumbria 28,333 6,616 397 45 2,476 2,012 6,429 650 7,432 1,703 573Greater Manchester 246,416 42,041 2,927 5,966 36,071 33,921 52,114 9,271 48,779 10,883 4,443Lancashire 107,361 22,264 1,379 690 11,895 10,059 25,741 3,123 25,139 5,234 1,837Merseyside 107,730 17,493 923 1,627 14,003 11,281 19,820 2,698 23,461 14,744 1,680North West Region 556,872 101,862 6,330 8,757 73,116 64,390 120,739 17,760 118,611 35,586 9,721
Humberside 80,663 16,666 1,162 613 11,571 7,606 19,566 1,808 17,852 2,417 1,402North Yorkshire 42,197 7,806 571 202 5,439 3,965 11,905 1,099 8,707 1,822 681South Yorkshire 112,869 17,750 931 1,015 16,710 16,260 25,338 3,274 24,850 5,350 1,391West Yorkshire 197,553 31,375 2,087 2,740 37,198 25,762 42,505 5,813 38,692 7,772 3,609Yorkshire and the Humber Region 433,282 73,597 4,751 4,570 70,918 53,593 99,314 11,994 90,101 17,361 7,083
Derbyshire 68,005 14,297 1,106 840 9,016 7,373 15,513 2,104 14,635 2,297 824Leicestershire 81,244 18,019 1,056 1,037 10,792 8,430 18,781 3,150 15,019 3,522 1,438Lincolnshire 46,927 8,474 597 212 5,820 4,172 12,927 1,108 11,070 1,593 954Northamptonshire 55,168 10,079 686 774 7,724 6,721 12,575 2,250 11,827 1,730 802Nottinghamshire 98,319 18,305 1,281 1,930 14,514 11,734 22,179 2,608 19,993 4,060 1,715East Midlands Region 349,663 69,174 4,726 4,793 47,866 38,430 81,975 11,220 72,544 13,202 5,733
Staffordshire 76,137 19,748 1,057 703 8,432 7,016 16,011 2,704 16,610 2,637 1,219Warwickshire 33,828 5,302 436 280 5,523 4,740 7,860 848 6,458 1,645 736West Mercia 71,291 13,858 1,093 468 9,172 8,371 17,250 2,446 14,568 2,648 1,417West Midlands 211,399 47,396 3,056 7,241 30,211 27,794 37,413 7,609 37,486 9,291 3,902West Midlands Region 392,655 86,304 5,642 8,692 53,338 47,921 78,534 13,607 75,122 16,221 7,274
Bedfordshire 42,048 7,650 434 714 6,350 5,709 9,887 1,223 8,029 1,381 671Cambridgeshire 60,017 10,458 755 702 7,699 6,329 17,244 1,958 11,519 2,355 998Essex 104,796 21,261 1,266 1,096 13,875 12,650 24,493 3,843 20,589 4,056 1,667Hertfordshire 70,001 11,594 673 645 8,437 8,446 18,287 3,059 12,824 4,902 1,134Norfolk 44,692 9,117 626 305 4,809 4,234 11,874 859 10,440 1,830 598Suffolk 46,447 10,117 737 247 5,341 4,052 11,608 1,201 10,419 1,822 903East of England Region 368,001 70,197 4,491 3,709 46,511 41,420 93,393 12,143 73,820 16,346 5,971
London, City of 6,532 796 41 43 303 150 3,571 446 263 833 86Metropolitan Police 828,752 174,715 9,976 33,463 92,765 102,553 210,084 38,183 88,263 66,827 11,923London Region 835,284 175,511 10,017 33,506 93,068 102,703 213,655 38,629 88,526 67,660 12,009
Hampshire 142,261 33,765 2,105 1,080 14,279 12,899 36,268 4,947 28,609 6,226 2,083Kent 106,727 21,410 1,387 855 12,439 11,759 26,538 4,022 22,719 4,174 1,424Surrey 64,329 13,880 772 420 8,176 7,335 14,044 2,882 13,047 2,490 1,283Sussex 101,200 19,889 1,425 936 10,193 9,800 27,516 4,128 20,964 4,578 1,771Thames Valley 185,705 39,998 2,359 2,187 22,175 23,292 45,492 10,254 30,300 7,330 2,318South East Region 600,222 128,942 8,048 5,478 67,262 65,085 149,858 26,233 115,639 24,798 8,879
Avon and Somerset 125,899 26,780 1,579 1,777 17,205 13,518 31,171 3,850 23,034 5,484 1,501Devon and Cornwall 92,705 20,424 1,597 427 9,270 8,426 21,237 2,536 21,932 4,993 1,863Dorset 48,237 9,777 810 218 5,424 4,786 13,119 1,568 9,972 1,718 845Gloucestershire 38,270 7,324 563 207 5,525 4,168 9,469 1,078 7,477 1,775 684Wiltshire 38,671 8,086 624 255 4,803 3,709 9,978 1,090 8,423 1,239 464South West Region 343,782 72,391 5,173 2,884 42,227 34,607 84,974 10,122 70,838 15,209 5,357
ENGLAND 4,057,139 810,831 51,342 73,409 514,949 465,417 964,460 145,677 749,791 215,573 65,690
Dyfed-Powys 22,377 5,256 406 36 1,798 1,606 4,681 607 4,953 2,648 386Gwent 50,842 9,401 602 249 7,385 7,772 9,680 1,517 11,428 2,163 645North Wales 44,919 12,073 593 121 4,427 3,327 9,615 1,130 10,223 2,520 890South Wales 103,253 19,757 862 605 11,440 14,413 23,284 2,528 22,719 6,186 1,459WALES 221,391 46,487 2,463 1,011 25,050 27,118 47,260 5,782 49,323 13,517 3,380
British Transport Police 60,074 14,394 704 681 656 2,443 25,761 889 7,606 5,908 1,032
ENGLAND AND WALES 4,338,604 871,712 54,509 75,101 540,655 494,978 1,037,481 152,348 806,720 234,998 70,102
2. Numbers of recorded crimes will be affected by changes in reporting and recording.
Numbers
1. Includes theft of motor vehicle, theft from a vehicle, aggravated vehicle taking and interfering with a motor vehicle.
178

Percentage change England and Wales, Recorded crimePolice force area, English region and Wales
Total Violence against
the person
Sexual offences
Robbery Burglary Offences against
vehicles 1
Other theft
offences
Fraud and
forgery
Criminal damage
Drug offences
Other offences
Cleveland -14 -13 6 -29 -10 -22 -16 -11 -19 13 -12Durham -10 -10 -12 -5 -10 -8 -7 -12 -17 13 -6Northumbria -15 -12 16 -22 -17 -26 -10 -17 -17 -9 -11North East Region -14 -12 7 -22 -13 -21 -11 -15 -17 1 -10
Cheshire -11 -5 0 -26 -6 -18 -10 -23 -16 4 2Cumbria -8 -7 23 -10 -3 -14 -6 5 -17 9 2Greater Manchester -13 -9 1 -16 -14 -20 -7 -3 -19 -10 -15Lancashire -9 -4 21 -20 -12 -20 -5 1 -15 16 2Merseyside -9 -8 13 -3 -7 -18 -10 -10 -9 -2 4North West Region -11 -7 8 -15 -11 -19 -8 -6 -16 -1 -6
Humberside -10 -8 20 -21 -14 -22 -8 -10 -7 -12 -2North Yorkshire -13 -4 4 -18 -18 -29 -7 -6 -19 -9 4South Yorkshire -13 -14 2 -14 -11 -21 -8 -11 -18 10 -3West Yorkshire -9 -9 2 -7 -3 -17 -7 8 -17 18 1Yorkshire and the Humber Region -11 -10 6 -11 -8 -20 -8 -2 -16 7 0
Derbyshire -8 0 12 4 -9 -22 -7 0 -12 13 -6Leicestershire -6 -3 -11 -14 -5 -18 0 -6 -12 6 4Lincolnshire -5 -5 -4 7 -8 -11 1 -7 -10 -8 9Northamptonshire -8 6 -11 -14 -13 -24 -1 -7 -14 13 3Nottinghamshire -15 -7 4 -15 -18 -29 -11 -13 -18 7 -11East Midlands Region -9 -2 -1 -11 -12 -23 -4 -7 -13 6 -2
Staffordshire -11 0 -2 -11 -14 -29 -8 -21 -13 -8 5Warwickshire -9 -11 15 -16 -2 -18 -5 -8 -19 25 -8West Mercia -8 -6 6 -17 -13 -5 -6 13 -15 0 -9West Midlands -7 -2 12 -7 -4 -17 -6 -6 -11 -4 -10West Midlands Region -8 -3 8 -9 -7 -17 -6 -7 -13 -1 -7
Bedfordshire -8 6 -22 -30 -15 -19 -3 -14 -8 1 16Cambridgeshire -7 5 2 -15 -12 -27 -2 4 -11 -9 9Essex -7 -3 9 -16 -1 -14 -3 -10 -13 -15 -16Hertfordshire -8 -4 10 -15 -9 -16 -3 -25 -15 12 17Norfolk -9 5 0 7 -8 -6 -9 -34 -17 -17 -14Suffolk 0 7 9 -9 15 -17 5 1 -8 -14 4East of England Region -7 1 3 -17 -6 -17 -3 -14 -12 -6 -1
London, City of -10 -7 - - -18 -33 -11 -23 -4 9 -25Metropolitan Police -2 0 14 3 -1 -9 4 -2 -7 -13 1London Region -2 0 14 3 -1 -9 4 -2 -7 -12 1
Hampshire -11 -5 -7 -6 -14 -18 -7 -10 -19 7 -18Kent -12 -11 -1 -16 -3 -22 -7 -17 -18 5 -5Surrey -1 8 -2 1 4 -8 -2 11 -11 2 5Sussex -6 -2 3 -9 -6 -12 -6 -1 -11 6 10Thames Valley -5 -2 14 -8 -3 -10 -3 -2 -11 -9 10South East Region -7 -4 2 -8 -5 -14 -5 -5 -15 1 -1
Avon and Somerset -9 1 1 -13 -9 -22 -7 -19 -13 -1 26Devon and Cornwall -10 -3 13 -16 -16 -17 -10 -6 -16 10 6Dorset -5 -6 11 -17 -1 -7 0 -5 -12 -1 19Gloucestershire -13 -14 5 -20 -5 -21 -11 -19 -18 -4 -9Wiltshire -7 2 21 -25 0 -14 -4 -27 -17 13 33South West Region -9 -3 9 -15 -8 -18 -7 -15 -15 3 12
ENGLAND -8 -4 7 -6 -7 -16 -4 -6 -14 -4 -2
Dyfed-Powys -7 -7 26 - -19 -17 -1 -5 -17 18 -1Gwent 3 0 8 13 28 5 6 -4 -6 -8 13North Wales -3 8 3 -20 2 -19 3 -4 -13 -5 2South Wales -12 -7 -14 -25 -14 -24 -5 -21 -15 2 -6WALES -6 -2 0 -17 -2 -16 -1 -12 -13 1 0
British Transport Police -7 -7 -10 -22 -15 -25 -4 -14 -15 1 15
ENGLAND AND WALES -8 -4 6 -6 -7 -16 -4 -7 -14 -4 -2
- Indicates that data are not reported because the base number of offences is less than 50.
1. Includes theft of motor vehicle, theft from a vehicle, aggravated vehicle taking and interfering with a motor vehicle.
Table 7.06 Recorded crime by offence group by police force area, English region and Wales, percentage change, 2008/09 to 2009/10
Percentage change
179

Rates per 1,000 population England and Wales, 2009/10 Recorded crimePolice force area, English region and Wales
Total Violence against
the person
Sexual offences
Robbery Burglary Offences against
vehicles2
Other theft
offences
Fraud and
forgery
Criminal damage
Drug offences
Other offences
Cleveland 85 17 1 1 10 7 21 1 20 5 2Durham 67 11 1 0 9 8 15 1 18 2 2Northumbria 64 12 1 0 7 6 15 2 16 3 1North East Region 69 13 1 0 8 7 16 2 17 4 1
Cheshire 67 13 1 0 9 7 17 2 14 3 1Cumbria 57 13 1 0 5 4 13 1 15 3 1Greater Manchester 96 16 1 2 14 13 20 4 19 4 2Lancashire 74 15 1 0 8 7 18 2 17 4 1Merseyside 80 13 1 1 10 8 15 2 17 11 1North West Region 81 15 1 1 11 9 18 3 17 5 1
Humberside 88 18 1 1 13 8 21 2 20 3 2North Yorkshire 54 10 1 0 7 5 15 1 11 2 1South Yorkshire 86 14 1 1 13 12 19 3 19 4 1West Yorkshire 90 14 1 1 17 12 19 3 18 4 2Yorkshire and the Humber Region 83 14 1 1 14 10 19 2 17 3 1
Derbyshire 68 14 1 1 9 7 15 2 15 2 1Leicestershire 83 18 1 1 11 9 19 3 15 4 1Lincolnshire 67 12 1 0 8 6 19 2 16 2 1Northamptonshire 81 15 1 1 11 10 19 3 17 3 1Nottinghamshire 92 17 1 2 14 11 21 2 19 4 2East Midlands Region 79 16 1 1 11 9 19 3 16 3 1
Staffordshire 71 19 1 1 8 7 15 3 16 2 1Warwickshire 63 10 1 1 10 9 15 2 12 3 1West Mercia 60 12 1 0 8 7 15 2 12 2 1West Midlands 81 18 1 3 12 11 14 3 14 4 1West Midlands Region 73 16 1 2 10 9 15 3 14 3 1
Bedfordshire 70 13 1 1 11 10 16 2 13 2 1Cambridgeshire 78 14 1 1 10 8 22 3 15 3 1Essex 61 12 1 1 8 7 14 2 12 2 1Hertfordshire 65 11 1 1 8 8 17 3 12 5 1Norfolk 53 11 1 0 6 5 14 1 12 2 1Suffolk 65 14 1 0 8 6 16 2 15 3 1East of England Region 64 12 1 1 8 7 16 2 13 3 1
London, City of3 + + + + + + + + + + +Metropolitan Police 108 23 1 4 12 13 27 5 12 9 2London Region 109 23 1 4 12 13 28 5 12 9 2
Hampshire 77 18 1 1 8 7 20 3 15 3 1Kent 64 13 1 1 8 7 16 2 14 3 1Surrey 58 13 1 0 7 7 13 3 12 2 1Sussex 65 13 1 1 7 6 18 3 13 3 1Thames Valley 84 18 1 1 10 11 21 5 14 3 1South East Region 72 15 1 1 8 8 18 3 14 3 1
Avon and Somerset 79 17 1 1 11 8 20 2 14 3 1Devon and Cornwall 56 12 1 0 6 5 13 2 13 3 1Dorset 68 14 1 0 8 7 18 2 14 2 1Gloucestershire 65 12 1 0 9 7 16 2 13 3 1Wiltshire 59 12 1 0 7 6 15 2 13 2 1South West Region 66 14 1 1 8 7 16 2 14 3 1
ENGLAND 79 16 1 1 10 9 19 3 15 4 1
Dyfed-Powys 44 10 1 0 4 3 9 1 10 5 1Gwent 91 17 1 0 13 14 17 3 20 4 1North Wales 66 18 1 0 7 5 14 2 15 4 1South Wales 83 16 1 0 9 12 19 2 18 5 1WALES 74 16 1 0 8 9 16 2 16 5 1
ENGLAND AND WALES 79 16 1 1 10 9 19 3 15 4 1
2. Includes theft of a motor vehicle, theft from a vehicle, aggravated vehicle taking and interfering with a motor vehicle.
3. '+' data for London Region includes the City of London.
1. Numbers will be affected by the size of the resident population relative to the transient or visiting populations and may therefore over-represent the number of crimes relative to the real population of potential victims.
Table 7.07 Recorded offences by offence group by police force area, English region and Wales, rates per 1,000 population1, 2009/10
Rates per 1,000 population
180

Table 7.08 Burglary offences recorded by the police, percentage change and rates by police force area, English region and Wales, 2009/10
Numbers, percentage change and rates per 10,000 population or householdsPolice force area, English region and Wales
Number of offences
% change 2008/09 to
2009/10
Rate per 10,000
households
Number of offences
% change 2008/09 to
2009/10
Rate per 10,000
population
Cleveland 2,460 -15 103 3,082 -6 55
Durham 2,273 -12 87 3,347 -8 55
Northumbria 3,870 -21 62 5,611 -14 40
North East Region 8,603 -17 76 12,040 -10 47
Cheshire 4,135 6 96 4,536 -15 45
Cumbria 774 -3 35 1,702 -3 34
Greater Manchester 20,100 -15 181 15,971 -11 62
Lancashire 4,436 -13 71 7,459 -11 52
Merseyside 7,922 1 135 6,081 -15 45
North West Region 37,367 -10 125 35,749 -12 52
Humberside 4,556 -23 113 7,015 -7 77
North Yorkshire 1,976 -20 58 3,463 -16 44
South Yorkshire 7,279 -16 129 9,431 -6 72
West Yorkshire 21,386 2 230 15,812 -10 72
Yorkshire and the Humber Region 35,197 -7 157 35,721 -9 68
Derbyshire 3,772 -9 87 5,244 -8 52
Leicestershire 5,497 -1 137 5,295 -10 54
Lincolnshire 2,162 -11 71 3,658 -6 53
Northamptonshire 3,407 -14 117 4,317 -12 64
Nottinghamshire 7,868 -17 168 6,646 -19 62
East Midlands Region 22,706 -11 119 25,160 -12 57
Staffordshire 3,749 -12 82 4,683 -16 44
Warwickshire 2,261 2 100 3,262 -5 61
West Mercia 3,291 -15 64 5,881 -11 50
West Midlands 16,595 -1 154 13,616 -8 52
West Midlands Region 25,896 -5 114 27,442 -10 51
Bedfordshire 3,429 -16 139 2,921 -14 49
Cambridgeshire 3,823 -9 119 3,876 -14 50
Essex 6,849 -1 94 7,026 -2 41
Hertfordshire 4,347 -13 97 4,090 -4 38
Norfolk 1,710 7 45 3,099 -15 37
Suffolk 1,889 14 61 3,452 15 49
East of England Region 22,047 -6 91 24,464 -6 43
London, City of 1 29 - + 274 -14 +
Metropolitan Police 60,863 3 189 31,902 -7 42
London Region 60,892 3 189 32,176 -7 42
Hampshire 5,532 -8 71 8,747 -17 47
Kent 5,284 -5 76 7,155 -1 43
Surrey 3,405 3 74 4,771 5 43
Sussex 3,794 -8 55 6,399 -4 41
Thames Valley 10,478 -8 118 11,697 2 53
South East Region 28,493 -6 81 38,769 -4 46
Avon and Somerset 7,662 -11 111 9,543 -8 60
Devon and Cornwall 3,620 -17 49 5,650 -16 34
Dorset 1,842 1 59 3,582 -2 50
Gloucestershire 2,453 7 97 3,072 -13 52
Wiltshire 1,722 19 63 3,081 -8 47
South West Region 17,299 -7 76 24,928 -10 48
ENGLAND 258,500 -6 118 256,449 -9 50
Dyfed-Powys 593 -19 26 1,205 -19 24
Gwent 3,079 34 127 4,306 24 77
North Wales 1,414 -4 47 3,013 5 44
South Wales 5,006 -16 94 6,434 -12 52
WALES 10,092 -4 78 14,958 -1 50
British Transport Police 2 3 - n/a 653 -15 n/a
ENGLAND AND WALES 268,595 -6 116 272,060 -8 501. '+' data for London Region includes the City of London.2. No rates are given for British Transport Police as their data are not provided for specified geographic areas.
- Indicates that data are not reported because the base number of offences is less than 50.
Burglary in a dwelling Burglary other than in a dwelling
England and Wales, Recorded crime
181

Table 7.09 Offences against vehicles recorded by the police, percentage change and rates by police force area, English region and Wales, 2009/10
Numbers, percentage change and rates per 10,000 population England and Wales, Recorded crimePolice force area, English region and Wales
Number of offences
% change 2008/09 to
2009/10
Rate per 10,000
population
Number of offences
% change 2008/09 to
2009/10
Rate per 10,000
population
Number of offences
% change 2008/09 to
2009/10
Rate per 10,000
population
Cleveland 1,168 -26 21 2,483 -19 44 437 -21 8
Durham 1,272 -17 21 2,997 -1 50 287 -23 5
Northumbria 2,158 -22 15 5,522 -27 39 944 -29 7
North East Region 4,598 -22 18 11,002 -19 43 1,668 -26 6
Cheshire 1,659 -26 17 4,952 -14 49 506 -31 5
Cumbria 552 -18 11 1,242 -13 25 218 -13 4
Greater Manchester 8,213 -23 32 23,378 -18 91 2,330 -22 9
Lancashire 2,399 -23 17 6,379 -18 44 1,281 -24 9
Merseyside 2,803 -26 21 7,412 -10 55 1,066 -37 8
North West Region 15,626 -24 23 43,363 -16 63 5,401 -27 8
Humberside 1,980 -29 22 4,569 -19 50 1,057 -22 12
North Yorkshire 1,076 -19 14 2,576 -33 33 313 -25 4
South Yorkshire 4,025 -28 31 10,760 -17 82 1,475 -31 11
West Yorkshire 5,881 -28 27 17,983 -12 81 1,898 -27 9
Yorkshire and the Humber Region 12,962 -27 25 35,888 -16 69 4,743 -27 9
Derbyshire 1,773 -18 18 4,900 -23 49 700 -21 7
Leicestershire 1,764 -17 18 6,056 -18 62 610 -17 6
Lincolnshire 1,081 -18 16 2,802 -4 40 289 -35 4
Northamptonshire 1,544 -31 23 4,432 -19 65 745 -31 11
Nottinghamshire 2,680 -24 25 7,992 -31 75 1,062 -30 10
East Midlands Region 8,842 -22 20 26,182 -22 59 3,406 -27 8
Staffordshire 1,732 -30 16 4,494 -29 42 790 -26 7
Warwickshire 1,045 -19 20 3,351 -19 63 344 -5 6
West Mercia 1,730 -17 15 5,747 -3 48 894 2 8
West Midlands 7,805 -17 30 18,195 -16 69 1,794 -21 7
West Midlands Region 12,312 -19 23 31,787 -16 59 3,822 -16 7
Bedfordshire 1,053 -26 18 4,193 -19 70 463 -2 8
Cambridgeshire 1,298 -30 17 4,560 -26 59 471 -30 6
Essex 3,442 -16 20 8,329 -11 49 879 -25 5
Hertfordshire 1,805 -23 17 6,350 -12 59 291 -37 3
Norfolk 1,096 -12 13 2,779 -5 33 359 12 4
Suffolk 829 -9 12 2,864 -19 40 359 -15 5
East of England Region 9,523 -20 17 29,075 -15 51 2,822 -20 5
London, City of 2 79 46 + 70 -58 + 1 - +
Metropolitan Police 25,516 -12 33 72,717 -8 95 4,320 -2 6
London Region 25,595 -11 33 72,787 -8 95 4,321 -2 6
Hampshire 2,607 -19 14 8,931 -20 48 1,361 1 7
Kent 3,268 -24 20 7,330 -20 44 1,161 -28 7
Surrey 1,575 -10 14 4,938 -6 45 822 -12 7
Sussex 2,406 -5 15 6,484 -15 42 910 -10 6
Thames Valley 4,128 -23 19 17,051 -4 77 2,113 -18 10
South East Region 13,984 -19 17 44,734 -12 53 6,367 -15 8
Avon and Somerset 3,223 -25 20 8,751 -22 55 1,544 -15 10
Devon and Cornwall 1,624 -27 10 6,228 -14 37 574 -22 3
Dorset 942 -16 13 3,431 -5 48 413 -9 6
Gloucestershire 1,004 -20 17 2,867 -22 49 297 -11 5
Wiltshire 816 -18 13 2,561 -13 39 332 -17 5
South West Region 7,609 -23 15 23,838 -17 46 3,160 -16 6
ENGLAND 111,051 -20 22 318,656 -15 62 35,710 -20 7
Dyfed-Powys 436 -21 9 1,030 -13 20 140 -29 3
Gwent 1,762 -10 32 5,356 12 96 654 3 12
North Wales 891 -23 13 2,081 -15 31 355 -27 5
South Wales 3,443 -25 28 9,900 -22 79 1,070 -32 9
WALES 6,532 -21 22 18,367 -13 61 2,219 -23 7
British Transport Police 3 229 -20 n/a 2,117 -25 n/a 97 -43 n/a
ENGLAND AND WALES 117,812 -20 22 339,140 -15 62 38,026 -20 71. Includes aggravated vehicle taking.2. '+' data for London Region includes the City of London.3. No rates are given for British Transport Police as their data are not provided for specified geographic areas.
- Indicates that data are not reported because the base number of offences is less than 50.
Theft or unauthorised taking of a motor vehicle1 Theft from a vehicle Interfering with a motor vehicle
182

Table 7.10 Incidents of crime and victimisation rates by police force area, English region and Wales
Percentages, numbers and rates per 10,000 population England and Wales, BCS
% victim atleast once
Statistically significantly
different from England and
Wales1
Statistically significant
change,2008/09 to
2009/101
Numberof incidents
(thousands)2
Rateper 10,000
households
Statistically significantly
different from England and
Wales1
Statistically significant
change,2008/09 to
2009/101
Unweightedbase
Cleveland 18 3,424 951Durham 18 2,721 **$ 1,025Northumbria 19 2,939 1,020North East Region 18 339 2,986 ** 2,996
Cheshire 16 2,327 951Cumbria 13 ** 2,177 977Greater Manchester 21 ** 3,262 ** 1,374Lancashire 18 2,740 981Merseyside 12 ** **$ 2,007 ** 918North West Region 17 804 2,673 5,201
Humberside 17 2,938 913North Yorkshire 12 ** ** # 1,669 ** 998South Yorkshire 17 2,346 **$ 949West Yorkshire 17 2,579 1,164Yorkshire and the Humber Region 16 **$ 554 2,442 4,024
Derbyshire 17 2,534 882Leicestershire 18 3,076 949Lincolnshire 16 2,835 1,028Northamptonshire 19 ** 3,449 ** 1,003Nottinghamshire 17 2,920 1,011East Midlands Region 18 567 2,936 ** 4,873
Staffordshire 17 2,922 965Warwickshire 15 2,581 981West Mercia 13 ** 2,136 969West Midlands 15 2,219 1,350West Midlands Region 15 ** 546 2,379 4,265
Bedfordshire 21 ** **$ 3,548 ** **$ 956Cambridgeshire 21 ** 3,267 1,017Essex 15 2,040 ** 1,029Hertfordshire 16 2,276 909Norfolk 15 2,635 881Suffolk 13 ** 1,869 ** 931East of England Region 16 609 2,469 5,723
Metropolitan/City of London 17 **$ 2,475 **$ 3,937London Region 17 808 2,475 **$ 3,937
Hampshire 18 2,623 993Kent 17 2,935 960Surrey 17 2,446 921Sussex 15 2,193 946Thames Valley 17 **$ 2,490 **$ 1,101South East Region 17 **$ 905 2,550 **$ 4,921
Avon and Somerset 17 2,655 988Devon and Cornwall 12 ** 1,983 ** 966Dorset 15 2,218 937Gloucestershire 16 2,247 958Wiltshire 17 2,348 992South West Region 15 530 2,309 4,841
England Total 17 **$ 5,608 2,550 **$ 40,781
Dyfed-Powys 8 ** 1,081 ** 1,034Gwent 21 ** 3,600 ** 854North Wales 11 ** 1,639 ** 983South Wales 16 2,167 958Wales 14 ** 273 2,081 ** 3,829
ENGLAND AND WALES 16 **$ 6,000 2,525 **$ 44,6101. '**' denotes statistical difference in comparison with England and Wales while '**#/$' denotes statistically significant change from 2008/09 to 2009/10.
BCS household crimeRisk of victimisation
2. Numbers of incidents at a regional level will not sum to the total for England and Wales. This is due to differences in the population and household estimates used to calculate the numbers of crimes. See Section 8 of the User Guide to Home Office Crime Statistics for more information.
Police force area, English region and Wales
183

Table 7.11 Incidents of personal crime and victimisation rates by police force area, English region and Wales
Percentages, numbers and rates per 10,000 population England and Wales, BCS
% victim at least once
Statistically significantly
different from England and
Wales1
Statistically significant
change, 2008/09 to
2009/101
Number of incidents
(thousands)2
Rate per 10,000 adults
Statistically significantly
different from England and
Wales1
Statistically significant
change, 2008/09 to
2009/101
Unweighted base
Cleveland 4 817 952Durham 3 ** **$ 592 1,024Northumbria 6 789 1,021North East Region 5 158 747 2,997
Cheshire 4 ** 499 ** 952Cumbria 4 ** 622 977Greater Manchester 7 1,064 1,374Lancashire 6 1,075 982Merseyside 4 ** 552 ** 917North West Region 5 476 845 5,202
Humberside 4 659 913North Yorkshire 5 556 996South Yorkshire 6 680 946West Yorkshire 6 773 1,163Yorkshire and the Humber Region 6 300 698 4,018
Derbyshire 4 664 884Leicestershire 5 803 949Lincolnshire 5 743 1,026Northamptonshire 6 **$ 1,115 1,004Nottinghamshire 5 586 1,012East Midlands Region 5 **$ 279 758 4,875
Staffordshire 5 882 965Warwickshire 7 1,032 982West Mercia 5 950 967West Midlands 4 ** 549 ** 1,349West Midlands Region 5 331 754 4,263
Bedfordshire 7 1,159 956Cambridgeshire 5 687 1,017Essex 5 674 1,026Hertfordshire 6 833 908Norfolk 5 763 882Suffolk 5 580 927East of England Region 5 353 754 5,716
Metropolitan/City of London 8 ** 1,017 ** 3,916London Region 8 ** 631 1,017 ** 3,916
Hampshire 6 861 ** # 990Kent 7 861 956Surrey 7 892 915Sussex 5 664 941Thames Valley 7 1,014 1,101South East Region 6 596 872 4,903
Avon and Somerset 4 ** 824 987Devon and Cornwall 5 676 967Dorset 5 1,058 937Gloucestershire 6 878 ** # 958Wiltshire 5 758 992South West Region 5 351 808 4,841
England Total 6 **$ 3,478 824 **$ 40,731
Dyfed-Powys 2 ** **$ 186 ** **$ 1,033Gwent 6 ** # 1,132 ** # 854North Wales 3 ** 528 ** 982South Wales 6 824 959Wales 5 ** 170 691 3,828
ENGLAND AND WALES 6 **$ 3,648 817 44,5591. '**' denotes statistical difference in comparison with England and Wales while '**#/$' denotes statistically significant change from 2008/09 to 2009/10.
BCS personal crimeRisk of victimisation
2. Numbers of incidents at a regional level will not sum to the total for England and Wales. This is due to differences in the population and household estimates used to calculate the numbers of crimes. See Section 8 of the User Guide to Home Office Crime Statistics for more information.
Police force area, English region and Wales
184
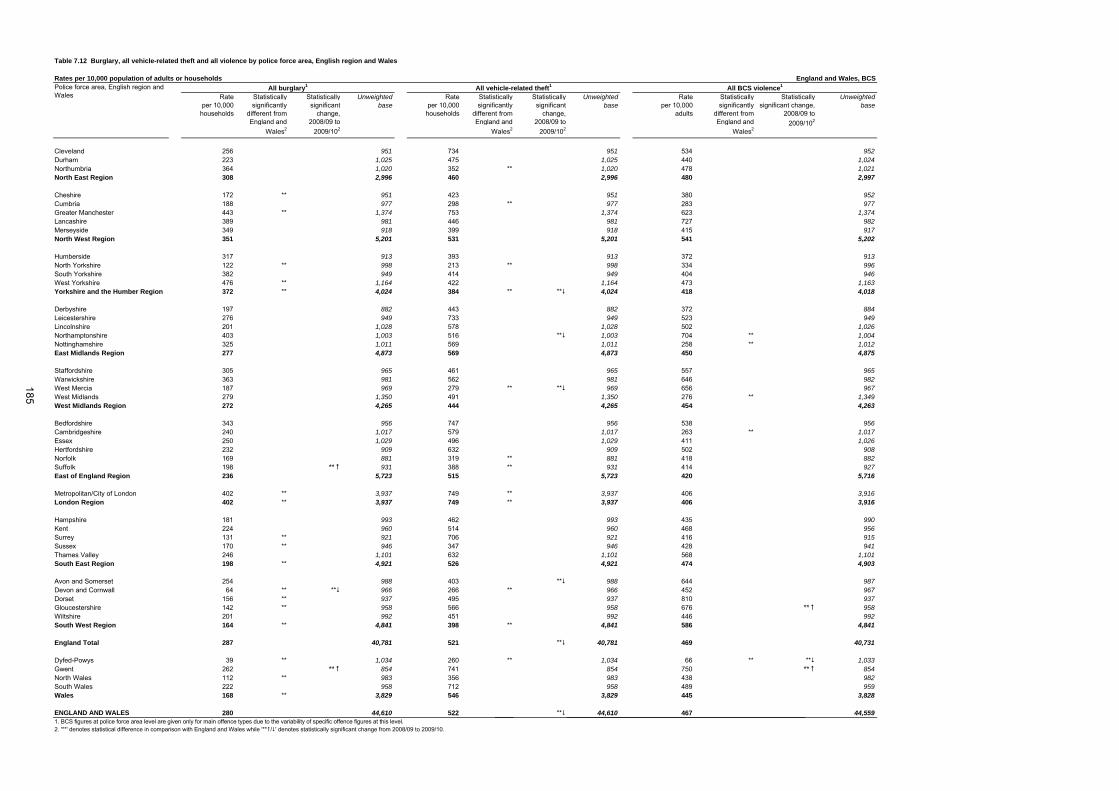
Table 7.12 Burglary, all vehicle-related theft and all violence by police force area, English region and Wales
Rates per 10,000 population of adults or households England and Wales, BCS
Rateper 10,000
households
Statistically significantly
different from England and
Wales2
Statistically significant
change,2008/09 to
2009/102
Unweightedbase
Rateper 10,000
households
Statistically significantly
different from England and
Wales2
Statistically significant
change,2008/09 to
2009/102
Unweightedbase
Rateper 10,000
adults
Statistically significantly
different from England and
Wales2
Statistically significant change,
2008/09 to
2009/102
Unweightedbase
Cleveland 256 951 734 951 534 952Durham 223 1,025 475 1,025 440 1,024Northumbria 364 1,020 352 ** 1,020 478 1,021North East Region 308 2,996 460 2,996 480 2,997
Cheshire 172 ** 951 423 951 380 952Cumbria 188 977 298 ** 977 283 977Greater Manchester 443 ** 1,374 753 1,374 623 1,374Lancashire 389 981 446 981 727 982Merseyside 349 918 399 918 415 917North West Region 351 5,201 531 5,201 541 5,202
Humberside 317 913 393 913 372 913North Yorkshire 122 ** 998 213 ** 998 334 996South Yorkshire 382 949 414 949 404 946West Yorkshire 476 ** 1,164 422 1,164 473 1,163Yorkshire and the Humber Region 372 ** 4,024 384 ** **$ 4,024 418 4,018
Derbyshire 197 882 443 882 372 884Leicestershire 276 949 733 949 523 949Lincolnshire 201 1,028 578 1,028 502 1,026Northamptonshire 403 1,003 516 **$ 1,003 704 ** 1,004Nottinghamshire 325 1,011 569 1,011 258 ** 1,012East Midlands Region 277 4,873 569 4,873 450 4,875
Staffordshire 305 965 461 965 557 965Warwickshire 363 981 562 981 646 982West Mercia 187 969 279 ** **$ 969 656 967West Midlands 279 1,350 491 1,350 276 ** 1,349West Midlands Region 272 4,265 444 4,265 454 4,263
Bedfordshire 343 956 747 956 538 956Cambridgeshire 240 1,017 579 1,017 263 ** 1,017Essex 250 1,029 496 1,029 411 1,026Hertfordshire 232 909 632 909 502 908Norfolk 169 881 319 ** 881 418 882Suffolk 198 **# 931 388 ** 931 414 927East of England Region 236 5,723 515 5,723 420 5,716
Metropolitan/City of London 402 ** 3,937 749 ** 3,937 406 3,916London Region 402 ** 3,937 749 ** 3,937 406 3,916
Hampshire 181 993 462 993 435 990Kent 224 960 514 960 468 956Surrey 131 ** 921 706 921 416 915Sussex 170 ** 946 347 946 428 941Thames Valley 246 1,101 632 1,101 568 1,101South East Region 198 ** 4,921 526 4,921 474 4,903
Avon and Somerset 254 988 403 **$ 988 644 987Devon and Cornwall 64 ** **$ 966 266 ** 966 452 967Dorset 156 ** 937 495 937 810 937Gloucestershire 142 ** 958 566 958 676 **# 958Wiltshire 201 992 451 992 446 992South West Region 164 ** 4,841 398 ** 4,841 586 4,841
England Total 287 40,781 521 **$ 40,781 469 40,731
Dyfed-Powys 39 ** 1,034 260 ** 1,034 66 ** **$ 1,033Gwent 262 **# 854 741 854 750 **# 854North Wales 112 ** 983 356 983 438 982South Wales 222 958 712 958 489 959Wales 168 ** 3,829 546 3,829 445 3,828
ENGLAND AND WALES 280 44,610 522 **$ 44,610 467 44,5591. BCS figures at police force area level are given only for main offence types due to the variability of specific offence figures at this level.2. '**' denotes statistical difference in comparison with England and Wales while '**#/$' denotes statistically significant change from 2008/09 to 2009/10.
All burglary1 All vehicle-related theft1 All BCS violence1Police force area, English region and Wales
185

Table 7.13 Knife and sharp instrument offences recorded by the police for selected offences, 2008/091
Numbers and percentages England and Wales, 2008/09 Recorded crime
Offences involving
a knife
% involving
a knife
Offences involving
a knife
% involving
a knife
Offences involving
a knife
% involving
a knife
Offences involving
a knife
% involving
a knife
Offences involving
a knife
% involving
a knife
Offences involving
a knife
% involving
a knife
Cleveland 207 4 5 - 11 - 141 3 47 12 3 1Durham 152 4 0 - 11 11 110 3 29 17 2 1Northumbria 470 4 2 - 11 12 322 3 132 18 3 0North East Region 829 4 7 - 33 15 573 3 208 16 8 1
Cheshire 341 4 2 - 19 11 189 3 127 21 4 1Cumbria 87 2 1 - 11 - 60 2 15 - 0 0Greater Manchester 2,835 9 29 36 87 17 1,128 5 1,565 22 26 1Lancashire 843 6 10 - 36 19 546 5 241 28 10 1Merseyside 892 9 6 - 19 22 431 5 432 26 4 1North West Region 4,998 7 48 40 172 17 2,354 4 2,380 23 44 1
Humberside 369 4 4 - 14 12 238 3 111 14 2 0North Yorkshire 225 5 3 - 8 15 163 4 46 19 5 1South Yorkshire 648 5 6 - 17 - 374 3 248 21 3 1West Yorkshire 1,273 6 14 - 82 26 597 3 562 19 18 1Yorkshire and the Humber Region 2,515 5 27 50 121 23 1,372 3 967 19 28 1
Derbyshire 327 3 3 - 13 11 177 2 129 16 5 1Leicestershire 476 5 4 - 36 15 230 3 202 17 4 0Lincolnshire 169 4 2 - 28 33 96 3 39 20 4 1Northamptonshire 396 6 3 - 31 19 190 4 166 18 6 1Nottinghamshire 940 6 5 - 28 20 400 3 499 22 8 1East Midlands Region 2,308 5 17 - 136 18 1,093 3 1,035 19 27 1
Staffordshire 455 4 6 - 23 6 305 3 119 15 2 0Warwickshire 223 6 9 - 4 8 136 5 72 21 2 1West Mercia 341 4 5 - 24 16 207 3 102 18 3 0West Midlands 3,682 9 21 30 61 13 1,719 6 1,858 24 23 1West Midlands Region 4,701 7 41 43 112 11 2,367 5 2,151 23 30 1
Bedfordshire 458 8 4 - 14 - 194 5 239 24 7 2Cambridgeshire 402 6 6 - 28 19 227 5 133 16 8 1Essex 730 6 13 - 47 19 339 4 329 25 2 0Hertfordshire 177 3 6 - 0 0 54 1 117 15 0 0Norfolk 130 3 1 - 7 10 75 2 47 16 0 0Suffolk 200 4 3 - 17 18 131 3 44 16 5 1East of England Region 2,097 5 33 56 113 17 1,020 3 909 20 22 1
London, City of 26 6 0 - 3 - 16 5 7 - 0 -Metropolitan Police 12,233 11 41 53 473 19 4,728 7 6,857 21 134 2London Region 12,259 11 41 53 476 19 4,744 7 6,864 21 134 2
Hampshire 592 3 5 - 51 9 364 2 163 14 9 1Kent 553 4 10 - 25 11 339 3 176 17 3 0Surrey 130 2 0 - 14 12 87 2 28 7 1 0Sussex 728 7 3 - 21 15 510 6 190 18 4 0Thames Valley 1,221 6 9 - 88 11 570 4 537 23 17 1South East Region 3,224 5 27 53 199 11 1,870 3 1,094 18 34 1
Avon and Somerset 935 6 8 - 19 24 496 4 402 20 10 1Devon and Cornwall 395 3 8 - 25 46 266 2 84 16 12 1Dorset 164 3 1 - 9 12 127 3 26 10 1 0Gloucestershire 181 4 3 - 23 21 98 3 52 20 5 1Wiltshire 200 4 1 - 21 - 116 3 60 18 2 1South West Region 1,875 4 21 - 97 28 1,103 3 624 18 30 1
ENGLAND 34,806 7 262 48 1,459 16 16,496 4 16,232 21 357 1
Dyfed-Powys 95 3 2 - 18 25 71 3 3 - 1 0Gwent 126 2 4 - 19 11 88 2 13 6 2 1North Wales 136 3 2 - 16 15 98 2 20 13 0 0South Wales 571 5 4 - 43 28 327 3 195 24 2 0WALES 928 4 12 - 96 19 584 3 231 19 5 0
British Transport Police 346 9 1 - 9 - 102 4 230 26 4 1
ENGLAND AND WALES 36,080 7 275 48 1,564 16 17,182 4 16,693 21 366 1
Rape and sexual assaults
1. Police recorded knife and sharp instrument offences data are submitted via an additional special collection. Other offences exist that are not shown in this table that may include the use of a knife or sharp instrument. In this table 'offences involving a knife' refers to the use of a knife or sharp instrument. Total of selected serious offences only include the five offence types shown in this table.
RobberyTotal of selected serious offences1
Attempted murder Threats to kill ABH and GBH3Police force area, English regions
and Wales2
2. Four police forces include unbroken bottle and glass offences in their returns, which are outside the scope of this special collection. As such, data for these forces are not directly comparable to data for other forces. The four forces are: West Midlands, Surrey, Sussex and the British Transport Police.
3. Includes racially or religiously aggravated wounding or inflicting GBH.
186

Table 7.14 Knife and sharp instrument offences recorded by the police for selected offences, 2009/101
Numbers and percentages England and Wales, 2009/10 Recorded crime
Offences involving
a knife
% involving
a knife
Offences involving
a knife
% involving
a knife
Offences involving
a knife
% involving
a knife
Offences involving
a knife
% involving
a knife
Offences involving
a knife
% involving
a knife
Offences involving
a knife
% involving
a knife
Cleveland 227 4 1 - 12 - 161 3 53 19 0 0Durham 120 3 1 - 7 11 77 2 31 20 4 1Northumbria 401 4 0 - 16 17 275 3 107 19 3 0North East Region 748 4 2 - 35 18 513 3 191 19 7 0
Cheshire 276 4 6 - 6 8 163 2 98 23 3 1Cumbria 98 3 0 - 14 - 67 2 16 - 1 0Greater Manchester 2,361 8 29 42 93 14 979 5 1,240 21 20 1Lancashire 622 5 4 - 24 13 416 4 172 25 6 1Merseyside 798 8 3 - 19 28 388 5 385 24 3 0North West Region 4,155 7 42 39 156 15 2,013 4 1,911 22 33 1
Humberside 357 4 7 - 13 12 219 3 114 19 4 1North Yorkshire 205 4 2 - 7 - 154 4 41 20 1 0South Yorkshire 571 5 5 - 10 - 290 3 258 25 8 1West Yorkshire 1,311 6 14 - 84 27 645 4 555 20 13 1Yorkshire and the Humber Region 2,444 5 28 41 114 23 1,308 3 968 21 26 1
Derbyshire 317 3 2 - 13 10 166 2 134 16 2 0Leicestershire 412 5 4 - 40 15 177 3 186 18 5 1Lincolnshire 176 4 1 - 39 33 96 2 38 18 2 1Northamptonshire 339 5 2 - 40 13 149 3 145 19 3 1Nottinghamshire 767 5 2 - 34 24 301 3 424 22 6 1East Midlands Region 2,011 4 11 - 166 17 889 2 927 19 18 1
Staffordshire 439 4 5 - 38 9 261 3 133 19 2 0Warwickshire 157 5 2 - 8 9 100 4 47 17 0 0West Mercia 318 4 2 - 40 20 175 2 95 20 6 1West Midlands 3,216 9 22 34 51 11 1,563 6 1,552 21 28 1West Midlands Region 4,130 7 31 36 137 12 2,099 5 1,827 21 36 1
Bedfordshire 390 7 2 - 20 - 205 5 158 22 5 2Cambridgeshire 360 6 11 - 41 20 178 4 123 17 7 2Essex 679 6 17 - 28 10 358 4 267 24 9 1Hertfordshire 128 2 4 - 0 0 45 1 79 12 0 0Norfolk 201 4 2 - 11 18 136 3 52 17 0 0Suffolk 178 3 4 - 27 17 100 2 42 17 5 1East of England Region 1,936 5 40 63 127 16 1,022 3 721 19 26 1
London, City of 10 3 0 - 0 - 5 2 5 - 0 -Metropolitan Police 12,560 11 67 54 426 19 4,781 7 7,166 21 120 2London Region 12,570 11 67 53 426 19 4,786 7 7,171 21 120 2
Hampshire 582 3 4 - 50 9 371 3 150 14 7 1Kent 377 3 4 - 11 9 221 2 135 16 6 1Surrey 50 1 0 - 0 0 27 1 23 5 0 0Sussex 681 7 3 - 38 25 450 6 186 20 4 0Thames Valley 1,206 6 4 - 89 11 632 4 470 21 11 1South East Region 2,896 4 15 - 188 11 1,701 3 964 18 28 1
Avon and Somerset 790 6 3 - 29 35 397 4 351 20 10 1Devon and Cornwall 400 3 10 - 16 29 293 3 73 17 8 1Dorset 176 3 3 - 16 15 108 2 45 21 4 1Gloucestershire 157 4 2 - 12 14 95 3 46 22 2 1Wiltshire 157 3 0 - 8 - 109 3 39 15 1 0South West Region 1,680 4 18 - 81 23 1,002 3 554 19 25 1
ENGLAND 32,570 7 254 44 1,430 16 15,333 4 15,234 21 319 1
Dyfed-Powys 73 3 1 - 22 26 43 2 6 - 1 0Gwent 156 2 2 - 21 11 102 2 30 12 1 0North Wales 97 2 0 - 10 6 71 1 16 13 0 0South Wales 439 4 4 - 30 19 266 3 138 23 1 0WALES 765 3 7 - 83 14 482 2 190 19 3 0
British Transport Police 231 7 1 - 11 - 49 2 168 25 2 0
ENGLAND AND WALES 33,566 6 262 44 1,524 16 15,864 4 15,592 21 324 1
3. Includes racially or religiously aggravated wounding or inflicting GBH.
2. Four police forces include unbroken bottle and glass offences in their returns, which are outside the scope of this special collection. As such, data for these forces are not directly comparable to data for other forces. The four forces are: West Midlands, Surrey, Sussex and the British Transport Police.
ABH and GBH3 Rape and sexual assaults
Total of selected serious offences1
Attempted murder RobberyThreats to kill
1. Police recorded knife and sharp instrument offences data are submitted via an additional special collection. Other offences exist that are not shown in this table that may include the use of a knife or sharp instrument. In this table 'offences involving a knife' refers to the use of a knife or sharp instrument. Total of selected serious offences only include the five offence types shown in this table.
Police force area, English regions
and Wales2
187

Table 7.15 Detection rates by method of detection, police force area, English region and Wales, 2009/101
Numbers and percentages England and Wales, 2009/10 Recorded crime
Detection rate by method of detection
Previously recorded
Not previously recorded
Cleveland 47,255 40 40 24 10 2 0 3 1
Durham 40,423 33 33 20 8 2 0 3 1
Northumbria 89,700 40 40 22 12 2 0 2 1
North East Region 177,378 38 38 22 10 2 0 3 1
Cheshire 67,032 25 25 15 5 2 0 2 2
Cumbria 28,333 41 40 26 9 1 0 4 0
Greater Manchester 246,416 25 25 16 4 1 0 2 2
Lancashire 107,361 35 35 21 7 2 0 4 1
Merseyside 107,730 39 39 20 5 1 0 7 5
North West Region 556,872 30 30 18 5 1 0 3 2
Humberside 80,663 28 28 16 6 1 0 3 1
North Yorkshire 42,197 31 31 20 7 1 0 2 2
South Yorkshire 112,869 31 31 14 7 6 0 3 1
West Yorkshire 197,553 27 27 15 5 5 0 1 1
Yorkshire and the Humber Region 433,282 29 29 16 6 4 0 2 1
Derbyshire 68,005 23 23 15 4 1 0 1 1
Leicestershire 81,244 23 23 12 5 2 0 2 2
Lincolnshire 46,927 24 24 14 7 1 0 2 1
Northamptonshire 55,168 24 24 13 6 1 0 1 1
Nottinghamshire 98,319 26 26 14 8 1 0 1 1
East Midlands Region 349,663 24 24 14 6 1 0 2 1
Staffordshire 76,137 23 23 14 4 1 0 2 1
Warwickshire 33,828 24 24 12 7 1 0 2 2
West Mercia 71,291 27 27 16 7 1 0 2 1
West Midlands 211,399 24 24 16 6 1 0 0 1
West Midlands Region 392,655 24 24 15 6 1 0 1 1
Bedfordshire 42,048 26 26 15 6 1 0 2 1
Cambridgeshire 60,017 27 27 14 7 2 0 2 2
Essex 104,796 34 34 16 11 3 0 2 1
Hertfordshire 70,001 35 35 16 8 3 0 5 3
Norfolk 44,692 37 34 19 7 3 0 2 1
Suffolk 46,447 30 30 17 7 2 0 2 1
East of England Region 368,001 32 31 16 8 3 0 3 2
London, City of 6,532 36 36 18 8 1 0 1 8
Metropolitan Police 828,752 24 24 12 5 1 0 2 4
London Region 835,284 24 24 12 5 1 0 2 4
Hampshire 142,261 27 27 17 6 1 0 2 1
Kent 106,727 33 33 15 10 3 0 5 1
Surrey 64,329 21 21 12 5 1 0 2 1
Sussex 101,200 29 29 17 9 1 0 2 1
Thames Valley 185,705 20 20 10 5 1 0 3 1
South East Region 600,222 26 26 14 7 1 0 3 1
Avon and Somerset 125,899 29 26 14 6 2 0 2 2
Devon and Cornwall 92,705 30 30 16 8 2 0 2 2
Dorset 48,237 24 24 15 5 1 0 1 1
Gloucestershire 38,270 30 30 15 8 4 0 1 1
Wiltshire 38,671 30 30 15 8 3 0 3 1
South West Region 343,782 29 28 15 7 2 0 2 1
ENGLAND 4,057,139 28 27 15 6 2 0 2 2
Dyfed-Powys 22,377 48 48 24 15 1 0 4 4
Gwent 50,842 26 26 14 7 1 0 3 1
North Wales 44,919 43 41 23 9 2 0 5 2
South Wales 103,253 30 30 19 5 2 0 3 2
WALES 221,391 34 33 19 7 1 0 3 2
British Transport Police 60,074 35 35 19 6 1 0 5 5
ENGLAND AND WALES 4,338,604 28 28 15 6 2 0 2 21. Percentage of offences detected.2. This includes a small number of Youth Restorative Disposals (see Chapter 6) submitted to the Home Office as part of a pilot scheme together with non-sanction detections.3. Since 26 January 2009, PNDs can be given for cannabis possession. Up to the end of March 2009 such PNDs were counted together with Cannabis Warnings.
Police force area, English region and Wales
Recorded offences
Detection
rate2
Sanction detection
rate Cannabis
Warnings3
Charge/ summons
Cautions Taken into consideration Penalty Notices for
Disorder
188

Table 7.16 Sanction detection rates by offence group, police force area, English region and Wales, 2009/101 2
Percentages England and Wales, 2009/10 Recorded CrimePolice force area, English region and Wales
Total Violence against the
person
Sexual offences
Robbery Burglary Offences against
vehicles
Other theft offences
Fraud and forgery
Criminal damage
Drug offences
Other offences
Cleveland 40 59 40 33 17 19 44 50 18 99 92
Durham 33 68 47 38 15 13 32 46 16 96 83
Northumbria 40 66 37 37 16 17 41 57 20 96 83
North East Region 38 65 40 36 16 16 40 54 19 97 85
Cheshire 25 42 26 20 11 11 24 22 12 91 60
Cumbria 40 66 38 42 15 14 36 52 17 96 78
Greater Manchester 25 45 33 19 12 8 24 20 11 91 64
Lancashire 35 55 36 45 21 23 31 30 19 91 81
Merseyside 39 65 32 19 12 11 37 28 11 100 86
North West Region 30 52 33 21 13 12 28 24 13 95 71
Humberside 28 49 39 32 12 12 26 32 13 95 81
North Yorkshire 31 57 31 32 12 11 27 46 15 97 88
South Yorkshire 31 52 33 33 17 27 30 33 12 95 71
West Yorkshire 27 46 25 28 17 17 25 25 13 91 72
Yorkshire and the Humber Region 29 49 31 30 16 19 27 30 13 94 75
Derbyshire 23 38 28 24 11 10 20 24 10 93 68
Leicestershire 23 33 29 22 13 12 19 18 11 91 56
Lincolnshire 24 47 19 20 8 6 23 41 9 85 55
Northamptonshire 24 44 36 25 8 9 25 23 12 92 75
Nottinghamshire 26 46 31 17 10 8 24 25 14 93 69
East Midlands Region 24 41 29 21 10 9 22 24 11 91 64
Staffordshire 23 31 24 33 11 8 22 17 10 103 58
Warwickshire 24 51 29 16 8 5 19 27 11 97 67
West Mercia 27 48 32 35 11 7 27 26 12 96 73
West Midlands 24 36 31 21 10 9 25 19 11 91 67
West Midlands Region 24 38 30 23 10 8 24 20 11 94 67
Bedfordshire 26 45 29 23 11 8 27 36 12 94 75
Cambridgeshire 27 46 30 21 11 13 25 22 13 97 71
Essex 34 56 24 18 15 16 35 32 17 100 77
Hertfordshire 35 59 30 27 18 13 32 36 16 96 75
Norfolk 34 54 31 29 20 18 31 46 16 98 79
Suffolk 30 52 27 31 15 12 26 35 13 92 63
East of England Region 31 53 28 23 15 14 30 33 15 97 74
London, City of 36 43 41 7 31 10 18 65 34 98 70
Metropolitan Police 24 35 25 16 11 6 15 13 12 93 62
London Region 24 35 26 16 11 6 15 14 13 93 62
Hampshire 27 40 24 25 11 8 26 26 13 95 64
Kent 33 52 36 22 18 15 34 33 18 96 80
Surrey 21 31 22 31 8 6 19 24 10 94 54
Sussex 29 52 32 28 11 6 25 26 14 98 73
Thames Valley 20 33 22 20 8 6 19 14 10 86 47
South East Region 26 41 27 23 11 8 25 22 13 93 63
Avon and Somerset 26 40 35 20 10 10 24 34 14 94 68
Devon and Cornwall 30 47 29 32 16 12 25 35 15 93 68
Dorset 24 40 21 26 11 8 19 37 12 88 64
Gloucestershire 30 46 27 24 17 17 29 33 14 95 64
Wiltshire 30 52 31 28 14 12 25 51 15 103 82
South West Region 28 44 30 23 13 11 24 36 14 94 68
ENGLAND 27 44 29 20 13 11 24 23 13 94 68
Dyfed-Powys 48 67 38 72 26 19 38 61 24 96 79
Gwent 26 48 35 25 8 6 31 25 13 94 62
North Wales 41 61 30 37 13 15 38 48 22 102 88
South Wales 30 52 45 45 17 11 27 31 13 92 77
WALES 33 56 38 40 14 11 31 36 16 95 77
British Transport Police 35 57 39 48 16 13 12 75 19 99 67
ENGLAND AND WALES 28 44 30 20 13 11 24 24 13 94 69
1. Percentage of offences detected through a sanction detection.
2. Offences detected in the current year may have been initially recorded in an earlier year and for this reason some percentages may exceed 100.
189
Percentages England and Wales, Recorded crimePolice force area, English region and Wales
2002/03 2003/04 2004/05 2005/06 2006/07 2007/08 2008/09 2009/10 % point change
2008/09 to
2009/10 2
Cleveland 22 19 19 24 29 33 38 40 2
Durham .. .. 22 23 28 29 30 33 3
Northumbria 27 26 25 32 37 38 39 40 0
North East Region 26 24 23 28 33 35 37 38 1
Cheshire 21 19 18 26 26 26 29 25 -4
Cumbria 25 26 25 30 32 38 39 40 1
Greater Manchester 16 17 20 24 24 25 25 25 0
Lancashire 26 22 22 29 34 35 34 35 1
Merseyside 21 21 18 25 27 32 36 39 2
North West Region 19 19 20 25 27 29 30 30 1
Humberside 16 15 17 20 24 31 30 28 -2
North Yorkshire 20 21 25 26 28 33 31 31 1
South Yorkshire 19 22 21 23 25 27 29 31 2
West Yorkshire 17 17 22 26 26 24 26 27 1
Yorkshire and the Humber Region 17 18 21 24 25 27 28 29 1
Derbyshire 21 18 23 26 25 29 27 23 -5
Leicestershire 21 20 24 29 28 27 24 23 -1
Lincolnshire 19 18 21 24 27 28 27 24 -3
Northamptonshire 20 19 19 20 23 25 24 24 0
Nottinghamshire 16 16 17 21 22 23 23 26 2
East Midlands Region 19 18 20 24 25 26 25 24 -1
Staffordshire 23 23 25 25 26 28 23 23 0
Warwickshire 20 19 20 24 26 26 25 24 -1
West Mercia 23 21 27 32 33 29 30 27 -3
West Midlands 26 25 22 26 27 27 29 24 -5
West Midlands Region 24 24 23 26 27 27 28 24 -3
Bedfordshire 21 20 23 23 20 22 26 26 -1
Cambridgeshire 14 15 17 26 24 27 25 27 1
Essex 16 17 22 26 29 32 35 34 -2
Hertfordshire 18 19 21 22 29 30 33 35 2
Norfolk 20 22 22 25 29 32 37 34 -3
Suffolk 24 24 24 27 28 30 34 30 -4
East of England Region 18 19 21 25 27 29 32 31 -1
London, City of 33 30 26 40 35 36 36 36 0
Metropolitan Police 13 13 15 18 21 25 26 24 -2
London Region 13 13 15 18 21 25 26 24 -2
Hampshire 24 22 23 21 22 26 25 27 2
Kent 23 22 20 24 25 27 32 33 1
Surrey 18 19 22 23 29 27 22 21 -1
Sussex 18 21 21 26 27 32 26 29 3
Thames Valley 19 17 21 27 24 25 24 20 -4
South East Region 20 20 21 24 25 27 26 26 0
Avon and Somerset 15 15 16 23 24 25 26 26 0
Devon and Cornwall 21 20 20 25 26 28 30 30 0
Dorset 18 20 25 28 29 27 25 24 -1
Gloucestershire 24 23 21 28 30 32 31 30 -1
Wiltshire 23 24 25 27 22 27 31 30 -1
South West Region 19 19 20 26 26 27 28 28 0
ENGLAND 19 18 20 24 26 28 28 27 -1
Dyfed-Powys 55 37 30 40 42 42 44 48 3
Gwent 34 30 28 27 30 30 30 26 -4
North Wales 21 21 25 29 34 40 42 41 -1
South Wales 24 23 24 22 24 26 28 30 2
WALES 28 26 26 27 30 31 33 33 0
British Transport Police 14 15 15 18 23 27 32 35 3
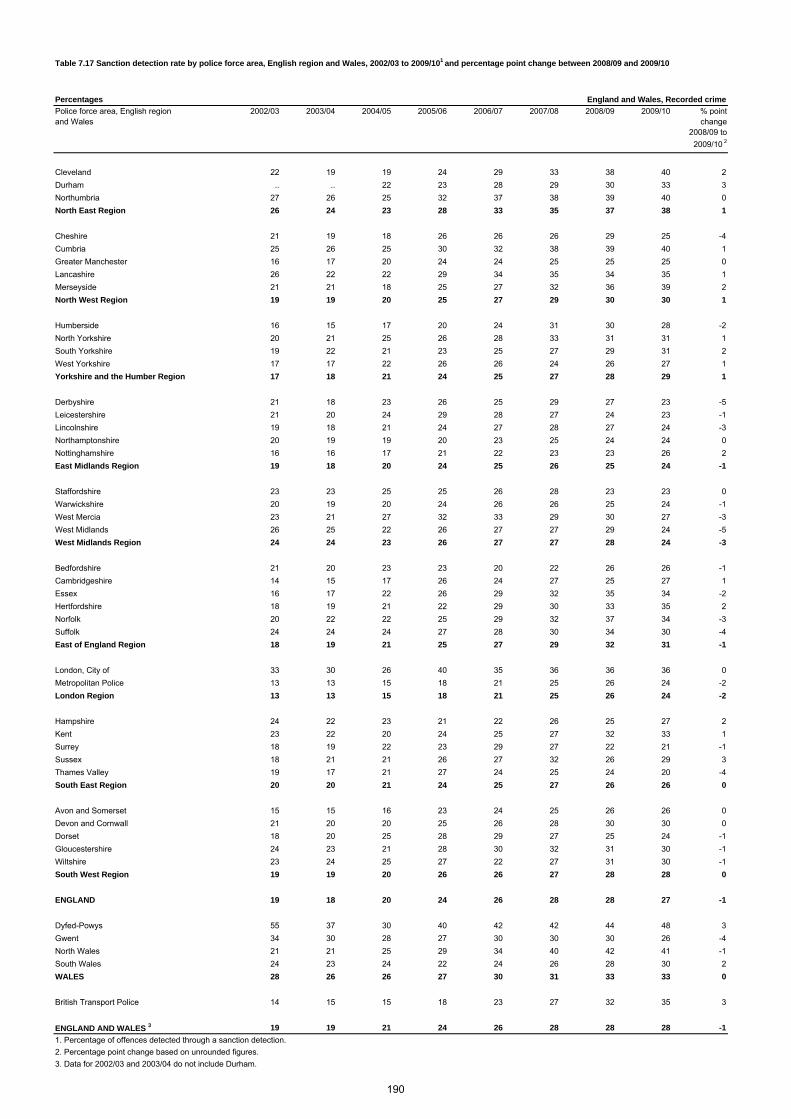
ENGLAND AND WALES 3 19 19 21 24 26 28 28 28 -11. Percentage of offences detected through a sanction detection.
2. Percentage point change based on unrounded figures.
3. Data for 2002/03 and 2003/04 do not include Durham.
Table 7.17 Sanction detection rate by police force area, English region and Wales, 2002/03 to 2009/101 and percentage point change between 2008/09 and 2009/10
190

Percentages England and Wales, BCS
% very/fairlyconfident
Statistically significantly
different from England and
Wales1
Statistically significant
change,2008/09 to
2009/101
Unweightedbase
% very/fairlyconfident
Statistically significantly
different from England and
Wales1
Statistically significant
change,2008/09 to
2009/101
Unweightedbase
Cleveland 54 ** 920 36 ** 919Durham 58 992 37 ** 999Northumbria 58 979 39 989North East Region 57 2,891 38 ** 2,907
Cheshire 60 923 39 929Cumbria 61 938 41 926Greater Manchester 54 ** 1,342 37 ** 1,331Lancashire 61 ** # 941 39 ** # 942Merseyside 55 890 41 890North West Region 57 ** 5,034 39 ** 5,018
Humberside 50 ** 898 29 ** 895North Yorkshire 61 955 39 ** # 970South Yorkshire 55 919 38 909West Yorkshire 58 1,131 42 1,134Yorkshire and the Humber Region 56 ** 3,903 38 ** 3,908
Derbyshire 55 ** 857 38 860Leicestershire 60 924 44 909Lincolnshire 55 ** 978 35 ** 985Northamptonshire 59 968 38 956Nottinghamshire 53 ** 960 35 ** ** # 980East Midlands Region 56 ** 4,687 38 ** ** # 4,690
Staffordshire 50 ** 932 33 ** 939Warwickshire 62 ** # 965 39 969West Mercia 63 ** ** # 940 45 ** ** # 940West Midlands 56 ** 1,312 40 1,308West Midlands Region 57 ** 4,149 40 4,156
Bedfordshire 63 938 41 932Cambridgeshire 63 986 42 984Essex 54 ** 1,004 37 ** # 1,005Hertfordshire 65 ** ** # 888 45 ** 889Norfolk 61 860 41 853Suffolk 59 908 42 908East of England Region 60 5,584 41 ** # 5,571
Metropolitan/City of London 67 ** ** # 3,725 51 ** ** # 3,708London Region 67 ** ** # 3,725 51 ** ** # 3,708
Hampshire 60 956 39 971Kent 59 929 38 928Surrey 66 ** 892 41 896Sussex 60 921 36 ** 921Thames Valley 62 1,072 44 ** # 1,072South East Region 61 4,770 40 4,788
Avon and Somerset 61 960 40 ** # 963Devon and Cornwall 61 948 42 ** # 942Dorset 60 903 40 906Gloucestershire 61 936 41 942Wiltshire 61 ** # 938 34 ** 947South West Region 61 4,685 40 ** # 4,700
England Total 60 ** # 39,428 41 ** # 39,446
Dyfed-Powys 59 979 38 974Gwent 51 ** 812 30 ** 827North Wales 58 935 42 951South Wales 54 ** 932 35 ** 930Wales 55 ** 3,658 36 ** 3,682
ENGLAND AND WALES 59 ** # 43,086 41 ** # 43,1281. '**' denotes statistical difference in comparison with England and Wales while '**#/$' denotes statistically significant change from 2008/09 to 2009/10.
Table 7.18 Fairness and effectiveness of the criminal justice system by police force area, English region and Wales
CJS effectivenessPolice force area, English region and Wales
CJS fairness
191

Table 7.19 Perceptions of anti-social behaviour by police force area, English region and Wales
Percentages England and Wales, BCS
% Statistically significantly
different from England and
Wales3
Statistically significant
change,2008/09 to
2009/103
Unweightedbase
% very/fairly big problem
Statistically significantly
different from England and
Wales3
Statistically significant
change,2008/09 to
2009/103
Unweightedbase
% very/fairly big problem
Statistically significantly
different from England and
Wales3
Statistically significant
change,2008/09 to
2009/103
Unweightedbase
Cleveland 19 900 34 ** 902 26 946Durham 15 980 31 ** 982 26 1,020Northumbria 16 972 26 977 27 1,015North East Region 16 2,852 29 2,861 27 2,981
Cheshire 12 916 25 919 21 **$ 946Cumbria 10 ** 932 23 935 21 ** 970Greater Manchester 16 **$ 1,301 30 ** **$ 1,315 28 ** **$ 1,367Lancashire 14 937 27 941 22 979Merseyside 20 ** 855 36 ** 859 25 911North West Region 15 **$ 4,941 29 ** **$ 4,969 25 **$ 5,173
Humberside 13 896 20 ** 897 21 912North Yorkshire 8 ** 967 18 ** 970 19 ** 990South Yorkshire 16 889 28 893 23 939West Yorkshire 17 1,096 34 ** 1,102 26 1,156Yorkshire and the Humber Region 15 3,848 28 3,862 23 3,997
Derbyshire 13 852 25 855 25 881Leicestershire 14 887 23 893 23 939Lincolnshire 7 ** 973 17 ** 976 18 ** 1,022Northamptonshire 15 942 26 947 22 997Nottinghamshire 14 **$ 925 27 **$ 935 23 1,003East Midlands Region 13 **$ 4,579 24 ** 4,606 22 4,842
Staffordshire 17 881 30 891 25 955Warwickshire 10 ** **$ 925 18 ** 927 20 ** 978West Mercia 9 ** **$ 926 24 934 20 ** 961West Midlands 19 ** 1,293 30 ** 1,294 22 1,348West Midlands Region 15 4,025 27 4,046 22 4,242
Bedfordshire 15 922 28 925 20 ** 953Cambridgeshire 11 ** 961 20 ** 963 20 ** 1,014Essex 11 ** 954 20 ** 960 19 ** 1,016Hertfordshire 11 875 22 879 25 904Norfolk 10 ** 844 21 850 18 ** 873Suffolk 9 ** 885 16 ** 889 17 ** 924East of England Region 11 ** 5,441 21 ** 5,466 20 ** **$ 5,684
Metropolitan/City of London 20 ** 3,514 32 ** 3,553 30 ** 3,861London Region 20 ** 3,514 32 ** 3,553 30 ** 3,861
Hampshire 13 910 23 920 28 986Kent 20 ** 901 26 906 28 949Surrey 10 ** 879 17 ** 883 20 ** 910Sussex 13 910 21 ** 915 22 936Thames Valley 11 ** 1,028 25 1,036 21 1,090South East Region 13 4,628 23 ** 4,660 24 4,871
Avon and Somerset 12 948 22 ** 950 20 ** 984Devon and Cornwall 9 ** **$ 927 16 ** **$ 930 20 964Dorset 10 ** 914 20 ** 919 22 932Gloucestershire 8 ** **$ 939 18 ** **$ 941 16 ** **$ 956Wiltshire 8 ** 929 18 ** 932 18 ** 984South West Region 10 ** **$ 4,657 19 ** **$ 4,672 20 ** **$ 4,820
England Total 14 **$ 38,485 26 **$ 38,695 24 **$ 40,471
Dyfed-Powys 5 ** **$ 991 20 ** 999 16 ** **$ 1,026Gwent 22 ** 798 37 ** 809 31 ** 845North Wales 10 ** 951 23 955 20 977South Wales 21 ** 923 38 ** 932 33 ** 953Wales 16 3,663 31 ** 3,695 26 3,801
ENGLAND AND WALES 14 **$ 42,148 26 **$ 42,390 24 **$ 44,272
3. '**' denotes statistical difference in comparison with England and Wales while '**#/$' denotes statistically significant change from 2008/09 to 2009/10.
2. Perceptions of drug use/dealing and perceptions of drunk/rowdy behaviour are two of the seven strands that make up the overall measure of perceptions of anti-social behaviour (see Section 6 of the User Guide to Home Office Crime Statistics for more information). These two strands form part of the measurement system for PSA 25 (see Appendix 1).
High level of perceived anti-social behaviour1 Drug use or dealing problem in area2 Drunk or rowdy behaviour problem in area2
1. Anti-social behaviour (see Section 6 of the User Guide to Home Office Crime Statistics for more information).
Police force area, English region and Wales
192

Table 7.20 Attitudes to local police by police force area, English region and Wales
Percentages England and Wales, BCS
% sayingpolice do
excellent/good job
Statistically significantly
different from England and
Wales1
Statistically significant
change,2008/09 to
2009/101
Unweightedbase
% agree Statistically significantly
different from England and
Wales1
Statistically significant
change,2008/09 to
2009/101
Unweightedbase
Cleveland 55 922 54 **$ 920Durham 55 1,009 56 1,014Northumbria 57 1,000 58 995North East Region 56 2,931 57 2,929
Cheshire 55 ** # 932 51 ** 929Cumbria 60 ** 960 63 ** 953Greater Manchester 50 ** 1,349 51 ** 1,341Lancashire 57 960 61 ** ** # 965Merseyside 56 898 56 875North West Region 54 ** ** # 5,099 55 ** # 5,063
Humberside 47 ** 905 47 ** 902North Yorkshire 60 971 58 975South Yorkshire 56 ** # 928 51 ** 936West Yorkshire 57 ** # 1,137 57 ** # 1,117Yorkshire and the Humber Region 56 ** # 3,941 54 ** # 3,930
Derbyshire 51 ** 869 53 871Leicestershire 57 927 58 925Lincolnshire 48 ** 987 52 ** 1,006Northamptonshire 54 ** 996 52 988Nottinghamshire 46 ** 983 46 ** 979East Midlands Region 51 ** 4,762 52 ** 4,769
Staffordshire 52 946 51 ** 933Warwickshire 53 ** # 968 52 954West Mercia 56 947 58 919West Midlands 56 1,336 57 1,293West Midlands Region 55 ** # 4,197 56 4,099
Bedfordshire 58 943 57 ** # 948Cambridgeshire 52 ** 1,009 55 ** # 1,010Essex 56 1,009 60 1,005Hertfordshire 62 ** 898 59 886Norfolk 54 867 57 856Suffolk 57 915 59 ** 912East of England Region 56 5,641 58 ** 5,617
Metropolitan/City of London 59 ** ** # 3,814 57 3,728London Region 59 ** ** # 3,814 57 3,728
Hampshire 59 964 58 962Kent 52 ** 930 52 931Surrey 64 ** 905 59 892Sussex 59 929 53 922Thames Valley 60 ** # 1,077 54 1,072South East Region 58 ** 4,805 55 4,779
Avon and Somerset 57 ** # 967 56 958Devon and Cornwall 63 ** 944 58 944Dorset 62 ** 922 60 ** 909Gloucestershire 59 ** # 946 59 937Wiltshire 58 970 59 ** 954South West Region 60 ** ** # 4,749 58 ** 4,702
England Total 57 ** # 39,939 56 ** # 39,616
Dyfed-Powys 58 1,012 61 ** 994Gwent 45 ** 840 47 ** 819North Wales 53 947 57 937South Wales 52 948 50 ** 941Wales 52 ** 3,747 53 ** 3,691
ENGLAND AND WALES 56 ** # 43,686 56 ** # 43,3071. '**' denotes statistical difference in comparison with England and Wales while '**#/$' denotes statistically significant change from 2008/09 to 2009/10.
Police force area, English region and Wales
Rating of local police Police deal with local concerns
193

Table 7.21 Attitudes to local police working in partnership by police force area, English region and Wales
Percentages England and Wales, BCS
% sayingstrongly agree/
tend to agree
Statistically significantly
different from England and
Wales3
Statistically significant
change,2008/09 to
2009/103
Unweightedbase
% sayingstrongly agree/
tend to agree
Statistically significantly
different from England and
Wales3
Statistically significant
change,2008/09 to
2009/103
Unweightedbase
Cleveland 54 919 48 926Durham 54 1,013 49 1,011Northumbria 57 ** 996 54 ** 1,000North East Region 56 ** 2,928 51 ** 2,937
Cheshire 48 931 46 938Cumbria 57 ** 951 50 956Greater Manchester 52 ** # 1,349 42 ** 1,353Lancashire 56 ** 961 50 967Merseyside 55 ** 885 50 882North West Region 53 ** # 5,077 47 5,096
Humberside 50 905 41 ** 904North Yorkshire 51 972 45 969South Yorkshire 51 933 48 ** # 935West Yorkshire 52 1,117 48 1,118Yorkshire and the Humber Region 51 3,927 47 ** # 3,926
Derbyshire 49 874 46 879Leicestershire 48 931 46 932Lincolnshire 47 ** ** # 992 40 ** 1,006Northamptonshire 49 ** # 988 49 ** # 991Nottinghamshire 47 ** 969 44 990East Midlands Region 48 ** 4,754 45 ** 4,798
Staffordshire 48 940 47 951Warwickshire 49 965 41 ** 966West Mercia 47 922 47 936West Midlands 50 1,317 46 1,330West Midlands Region 49 ** 4,144 46 4,183
Bedfordshire 51 ** # 945 49 949Cambridgeshire 45 ** 1,010 43 ** 1,008Essex 57 ** 994 49 1,004Hertfordshire 54 885 43 ** 895Norfolk 54 855 49 858Suffolk 50 909 39 ** 913East of England Region 53 ** # 5,598 46 5,627
Metropolitan/City of London 55 ** ** # 3,743 52 ** ** # 3,759London Region 55 ** ** # 3,743 52 ** ** # 3,759
Hampshire 52 961 47 965Kent 48 930 45 933Surrey 55 898 53 ** 900Sussex 49 926 40 ** 925Thames Valley 50 1,078 47 1,082South East Region 51 4,793 46 4,805
Avon and Somerset 49 968 47 ** # 970Devon and Cornwall 49 951 43 ** 952Dorset 52 907 46 914Gloucestershire 53 937 50 ** # 944Wiltshire 48 ** 951 42 ** 968South West Region 50 4,714 45 ** # 4,748
England Total 52 ** # 39,678 47 ** # 39,879
Dyfed-Powys 49 997 46 1,004Gwent 45 ** 824 45 ** # 832North Wales 47 ** 927 44 902South Wales 50 ** # 946 45 938Wales 48 ** ** # 3,694 45 ** # 3,676
ENGLAND AND WALES 51 ** # 43,372 47 ** # 43,5551. Respondents are asked how much they agree or disagree with the statement 'The police and local council are dealing with the anti-social behaviour and crime issues that matter in this area '.2 Respondents are asked how much they agree or disagree with the statement 'The police and local council seek people's views about the anti-social behaviour and crime issues that matter in this area'.
Police and local council are dealing with issues1 Police and local council seek people's views2Police force area, English region and Wales
3. '**' denotes statistical difference in comparison with England and Wales while '**#/$' denotes statistically significant change from 2008/09 to 2009/10.
194