7, - garnaut climate change revie · what it is the real science telling us about global warming?...
TRANSCRIPT
B.E.(Syd.), C.Eng., M.I.C.E, F.l.E. Aust., M.A.C.E.A., M.A.C.S.E.
STRATHAIRD ROCICLEY N.S.W. 2795 Telephone (02) 6337 9315 Fax (02) 6337 9315
Department of Premier and Cabinet
Document No. D08/43010
Folder No. F07/1670
RPPOOOLXTA
The Secretary, Garnaut Review Secretariat. Level 2, 1 Treasury Place. EAST MELBOURNE. VIC. 3002.
>th 8'". April, 2008
Dear Sir,
Re: Submission to Issues Paper Three.
Please find herewith my submission to the above Issues Paper.
I would be pleased if you would advise me of the time and location of any public hearings, such as those held by the Productivity Commission, which may take place after written submissions have been received.
Yours faithfully,
7,
F.S. Hespe.
GARNAUT CLIMATE CHANGE REVIEW
ISSUES PAPER 3
CLIMATE CHANGE : WHAT IS THE SCIENCE TELLING US?
SUBMISSION BY
F.S. Hespe B.E.(Syd.), M.I.C.E., F.I.E.Aust, M.A.C.E.A., M.A.C.S.E. Consulting Forensic Engineer
SYNOPSIS
The science underlying the forecasts of the Intergovernmental Panel on Climate Change (IPCC) has been examined fi^om an epistemological point of view. When the evidence of the observed data, the empirical assessment of the data, and the established theory of the physical chemistry of the atmosphere is considered, it can be seen that there is no basis for the hypothesis that emissions of carbon dioxide (or other gases) from man's industrial and other activities will cause, or will be likely to cause, serious, much less catastrophic, increase in global temperature. Yet, this is the expressed view of the IPCC and the coterie of self-serving scientists it supports.
It has been shown that a number of key postulates of the IPCC are not only wrong but are in fact fraudulent. There is clear evidence that a number of the scientists providing information to or working for the IPCC have knowingly changed, altered or adjusted data or results to suit preconceived notions. In particular, a program designed to show that temperature change at the global level had been negligible or falling until the last half of the 20th century, was shown to give the same results even if random numbers were provided as input. This was the notorious 'hockey stick'. The General Circulation Models, the predictive tools used by IPCC scientists, have been shown to be seriously flawed.
The IPCC, in successive reports, has progressively increased its predictions of catastrophe. In its 2007 report it stated that there was 'observational' evidence both directly from temperature changes and melting snow to the effect that it is unequivocal that the planet is warming. Yet, the fact remains that world temperatures have declined since 1998, levelled out in 2000 and then have fallen 0.6C° in 2007.
Other factors than the so-called greenhouse gases have been examined. It is clear that there are a number of natural forces acting on the world's climate which have been shown to materially affect its temperature. Some of these, in particular sunspot activity, have been shown to have been, together, responsible for most of the increase in temperature of the last century. There is evidence that the next sunspot cycle, which is just commencing, is likely to be a low cycle, bringing cool or cold temperatures to the world.
The reasons behind the apparent populist acceptance of the IPCC's claims have been examined. It is clear that the original driving force behind the global warming propaganda was, in Nisbet's words, "that permanent cadre of political and social radicals Western society has nurtured ever since the French revolution." These ideologists of the left are at the core of the environmental and global warming movement. It no longer being possible to promote red agendas, they are promoting the green equivalent. The media has taken up the cause, and together with a number of notorious propagandists (Gore and Flannery for example) have relentlessly promoted it to the masses.
The final result of all this will be, unless reason and commonsense return, the draconian imposition of a reduction in carbon dioxide emissions of 60%. This effectively means a reduction of 60% in power generation, transport, and exports; and the devastation of Australia's economy. The global warming lobby suggests that 'renewable' energy will replace existing coal-fired generators; this has been shown to be absurd. Australia, which produces 1.5% of the world's carbon dioxide is to be asked to destroy its economy by reducing these omissions, while China (16%), India (3.5%), Brazil (5.2%), the Soviet Union (5.6%) and Indonesia (8.7%) will be able to carry on more or less as before; the first three, without any restraint at all. The position of the USA (16.8%) is still an enigma.
WHAT IT IS THE REAL SCIENCE TELLING US ABOUT GLOBAL WARMING?
1. PREAMBLE.
1.1 Introduction.
The true interpretation of the scientific evidence shows that the emissions of carbon dioxide produced by man's industrial and other activities have not caused nor are likely to cause serious, much less catastrophic, results.
However, before dealing with the scientific evidence (see Chapter 4 below), it is necessary to consider why it is that the populist interpretation of the scientific data says the opposite. It will also be necessary to consider it in its political (ideological) and social (sociological) environment.
The populist interpretation is the result of what is without doubt the greatest fraud ever perpetrated on society. It leaves the South Sea Bubble, the Year 2K. frenzy, and the dot com fiasco in the shade; and makes the Piltdown Man hoax look like a schoolboy prank.
The global warming (or climate change) industry, as it has become, has made the fortune of not a few people, and has provided a very comfortable living for many, many, more. On the way, it has caused considerable loss and distress to others (see Chapter 3 below).
Predictions of doom are not a new phenomenon, Malthus and the Club of Rome spring to mind. These, and all other such predictions, have been proven totally wrong. This has not prevented the present day reciters of this litany from carrying on in the same vein. However, because of modem day communications and the media, their message has become very widely disseminated and, unfortunately, widely believed (see 1.4 below). What is more disturbing is that some of the organisations promoting these false ideas are prepared to commit violent and criminal offences to promote their ends. Notable among these is Greenpeace.
1.2 Origins of the Global Warming Fraud.
Sensible people have always being concerned (in the original, not the present day politically correct, sense of the word) about the environment. It is common sense not to waste assets such as energy soil and water. Similarly, it is important to so order the production cycle that major items can be repaired, and that as much as possible can be renewed and/or recycled. It is worth pointing out that this attitude was widespread well before the genesis of the environmental movement.
There have always been people who are not satisfied with the state of society, and about the middle of the last century a number of these transferred their attentions to the environment.
One of the first of these was Rachel Carson who, in her book "Silent Spring" said, for example; "Some evil spell had settled on the community: mysterious maladies swept the flocks of chickens; the cattle and sheep sickened and died. Everywhere was a shadow of death There had been several sudden and unexplained deaths, not only among adults but even among children, who would be stricken suddenly while at play and die within a few hours." and again; "For the first time in the history of the world, every human being is now subjected to contact with dangerous chemicals, from the moment of conception until death."
By dangerous chemicals she specifically meant pesticides. It is usually assumed that she was only talking about DDT, but her campaign was against all pesticides, and for that matter all non natural chemicals.
Her claim that they caused high incidences of cancer deaths has been comprehensively destroyed', but her disingenuous message, with its accompanying fears, goes marching on.
Carson's methods of exaggeration, downright lies, and above all the inculcation of fear, have become the stock in trade of the envirorunental movement; which has gone on to other things than pesticides. It has encompassed the animal liberation movement; which, amongst other things, wants to remove all sheep from Australia; the tree lovers; the endangered species lobby; and now the global warming fanatics.
It must not be construed from the last paragraph that the care of animals, the appropriate and sensible preservation of tree cover, biodiversity and the protection of native fauna are not desirable, or indeed, important concerns. Nevertheless, what is completely forgotten or disregarded by the "green" movement is that all these things must be balanced with the needs of civilisation, with the rule of law; and, above all, must be based on carefiil and probative scientific investigation.
'&*-
Unfortunately, the environment movement attracted more than its fair share of unbalanced individuals and they soon became the driving force of the various organisations set up to advance their agenda. Greenpeace, the World Wide Fund for Nature, the Worldwatch Institute; and here in Australia, the Australian Conservation Foundation, the Total Environment Centre, and various other, smaller, groups are replete with fanatics who have no real understanding (or concern, for that matter -see Chapters 2 & 3 below) of environmental processes, but are quite ready to follow Carson's methods.
1.3 Science?
a.) Mainstream. The latest manifestation of the environmental movement is embodied in the campaign to represent that the world is heading for catastrophe as a result of the emissions of carbon dioxide by man's industrial and other activities. This campaign has been encouraged by the venal media, using the usual fear tactics.
Disgracefully, the campaign has been joined by certain unscrupulous "scientists" who have capitalised on their previous academic or other qualifications in order to reap funding benefits and publicity. Many of them operate in "that murky and secret world where politics and science meet" (see Chapter 2 below); but others, perhaps more on the fringe of real science, relish the notoriety and its consequent emoluments.
Most of the scientists who have committed themselves to the global warming campaign are in government employ (either directly or in academia) and therefore have a vested interest in maintaining the flow of government funding. Most governments in the Western world have fallen into this trap, with the result that many billions of dollars have been wasted on fruitless activities.
Studies have shown that of the incidence of cancer deaths in the United States 0.01% of food related cancer deaths are attributable to pesticides; ajid only 0.003% of all cancer related deaths. Coffee, on the other hand, is 10 times more dangerous than all pesticides. Doll and Peto 1981: 1256, and Seheuplein 1991.
4 Unfortunately, the widely promoted and believed idea that scientists are only concerned with the truth, and will not allow their search for truth to be diverted, is as much a myth as is the idea of catastrophic global warming. It is common practice in the scientific community to "adjust" results of experiments to fit preconceived theories. Recently, 15% of scientists at the US National InstittJte of Health admitted to "bending" data to fit their theories.' If 15% admitted to malpractice, how many more compounded their malpractice by not admitting it?
There is another, more insidious, practice called peer review. This, if properly conducted is perhaps the best way to ensure proper results. Unfortunately it can lead to the suppression, or at least temporary suppression, of outstanding work. Two classic examples of this were de Broglie's matter waves in quantum field theory and Parker's theory of the solar wind. However, the common and unfortunate consequence of peer review is to create coteries of like-minded individtials who regularly review and "approve" each other's work. It is in this way that the present politically correct view of climate change has been developed. Once started it becomes very difficult for those who have committed themselves and/or supported their peers to retract from their position. It would be fair to say that some may have painted themselves into a comer, as the saying goes, by having perhaps a genuine piece of research taken up by the global warming fraternity and being seduced into pursuing the line of research beyond its reasonable conclusion. Furthermore, for some it is hard to summon up the necessary courage to get off the "gravy train" of government and other funding.
There are many examples of scientific fraud going back beyond the beginnings of environmentalism and in areas not immediately concerned with the present subject. However, the observed and presumed incidence of it in the global warming scientific coterie shows it to be endemic. Which raises a number of questions as to the authenticity of the material promoted by these people.
There is no need to rehearse here the older data, nor that in areas outside that of our present concern. But it will be illuminating to mention perhaps a few of the known frauds associated with material produced by the United Nations Intergovernmental Panel on Climate Change (IPCC).
The first concerns the notorious "hockey stick" (see Fig.9 Appendix A) produced by Mann et al ,̂ which purported to show northern hemisphere average temperatures over the last millennium. Quite apart from it being grossly at variance with other well authenticated data (see Figs.4, 13) including the IPCC's own figure of 1990 (see Fig.8), it was later shown to be completely fraudulent. Professor E. J. Wegman of George Mason University, one of the leading computational statisticians in the US, and his colleagues agreed with the earlier results of the Canadians Mclntyre and McKitrick which showed that the algorithm used by Mann would produce the hockey stick even when the input was random numbers. Part of Wegman's comment is interesting in the light of the two paragraphs at the head of this page. Inter alia he says " the coterie of most frequently published climate apologists is so insular and close-knit that no effective independent review of the work of Mr Mami is likely our perception is that this group has a self reinforcing feedback mechanism and, moreover, the work has been sufficiently politicised that they can hardly reassess their public positions without losing credibility."
Professor Terence Kealey -- Sydney Morning Herald 3.3.08
Mann, Bradley and Hughes, 1999, Geophysical Research tellers. Voluine 26.
Another falsification, knowingly perpetrated by a Mr P. Jones, Director of the Climate Research Unit at the University of East Anglia and Professor Wei-Chung Wang of the State University of New York, Albany, concerned temperature data from 84 Chinese weather stations.
Regrettably, but typically, the IPCC has not acknowledged or even commented upon the exposure of these frauds; and therefore, by association, has been shown to be fraudulent itself If those in charge of the IPCC were company directors in Australia they could well be in gaol as a result of their activities.
The General Circulation Models (GCM's) used by a number of different investigators and organisations, and enthusiastically endorsed by the IPCC itself, are at least quasi fraudulent. They purport to predict a rise in temperature over a timespan of the order of 70 to 100 years by inputting certain data. These will be dealt with in Chapter 4 below, but it is interesting to note what professional climatologists and forecasters have to say. For example:- "In general, short-range forecasts over 24 hours and medium-range forecasts show a usefijl accuracy, but most long-range forecasts still appear to be hardly more accurate than using a table of normal values and a coin.'" and this is speaking of forecasts of no more than a year or two! Again; "Skilfiil initial value GCM climate prediction will likely never be possible realistic initial value forecasts currently cannot be made more than a week or two into the future. Any imperfect representations of the highly nonlinear parameters of the atmosphere-ocean system tend to quickly degrade into unrealistic flow states upon long period integration. Skilfiil short-range prediction is possible because there tends to be conservatism in the initial momentum fields which can be extrapolated or advected for short periods. But beyond about one or two weeks the many multiple unknown and nonlinear energy moisture exchanges within the earth system become dominant Currently, GCMs do not make seasonal or yearly forecasts. They dare not issue these forecasts because they know they are not skilful How can we trust GCM climate forecasts 50 and 100 years into the future (that cannot be verified in our lifetime) when these same models are not able to demonstrate shorter range forecast skill of a season or year?" ^ Clearly, the GCMs cannot be considered from a climatological or forecasting point of view, and must be looked at simply as mechanisms for processing data. The question is, are the data and the algorithms used "manipulated"? This will be dealt with in Chapter 4.
To return for a moment to scientific fraud or misrepresentation outside the immediate concern of this paper, but which epitomises the approach taken by the protagonists of the cataclysmic consequences of "man-made" carbon dioxide. One such is Professor David Pimentel of Cornell University. In a tendentious paper purporting to show the effects of environmental degradation, amongst other things, he stated (correctly) that the incidence of tuberculosis in the United States increased by 18% between 1985 and 1991. What he did not say was that the incidence of tuberculosis has been steadily decreasing since about 1950 and is still decreasing; the increase between 1985 and 1991 was simply a slight " hiccup" in an otherwise fairly uniform curve^. Furthermore the 18% was on the 1985 figure, not on the basis percentage. The good professor does not confine his interests to medicine; in 1995 he pronounced that the United States lost 30 tonnes of topsoil per hectare whereas the real figure was 12 tonnes. He also stated that the European loss was 17 tonnes per hectare which was based on a single study of a O.I 1 ha plot of sloping Belgian farmland.
' Linacre E. & Hobbs J. Tlie .Australian CUrnaiic Environmenl John Wiley and Sons. Brisbane 1986.
^ Gray W.. Address to the Marshall Institute, 11 October 2006.
Summary of Notifiable Diseases. United States 1994
Another such is the widely quoted Professor Paul Ehrlich. In 1981 he stated that the world was losing 250,000 species per annum, that half of the world's species would be gone by the year 2000 and all species would be gone by 2010 -20251 Actual, observed species and losses are 1,600,000 and 1033 respectively.' However, these figures are accepted to be significantly low. The general consensus of recent research seems to be that the extinction rate probably lies between 0.1% and 1% per 50 years. Ehrlich's response to this? " biologists don't need to know how many species there are, how they are related to one another, or how many disappear annually, to recognize that the Earth's biota is entering a gigantic spasm of extinction."
This sort of nonsense is symptomatic of all the pronouncers of doom, including the global warmers.
In Australia, biodiversity, or rather its apotheosis, is a product of the high level of urbanisation of the Australian population; and it's readiness to believe that the extinction of, for example, a particular species of frog would mean "the end of the world." This type of stupidity has very serious implications for land-holders (see Chapter 3 below). On the other hand, in regard to biodiversity. Emeritus Professor Charles Birch, one of Australia's most eminent ecologists, has said^ that among the many myths surrounding the layman's understanding of nature and ecology was "....the idea that organisms (plants and animals) in a community are harmoniously adjusted to one another so that a state of equilibrium exists" , another was "the idea that complexity enhanced stability, in terms of the number of organisms in a community and the number of species present." He also said it was quite wrong to think "— that significant changes in numbers of each species only occur when something upsets the natural ' balance'". There was some evidence of positive or " symbiotic" interactions in nature, he said, but the more common kinds were competition, predation, parasitism, natural catastrophe and disease. Similarly, "the view of some 'environmentalists' that ecosystems were fragile was quite wrong." He explained that these and most other urban myths about the environment are absurd. Nature is not fragile, and it is more reasonable to think of the enviromnent, and the numbers of organisms in it, as being in a state of constant flux. He pointed to the Permian extinction of 250 million years ago which wiped out 90 % of all plant and animal species, and the dinosaur extinction of 65 million years ago which wiped out 99.9% of all species that had ever existed as examples of nature's resilience.
Returning to the main theme of this paper, it is particularly disturbing and disgraceful that the global warming scientific establishment has seen fit to demonise those scientists who oppose it. This is exemplified by the, largely successful, attempts to stifle any public expression of opposing opinion and facts, which is accompanied by evermore strident and exaggerated forecasts. The only explanation for this is that the "global warmers" are becoming fearful that their disingenuous claims will be exposed for what they are.
Perhaps the most disgraceful of these efforts was the Royal Society declaring that "the science was settled." But then of course the Royal Society has been infiltrated by politically correct appointees, such as Lord May the then British chief scientist, appointed to that position by the Blair New Labour government.
' Baillie and Groombridge 1997, Walter and Gillctt 1998, May et al 1995, Read 1992.
•̂ Address to students. Faculty of Science - University of Sydney. May 2000. Reported in the University of Sydney News
7 Only a scientific cretin or a liar would say that the science was settled. In general terms science is never settled. For example quantum theory, which has been established in most of its aspects for about 50 years, and upon which the development of nuclear energy, the transistor, computers, lasers, CDs and all their derivatives has depended, and which has stood the test of an enormous number of experiments and investigations, is regarded as being far from settled. Einstein, for example, went to his grave believing that it was wrong in many respects, despite the fact that his proof of the photovoltaic effect was one of the foundation stones of the theory.
The authors of the Interim Report of the Garnaut Climate Change Review state that "the IPCC's view that climate change is happening, and in the absence of effecfive mitigation has the potential to impose huge costs on human society, is supported by the large majority of scientific opinion." (emphasis not in original) What they do not say is that this "large majority" comprises only the contributors to and supporters of the IPCC's view. There are in fact an overwhelming number of highly respected scientists who not only do not support the IPCC's view but strongly oppose it.
The authors of the hiterim Report make a point of saying that the scientific literattire used by the IPCC is "peer reviewed" and that it represents "mainstream" science. The authors' use of the word mainstream is not the same as that of the title of this subsection of the present paper. They mean mainstream of all the science of the subject; which is simply not true; whereas the mainstream of this subsection simply refers to the scientists with seemingly appropriate qualifications who support the IPCC's view. Peer review, and its tendentious effects have been discussed in the second paragraph of page 4 above. It is sufficient to say here that the coterie of scientists supporting the global warming fiction have developed into a mutual admiration society.
Mention has been made of the global warming "gravy train" (see par.2 p.4 above). An unfortunate concomitant to this is the increasing number of scientists, even in other disciplines, - and non scientists- who see it as a means to funding. Three examples are given here.
The developers of the Estuarine Sedimentation Model in the Faculty of Science at the University of Sydney have been successful in predicting the effect of sedimentation in Port Jackson and other New South Wales estuaries. In particular they did work in Homebush Bay for the Sydney Olympic Park Authority.' They are now moving to " model predicted climate change impacts on Sydney Harbour". Perhaps with a view to further funding?
Associate Professor Miiller and PhD candidate Joanne Whitaker in the Faculty of Science at the University of Sydney, working with an international team of geophysicists, have discovered some remarkable new data which could change the present view of the movement of tectonic plates. But mark this. Miss Whitaker has been quoted as saying "We can use these reconstructions to aid predictions for long-term climate change."- (Emphasis not in original)
And finally this bizarre item. A Sydney University Law student, Anna Rose, seeing colliers lying off Newcastle heads (no doubt held up by the inefficiencies of the New South Wales railway system and costing their owners large sums in demurrage) thought to herself "Every one of those ships was exporting climate chaos to the rest of the world." She thereupon founded be Australian Youth Climate Coalition (AYCC) and was sent to the United Nations
University of Sydney News. July 2004.
^ University of Sydney News. October 2007.
8
summit on climate change in New York in October 2007. According to the report, the AYCC has acquired "more than $70 million infunding"\ ' (Emphasis and ! not in original) If tliis report is true, one is left with the conclusion that the Australian cormnunity, or perhaps only those who provided the $70 million, have gone mad.
b.) The (Lunatic) Fringe. It is those on the fringe of science however (and those beyond the fringe) who have made the most - in both senses of the expression -of and from global warming. It could be said that without them, the publicists, the global warming fraud would not have developed as it has. The scientist proponents of global warming would have been overcome by the clearheaded majority and the matter would have been simply another hypothesis consigned to the dustbin. However the fringe dwellers quickly buiU on the preexisting environmental movement, captured media coverage, convinced the chattering classes and eventually created so much momentum that the politicians began to see votes.
The Ehrlichs and the Pimentels of this world were quickly on the scene, but it was the leaders of the already establishment environmental movements who really started to build up the momentum. Lester Brown of the Worldwatch Institute, Claude Martin of the World Wide Fund for Nature (WWF), and the various national leaders of Greenpeace led the charge, but soon there were others in the field.
The Nobel laureateship has been demeaned forever by the presentation of the Peace Prize to former US vice president Gore. This carpetbagging buffoon quickly took centrestage, and because of his notoriety gained immediate attention from the venal media, who saw to it that his every word and gesture were front-page news.
Supplied with, however dubious, information from the self-serving global warming scientific establishment, he has outGreenpeaced Greenpeace and helped cement the fraud firmly in the consciousness of the gullible masses. As well, keeping his eye on the main chance, he has followed up his carpetbagging instincts by co-founding the Generation Global Sustainability Investment Fund and will of course cream off substantial management fees. He is also pusillanimous; he cancelled an interview with a leading Danish newspaper when he learned that Bjom Lomborg, a noted critic of the global warming fraud, was going to be present.
Australia is not without its lunatic fringe, the names GaiTatt, Brown, Wong and Dunphy spring to mind; but perhaps the best example of this fraternity is Flannery, who is perhaps Australia's closest replica of Gore. He does have an academic qualification, though it is not in a discipline related to the physics of the atmospheric system. He describes himself as "an internationally acclaimed scientist explorer and conservationist", and recently during a voyage down the Murray with another comic he declaimed "this drought will never end."
He has written more than a dozen books, but let us examine only one, the Weather Makers, which he describes as his "best effort". The mendacity of this work is breathtaking. It is a farrago of misinformation, gross errors (which may be genuine because of ignorance or the result of carelessness) and what can only be described as downright lies.
It would take another book of its size to adequately correct all the misinformation contained within its pages. However, to take but a few; he says, at p.43, "The sunspots are sUghtly cooler than the rest of the sun's surface, yet when there are lots of them, Earth paradoxically seems to warm up." And again, "... no testable physical mechanism has yet been identified which would allow sunspots to affect the temperature [ of| our planet,"
University of Sydney News. October 2007
This was written in 2005 when the work of Soon et al ' and Svensmark & Friis-Christensen-was well-known and had been available in the literature since 1996 and 1997 respectively. (Sunspot activity will be dealt with in Chapter 4) Flannery was probably wanting to hide the whole question of sunspot activity because it did not fit in with the message of doom that he wished to promote, and in fact in itself goes a long way to disproving the whole global warming fraud.
At p. 42 he gets himself into a tangle confusing the Milankovich and Croll cycles-although he doesn't seem to know about the Croll cycles (see Chapter 4) because he does not mention them- with the sunspots cycles, and asserts that the Milankovich cycles caused the ice ages (disproved by Sir Fred Hoyle -see Chapter 4). He then goes on, at p. 54 to declare that the Mediaeval Warm Period did not happen. This lie is perhaps to try to justify the Mann "hockey stick" (op. cit.) but flies in the face of well authenticated research data. (See Figs. 4, Sand 13)
At p.65 he again invokes the "23,000 year Milankovich cycle" (in reality the Milankovich cycle is about 41,000 years, the Croll cycle about 13,000 years -and, for the record, the double sunspot cycle is about 22 - 23,000 years) and tries to show that the methane content of the atmosphere moved with that cycle until about 8000 years ago, when -somehow or another - man interrupted the cycle. Inspection of Fig.3 will show that this is quite wrong. Another lie or just another mistake?
On the last page of a four-page full-colour insert between pp. 108 and 109 there is what purports to be a satellite image of the Arctic ice cap as at 2003, with a red line purporting to show the extent of the ice cap in 1979. Putting aside whether the red line truly represents the extent of the ice in 1979, Flannery fails to say that the extent of the ice shown has in fact been less in earlier times. For example, in 1853 William Morton, a member of a United States Navy expedition sent North by the first United States Navy Hydrographer, Matthew Maury, encountered open sea north of latitude 83° N, north of the notch between Ellesmere Island and North Greenland at what is now called the Lincoln Sea. He reported "an unbroken sheet of water as far as the eye can reach (at least 40 miles) toward the Pole, its waves were dashing on the beach." He reported that the sea teemed with seals and waterfowl and that the water was warm.^
Flannery's illustration is reproduced as Fig. 17, with the position where Maury's expedition saw open water marked. It will be seen that this point was, in 2003- according to this illustrafion, well within the zone of solid ice. It goes without saying that none of this proves anything but that the sea ice had retreated further north in 1853 that it had in 2003, and that Flamiery did not take account of all the evidence before saying things like "in places such as southern Alaska.... winters are 2° to 3° warmer than they were just 30 years ago." (p.98) and "the changes we are witnessing at the poles are of the runaway type..." (p.103), and, of course, the implication that the above "satellite image" showed that there was only a recent and continuing reduction in the Arctic sea ice. The depiction of reducing ice caps and retreating glaciers is stock in trade for the Flamierys, the Gores and their ilk. But most of these things are taken out of context with the intent of inculcating fear among the ignorant.
Soon W. H., Posmentier E. S. and Baliunas S. L. Inference of solar irradiance variability from terrestrial temperature changes, 1880-1993: an astrophysical application of the sun-climate connection. The AslropliysicalJournal 1996, 472. No.2, 891 -902.
• Svensmark H. aiid Friis-Christensen E. Variation of cosmic ray flu.K and global cloud coverage-a missing link in solar- climate relationships. Journal of Almosphenc and Solar Terrestrial Physics. 1997, 59, No. 11, 1225-1232.
^ Heam C. G., Tracks in the Sea - Matthew Fontaine Maury. Iniernaiional Marine/McGraw-Hill, Camden Maine 2002, pp. 175-176.
10 At p. 137 Flannery asserts that "in 1996, 1997 and 1999 the United States endured more than twice the number of hurricanes experienced annually during the 20th century." (emphasis not in original) The facts show a completely different story. In 1995 there were 19 named Atlantic Ocean hurricanes in South-eastern United States, which was the highest number since 1933 M'hen there were 21! Between 1926 and 1970 large numbers of these storms menaced the Caribbean and southeast coastal United States, peaking in 1933. Between 1970 and 1994 the number of such storms averaged only two per annum. Then, in 1994 the menace started again.' How does Flannery make out of this record the extraordinary statement referred to above?
It would be ftitile, and too time and space consuming, to continue revealing the extent of the disingenuous claims made in Flannery's book; but we may conclude with one from his Postscript, which might, on the other hand, simply be one of his many mistakes. Here he states that the Earth receives 235 W per square metre from the sun. The actual figure is 342'. 235 W is the outgoing long wave radiation.
1.4 The Media.
The media apparently sees itself quite differently from the way a lot, if not most, readers or viewers see it. As one well-known editor-in-chief put it "producing a paper is a question of distorting proportions" and another "the plain truth does not sell newspapers." To a discerning reader the above quotations are a mild interpretation of what in fact is seen and read, at least in Australia. This is particularly so in regard to the question of global warming where the media have become almost hysterical in their outpouring of distortions, gross exaggerations and lies.
Strangely enough, it wasn't all that long ago that the Sydney Morning Herald, which is now, together with the Australian Broadcasting Commission, one of the archpriests of the litany of doom, ran articles denying the IPCC's predictions. Such a one, by its economics editor Ross Gittins and headlined Kyoto: lies, hot air and hypocrisy-Greenhouse: lies hot air and hypocrisy, dealt scathingly with the whole question of global warming and included the following gems; "The reporting[on the subject of global warming and Kyoto] was utterly unbalanced and highly misleading. It was little more than an extended propaganda opportunity for the Australian green groups." And "to them [the green activists] feeding the public on bull dust is okay because their cause is just. Their strategy is to conceal the costs of fixing the environment and just use the media to hector the politicians to act." In the same issue was an article by Larry Mounser, a geophysicist and a research fellow in mass communications at the University of New South Wales, headed When it comes to global warming, just cool it. In this article he thoroughly dissects, and demolishes, the IPCC's 2001 report, and concludes " I am proud our govemment[ the Howard government] stood up to this nonsense."
How different it is today, hardly an issue of the Sydney Morning Herald passes without a mendacious article warning about the catastrophic consequences of anthropogenic carbon dioxide. It recently published a 40 page supplement replete with polar bears peering off the edge of an ice flow, dry river beds and of course - Tim Flannery - who in typical form, produces half a page of drivel concluding with, "I hope that one day the people of big cities can once again enjoy the lights of the heavens unobscured by a wasteful blaze fuelled by a black polluting rock." !! Of course Flamiery is one of the Herald's most frequently quoted sources.
' Goldenberg ,S. United States National Oceanic and Atmospheric Administration. Time September 20, 2004.
^ Bellamy D. and Barrett J. Climate stability: an inconvenient proof Proceedings of the Inslilution of Civil Engineers. Paper 14806, Civil Engineering 160 May 2007 pp 66 -72.
11 In the same issue as the supplement referred to above, the Herald had a front page article headed-As the ice melts, Australia confronts the cold, hard facts. In this article it again trotted out quite meaningless figures about the "thinning" of glaciers and, which was no doubt the real purpose of the article, it dutifiilly gave notice of the present government's intention of telling Australians how "households and businesses will be hit" by the government's plan to cut greenhouse gases. This softening up process will no doubt continue with a view to concealing the reality. (See Chapter 5 below)
The Australian Broadcasting Commission, using taxpayers' money, it is also at the forefront of rehearsing the litany. It's disgraceful manipulation of the British film The Great Global Warming Swindle is of course notorious. Its fringe scientist, Williams, is in the forefront, claiming amongst other things that sea levels will rise 100 m, yes 100 m, this century!
The media have a lot to answer for in promoting this rubbish. Unfortunately the masses seem to form their opinions from what they see in the media. As a result, politicians, scenting votes, make commitments which, if implemented, will mean economic disaster for Australia.
1.5 The gullible masses. What hope does the man in the street have of ascertaining the real truth? With the weight of media disinformation and propaganda against him, very little. Furthennore, it appears that unfortunately many people are only too ready to accept the quasi- emotional rubbish that is continually being heaped upon them. Therefore we have had the ridiculous spectacle of thousands of people turning off their lights for an hour one Saturday evening at the behest of the Sydney Morning Herald; and the woman who expressed her joy at receiving some hundreds of dollars worth of "carbon credits" (no doubt in the form of a suitably inscribed certificate) as a birthday present from her husband. The politically correct chattering classes, almost by definition, have been among the first to embrace this new apocalyptic religion of eco- fiindamentalism; hugging to themselves a self satisfying sense of collective guilt and environmental redemptionism.
In the early Bronze Age the Celts, and other races, lived in constant fear of nature. To propitiate the forces of nature they would throw votive offerings ( sacrifices) into springs and streams for example; and their priests ( scientific advisers?) the Druids exhorted them to yet further sacrifices. The Celts would have understood those people in Sydney switching off their lights.
The ancient Egyptians believed that if something was said in a certain way, or more particularly if it were written, it became fact. The ancient Egyptian, receiving a papyrus with a written invocation declaring that the jackal headed god Anubis (for example) could not harm him, would have been at one with the lady of the carbon credits.
This may seem to have been a long preamble, and perhaps a little disjointed, but it was necessary due to the great conflict between the science expressed in Chapter 4 below and the received science expressed in the popular media; and for that matter, in the Garnaut Review's Interim Report and Issues Paper.
12
2. THE POLITICISING OF GLOBAL WARMING.
In an article in the business section of the Sydney Morning Herald of the 12th March 2007, Malcolm Maiden made the following comment under the headline Global Wanning A Political Fact ".... while scepfics are continuing to assail global warming science, politically, the battle is over."
The claim that global warming is a political fact certainly needs to be taken seriously; because, on its face, it appears to be the case. Which says a great deal about the power of the media - without which the greens would not even have had a hearing. Was it Hitler or Goebels who said "The bigger the lie the more likely you are to be believed"?
All State Governments have embraced the green doctrine - principally, of course, to woo the green vote. We have had the ludicrous spectacle of the Premier of Western Australia saying that "this is the 1000 year drought."
Worse, we now have a Federal government of intellectual nonentities who are detemiined to bring about the introduction of carbon trading; which, if implemented, will destroy the Australian economy. Worse still, the ministers charged with implementing this horrifying scenario are themselves acknowledged environmental warriors.
How did this come about? Put simply, the already well established environmental fanatics became aware of certain hypotheses put forward by similarly inclined scientists concerning the supposed effect of "greenhouse" gases. This was a perfect issue for them to promote, pointed, as it was, at the heart of Western economies. This has been discussed in 1.2 and 1.3 above. Certain scientists, realising the advantages to be gained by way of funding, joined the ever increasing numbers of those predicting catastrophe. Very quickly the hard core of environmental activists took over.
Using a campaign of lies, disinformation and fear tactics based on spurious environmental data in order to pursue their aim of the destruction of capital, the greens have already created widespread loss and reduction in income across rural Australia. Native vegetation legislation has effectively stolen assets from farmers, and no compensation has been paid or is ever likely to be paid to those who have suffered these losses. The next target is big business. It will be interesting to see what the outcome of this struggle will be. Well might the greens be called watermelons; it is no longer possible to sell communism politically, but environmentalism has an appeal which is being used by the greens to achieve their political, or rather ideological, ends.
As the historian Robert Nisbet has said:-"The appeal of environmentalism, in its more extreme manifestations at least, becomes
irresistible to that permanent cadre of political and social radicals Western society has nurtured ever since the French Revolution. This cadre has never been primarily interested in the protection of nature, but if such a movement carries with it even the possibility of political and social revolution, it is well that the cadre join it; which, starting from the late 1960s, it did."
The media in their various fontis were quickly on the scene. As discussed in 1.4 above, the media do not seem to think they are bound by the ethics which, even today, are generally held by the wider society. Consequently, at some stage they decided to become the propagandists of the global warming movement. This is hardly surprising since, with a few honourable exceptions, the practitioners of this grubby trade are left wing in their political leaning and hence have common cause with the green movement.
13 It was then almost inevitable that the major political parties would begin to scent votes. It is notorious that throughout the Western world left-wing parties have adopted the global warming fraud.
Perhaps the exposition of the politicising of global warming set out above is too simplistic. No doubt there have been other streams of influence involved, and certainly there has been a great deal of interweaving even within the outline sketched here. It would be impossible for example to determine exactly when the possibilities of global warming as an ideological tool were first realised by the activists of the left.
Nevertheless the cycle is quite clear, promote a fear that the masses cannot differentiate, ask for fiinds to examine the "science" of that fear, increase the levels of the fear, the masses become convinced, political parties react, governments provide more funds; and so on.
Worth mentioning, is the fact that political parties of the right, no doubt fearing the loss of votes from the gullible masses, have started to dally with the issue. In this regard they would also be influenced by the chattering classes, who have embraced global wanTiing because it is perceived by them to be politically correct.
The end result of all this is that the Australian government seems determined to reduce the claimed amount of emitted carbon dioxide by 60%. If this were to be done it would effectively destroy Australia's economy. (See Chapter 5 below)
14
3. THE FIRST FRUITS.
The first results of the events described in Chapters 1 and 2 above have been the enactment of a series of pieces of legislation purporting to "protect" the environment by in effect making the clearing of land illegal (the native vegetation legislation). This has caused widespread loss in the farming community - and is widening the city / country gap in assets, income, services, - and- antagonism.
The various Native Vegetation Acts impinge almost solely on farmers, who receive no compensation for what is in effect statutory theft. The green movement is united in declaring that there should be no compensation and that farmers have a "duty" to make this sacrifice of assets and income.
The legislation is itself almost certainly unconstitutional, and is in breach of many aspects of the common law - not to mention latter-day antidiscrimination law.
In 2003 the Productivity Commission held an inquiry into the Native Vegetation Legislation. It invited submissions, and heard evidence at two public hearings, which the Garnaut Review does not seem disposed to do.
The following is a commentary on the Commission's Draft Report.
The Commission's report makes it clear (although it does not set out to do so) that there has been no attempt to engage with scientific and historic reality in the drafting of the current legislation. False emotion, ideological bias and black armband attitudes toward nature have been the driving forces, together with political correctness, behind each piece of such legislation. For example the Victorian government wants the "... transfemng [of] power from land holders to the community". There speaks the authentic voice of the ideological left.
The existing legislation has brought serious loss, of both capital and income, to farmers and their dependants. This has been shown by numerous submissions and by the Commission's own investigations in the Moree and Murweh Shires.
The capital loss to land holders has already reached the land valuation system. For example, over the last valuation cycle (1998-2002) land in the Bathurst area with a significant proportion of tree cover has been reduced in value by 20 per cent; while cleared land of a similar nature has continued to appreciate in value.
Local areas are also being, and will continue to be, disadvantaged. The Moree and Murweh Shire studies have shown this, without the other evidence before the Commission.
There has been and there will continue to be an increase in vermin and noxious weeds in timbered country sequestered by this legislation. Evidence for this is abundant in national parks, and already in some freehold land. There is plenty of evidence of the propagation of noxious weeds from National Parks; and of the Parks being used as a harbour for vermin, from which they prey on livestock in adjacent properties.
In addition, it is notorious that the failure of the National Parks and Wildlife Service to undertake fiael reduction burning has created a hazardous environment which has and will continue to be the source of costly bushfires, which all escape from National Parks and bum private property. Claims by the proponents of the legislation have not been substantiated by any factual evidence. Most of it consists of dire predictions about what might happen at some
15 indeterminate time in the future. For example, " the long term adverse economic cind environmental effects which could result from land degradation if native vegetation and biodiversity are not protected." ( Tamborine Mountain Landcare) "Urgent action is required to prevent further degradation of our natural resource base and natural heritage." (Senator Bartlett)
There are serious flaws in what little quantitative "evidence" has been produced to support the basis for the legislation. Among other things, the base from which the extent of clearing has been postulated can best be described as a figment of somebody's imagination. Even so, on the basis of this very tendentious data more than two-thirds of the "intensively used areas" are still tree covered. There is very good reason to believe that this is very little, if at all, less than at the time the first settlers arrived.
Farmers have been affronted by native vegetation and biodiversity legislation. They, quite properly, perceive it to be based on false premises and totally biased and unfair. Furthermore, it cuts across all established legal, constitutional and familiar rights; many of them centuries old.
The result is quite likely to be that farmers will become estranged from the environmental process. For example, if some of their land is sequestered by a blanket prohibition of clearing, it is more than likely that they will simply neglect it. Or at the best, only do what is absolutely necessary to protect their remaining property.
"Green" propaganda consistently casts farmers in the role of villain - polluters, destroyers of the natural environment, razers of trees etc.,etc. When a section of the community, constituting less than five per cent of the total; which provides 25 per cent of the community's export earnings and provides the rest of the community with the cheapest food in the world; is attacked in this way, it is naturally resentful.
In contrast to farmers, the "green" movement is intransigent, biased and closed minded. It's attitudes are at best emotional and at worst ideological.
There are many instances in the report of the "green's" irrational and selfish attacks on farmers. The A.C.F., for example, is totally opposed to the giving of compensation to farmers for the loss of potentially productive land. " The payment of compensation for regulating land use or water access would be an unreasonable burden on the public purse." they say, "The high cost of compensation would leave governments in a position where they could no longer afford to enforce environmental laws or social responsibilities." In other words let the farmers suffer, we're all right. It is also enlightening to note that they at least recognise the "high cost" to farmers that is the inevitable result of this legislation. Nevertheless, they are quite satisfied to leave the farmers to bear that cost.
On the other hand the Commission noted at page XXII of its Draft Report: ~ "The community should pay for the provision of environmental services, such as biodiversity conservation, that it demands. To meet wider community demands, governments should buy additional conservation services from landholders Payments to landholders for public good conservation also would lead to increased scrutiny of costs and benefits. There may be significant budgetary implications, but the community should be prepared to pay for the environmental services it demands, if it believes the benefits outweigh the costs."
Needless to say, nothing has been done to compensate farmers for the statutory theft of their land.

16
4. THE SCIENCE OF GLOBAL WARMING.
4.1 Introduction.
It would be as well to define what is meant by global wanning. In the context of this paper it means the observed increase of global temperatures whether they be atmospheric or surface. That there has been warming over the past century is a reasonably established fact. Exactly how much warming and what are the underlying causes is another matter. This is where the dichotomy occurs between those who, on the one hand, blame man's activities for virtually all of the warming and declare that it is catastrophic, and those who disagree with this proposition.
That there has been an increase in the amount of carbon dioxide in the atmosphere has also been established. Again, how much of this has been due to man's activities, and for that matter what has been the actual increase, are the subject of argument. The relationship between the amount of carbon dioxide and the observed warming is another contentious issue, as is whether in fact all the warming has been due to carbon dioxide.
It will be shown below that there are other major factors which cause climate change, either warming or cooling. It will also be shown that some of these factors are likely, in fact almost certainly, to outweigh the effect of the increase of carbon dioxide.
Other gases (and aerosols) in the atmosphere can have an effect on global temperatures. However, compared with water vapour and carbon dioxide they are not of major importance.
What is important in any understanding of the question of climate change, global warming, the greenhouse effect, call it what you will; is that the earth's temperature or climate is changing, always has changed and, it is reasonable to expect, always will change. What is more, in the past it has changed much more dramatically than it has in the last century.
4.2 Carbon Dioxide.
Since carbon dioxide is the gas which is the target of the draconian legislation proposed by the Australian government, it is important to understand its place and effect in the atmosphere.
The physics and chemistry of carbon dioxide in the atmosphere are straightforward. On the other hand the interactions of the various atmospheric processes are not straightforward and are largely unknown. They have become the subject of numerous so-called general circulation models (GCM's) which are predictive tools used by the scientists who are forecasting catastrophic warming.
a.) The greenhouse effect.
A number of gases in the atmosphere cause what is called the greenhouse effect. The two dominant greenhouse gases are water vapour and carbon dioxide. Methane, nitrous oxide and the second allotrope of oxygen O3 (ozone) are also in this category.
The greenhouse effect, as it is called, is caused by the molecules of a gas absorbing radiant energy and then re-emitting it. To do this the molecules must possess what is called a dipole moment. At the same time, each molecule absorbs energy at specific wavelengths and allows other wavelengths to pass through without absorption. The depiction of the wavelengths absorbed is called the absorption spectrum of the particular molecule.
17 It should be noted that there are gaps in the absorption spectra between 3.2 and 4.3 pm and 8.5 to 11.0 i-im; which is significant, because earth's temperature is such that it emits strongly in those wavelengths. This is one of the factors which, together with others discussed below, such as cloud albedo, prevent a runaway situation in the earth's climate.
While methane (CH4) and nitrous oxide (N2O) are greenhouse gases, their effect is significantly less than water, for example the dipole moment of nitrous oxide is only about 7% that of water. O3 on the other hand only occurs in significant concentrations in the stratosphere. Ozone is formed by the ionisation and subsequent dissociation of oxygen molecules as a result of bombardment by high-energy radiation of short wavelength some 30 to 60 km above the surface of the earth. Water vapour is by far the most powerful greenhouse gas and absorbs radiation across a number of wavelengths but principally
-6
between 5.3 and 7.7pm and above 15pm. (1 pm = 10 metres) Carbon dioxide, on the other hand, has no dipole moment' but as it absorbs energy in the upper near infrared (between about 12 and 17pm) the oxygen atoms commence to vibrate about the carbon atom so creating a transient dipole moment. This transience means that the effective absorption of carbon dioxide is much less than water vapour but also, and very significantly, it means that the effectiveness of CO2 as a greenhouse gas is severely restricted. As Figs. 6 & 7 show (see Appendix A) the radiation/concentration curves for CO2 become asymptotic. Doubling tlie present concentration of CO2 would only increase the emissions by less than 4 W/m^ (about 3.5-3.8).
The effect that this would have on the earth's temperature, is again the subject of dispute. The IPCC uses 0.5K° * per W/m^; while a number of researchers^, sttidying volcanic eruptions and other natural phenomena have concluded that the figure should be in the region of 0.15. (one experiment gave a result of 0.15 ± 0.06, and another 0.11) Alternatively, Bellamy and Banett^ have shown that a rough estimate can be made by dividing the present global warming by the total forcing.
The earth emits longwave radiation of 235 W/m ;̂ from which, using the Stefan-Boltzman law, it can be calculated that the surface temperature would be 253.7° K (-19.5° C) if there were no "greenhouse" effect. It is generally accepted that the average surface temperature is 15°C (288.2° K.), therefore the global warming is 34.5C°. The earth's energy flux is about 390 W/m^ of which 235 are emitted to space, so that the total forcing is 155 W/m .̂ This gives a figure of about 0.22 K° per W/m^. Therefore a 'forcing' of 3.7 W/m^ would give a temperature increase of 0.8 C°. Using the figure of 0.15 from the experimental data referred to above the temperature increase would only be 0.55 C°. That is to say, that using the actual measured global wanning and forcing, doubling the CO2 content of the atmosphere would give an increase in temperature of only 0.8 C°; and on the basis of observed specific phenomena it would be 0.55 C°.
The present total global warming of 34.5C° is the result of the full effects of all the greenhouse gases together with the consequential feedbacks, including the possible evaporative increase of water vapour. Why then do the GCM's add an extra feedback from water vapour?
' LippincottW.T. ,Garrett A.B. and Verhoek F.H. Chemistry. John Wiley & Sons \ie\\yotk 1977
Douglas D.H. and Knox R. S. Climate forcing by tlie volcanic eruption of Mount Pinatubo. Geophysical Research Letters 2005 32 LO5710, doi: I0.I029/2004GL022119.
Idso S. B. C02- induced global warming: a sceptics view of potential climate change. Climate Research 1998 10 No. I, pp 69-82.
Bellamy D. and Barrett J. Climate stability: an inconvenient proof. Proceedings of the Institution of Civil Engineers. Paper 14806, Civil
Engineering 160 May 2007 pp 66 -72.
* K= degrees Kelvin, 0°C = 273.15°K.
18 All the GCMs include positive water vapour feedback, which of course increases their predicted warming. However, there is data from the Atlantic Ocean' for the years 1950 to 1972 which show that while the CO2 concentrations increased during that period both the humidity and temperature showed a slight decline.
The humidity trend from the above-mentioned data shows a decline of about 4% per annum, and temperature declined about 2 C°; whereas the carbon dioxide content of the atmosphere increased from about 310 ppmv in 1950 two about 325 ppmv in 1970 a total increase of about 4.8% in 20 years. Thus observed data disproves the assumptions made by the GCM modellers.
Data from the Vostok ice cores ( see Figs. 1, 2 & 3 ) show that CO2 concentrations peaked some 400 to 800 years after temperature peaks. This again is the opposite of the GCM modellers' assumption that an increase of carbon dioxide causes increases in water vapour and temperature.
A study of absorption spectra of the earth's atmosphere viewed from satellites^ shows an overall contribution to global warming by CO2 of about 7-8 C°. This is an instantaneous figure and includes all the warming by CO2 up to the date of the observations, and represents about 22% of the total warming. On the other hand, using the Modtran programme and database the figure derived for the warming due to CO2 is about 10 C°. So here again we see the difference between calculated and observed figures. And again as always, the observed figure is less than the calculated figure.
b.) The concentration of CO2.
The IPCC's 2001 report gave the results of 19 GCMs. These showed that for a doubling of CO2 from 285 to 570 ppmv there would be an increase in temperature of 1.5 C° within a range of 1-3 C°. That is to say, the range (or possible enor) is more than the predicted increase! In 2007 the equivalent figures, as quoted by the Garnaut Review Secretariat, gave an increase of 3C° within a range of 2-4.5C° - with a possible high of 10C°\ The range of 2-4.5 is said to be within one standard deviation, but it is difficult to see how only 19 results of such complex algorithms as are run by the GCM programs could be considered a reasonable--population for the production of a normal distribution curve.
The IPCC had been using an increase in CO2 emissions of 1% per annum up to and including its 2001 report. It is not clear, but it would appear that it has increased that figure for its 2007 report. It claims that emissions grew by 1.1% per annum in the decade 1990 to 1999 and increased to 3.1% pa. from 2000 to 2006. Examination of the raw data on the other hand shows, for example, that the increases in 2002 and 2003 were 2.43 and 2.3 ppmv respectively; and then fell back to 1.5 ppmv in 2004 which had been the prevailing average from some years. Those three increases expressed as percentages are 0.63% , 0.61% and 0.39% respectively. It is difficult to see how the IPCC translated 0.39%) or 0.63%) to 3.1%; other than by way of its usual tendentious methods of working. It is clear that there is a culture of manipulating data and results endemic in the processes of the IPCC and its trained contributors. Furthermore it is glaringly obvious that its methods of reporting are calculated to create the maximum apprehension and fear in its audience.
On this last point it is instructive to examine the IPCC's development of two statements in its Summary for Policymakers of 2001. ^
' Flohn H. Gefahrden Klima-Anomalien die Welt-Ernahrung?Z?;Wrfe/- Wissenschafi 1978, I2,pp 132-139.
' http://daac.gsfc.nasa.gov (March 2007)
Lomborg B. The Sceptical Environmentalist. Cambridge University Press 2006. p.319
19 The first concerns the "culpability" of human activity in respect of global warming. On this subject, the first draft of the Summary in April 2000, said "the balance of evidence suggests that there is a discernible human influence on global climate. " by October 2000 it became "it is likely that increasing concentrations of anthropogenic greenhouse gases have contributed substantially to the observed warming over the last 50years"
By the time the official summary was published this had become "most of the observed warming over the last 50 years is likely to have been due to the increase in greenhouse gas concentrations."
In the same way, discussing the costs and benefits of global warming, the October 2000 draft stated "in many developed countries net economic gains are projected for global mean temperature increases of up to roughly 2°C. Mixed or neutral net effects are projected in developed countries for temperature increases in the range of 2-3 °C, and net losses for larger temperature increa.ses. " Again, by the time the official summary was issued this had become "an increase in global mean temperature of up to a few degrees C would produce a mixture of economic gains and losses in developed countries, with economic losses for larger temperature increases."
Yet despite this extraordinarily tendentious approach to what is an extremely important question the Garnaut Review Secretariat says that "The IPCC plays an important role in bridging the gap between science and policy and has had considerable influence on the development of international and domestic climate change policy. "
If this "influence" continues, the cost to Australia (and the rest of the Western world) will be of such a magnitude that the economies of many of these countries - and particularly Australia - are likely to collapse. (See Chapter 5 below)
Historic data show that world temperatures have been higher than present (see Figs.4, 8, & 13), in eras when human activity was very low and man-made carbon dioxide emissions were negligible. Similarly, prehistoric data (see Fig. 1) show epochs where temperatures were considerably higher than present.
Much the same results are shown in historic and prehistoric data for carbon dioxide and methane (see Figs.2, 3 & 14).
All of this confirms what the late Professor Sir Fred Hoyle, one of the most distinguished, if not the most distinguished, astrophysicist of the 20th century, said. He pointed out that "The efficiency of the carbon dioxide trap is insensitive to the amount of carbon dioxide in the atmosphere: increasing the amount five-fold would scarcely change the trap, in spite of the stories that are cunently being circulated by environmentalists." '
Putting this in the context of man-made contributions to the total amount of CO2 in the atmosphere, it is generally accepted that there are about 730 Gigatonnes of carbon equivalent ( 730 GtC) in the CO2 in the atmosphere. In the order of 210 GtC per annum is emitted naturally from the surface of the earth and the oceans. By contrast, the emissions from human activity are about 7 GtC. That is to say that man's emissions are something less than 4% of the natural emissions (3.3%)) and less than 1% of the total carbon mass. These figures are of a very broad order nature. No one has or can calculate with any real precision what the actual figures might be. Furthermore, the emissions, both natural and man-made are recycled by the natural processes of the earth's atmosphere and thermodynamics.(See Fig. 15)
' Hoyle F. Ice Hutchinson London 1981 p. 123
20 In all, carbon dioxide as a gas comprises 0.038% by volume of the earth's atmosphere, and has a half life of 2-5 years. If man made emissions constitute only 3.3% of all emissions, clearly they can not be responsible for all increase in temperature. Yet the IPCC seems to be taking all emissions into account in its calculations of temperature increase, and assuming them to emanate from human activities. (See penultimate paragraph in p. 18 above) This is unreasonable; for, quite apart from the inflated figures used for the increase in emissions, there is no evidence that all of the increase is the result of man's activities.
There is another very telling fact which shows that there is essentially no conelation between global temperature and man-made (anthropogenic) carbon dioxide emissions. Figure 12 shows the global temperature anomaly plotted against global fuel consumption (which is a good analogue for carbon dioxide emissions). It will be seen that the steepest temperature rise was between the years 1918 and 1940, during which time world fiiel consumption had more or less levelled. After 1940 there was a decline until 1976, which was, significantly, the year of the Pacific Decadal Oscillation. During the period of this temperature decline world fuel consumption was rising steeply. Since then temperatures rose about 0.4C° until 1998. Since 1998 the world's average temperature has declined slightly, plateaued since 2002 unfil 2007 during which year global temperatures FELL 0.6C°\ yet fuel consumption and hence anthropogenic carbon dioxide emissions have continued to rise. Furthermore, and disastrously for the IPCC climate modellers, their prediction of an abnormal heating at about 10 km up in the troposphere at low latitudes has been shown to be completely false. ' These
facts in themselves destroy the hypothesis of anthropogenic carbon dioxide being the cause, much less the only cause, of global temperature increase.
Yet despite this, the IPCC (and Garnaut) in a breathtaking display of misinformation say "Global mean surface temperature increase since 1990 has been measured at 0.33°C " citing Rahmstorf et al 2007. Did Rahmstorf et al switch off their instruments in 1998? It certainly appears that Garnaut made no other enquiry from the many reputable sources available or from the literature; but simply took the word of yet another rentier scientist.
In regard to doubling the amount of carbon dioxide in the atmosphere, that is increasing it from 285 to 570 ppmv, Bellamy and Banett (op. cit.) have pointed out that on the basis of the known fossil fuel reserves as at March 2007 it would be necessary to burn all the oil, all the natural gas, and nearly 20%) of the coal (or whatever other combination would provide the same amount of CO2) to reach this figure. They also point out that this would take a century or more to achieve!
Sir Fred Hoyle (op. cit.) has pointed out that "When a pattern of facts becomes set against a theory, experience shows that it rarely recovers." The theory, if it can be called that, of man-made carbon dioxide causing serious and even catastrophic rises in temperature has had more than one pattern of facts set against it. As a theory it is unsustainable, and as a basis for action such as is contemplated by the Australian government it is preposterous and dangerous.
4.3 Other Factors Affecting the Earth's Climate.
It is clear from the foregoing, that anthropogenic carbon dioxide emissions cannot be the sole cause of the observed warming of the earth, little though that might be (0.6C° during the last century). It remains therefore to examine what other factors might be involved. There are indeed many factors which are known to affect the earth's temperature. Many of these factors are complex in themselves but the complexity of their interaction is such that any honest meteorologist or climatologist would admit that how they interact is largely unknown. Although each discrete system is affected by all the others, for convenience they can be
' Hadley Centre for Climate Prediction and Research. United Kingdom.
21 divided into those which operate within the earth's environs and those which come from outside.
a.) Earth Systems.
(i) The Earth's Path around the Sun.
While this may seem too obvious to comment upon, it is worth pointing out that the path is elliptical, not circular, and therefore earth's distance from the Sun varies, so that the intensity of the insolation varies with the position of the earth in its circuit.
(ii) The Inclination of the Earth's Axis.
The inclination of the earth's axis to the plane of the ecliptic (about 66.5°) has a noticeable effect on earth's climate and temperature. Without it of course there would be no seasons. But it is the variability of the angle that has a subtle long-term effect on climate.
In the first place, the axis of the earth precesses in much the same way as a spinning top. This alters its angle of inclination and thus affects the earth's temperature. The mathematical properties of this precession were first calculated by Sir Isaac Newton; and in the 1860s James Croll calculated the effect of this 13,000 year cycle on the earth's temperature.
Another such effect is the Milankovitch effect, which is the slow, 41000 year, cycle of what might be called the central position of the axis of the earth in the Nevvrton/Croll precession. Milankovitch showed this to vary from between about 22° and 24°. The Croll effect acts in opposite ways in the northern and southern hemispheres whereas the Milankovitch effect is the same in both hemispheres. Sir Fred Hoyle (op. cit.) calculated the combined effect of the two to be that, in the present epoch, the northern hemisphere would be 1% cooler than average and the southern hemisphere 3% warmer than average.
(iii) The Turnover of the Deep Ocean Waters.
It is known that the turnover of the deep ocean waters results in very large-scale 'recycling' of the CO2 held in the water. As the cold deep water comes to the surface there is an out gassing of CO2. In like manner the cold oceans near the poles absorb CO2 and eventually sink. This cycle, of unknown duration and complexity, over time affects the content of CO2 in the atmosphere. The volumes involved far outstrip the amount of anthropogenic CO2 emitted.
(iv) Extra Tropical Cyclones.
The Earth is a heat engine. Indeed, if it were not so it is unlikely that life would be able to exist. Without going into detail, the insolation at low latitudes is considerably greater than that at high latitudes. Therefore the increase in temperature at the topics is naturally greater than at the poles. This excess heat is distributed partly by the great ocean cunents, but to a far greater degree by the winds. Extra tropical cyclones are particularly important in this process. In effect they 'transport' heat from the tropics toward the poles, increasing entropy in accordance with the second law of thermodynamics.
What is particularly important in the context of this paper it is that they cannot be fully taken into account by the GCMs because they (the GCMs) cannot resolve any atmospheric phenomenon smaller than about 1600 km., whereas extra tropical cyclones are typically smaller than about 500 km. This means that the results of the modelling are distorted yet again toward the higher end of predicted temperatures.
22 Mention has been made above (see p. 10) of the use of the incidence of cyclones; particularly in the Caribbean and southeast United States; by the global warming fanatics. These disasters, occuning as they do in highly populated areas, are ideal for the distortion, misrepresentation and fear raising so enjoyed by these people and the media, who assert that there has been an increase of these phenomena as a result of anthropogenic carbon dioxide.
It would be as well to repeat here the true facts. Research meteorologists at the United States National Oceanic and Atmospheric Administration have studied the incidence of hunicanes in the South Eastern United States. Their findings are that the cunent run of hurricanes, which started in 1994 and which is producing more than 10 such storms a season; with a maximum, so far, of 19 in one season; is not as severe as the period between 1926 and 1970. During those 44 years, hunicane activity was much greater than since 1994, culminating in 1933 with 21. In contrast, the 24 years between 1970 and 1994 averaged less than 2 hunicanes per season. The researchers have found that the change from low to high frequency and intensity of hunicanes coincided with a slight (less than 1 C°) increase in sea surface temperatures which occuned "suddenly" in 1926 and again in 1994. A similar drop in sea surface temperatures occuned in 1970. If the sea surface temperature was a result of the increase of man made CO2 in the atmosphere, it is unlikely in the extreme that there would have been a drop in temperature in 1970, or that the changes would have been so rapid. As in all climate change the vast cyclical movements in nature are the underlying cause.
Lomborg (op. cit.) has collated a number of authenticated references which show that in the North Atlantic (which of course includes southeast United States and the Caribbean), despite great decadal variations, "... the trends are generally declining, with a noticeable quiet period in the 70s and 80s. Particularly,.... the number of intense cyclones (those that cause the greatest damage) has been declining, as has the number of cyclone days. Equally,.... the average wind of an Atlantic cyclone has been decreasing over the past half century. Moreover, the record of US cyclone land falls goes back to 1899 and shows no increase either in total or split into East Coast or Gulf Coast land falls."
(v) Volcanic Activity.
There is no doubt whatsoever that volcanic activity has a marked effect on the CO2 content of the atmosphere, and indirectly on global temperature. We have refened above to Douglass and Knox's (op. cit.) work on the eruption of Mount Pinatubo. Volcanic emissions of CO2 are common. As Professor Ian Plimer points out "In 1984 and 1986 CO2 from the volcanic crater lakes of Monoun and Nyos killed thousands and added CO2 to the atmosphere. Near Mount Gambler, volcanic CO2 is commercially extracted from rocks, one small hot spring on Milos contributes 1% of the planets volcanic CO2 and huge quantities of CO2 constantly leak from unseen submarine volcanoes." '
Again, more generally, geological data prove conclusively that temperature increases of"... up to 7 degrees C in 50 years - with subsequent falling temperatures - have been a common feature of the atmosphere over the past 10,700 years, much greater and faster than the latest greenhouse forecasts of 1.5 to 4.5 degrees C by 2100. Most flora and fauna evolved before 10700 years ago, and have survived these, as well as earlier warmings of up to 13 degrees C in a decade. Similarly, 8000 years ago it was a rise in sea level at twice the forecast greenhouse rate that created i\\e. Great Banier Reef Coral islands will grow, not be drowned, if sea levels rise by the "forecast" 40cm. by the end of the century. Furthermore, for millennia, Pacific sea levels rose and fell by about 40cm. every three to eight years, principally due to the El Nino effect." ^
' Plimer I. The past Is the Key to the Present. IPA Review. March 2003. pp.9-12
O'Brien B. J. Keynote address. 13th Australian Geological Convention.
23 (vi) Cloud Albedo.
It is common knowledge that cloud albedo is perhaps the greatest modifier of earth's temperature. It is merely intuitive that the more cloud the cooler the weather and vice versa. But of course it is more complex than this. For example, heavy cloud at night reduces cooling.
It is also widely agreed that the effect of cloud albedo is not well understood and more importantly in the context of the present discussion it is far from well represented in the cunent GCMs. This failure, or rather inability, to take proper account of cloud albedo is a further factor, and a major factor, in the distortion of the results toward the high end of temperature predictions.
A very significant factor in the development of cloud albedo is sunspot activity. This will be dealt with in 4.3 b.) (iii) below, but here it is sufficient to say that it has been shown that sunspot activity has a marked effect on the amount of low-level cloud in the atmosphere. This of course has a direct effect on the temperature.
Bellamy and Banett (op. cit.) comment that Wild ' described the input parameters of 20 GCMs concerned with solar radiation."The input for incoming radiation absorbed by the atmosphere varies from 58 to 87 W/m^; and that absorbed by the surface varies from 148 to 180 W/m .̂ These are important quantities and, with the published variations, it is not surprising that the eventual results differ greatly. These are the calculations on which future climate predictions are based and do not offer a great deal of confidence in their present state."
They also point out that neither do the GCM predictions for global distribution of cloud coverage compared with the observed data inspire any confidence in their use for predictions of future climate changes.
b.) Extra Terrestrial Effects.
(i) General Planetary Effects.
The earth's path around the Sun is affected by interaction with the other planets, particularly the gas giants. This in turn has its effect on the insolation received and hence the temperature. In itself the consequent variation is perhaps insignificant, but combined with other factors can have a noticeable effect. This is particularly so when considering changes in temperature as small as 0.6C°.
(ii) Solar Inadiance.
The Sun is classed as a G2 yellow dwarf and as such its rate of'burning' is increasing. This is the usual process for this class of star and leads to it becoming a red giant and eventual extinction
Einstein's theory of general relativity shows that the energy output (inadiance) of the Sun has increased by the order of 30%o since the Lower Archean (i.e. over the last 3.8 billion years). (See Hoyle (op. cit.) p.78.) Recent studies have shown that solar inadiance has increased by approximately 0.4% over the last 200-300 years causing an increase in temperature of about 0.4C°; and that the increase in solar inadiance over the last 30 years has been responsible for 40% of the observed global warming. ^
Wild M. Solar radiation budgets in atmospheric model intercomparisons from a surface perspective. Geophysical Research Letters 2005 32 L 07704 doi: 10.1029/2005GL022421
^ IPCC 1996 a: 117. Wilson 1997. Cubasch et al 1997: 765

24 These are small but very significant effects. If the figure of 40% of the observed global warming can be extrapolated for the full century it means that the increase in solar inadiance has caused an increase in temperature of 0.24C° out of the total of 0.6C°. Soon et al ' have concluded that the combined effect of the variation in solar inadiance and sunspot activity had been responsible for 70% of global warming during the 20th century. This has been confirmed by research at the Max Plank Institute for Solar Research.
(iii) Sunspot Activity.
It has been established for well over a decade that there is a significant conelation between sunspot activity and earth's average temperature. Late 20th-century work by Svensmark and Friis - Christensen, Lassen and others has shown this in some detail. However records are available comparing central English temperatures with sunspot activity going as far back as 1750. Other data go back as far as 1550.
This correlation showed that as sunspot activity increased so did the earth's temperature and vice versa. The conelation was such as to give confidence that the relationship between sunspot activity and temperature was valid. What was not known was why this relationship held.
In 1997 new work by Svensmark and Friis- Cliristensen ^ provided a brilliant exposition of the physics behind the phenomenon. Very briefly, it had been known for many years that the earth's atmosphere had been subject to bombardment; not only by the electromagnetic spectrum of the Sun's inadiance ( see 4.2 a.) above) but by high-energy particles from space. These high-energy particles are connnonly called cosmic rays, and it is generally agreed that they are the result of supemovae. Stars usually end their lives by either collapsing as black holes or by enormous explosions called supemovae. It has been estimated that there have been 100 million such supemovae over the history of the earth; i.e. about one every 40-45 years (Hoyle op. cit.). It was once suggested that a supernova only 30 light-years away was the cause of the Cretaceous extinctions 65 million years ago, since disproved by Hoyle and others.
Svensmark and Friis- Christensen, by experiment, showed that these particles (or rather their derivatives after collisions in the upper atmosphere) cause low-level clouds by providing the nuclei for the condensation of water vapour up to a height of about 3000 m. They confimied their experiments by comparing detailed analyses of cloud cover data from a number of geostationary satellites with cosmic ray data. It was found that the cloudiness followed the sun spot activity with great exactitude - quite sufficient to provide a sound scientific basis to the theory. They also showed that the reason for the variation of cloudiness; and hence temperature; with sunspot activity was because the magnetic storms which are sun spots had a significant effect on the solar wind.
The solar wind, first postulated by Parker (see p.4 above) is the Sun's constant discharge of high-energy particles from its corona. As this 'wind' reaches the earth it is shaped by the earth's magnetic field into a shield against the general bombardment from space by cosmic rays. The stronger the wind, the greater the protection from cosmic rays, the fewer such rays reach the lower atmosphere, and the fewer the clouds. This completes the system of sunspot activity, and its effect on earth's temperature.
The effect of low-level cloud is of major importance in determining the temperature of the earth's surface and of the troposphere. Yet the IPCC saw fit to completely disregard the work of Svensmark and Friis- Christensen and the other workers in this field, the results of which
Soon W. H., Posmentier E. S. and Baliunas S. L. Inference of solar irradiance variability from terrestrial temperature changes, 1880-1993: an astrophysical application of the sun-climate connection. The Astrophysical Journal 1996, 472, No.2, 891 -902. ^ Svensmark H. and Friis-Christensen E. Variation of cosmic ray flux and global cloud coverage-a missing link in solar- climate relationships. Journal of Atmospheric and Solar Terrestrial Physics. 1997,59, No.l 1, 1225-1232.
25 have received universal acceptance. Usoskin et al ', for example, have shown that the late 20th-century and early 21^'. century high activity level of the Sun is very unusual compared with that of the last 7000 years.
All of this points to the sunspot cycle being a major factor in the variability of earth's climate, and that some earlier and the present century have seen significantly high sunspot activity. The sunspot intensity varies through a double cycle of 22-23,000 years (i.e. two cycles of about 11,500 years) and is thought to be caused by the velocity of the highly electrically charged winds at the Sun's equator being greater than those at its poles. This difference in velocity causes the lines of flux of the Sun's magnetic field to twist and ' dive' into (and out of) the surface. The location of these dive points are sun spots. After about 11,500 years the flux lines become so twisted that they 'snap' and realign themselves in the opposite polarity - so that the Sun's polarity reverses every 11,500 years.
These cycles are called Schwabe cycles. A number of scientists are concerned that the next Schwabe cycle is likely to be the weakest in the last 200 years. Kenneth Tapping at the Canadian National Research Council has found that the sun has entered into a quiescent phase reminiscent of the Dalton Minimum. Professor R.T. Patterson at the Geoscience Centre at Canada's Carleton University agrees. He says "I, and the first-class scientists I work with, am consistently finding excellent conelations between the regular fluctuations of the Sun and earthly climate." ^ These findings are confirmed by a number of scientists from around the world. The next two sunspot cycles, numbers 24 and 25, have been predicted by NASA ^ to be the quietest for many hundreds of years. (See Fig. 11)
All these hard data from highly respected and effectively irrefutable sources have been completely ignored by the IPCC and, by definition, Gamaut.
4.4 Alternative Sources of Energy.
The foregoing should have made it clear that it would be foolhardy to consider draconian forced reductions in the use of fossil fuels. This would cause economic disaster and chaos. On the other hand of course, it goes without saying that economising in their use is simply common sense, and in any case fossil fuels will eventually run out. As Bellamy and Banett
'(op. cit.) have pointed out, while known reserves will last more than a century and that history has shown that more reserves will be discovered, nevertheless fossil fuels are a limited resource. Therefore it is good policy to search now for altemative sources of energy so that as fossil fuels run out their alternatives will be immediately available. Furthermore, as will be seen below a viable altemative, nuclear fiasion, will be available, on present projections, in about 40 years; and this timescale could be shortened if more funding for research was made available. The following brief description gives some figures for the, present day, cost of some of the alternatives.
Conventional coal-fired power costs between $30 and $40 per megawatt hour; nuclear (fission) power $70-$80 per MWhr., wind power $90-$130 per MWhr., and solar power $200 plus per MWhr.; bearing in mind that the last two require an equal spinning reserve of thermal power or stand by hydro power for when the wind drops or the sun goes down. As far as nuclear fission power is concem the figure given above is unlikely to include the full cost of decommissioning a reactor nor the fiill cost of the safe storage of radioactive waste.
There are about 450 nuclear (fission) reactors cunently in operation, providing about 16%) of ' Usoskin I. G., Solanki S.K., and Korte M.. Solar activity reconstmeted over the last 7000 years: the influence of geomagnetic field
changes. Geophysical Research Letters. 2006, 33 L 08103,doi: 10. 1029/2006GL 025921.
^ Reported in BrookesNews.Com 11th February 2008.
•* Hathaway D. H., and Wilson R.. M. What the sunspot record tells us about space climate. Solar Physics, 2004, 224, pp.519, NAS/VMarshall Space Flight Centre.
26 the world's electricity. Many of these will be decommissioned within the next 10 years. There are a number of Generation III reactors under construction which are claimed to have better operational characteristics than the current reactors from which they have been developed. Further design of Generations III+ and IV is under way. The projected generating costs vary from 1.7 to 4.0 pence per kilowatt hr. ( $43 - $100 / MWhr.), and the capital costs from 900 to 1300 pounds steriing per kilowatt ( $2,200,000 - $3,200,000 / MW). The economic life of such reactors is projected to be from 20 to 40 years. On present predictions Generation III+ will come on stream in about 2015 while Generation IV ( which is still in the research stage) is unlikely to become available until after 2030. ' Nuclear fission of course canies with it the still unsolved problems of the safe storage of radioactive waste with a half life of thousands of years, and the equal problem of decommissioning.
'Nuclear fusion on the other hand provides a relatively safe altemative to fission. The raw ftiel for a fusion reactor is water and lithium; the waste products are helium which is not radioactive, and tritium, which while being radioactive with a half-life of approximately 12 years is reused in the reactor. The lithium becomes radioactive, with a half-life of 10 years and can be recycled in 100 years. Without going into detail, there is never sufficient fuel in the reactor at any time to cause a meltdown even allowing for the complete failure of the cooling system. A small reactor (16MW) is operational in the United Kingdom and a 500 MW experimental reactor is due to be operational in France in 2015. A full-scale reactor is projected to be operational in about 2035 and commercial reactors some time about 2048. The projected cost of electricity from fusion reactors ranges from 5 to 9 euro cents / kwh. ($80 - $144 / MWhr.) for a lower technology watercooled steel reactor to 3 to 5 euro cents/kwh ($48 - $80 / MWhr.) for a helium cooled silicon carbide reactor. ^
These figures compare favourably with cunent fusion reactor costs, and as Llewelyn Smith and Ward have pointed out, if greater investment were available the timescale could be reduced by the use of other devices run in parallel to the main program, which would provide earlier attainment of specific strategic information.
It would seem clear that, if the many billions being wasted on wind power, solar power, carbon sequestration and other fijtile research were channelled into fusion research, the result would be of great significance to the future of the world.
Quite apart from the extremely high cost of wind power and solar power, these fomis of altemative energy will never be able to replace conventional fossil fiiel (or for that matter nuclear) powered generators. The hundreds of megawatts required to be generated in a particular location can never be supplied by wind or solar power. These forms of power are only suitable for small-scale isolated applications where the cost of transmission lines are unwananted. This is not to mention the necessity for storage of power by way of batteries to account for night-time and windless conditions. Many attempts have been made to produce viable power from these sources and have utterly failed.
Tidal power does provide a possible altemative, but only where the tidal range is sufficient. Even where this is the case the cost of a tidal power station is considerably greater than even a nuclear power station. Tidal power does at least have the advantage of being a proven option, as evidenced by the Ranee estuary station on the Channel coast of France.
Nevertheless, as the proposed Severn estuary banage has shown, costs, at between $3.75M / MW and $4.65M / MW, are considerably greater than a Generation III+ nuclear fission generator. The Severn scheme has in any case run into considerable opposition from the environmental lobby. The British Environmental Agency Chief Executive Barbara Young,
' Dagnall S. Nuclear Fission: Proceedings of the Insiilulion of Civil Engineers.. Civil Engineering 158 November 2005 pp. 12-19
^ Llewellyn Smith C. and Ward D. Nuclear fusion power: a bright long-term future. Proceedings of the Insiilulion of Civil Engineers. Civil Engineering 158 November 2005 pp. 59-63 Paper 14138.
27 for example, has said "A project to deliver 5% of the UK's energy at the price of wrecking valuable wildlife is not the way forward."
4.5 Summary.
a.) Is the climate warming? There appears to be general consensus that the climate has been warming, although there is still some question as to the exact amount of the increase in temperature. Here again there seems to be a reasonable consensus that it did increase by 0.6C° during the course of the 20th century, although by no means in a uniform fashion (see Fig. 12). But against this, the global temperature started to decline in 1998, levelled out in 2000, and then FELL by 0.67C° in 2007! Furthermore the predictions of the IPCC's climate modellers concerning abnomial temperatures in the troposphere over the tropics have been proven to be completely false. The earth is still emerging from the last glacial epoch, so the trend of the temperature would be expected to be rising. The information refened to above, however, shows how erratic that rise has been over the past century or more.
b.) Is the carbon dioxide in the atmosphere increasing? Again the consensus is that carbon dioxide is increasing. The problem here is that the data appears to be sparse, and the only quoted source is the Mauna Loa Observatory in Hawaii. There have been recent questions about the validity of that data, but it is generally accepted that the increase has been from about 290 ppmv in 1880 to about 380 ppmv in 2005.
c.) Is the increasing carbon dioxide due to man? It is claimed by the global warming industry that it is. At least some of it is due to man's activities. Whether it is all due to man's activities is open to very real doubt. As has been seen above there are a number of natural factors which are known to affect the amount of carbon dioxide in the atmosphere, for example the turnover of the ocean waters and volcanic activity. Furthermore it is known that in the past there have been far greater concentrations of carbon dioxide than at present.
d.) Is all the temperature increase due to CO2? Here the answer is certainly no. When account is taken of the Croll / Milankovitch effect as it applies at the present epoch, solar irradiance, the effect of sunspot activity on cloud albedo and other factors, there is not much left to be attributed to all of the CO2, much less to that part of it that might be attributed to man's activities. Finally, the well-established theories of the physical chemistry of carbon dioxide show that it cannot be the precursor of serious, much less catastrophic, global warming. Sunspot activity of itself has been shown to have been the major contributor to the warming experienced during the 20th century.
e.) Is there a problem? Here again the answer is no. If, due to natural causes, the world's temperature does increase further it will be at such a slow rate that adaptation should be well within the capacity of modem day man. Man has, in the historic and the distant past, adapted to far greater changes in the world's climate than even those that have been predicted by the IPCC.
f.) Should something be done? Yes. The futile and wasteful expenditure on nonsensical altemative sources of energy, such as wind and solar power, should be channelled into research and development of fusion power. Although there is well more than a century's supply of fossil fuels they will eventually run out, and fusion power, already well researched and part developed, is the only altemative at present on the horizon. At the same time, sensible steps should be taken to maximise the efficiency of power sources and reduce the consumption of fossil fuels. However, these measures should not be such as to impact upon the economy of the nation. Finally, adaptation is the only viable response to any climate change that might occur.
28
5. THE COSTS.
It is not within the scope of the present paper to discuss in detail the costs that will inevitably be associated with any action by the government to reduce carbon dioxide emissions by the widely publicised 60%. That there will be costs, and very considerable costs, is indisputable.
On the subject of cost, it is instructive to examine the interim report of the Gamaut Climate Change Review. Under the heading The Climate Science, there are 15 pages replete with in tenorem figures and explicit statements of predicted temperature increase etc. (It should be noted again that most of these figures are in dispute, many of them have been dealt with above, and have been shown to be quite wrong.) There are a further three pages headed Comparing costs of climate change mitigation, which include figures for proposed levels of carbon dioxide. Then there are 28 pages headed Mitigating Climate Change in which what appears to be the whole gamut of mandatory emission reductions are discussed, without one dollar sign in the whole 28 pages. Not the slightest suggestion of the enormous cost increases that must be faced if a 60% target is enforced.
In other words, the authors of the Review have been at pains to paint the darkest picture as far as their view of the science of climate change is concemed; but they are not prepared to let the public see what the cost of any attempt to reduce carbon dioxide emissions will be.
5.1 The Costs to Date.
There have been uncountable costs suffered by certain sections of the community as a result of the hysteria surrounding the question of supposed global warming. Some of these are touched on below.
a.) Native Vegetation Legislation.
This has been dealt with briefly in Chapter 3 above. It is sufficient to say here that farmers and the mral community at large have been severely disadvantaged by this legislation, and have suffered considerable consequential losses. The Productivity Commission's enquiry into the legislation showed this to be the case.
b.) Commercial and Investment Losses.
There have been a number of losses in industry due to global wamiing and related activists.
(i) Nufarm.
In May 1990 Greenpeace activists entered and criminally damaged the Nufarm chemical plant near Melbourne. No charges were laid against these criminals by the then Victorian Labour Government, which instead set up an enquiry into Nufarml The enquiry, which cost the taxpayer $1 million, found no fault with Nufann. On the other hand the stoppage and consequential damage and loss of production cost Nufarm $7 million. Nufami management did not sue Greenpeace because in effect the actual perpetrators were "men of straw" but also, to quote the management: " Suing them in court provides them... with a platform... to go looking for a public sympathy vote."
This sort of thing is par for the course for Greenpeace, which is one of the leading organisations promoting the fear campaign for the global warming lobby. The end result of this sort of activity, and the sympathetic treatment given to it by the media and left-wing governments is encapsuled in the comment made by a spokesman for the Australian Chemical Industry Council at the time. He said:
29 "It is very difficult for industry to operate in Australia when public policy and public opinion is shaped in significant part by such anti-scientific forces as Greenpeace. While Australia does have amongst the toughest environmental and safety laws in the world, the continued whipping up of negative attitudes is playing havoc on capital intensive and high technology industry. The result is simple. Our greatest value added industry is packing its bags and gradually leaving."
The introduction of carbon tax in any form will result not in 'gradual leaving', but a mass exodus of many if not most of our export earning industries. The aluminium smelting industry is such a one; the paper manufacturing industry, already under pressure, the steel industry, and many others will be immediately under threat.
(ii) Robe River and Other Development Setbacks.
Recently the Western Australian Department of the Environment refused the application of Robe River Mining Company ( a subsidiary of Conzinc Rio Tinto) to build a $12.5 billion expansion to its Pilbara operations because it would endanger a colony of tiny (4mm long) blind scorpion like insects. The refusal has been appealed, but Rio Tinto has indicated that this could well be the last straw and that it might curtail its activities in Australia. This is just one of many similar frustrations being experienced by mining companies and other organisations as a result of the activities of green dominated bureaucracies and governments.
The mere construction of such a project would provide employment for hundreds; and its operations on completion would add considerably to Australia's exports and hence help to reduce its cunent account deficit.
This is only one of a long list of such frustrations; Wesley Vale, Coronation Hill, the Franklin, and many others stand witness to the enormous losses suffered by the Australian economy as a result of the activities of the left-wing activists of the environmental and global warming movements.
(iii) Enviromnental Impact Statements.
It is undeniable that some form of restraint is necessary to ensure that construction or other developmental projects comply with society's reasonable requirements as far as the environment is concemed. However the present regime, heavily bureaucratised, places an unnecessary burden on the community.
The provision of enviromnental impact statements amounts to a very significant extra cost for all construction, most of it unwananted. For example, as long ago as 1980 the environmental impact statement for the Kooragang Island coal loader cost nearly $2 million and in effect made no difference to the design of the facility. The final design was no different to what it would have been without an impact study; because the engineers concemed were experienced in their field and included protection of the environment in their design as a matter of course.
Another example of the extra cost of such legislation is that the RTA of New South Wales has to provide an environmental impact statement for resurfacing and existing road!
c.) Ethanol.
The subsidised manufacture of this supposed substitute for petroleum is a classic example of the unbelievable stupidity of government action in response to the global warming lobby's perceived voting strength.

30 Without any disastrous imposition such as carbon capping or emissions trading, the United States government has, by simply providing heavy subsidies for the manufacture of ethanol brought about an enormous upheaval in the cost structure of agricultural commodities in the United States. This effect has already been felt in Europe and as far as Israel. In the United States the cost of some fertilisers has risen by 100%, the cost of grain for feedlots has increased by 35%; economists at the Iowa State University have estimated that food prices in the US have increased by US $47 per family per week. One third of the whole US com crop is used in the manufacture of ethanol; and the acreage planted to com has increased enormously, putting pressure on other grains and hence increasing their price.
Professor Matial at the Tel Aviv Institute of Management has said that the cost of flour has risen 27%, eggs 10%, electricity 10%); in London, The Economist headlined "The end of cheap food" declaring it to be the result of the US's "reckless" ethanol subsidies.
Despite this 'experiment,' the apologists for carbon trading try to persuade us that somehow or another carbon trading will reduce the enormous cost of trying to reduce emissions by 60%). The US experience is not just a gedanke (theoretical) experiment but a real-life episode suffered by the whole nation. The cost increases that have been experienced in the United States will pale into insignificance compared with those certain to take place if any of the carbon trading schemes foreshadowed by the Gamaut Review were put in place. (See 5.3 below)
As a footnote to the ethanol question, it has been shown that, contrary to being a 'climate friendly' solution, it in fact has a more deleterious effect that the petroleum it replaces. ' Furthermore, the exhausts from the buming of ethanol have been shown to be carcinogenic.
d.) Alternative Power.
The Australian government has spent more than $1 billion on the Australian Greenhouse Office, most of which has gone to the altemative energy sector; particularly the wind generator industry which receives subsidies of the order of $800 million per annum. This $800 million is paid by the taxpayer (and the very few stupid enough to pay a premium for 'green' energy), is enlarging the bank balances of the rentier manufacturers who build these monstrosities, and is creating a totally false impression of the efficacy of wind power.
All of this money, wasted as it has been, could have been spent more effectively on almost any other govemment activity.
5.2 Ongoing Costs.
The list in 5.1 above merely scratches the surface of the costs incuned by the economy as a result of environmental/global warming hysteria.These costs are ongoing and increasing from year to year.
The failure to build adequate storage dams for major cities, the abandonment of fuel reduction buming in national parks, the diversion of resources by many public listed companies to placate the green and global warming lobby, to mention but a few.
Another example is the intense lobbying by the Wild Country Science Council to prevent agricultural development in Australia's subtropical north. In an area where very little of the river flow is used at all; and while, for example, the Munay Darling system is under pressure; over 100,000,000 ha is suitable for some form of agriculture. Any proposal for the development of this resource would be put at risk by this, or other, green lobby groups. ^ ' Crutzen, P. Journal of Atmospheric Chemistry and Physics.
^ Freebairn, R. Ground Cover, Grains Research and Development Corporation, Kingston ACT March-April 2008 pp. 24-25.

31 5.3 The Future.
It is not the purpose of this paper to examine in detail the imposts that the govemment might enact in the future. Indeed, in the absence of any real information it would be a waste of time. However, there is enough broad information available to be able to envisage the enormous costs that would be incuned by the economy if the government's advertised scheme or schemes were to be put in place.
The govemment has indicated that it would require a reduction of carbon dioxide emissions of 60%. To quote the Gamaut Review's interim report: "There are two possible market based approaches to securing Australia's emissions budget, each involving the setting of an emissions price. One is an emissions tax. The other, an emissions trading scheme (ETS), places caps on total emissions over specified periods of time, issues permits for emissions in quantities that conespond to these caps, requires firms to hold pemiits for any emissions that they generate, and allows trade in permits among firms."
On this basis, a qualitative estimate of the sort of penalties that the community will pay can be made.
One such estimate was made for the 2100 IPCC Report using sophisticated computer simulation of both climate and economic change. ' It gave nett present value (NPV) costs for various scenarios in year 2000 US dollars. For what was temied a business as usual scenario (with no attempt to mitigate emissions) the NPV cost was $4.82 trillion. For a scenario aimed at keeping the temperature increase down to 1.5° (which roughly equates to a reduction in emissions of 60%) the NPV cost was $37,632 trillion.
We need not be concemed with the actual figures, what is important is that, presumably, the program compared like with like; so that we can say the NPV cost of reducing emissions by 60% would be 7.8 times the cost of doing nothing.
That in itself speaks volumes, but it is worth commenting, that if those figures were, as they purported to be, for the whole world; then the ratio for Australia is likely to be greater than 7.8. This is because the Australian economy, and its exports, are heavily reliant on fossil fuels. Our principal exports are coal, minerals, metals and agricultural produce, all of them carbon intensive. Certainly, the agricultural industry's 'carbon footprint' (in the jargon of the global warming believers) has been grossly overstated; no doubt with a view to ensuring that, if an ETS was forced on the country, farmers, as usual, would get nothing out of it; nevertheless modem agriculture does rely heavily on fossil fuels.
The cost of the trading scheme itself would add to the total cost to the economy, because of the middlemen and trading sharks who would batten on to the scheme. One of the worst features of the scheme would be this very fact; since, once started, these parasites will go to any end to ensure that it continues so that they can reap their profits. A trading scheme of this nature, being a fraud in itself, will ensure that all its operations will be fraudulent. It is a scheme that will depend on some political/bureaucratic decision to give, as Shakespeare put it, to airy nothing a local habitation and a name. A price will be put on nothing, and that nothing will be traded at prices determined by the same political bureaucrats in volumes determined by them. A situation that no sane businessman would engage in other than under duress.
Another window has been opened on the probable cost of an ETS. In 2005 the House of Lords Economic Affairs Committee was quoted figures ranging from US $80 billion to US $1100 billion per annum. The range indicated the cosfs dependence on how soon the scheme was started-the sooner the costlier.^ ' Nordhaus and Boyer 2000:7:25, BEA 2001 b-c. Quoted by Lomborg (op. cit.)
Lord Lawson (formerly Chancellor of the Exchequer) A Lecture to the Centre for Policy Studies-November 2006
32
EPILOGUE.
The Garnaut Review prefaces its issues paper with the disclaimer "The issues discussed in this paper do not represent the views of Professor Gamaut or the Review Secretariat...." One might ask who.se views do they represent?
The Review is damned out of its own mouth when it says: ".... the Review is in no position to adjudicate on the relative merits of various expert scientific opinions. The Review has neither the time nor the resources [competence?] to do so." And again: "The Review takes the work of the IPCC as its starting point for analysis of the impact of climate change and the costs and benefits of mitigation." (emphasis not in original)
This is the equivalent of a Judge saying: "I have neither the time nor the knowledge to differentiate between the case for the prosecution and the case for the defence. I will therefore hear the prosecution's evidence; and having heard that, all that will remain for me to do, is to decide on the penalty to be visited upon the defendant." Even the excesses of the Mason court ' did not go that far. It is as if one who, having made up his mind, reflises to be confijsed by the facts.
As an apologia for the above statements the Review says, inter alia: " There is statistical evidence that the global temperature has been on an upward trend in recent times However, some people with relevant scientific credentials {and many who lack them) argue that the warming trend may be mainly the result of factors independent of human activity that have been responsible for continuously changing global climate since homo sapiens have (sic) been on earth." (emphasis not in original) The implied slur on the opponents of the received wisdom is unwananted.
Surely, if the Review members do not have the time they should ask for more time; if they do not have the resources they should ask for more resources. These people are being paid (and no doubt well paid) to provide advice to the govemment and the people of Australia. If they are not competent to do this they should say so and retire from their positions.
Having taken the work of the IPCC as its starting point the Review says that this is the majority opinion of the Australian and intemational scientific communities; and that it "is supported by the large majority of scientific opinion." These statements are disingenuous.
The Review must have known of the hundred or more distinguished scientists who signed a letter addressed to the Secretary General of the United Nations at the recent Bali conference. All these scientists refuted the claims of the IPCC and said such things as "Attempts to prevent global climate change from occuning are ultimately futile, and constitute a tragic misallocation of resources that would be better spent on humanity's real and pressing problems"
They must also have known of the more than 400 scientists who were either sceptics or outright opponents of the IPCC's views quoted by Senator James Inhofe of the United States Senate Environment and Public Works Committee on the 20th of December 2007; and the 17800 scientist signatories to a petition organised by Dr Frederick Seitz, past president of the US National Academy of Sciences, in 1997 which said in part: "There is no convincing scientific evidence that human release of carbon dioxide, methane, or other greenhouse gases is causing or will, in the foreseeable ftiture, cause catastrophic heating of the earth's atmosphere and disraption of the earth's climate." Also the 60 experts in climate related fields who in 2006 signed a letter to Canada's Prime Minister saying: " ' Climate change is
' Pierce, J.L. Inside the Mason High Court Revolution. Carolina Academic Press Durham, North Carolina 2006
33 real' is a meaningless phrase used repeatedly by activists to convince the public that climate catastrophe is looming and humanity is the cause. Neither of these fears is justified." And again the Leipzig petition of Professor Fred Singer signed by 80 prominent scientists and academics ".. we cannot subscribe to the politically inspired world view that envisages climate catastrophes and calls for hasty actions."
These, and many other distinguished scientists in Australia and around the world are on the public record as opposing the views expressed by the IPCC and its coterie of rentier scientists. This is without having to recall such world-renowned figures as the late Sir Fred Hoyle.
The disgraceful fact is that many of these scientists have had their funding threatened by the politico/scientists who control or who have access to the control of the funding of climate science. Furthermore, there has been an active suppression of the views of the anti-global warming scientists by politicians, bureaucrats and the media. So that the public is only 'allowed' to see the continuing and increasingly shrill declarations of the global warming fraternity.
As we have seen above, some of the scientist promoters of global warming have been shown to have fraudulently manipulated data and results. There is every reason, and in fact considerable proof, to believe that the GCMs relied upon by the IPCC are at the very least unreliable, and at the worst have themselves been manipulated. But these facts have also been suppressed.
As a result, the populist view seems to be that the global warming theorists are in the right. This of course has been reinforced by the media, and charlatans like Gore and Flarmery. The populist attack has been increasingly aimed at creating a sense of guilt and promoting the idea that the inevitable hardships of emissions reductions are a form of expiation. This conveniently removes the necessity for explaining the case or addressing the fundamental science. Serge Galam has it right when he says: "The claimed unanimity of the scientific community about the human culpability for global warming is not true. To date there exists no scientific proof of human culpability. It is not the number of authors of a paper, which validates its scientific content. The debate about global warming has taken on emotional tones driven by passion and irrationality, while it should be a scientific debate. The degree of hostility used to silence any dissenting voice demonstrates that the cunent debate has acquired a quasi-religious nature. Some scientists are behaving as priests in their will to 'save the planet'. We are facing a dangerous social phenomenon, which must be addressed from the social point of view. The cunent apparent unanimity of citizens, scientists, journalists, intellectuals and politicians is intrinsically wonying. The calls to sacrifice our way of life to calm down disturbed nature is an emotional ancestral reminiscence of archaic fears, which should be analysed in such. '
Nevertheless, none of this has any appeal to the coterie of government fiinded self-serving climate scientists whose approach to climate research often ".... more closely resembles a mutual admiration society than a competitive and open-minded search for scientific knowledge;" ^ and whose dependence on the gravy train of govemment fianding makes it difficult, if not impossible, to admit to the egregious folly of their insistence on their stance.
This must be becoming more difficult for them; as the suppression of their opponents, mentioned above, is becoming less effective. A multitude of Internet web pages and discussion forums are exposing the received global science to extreme criticism. All these sources are unanimous in refuting the claims of the IPCC establishment. Surprisingly, scepticism is creeping into the mainstream media; The Weekend Australian of March 22"''. ' Galam, S. Climat: culpabilite et tentation sacreficielle. Centre de Recherche en Epislemologie Appliquee Paris. 30 Aug. 2007
^ Editorial, The Wall Street Journal 14th July 2006
34 2008, ran an article under the byline of Christopher Pearson, and headlined "Climate facts to wami to;" which ran to 33 column inches and a photograph discussing the global cooling since 1998. (Refened to in 4.2 b. p.20 and 4.5 a. p.27 above) It is largely given to a discussion on, of all places, ABC Radio National; between the presenter Michael Duffy and biologist Jennifer Marohasy, senior fellow at the Institute of Public Affairs. Marohasy pointed out that new information, from NASA's Aqua satellite, has provided the data refened to above. She went on to say that the data has been published and accepted-but that the [global warming fratemity] are "still in shock at this point." Pearson goes on to say "A great many founts of authority, from the Royal Society to the UN, most heads of government, along with countless captains of industry, leamed professors, commentators and joumalists will be profoundly embanassed. Let us hope it is a prolonged and chastening experience." And then "... the Prime Minister [Rudd] will have to kiss goodbye [to] what he likes to call the great moral issue and policy challenge of our times."
The Wall Street Journal and the Australian gave considerable space to reports on the 2008 Intemational Conference on Climate Change held in New York on March 2-4. This conference was sponsored by the Heartland Institute and was attended by more than 500 people from around the world, more than half of whom were climate scientists of repute. Those present, including the president of the Czech Republic, were unanimous in their condemnation of the IPCC's approach to global warming and issued a statement (the Manhattan Statement) to that effect.
The ABC's recent attempt to denigrate the documentary The Great Global Warming Swindle backfired to such an extent, that although it attracted a greater audience than any ABC program ever has, the response was so critical of the ABC and supportive of the documentary, that an embanassed ABC closed down its online poll prematurely.
The Sydney Morning Herald's most recent foray into persuading people to turn off their lights for an hour reduced the power usage for that time by a mere 10%). So that, at the most, 10% of the population took any notice of the campaign that had run for more than three weeks, trying to persuade people to support this farce.
It is becoming more and more evident that it is only the promoters, the chattering classes, and the ignorant young who are still in any way engaged in this nonsense. It is doubtful if more than 20% of the population believes in any way the mendacious propaganda still being promoted by the global warming fanatics.
When the population at large becomes aware, as it surely will, that Australia's carbon emissions are only 1.5% of the world total, that China alone contributes 16% and is rapidly increasing its proportion, Brazil 5.2%) and increasing, India 3.5% and rapidly increasing, and that none of these countries will commit to reducing their emissions; when it becomes aware that our nearest neighbour, Indonesia, produces 8.7% and will receive considerable relief from any penalties; and that we are being told that, despite this, we will have to suffer a catastrophic dislocation of our economy in order 'to set a good example'; it is not difficult to imagine what the reaction will be.
If Australia were to stop all its carbon dioxide emissions it would only have an infinitesimal effect on the world situation.
Brooding over all this is the position of the United States (16.8% of the world's emissions) which, at the moment, is enigmatic.
It is hard to imagine a more absurd proposition than that Australians should be prepared to see their economy destroyed in the bizane hope that the Chinese will respond to that 'good example' by doing likewise. It is particularly absurd when it is remembered that as recently
35 as the Bali conference the Chinese made it abundantly clear that they will not prejudice their declared program of building one coal-fired power station every week for the next four years by making any attempt to reduce their carbon dioxide emissions other than by the normal process of improved efficiency and better technology than they have used in the past. The Indians, whose output of carbon dioxide is likely to increase more than the Chinese, if only because they are behind the Chinese in the race of expanding their industrial base, also made it quite clear that their "economic growth was the first priority." Furthermore, the Chinese have had the effrontery to say that the Western world, having caused the problem that it is complaining about, must clean it up. In addition China would participate in any global carbon trading - the outcome of which could well be that Australia would pay penalties for shipping coal to China and the Chinese would get credits for buming it. In a similar way Russia could have benefited to the tune of $40 billion a year if Kyoto had been enforceable as written.
This emphasises the fraudulent nature, mentioned above (see p.31), of any carbon trading scheme. All carbon trading schemes are an open invitation to fraud, which has already been demonstrated in Europe.
It is clear that the question of global warming is not one of science but rather of psychology-or perhaps psychiatry? As has been touched on earlier (see p.l 1 and p. 33) there seems to be a very large element of wanting to be frightened, and an attempt to expiate some indeterminate sin or sins, hidden in the populist response to the media campaign which unifomily promotes the "end of the world is nigh" message of the global warmers.
If something to be frightened about is all that is needed, there is plenty of scope. Apollo type objects (asteroids with a diameter of about a kilometre) travel pass the earth at less than the lunar distance every 250,000 years. But smaller objects (about 300 m diameter) actually hit the earth on the average every 10,000 years - and the last one was about that time ago. These objects, quite apart from the obvious consequences of such an impact, are thought to be at least one of the causes of ice ages. (See Hoyle op. cit.) Then there is the certain depletion of the earth's fossil fuels, which is likely within the broad timespan envisaged by the global warming doomsayers.
This is without considering the dangers implicit in the extremes of international politics. But let Lord Lawson (op. cit.) have the last say. He points out that the "... new religion of eco-fundamentalism [presents] dangers on a least three levels."
The first, he says, is that governments may get so canied away by their rhetoric as to impose measures which do serious harm to their economies (these comments were made in November 2006). The second is that the global Salvationist movement is profoundly hostile to capitalism and the market economy.
"But the third danger is even more profound. Today we are very conscious of the threat we face from the supreme intolerance of Islamic fundamentalism. It could not be a worse time to abandon our traditions of reason and tolerance, and to embrace instead the inationality and intolerance of eco-fijndamentalism, where reasoned questioning of its mantras is regarded as a form of blasphemy. There is no greater threat to the people of this planet than the retreat from reason we see all around us today."
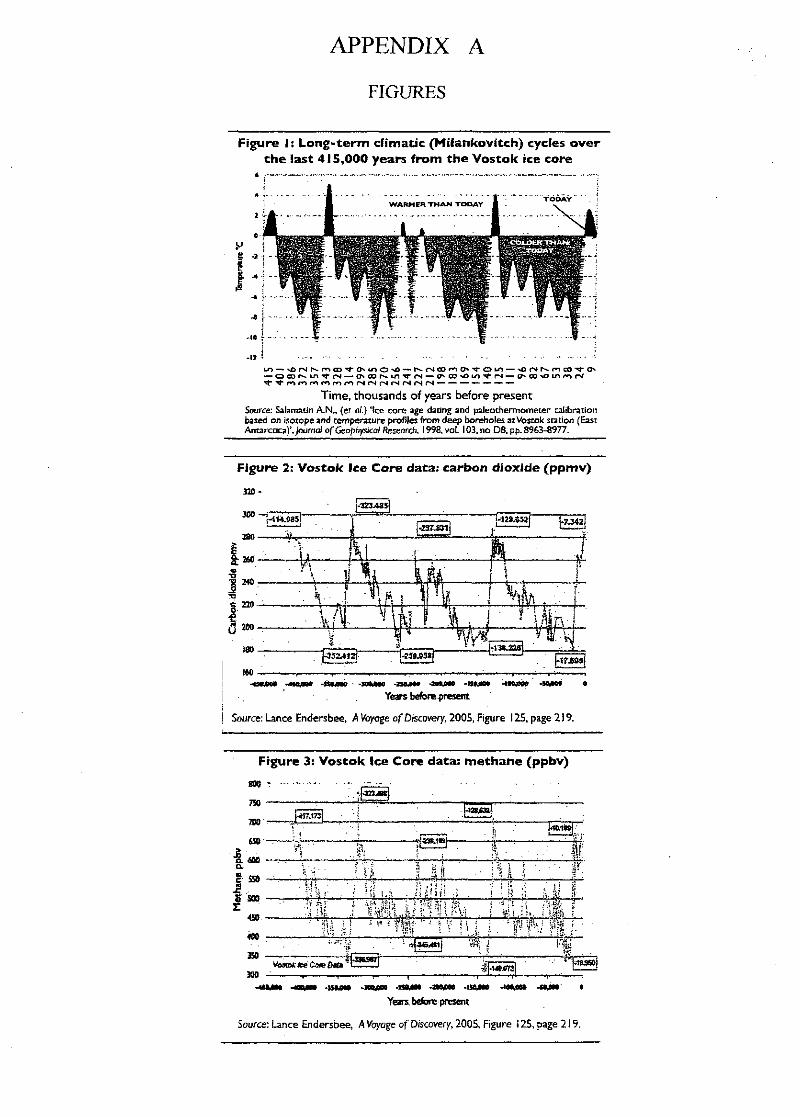
APPENDIX A
FIGURES
Figure I : L o n g - t e r m c l imat ic (Mi lankov i tch) cycles ove r
t h e last 415,000 years f r o m t h e Vos tok ice core
Lo — ̂ orNr^mco'^o>i/ io>o — r^(^oorno^^oi .o — •»crNtr^mcoTro^ — oooi^u^ '^oJ — o^oor^Lfi-^rr^* — ovaj-voun-^rr^ — a^oo^ouimr»4 ^ • ^ r o m m r O f * i r o r H r » J r M r * 4 t N f N f N . — — — — — — —
Time, thousands of years before present
Source: Salamatin A.N. . (eJ al.) 'Ice core age dating and paleothermometer calibration based on isotope and temperature profiles from deep boreholes at Vostok station (East Antarctica)'Journal of Geophysico/ftEseorch, 1998, vol. 103, no D8, pp. 8963-8977.
Figure 2: Vos tok ice Core data: carbon d iox ide ( p p m v )
320-
-^ZJjtSS
"l^UMit
\-zirsn\ •rti»Ai2\ j . z ^ z |
180- -f.
•260- •¥r % •J.
240-
230
U 20O-
itP M MJ I
ISO. VV^
~U3S1A12\ j-259.a5«f |r13«.220^
^ 2 / . k
|-irJ!9si
IM .- — , — _ , — r - —,- , r- 1 r-̂ ,
-4Mgo«a in,DWi -OMW -nOkMs - i » M * -n*Ms - I S M O * -ttOAov -mwa a
Yesrs bcforB.prKent
Source: Lance Endersbee , A Voyoge o f Discovery, 2005 , F igure 125, page 2 1 9 .
Figure 3: Vos tok Ice Core data : me thane (ppbv)
soo ' — -: , — , h a » j « .
TIP
780
6S>
' i . mo
a.
§ sso
1 t soo
450
«»
350 390
; j-4rF.t73| . 1
• ! • ' ''
• ^ ' V • • ! Vii
• ' p s r . : M ! h
it-
^ m t . c ^ o ^ ^ - ' f ^
jjzqwmj
1 M • " 1 ' '
.. . l i M .: •••• '•• r ? r - . ' • ] = ', ,
• ' lijjfeWJ
. j j j jSSj
• s
" " • ^ • • - •
• 1 1 f .!
! ' Ul '!.
I I I . • ; i V i ; = 5
Mi ;. . P t m-i
Sij-M»j072|
:-̂ - I i : • • • • • F .
Ml r. m \
" > is . , j •
->«3»i
-utiM* -40«*w -UMM -i««4« - H M M .aa«M .isekMo -itMW -s*,m «
Years, b^bre present
Source: Lance Endersbee , A Voyage o f Discovery, 2005 , F igure 125, page 2 1 9 .
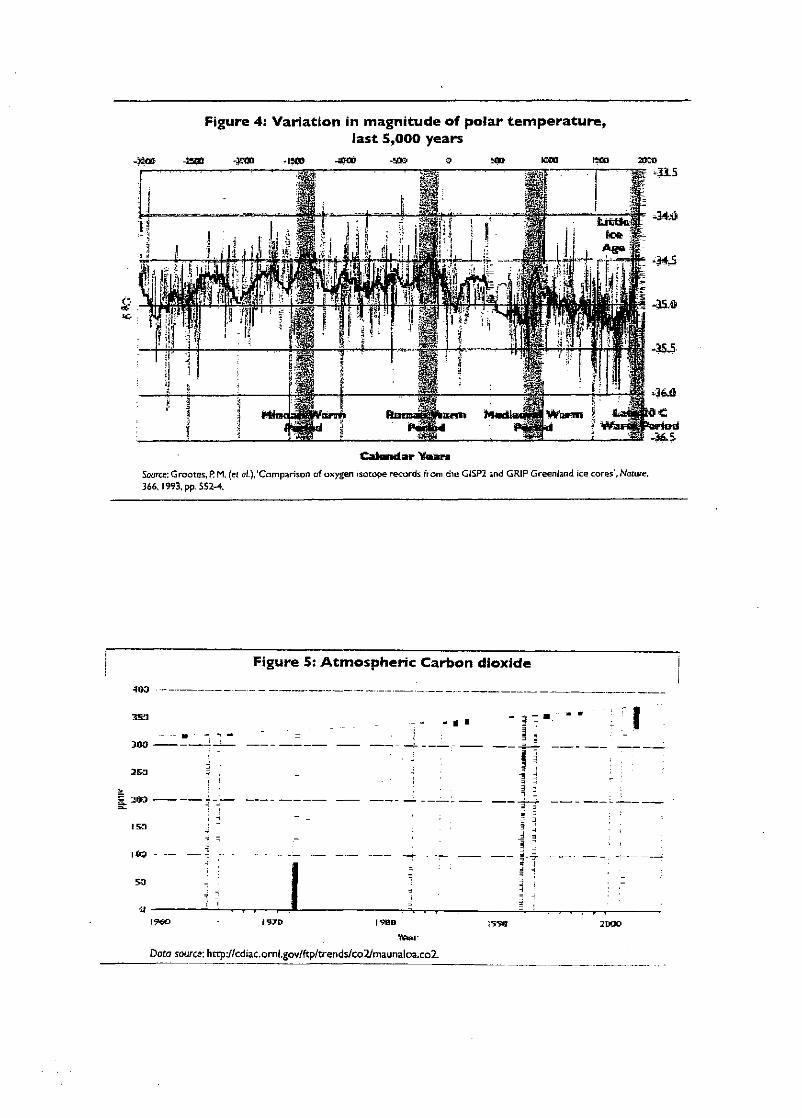
-sm
Figure 4 : Va r i a t i on in magn i tude o f po lar t e m p e r a t u r e , last 5,000 years
'lew -ISM -asoi - ' ! ^ o » » KXXS iim 3eco
Caiondar Yiix»
Source: Grootes, P. M. (et a/.),'Comparison of oxygen isotope records from the GISP2 and GRIP Greenland ice cores', Nature. 366, l993,pp.SS2-4.
Figure 5: A t m o s p h e r i c Carbon d iox ide
1 0 0 - ~
1 • 9 ,
300 ^-
S 200
ISvT
loa
50
i 1
r — T — 1 — I : — .
I9BD iS'Stl
•tasir
Data source: hnp://cdiac.ornl.gov/ftp/trends/co2ymaunaloa.co2.
!D00
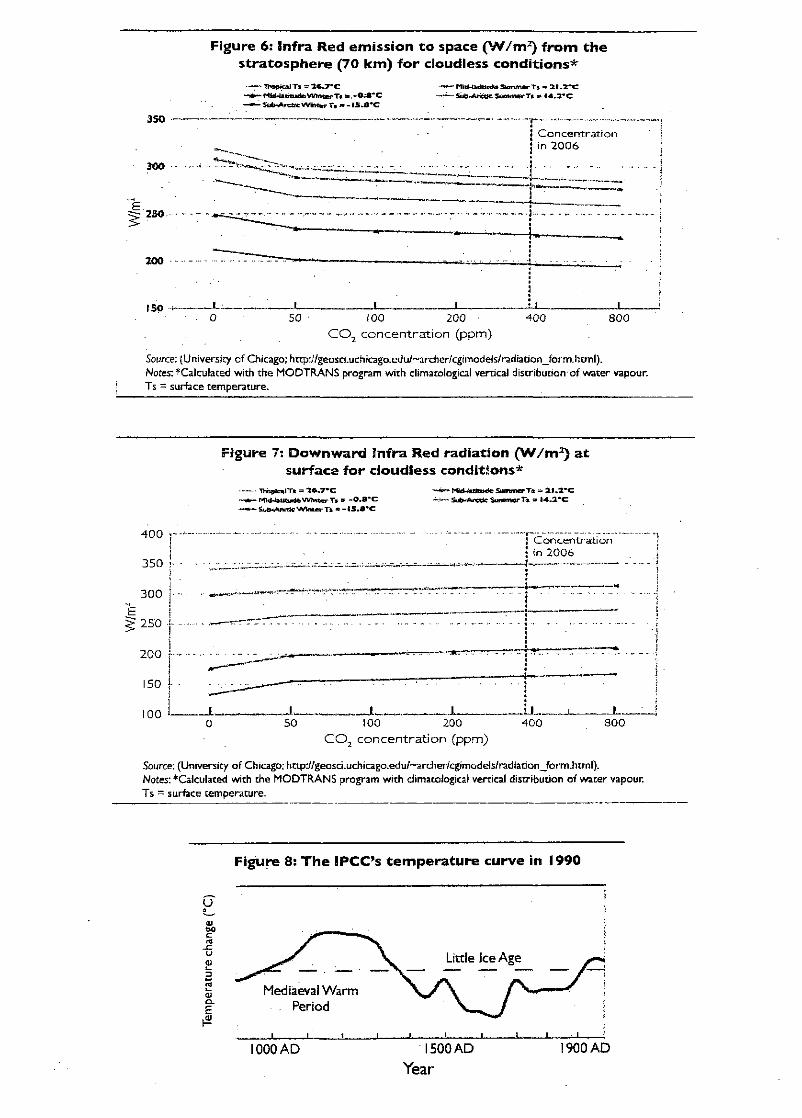
Figure 6: In f ra Red emiss ion t o space ( y / / m ^ f r o m t h e s t ra tosphere (70 k m ) f o r cloudless c o n d i t i o n s *
- TrouicilTi = 16.7-C -rUd-UotuileWlntcf T> s . - O ^ ' C - Sub-ArcQCvVihtair T . » - IS .a-C
• Mld.4jidtuds SBmirwTs « 2 U - C - &Jb.AnsK SummerTlw I4 .3*C
3SO
300
2SO
! C o n c e n t r a t i o n " in 2 0 0 6
200
ISO _L 50 100 200
C O . c o n c e n t r a t i o n ( p p m )
4 0 0 8 0 0
Source: (University of Chicago; http://geosci.uchicago.edu/-archer/cgimodels/i-adiation_form.html).
Notes: *Calculated with the MODTRANS program wi th climatological vertical distribution of water vapour
Ts = surface temperature.
Figure 7: D o w n w a r d In f ra Red rad ia t ion ( W / m ^ a t surface f o r cloudless cond i t ions*
• TWjlJtellTj = i o . y ' c -MWJ»«aid*V>ni«crT» » - C S ^ C - Su*>.rtrrtc VlrtnierTi » - I S . a - C
*t^d.JAtltude Summer Ta ==• 2 I . 2 *C - Sub-A«YtIC SuntmorTt sr M.2*C:
4 0 0
3 5 0 ':•
! C o n c e n t r a t i o n I in 2 0 0 6
3 0 0 i-I
^ 25D j -
i 2 0 0 I-
150
100 ' -50 100
C O , c o n c e n t r a t i o n ( p p m )
8 0 0
Source: (University of Chicago; http:y/geosci.uchicago.edu/~archer/cgimodels/radiation_form.html).
Notes: ^Calculated with the MODTRANS program wi th climatological vertical distribution of water vapour.
Ts = surface temperature.
Figure 8: T h e IPCC's t e m p e r a t u r e curve in 1990
u
u
01 a . E
.a)
Mediaeval Warm Period
_! I, .1
1000 AD 1500 AD
Year
1900 AD
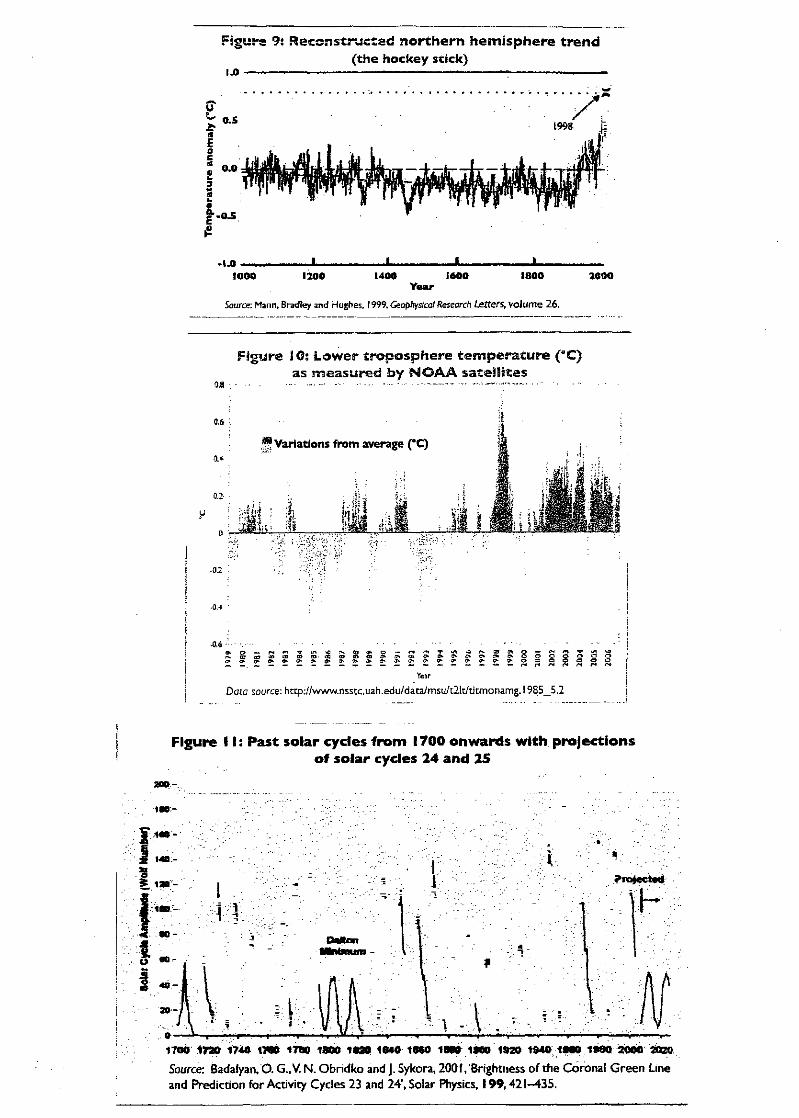
Figure 9: Raconst ruc tad n o r t h e r n hemisphere t r e n d (the hockey scick)
1.0
"a £ o c n a k. 3
n s. |2
0.5
0.0
0 .5
^ i998 4̂
-1.0 1000 1200 1400 1600
Year 1800 2000
Source: Mann, Bradley and Hughes, 1999, Geophysical Research Letters, volume 26.
Figure 10: Lower troposphere temperature (°C) as m e a s u r e d b y M O A A sateHSJtes
I Variations from average (°C)
Liik
3
:P.: Iii J l
i ;
, - i ';, Mi J
-̂ ̂ .
i l l '
m
O — r s m - r o - i s c r i . . ( o o t . 0 — ^. to W O -^ (^ ' ^
Doia source: hn:p;//www.n5stc.uah.edu/data/msu/t21t/tlcmonamg. 1985_S.2
Figure I i : Past solar cycles f r o m i 700 onwards w i t h p ro jec t ions o f so lar cycles 24 and 25
200-
(M-
DMton .Mkibnuni
I I I
i>ral«ctm»
P
1:^ :V. 1700 1730 1740 1700 1780 1800 1«99 1 6 * 0 1 8 M 18Bfr 1 M 0 1920 I M O / t M O 1»aO ^t^MKI ^320
Source: Badalyan, O. G., V. N. Obridko and J. Sykora, 200 f, 'Brightness of the Coronal Green Lne and Prediction for Activity Cycles 23 and 24', Solar Physics, 199,421-435.
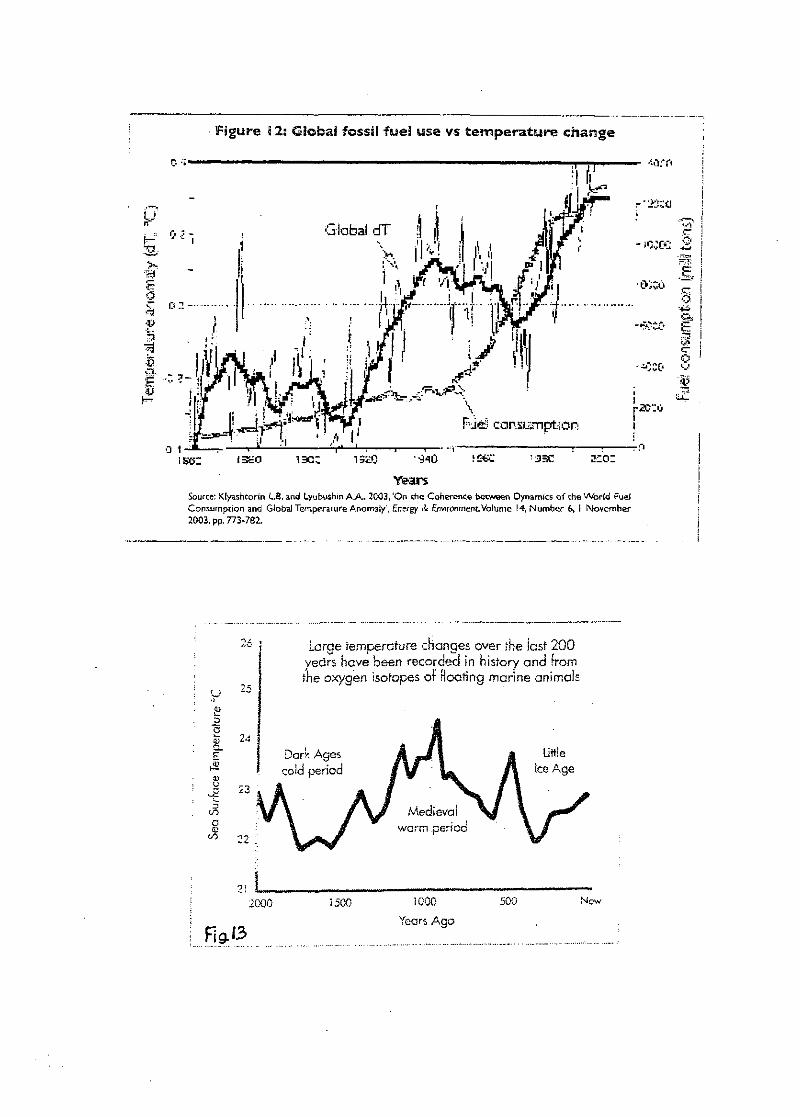
Figure 12: GSofcai fossil fuel use vs t e m p e r a t u r e change
c- •';
u
a.
.4*
Yisars Source: Klyashcorin LB, and Lyubushin AjK.. 2003, 'On the Coherence betv^een Dynamics of the VVorld Fuel Consumption and Global Temperature Anomaly', Energy A Environment, Volume 14, Number 6, 1 November 2003, pp. 773-782.
a
1)
:3
Large remperGture changes over the last 200 yedrs have been recorded in history and from the oxygen isotopes of Boating marine animals
2: i -2C>00
Figi3
1500 1000
Years Age
500 Now

20 Tnere hove been enormous changes in
carbon dioxide {CO.J over time reiared to voicanism, sedimentation, mounrain-
b'jiiding end lire on Earth
' •• i
o o
5"-" o
u 5
12
iO
3
V - I
A
1 Preca
/ /
/ /
\ \
mbrian \ i Age
\
\ Perr
\
"licn-Carboniferous ice Ace
Last
ice Aqe
oOO
Fig. 14 AAiilicns of Years .Aao
atmosphere {carbon dioxide)
2 - 4 X K j "
sedimentary rocks (organic carbon) i |carbohvdrates|
4 X l O " 3 X l O ' ^
ocean {bicarbonate ions)
1-3 X 10'°
Fig. | J^ Carbon is continually exchanged between the atmosphere, the oceans, the biosphere and sedimentary rocks. TTie diagram shows the amounts (in grams of carbon dioxide) at each stage in the cycle, and the annual rates of transfer of carbon dioxide between stages. {After Goody and Wallcer, 1972, p. 127. Reprinted by permission of Prentice-Hdl, Inc., Englewood Cliffs, New Jersey, USA.)
Fig.ife Sunspot number
5 SO
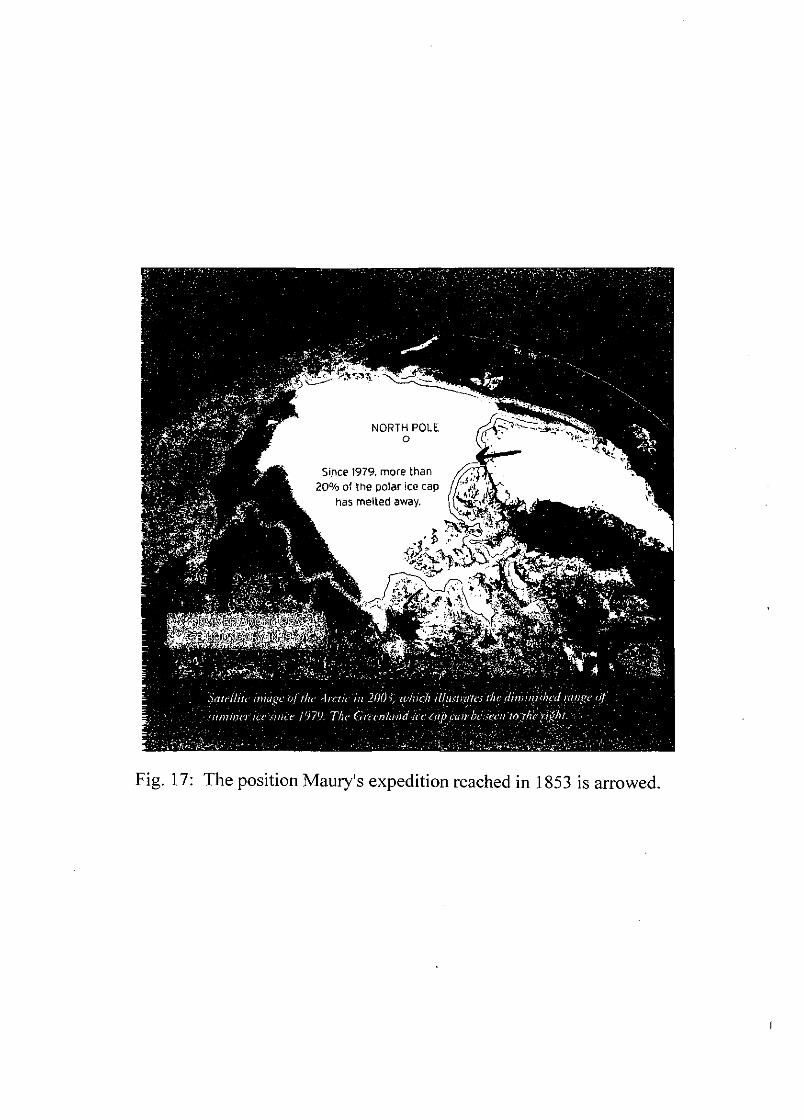
Fig. 17: The position Maury's expedition reached in 1853 is arrowed.