7. air quality and climate factors.pdf - dublin · table 7.2: definition of impact magnitude for...
TRANSCRIPT

Dublin City Council College Green Project EIAR Chapter 7- Air Quality and Climate Factors
Rev 1 | Issue | October 2017 | Arup \\GLOBAL\EUROPE\DUBLIN\JOBS\252000\252740-00\4. INTERNAL\4-03 DESIGN\4-03-02 CONSULTING\FI\RESPONSES\Q1\EIAR\CHPT. 7 AIR QUALITY AND CLIMATE FACTORS\CHPT 7 AIR CLIMATE_ISSUE_OCTOBER_2017_FINAL.DOCX
Chp 7-1
7 Air Quality and Climate Factors
7.1 Introduction This chapter assesses the air quality and climate impact associated with the Proposed Project. Details of the Proposed Project are outlined in Chapter 4.
7.2 Assessment Methodology The impacts have been assessed in terms of Air Quality and Climate of the local environment as defined in the EPA “Advice Notes on Current Practice in the Preparation of EIS” (EPA, 2003). The assessment methodology is based on guidance outlined in the Environmental Protection Agency (EPA) Guidance “Air Dispersion Modelling From Industrial Installations Guidance Note” (EPA, 2010), Transportation Infrastructure Ireland (TII (formerly the National Roads Authority) Guidance “Guidelines For The Treatment Of Air Quality During The Planning And Construction Of National Road Schemes” (TII, 2011) and UK DEFRA Guidance “Part IV of the Environment Act 1995: Local Air Quality Management, LAQM.TG(16)” (UK DEFRA, 2016). Vehicle-derived air emissions in the study area have been modelled using the ADMS-Roads dispersion model (Version 4) which has been developed by the Cambridge Environmental Research Consultants (CERC) and following guidance issued by the EPA (EPA, 2010). The model is a steady-state Gaussian plume model used to assess pollutant concentrations associated with road sources and is based on the ADMS model also developed by CERC.
The air dispersion modelling input data consisted of information on the physical environment (source geometry and building dimensions), detailed emission factor formulations and appropriate hourly meteorological data. Using this input data, the model predicted ambient ground level concentrations for each hour of the modelled meteorological years. The model post-processed the data to identify the location and maximum of the worst-case ground level concentration. This worst-case concentration (including background concentration) is then compared with the relevant ambient air quality standard to assess the significance of the air emissions.
The impact assessment considers the following scenarios:
• Do-minimum (DM) scenario – Represents movement and access in the city centre as it exists currently, taking into account developments with approved planning permissions, as well as projects committed to be implemented prior to the Proposed Project. This scenario includes the continuation of all east-west through traffic at College Green during the weekends and public transport access only from Monday to Friday. This scenario includes no plaza provided at College Green;
• Do-something (DS) scenario – There will be two representative ‘do-something’ scenarios. The first represents a situation where the Proposed Project has been implemented as well as other planned projects outlined in the do-minimum scenario (by 2018). The second represents a situation where the Dublin City Centre Transport Study (Dublin City Council, National Transport Authority, 2015) has been implemented in totality (by

Dublin City Council College Green Project EIAR Chapter 7- Air Quality and Climate Factors
Rev 1 | Issue | October 2017 | Arup \\GLOBAL\EUROPE\DUBLIN\JOBS\252000\252740-00\4. INTERNAL\4-03 DESIGN\4-03-02 CONSULTING\FI\RESPONSES\Q1\EIAR\CHPT. 7 AIR QUALITY AND CLIMATE FACTORS\CHPT 7 AIR CLIMATE_ISSUE_OCTOBER_2017_FINAL.DOCX
Chp 7-2
2035). This includes the Proposed Project, as well as a number of ‘other planned projects’. This scenario includes the plaza at College Green.
Throughout this chapter a worst-case approach was taken. This will most likely lead to an over-estimation of the levels that will arise in practice. The worst-case assumptions are outlined below:
• Maximum predicted concentrations were reported in this study, even if no residential receptors were near the location of this maximum;
• Conservative background concentrations were used to assess the proposed air quality impact in 2018 and 2035.
Parliament Street and Winetavern Street are expected to experience large increases in the number of buses as a result of the Proposed Project. For this reason and due to the narrowness of the road and proximity building facades to the road, more detailed modelling results are provided at these locations.
7.2.1 Guidance and Legislation In order to reduce the risk to health from poor air quality, national and European statutory bodies have set limit values in ambient air for a range of air pollutants. These limit values or “Air Quality Standards” are health or environmental-based levels for which additional factors may be considered. The applicable standards in Ireland include the Air Quality Standards Regulations 2011, which incorporate EU Directive 2008/50/EC as shown in Table 7.1.
Table 7.1: Air Quality Standards 2011 (Based on Directive 2008/50/EC)
Pollutant Regulation Limit Type Value
Nitrogen Dioxide
2008/50/EC
Hourly limit for protection of human health - not to be exceeded
more than 18 times/year
200 μg/m3 NO2
Annual limit for protection of human health
40 μg/m3 NO2
Critical value for protection of vegetation
30 μg/m3 NO + NO2
Particulate Matter
(as PM10)
24-hour limit for protection of human health - not to be exceeded
more than 35 times/year
50 μg/m3
PM10
Annual limit for protection of human health
40 μg/m3
PM10
PM2.5
Annual limit for protection of
human health 25 μg/m3
PM2.5
Dublin City Council College Green Project EIAR Chapter 7- Air Quality and Climate Factors
Rev 1 | Issue | October 2017 | Arup \\GLOBAL\EUROPE\DUBLIN\JOBS\252000\252740-00\4. INTERNAL\4-03 DESIGN\4-03-02 CONSULTING\FI\RESPONSES\Q1\EIAR\CHPT. 7 AIR QUALITY AND CLIMATE FACTORS\CHPT 7 AIR CLIMATE_ISSUE_OCTOBER_2017_FINAL.DOCX
Chp 7-3
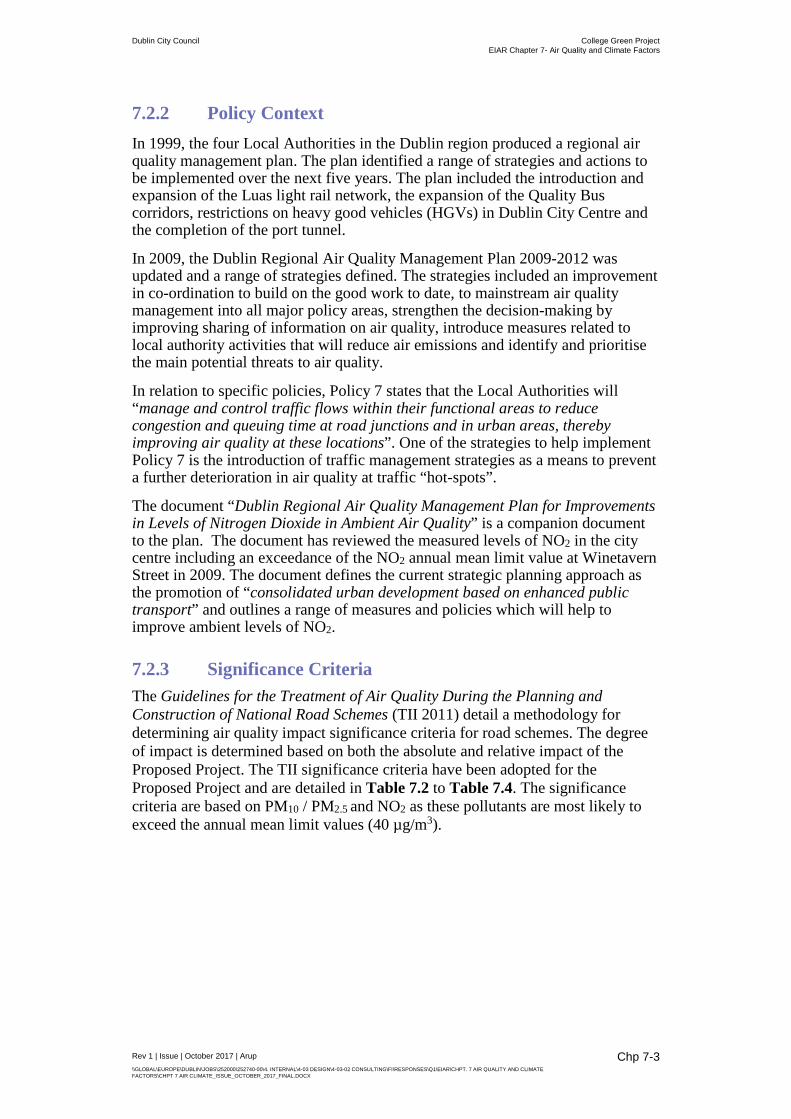
7.2.2 Policy Context In 1999, the four Local Authorities in the Dublin region produced a regional air quality management plan. The plan identified a range of strategies and actions to be implemented over the next five years. The plan included the introduction and expansion of the Luas light rail network, the expansion of the Quality Bus corridors, restrictions on heavy good vehicles (HGVs) in Dublin City Centre and the completion of the port tunnel.
In 2009, the Dublin Regional Air Quality Management Plan 2009-2012 was updated and a range of strategies defined. The strategies included an improvement in co-ordination to build on the good work to date, to mainstream air quality management into all major policy areas, strengthen the decision-making by improving sharing of information on air quality, introduce measures related to local authority activities that will reduce air emissions and identify and prioritise the main potential threats to air quality.
In relation to specific policies, Policy 7 states that the Local Authorities will “manage and control traffic flows within their functional areas to reduce congestion and queuing time at road junctions and in urban areas, thereby improving air quality at these locations”. One of the strategies to help implement Policy 7 is the introduction of traffic management strategies as a means to prevent a further deterioration in air quality at traffic “hot-spots”.
The document “Dublin Regional Air Quality Management Plan for Improvements in Levels of Nitrogen Dioxide in Ambient Air Quality” is a companion document to the plan. The document has reviewed the measured levels of NO2 in the city centre including an exceedance of the NO2 annual mean limit value at Winetavern Street in 2009. The document defines the current strategic planning approach as the promotion of “consolidated urban development based on enhanced public transport” and outlines a range of measures and policies which will help to improve ambient levels of NO2.
7.2.3 Significance Criteria The Guidelines for the Treatment of Air Quality During the Planning and Construction of National Road Schemes (TII 2011) detail a methodology for determining air quality impact significance criteria for road schemes. The degree of impact is determined based on both the absolute and relative impact of the Proposed Project. The TII significance criteria have been adopted for the Proposed Project and are detailed in Table 7.2 to Table 7.4. The significance criteria are based on PM10 / PM2.5 and NO2 as these pollutants are most likely to exceed the annual mean limit values (40 µg/m3).
Dublin City Council College Green Project EIAR Chapter 7- Air Quality and Climate Factors
Rev 1 | Issue | October 2017 | Arup \\GLOBAL\EUROPE\DUBLIN\JOBS\252000\252740-00\4. INTERNAL\4-03 DESIGN\4-03-02 CONSULTING\FI\RESPONSES\Q1\EIAR\CHPT. 7 AIR QUALITY AND CLIMATE FACTORS\CHPT 7 AIR CLIMATE_ISSUE_OCTOBER_2017_FINAL.DOCX
Chp 7-4
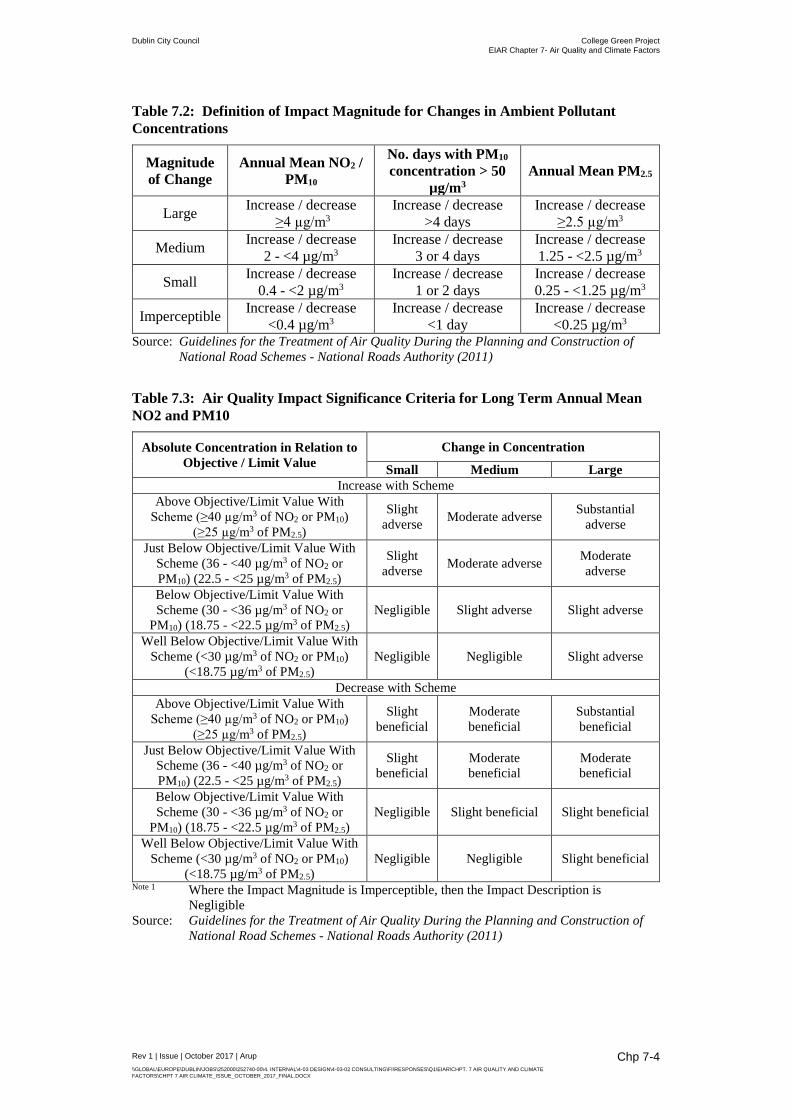
Table 7.2: Definition of Impact Magnitude for Changes in Ambient Pollutant Concentrations
Magnitude of Change
Annual Mean NO2 / PM10
No. days with PM10
concentration > 50 µg/m3
Annual Mean PM2.5
Large Increase / decrease ≥4 µg/m3
Increase / decrease >4 days
Increase / decrease ≥2.5 µg/m3
Medium Increase / decrease 2 - <4 µg/m3
Increase / decrease 3 or 4 days
Increase / decrease 1.25 - <2.5 µg/m3
Small Increase / decrease 0.4 - <2 µg/m3
Increase / decrease 1 or 2 days
Increase / decrease 0.25 - <1.25 µg/m3
Imperceptible Increase / decrease <0.4 µg/m3
Increase / decrease <1 day
Increase / decrease <0.25 µg/m3
Source: Guidelines for the Treatment of Air Quality During the Planning and Construction of National Road Schemes - National Roads Authority (2011)
Table 7.3: Air Quality Impact Significance Criteria for Long Term Annual Mean NO2 and PM10
Absolute Concentration in Relation to Objective / Limit Value
Change in Concentration
Small Medium Large Increase with Scheme
Above Objective/Limit Value With Scheme (≥40 µg/m3 of NO2 or PM10)
(≥25 µg/m3 of PM2.5)
Slight adverse Moderate adverse Substantial
adverse
Just Below Objective/Limit Value With Scheme (36 - <40 µg/m3 of NO2 or PM10) (22.5 - <25 µg/m3 of PM2.5)
Slight adverse Moderate adverse Moderate
adverse
Below Objective/Limit Value With Scheme (30 - <36 µg/m3 of NO2 or
PM10) (18.75 - <22.5 µg/m3 of PM2.5) Negligible Slight adverse Slight adverse
Well Below Objective/Limit Value With Scheme (<30 µg/m3 of NO2 or PM10)
(<18.75 µg/m3 of PM2.5) Negligible Negligible Slight adverse
Decrease with Scheme Above Objective/Limit Value With
Scheme (≥40 µg/m3 of NO2 or PM10) (≥25 µg/m3 of PM2.5)
Slight beneficial
Moderate beneficial
Substantial beneficial
Just Below Objective/Limit Value With Scheme (36 - <40 µg/m3 of NO2 or PM10) (22.5 - <25 µg/m3 of PM2.5)
Slight beneficial
Moderate beneficial
Moderate beneficial
Below Objective/Limit Value With Scheme (30 - <36 µg/m3 of NO2 or
PM10) (18.75 - <22.5 µg/m3 of PM2.5) Negligible Slight beneficial Slight beneficial
Well Below Objective/Limit Value With Scheme (<30 µg/m3 of NO2 or PM10)
(<18.75 µg/m3 of PM2.5) Negligible Negligible Slight beneficial
Note 1 Where the Impact Magnitude is Imperceptible, then the Impact Description is Negligible
Source: Guidelines for the Treatment of Air Quality During the Planning and Construction of National Road Schemes - National Roads Authority (2011)
Dublin City Council College Green Project EIAR Chapter 7- Air Quality and Climate Factors
Rev 1 | Issue | October 2017 | Arup \\GLOBAL\EUROPE\DUBLIN\JOBS\252000\252740-00\4. INTERNAL\4-03 DESIGN\4-03-02 CONSULTING\FI\RESPONSES\Q1\EIAR\CHPT. 7 AIR QUALITY AND CLIMATE FACTORS\CHPT 7 AIR CLIMATE_ISSUE_OCTOBER_2017_FINAL.DOCX
Chp 7-5
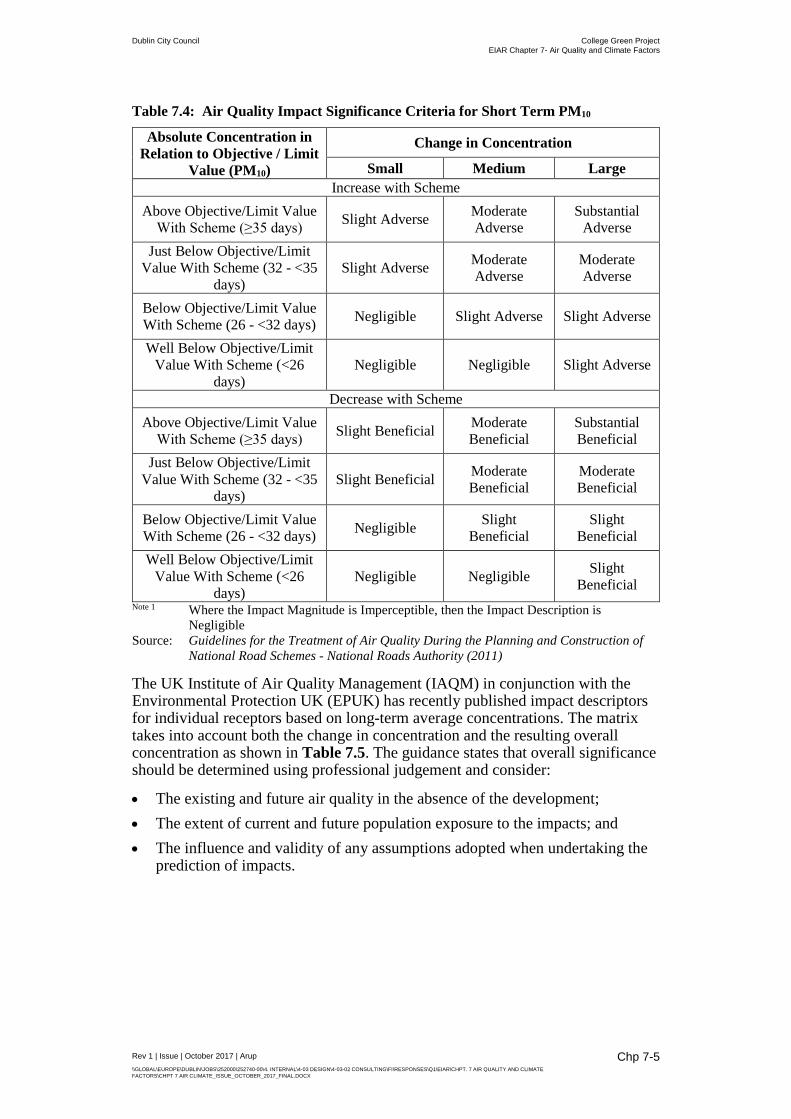
Table 7.4: Air Quality Impact Significance Criteria for Short Term PM10
Absolute Concentration in Relation to Objective / Limit
Value (PM10)
Change in Concentration
Small Medium Large Increase with Scheme
Above Objective/Limit Value With Scheme (≥35 days) Slight Adverse Moderate
Adverse Substantial
Adverse Just Below Objective/Limit
Value With Scheme (32 - <35 days)
Slight Adverse Moderate Adverse
Moderate Adverse
Below Objective/Limit Value With Scheme (26 - <32 days) Negligible Slight Adverse Slight Adverse
Well Below Objective/Limit Value With Scheme (<26
days) Negligible Negligible Slight Adverse
Decrease with Scheme Above Objective/Limit Value
With Scheme (≥35 days) Slight Beneficial Moderate Beneficial
Substantial Beneficial
Just Below Objective/Limit Value With Scheme (32 - <35
days) Slight Beneficial Moderate
Beneficial Moderate Beneficial
Below Objective/Limit Value With Scheme (26 - <32 days) Negligible Slight
Beneficial Slight
Beneficial Well Below Objective/Limit
Value With Scheme (<26 days)
Negligible Negligible Slight Beneficial
Note 1 Where the Impact Magnitude is Imperceptible, then the Impact Description is Negligible
Source: Guidelines for the Treatment of Air Quality During the Planning and Construction of National Road Schemes - National Roads Authority (2011)
The UK Institute of Air Quality Management (IAQM) in conjunction with the Environmental Protection UK (EPUK) has recently published impact descriptors for individual receptors based on long-term average concentrations. The matrix takes into account both the change in concentration and the resulting overall concentration as shown in Table 7.5. The guidance states that overall significance should be determined using professional judgement and consider:
• The existing and future air quality in the absence of the development; • The extent of current and future population exposure to the impacts; and • The influence and validity of any assumptions adopted when undertaking the
prediction of impacts.
Dublin City Council College Green Project EIAR Chapter 7- Air Quality and Climate Factors
Rev 1 | Issue | October 2017 | Arup \\GLOBAL\EUROPE\DUBLIN\JOBS\252000\252740-00\4. INTERNAL\4-03 DESIGN\4-03-02 CONSULTING\FI\RESPONSES\Q1\EIAR\CHPT. 7 AIR QUALITY AND CLIMATE FACTORS\CHPT 7 AIR CLIMATE_ISSUE_OCTOBER_2017_FINAL.DOCX
Chp 7-6
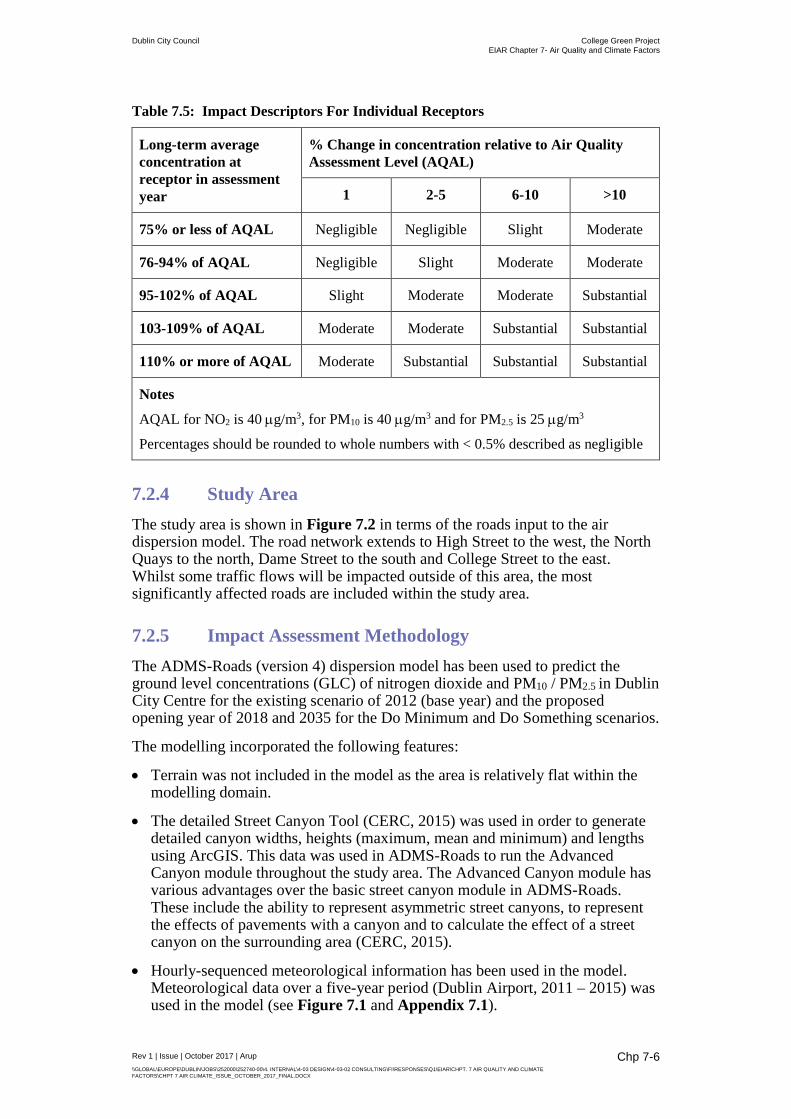
Table 7.5: Impact Descriptors For Individual Receptors
Long-term average concentration at receptor in assessment year
% Change in concentration relative to Air Quality Assessment Level (AQAL)
1 2-5 6-10 >10
75% or less of AQAL Negligible Negligible Slight Moderate
76-94% of AQAL Negligible Slight Moderate Moderate
95-102% of AQAL Slight Moderate Moderate Substantial
103-109% of AQAL Moderate Moderate Substantial Substantial
110% or more of AQAL Moderate Substantial Substantial Substantial
Notes
AQAL for NO2 is 40 µg/m3, for PM10 is 40 µg/m3 and for PM2.5 is 25 µg/m3
Percentages should be rounded to whole numbers with < 0.5% described as negligible
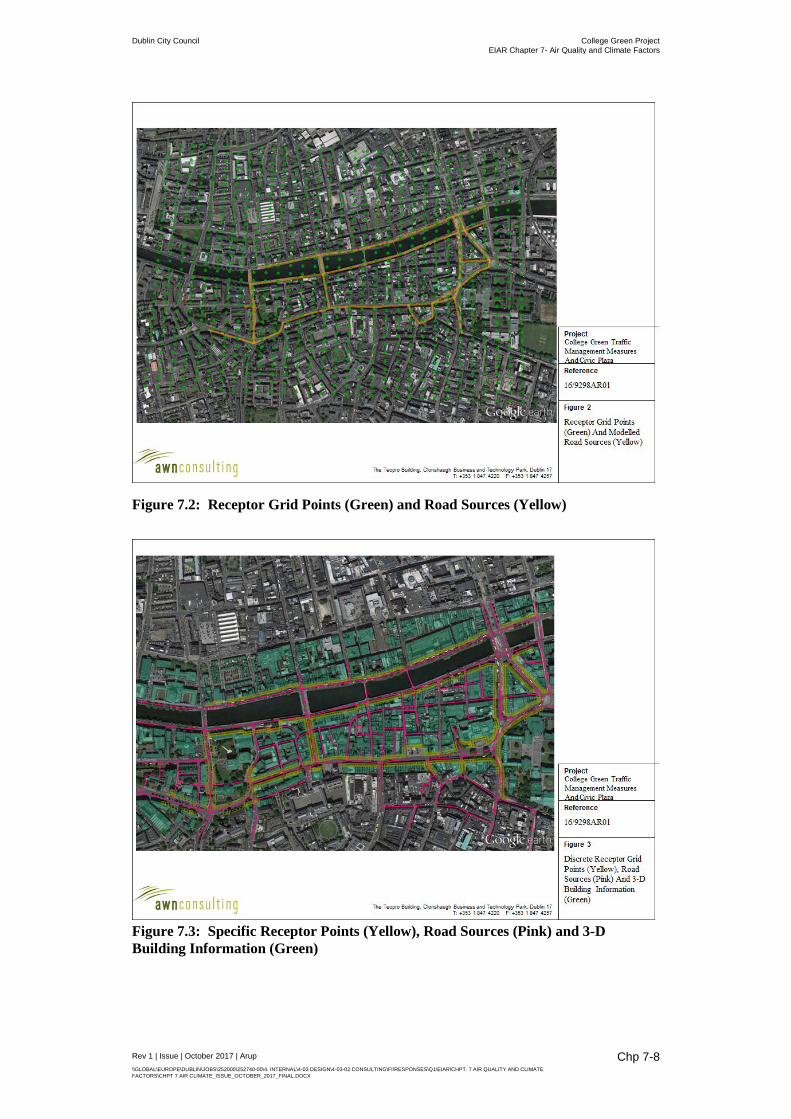
7.2.4 Study Area The study area is shown in Figure 7.2 in terms of the roads input to the air dispersion model. The road network extends to High Street to the west, the North Quays to the north, Dame Street to the south and College Street to the east. Whilst some traffic flows will be impacted outside of this area, the most significantly affected roads are included within the study area.
7.2.5 Impact Assessment Methodology The ADMS-Roads (version 4) dispersion model has been used to predict the ground level concentrations (GLC) of nitrogen dioxide and PM10 / PM2.5 in Dublin City Centre for the existing scenario of 2012 (base year) and the proposed opening year of 2018 and 2035 for the Do Minimum and Do Something scenarios.
The modelling incorporated the following features:
• Terrain was not included in the model as the area is relatively flat within the modelling domain.
• The detailed Street Canyon Tool (CERC, 2015) was used in order to generate detailed canyon widths, heights (maximum, mean and minimum) and lengths using ArcGIS. This data was used in ADMS-Roads to run the Advanced Canyon module throughout the study area. The Advanced Canyon module has various advantages over the basic street canyon module in ADMS-Roads. These include the ability to represent asymmetric street canyons, to represent the effects of pavements with a canyon and to calculate the effect of a street canyon on the surrounding area (CERC, 2015).
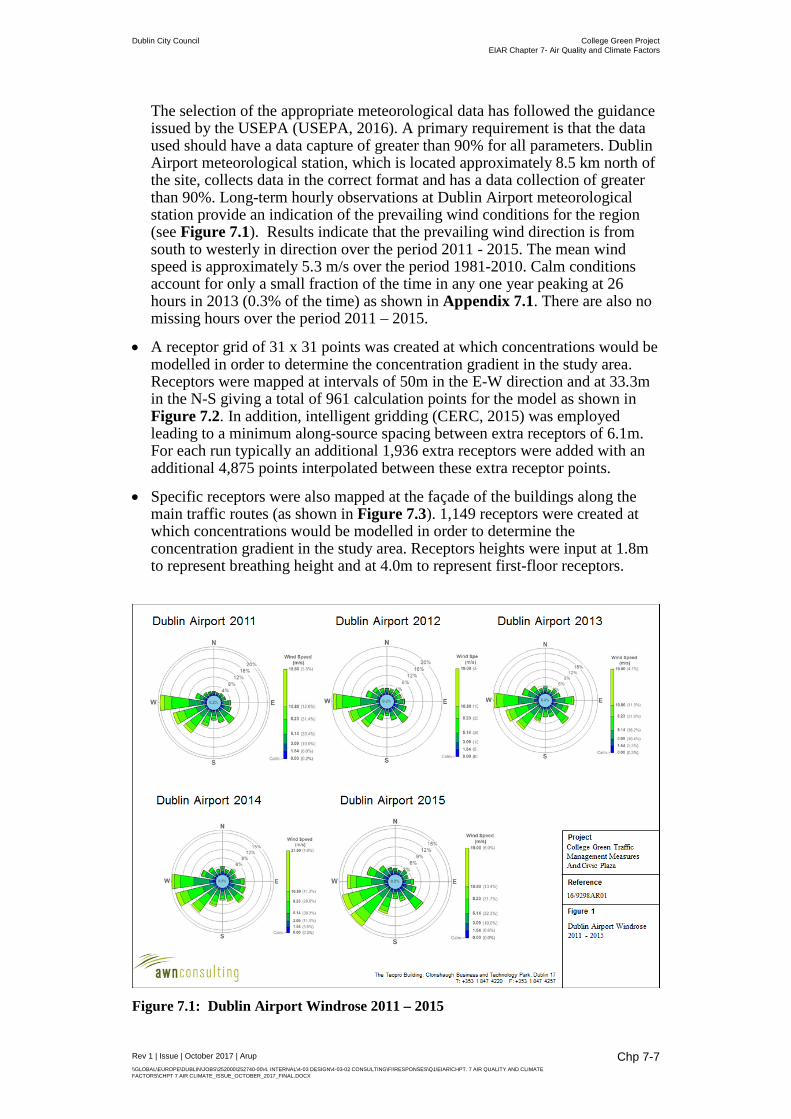
• Hourly-sequenced meteorological information has been used in the model. Meteorological data over a five-year period (Dublin Airport, 2011 – 2015) was used in the model (see Figure 7.1 and Appendix 7.1).
Dublin City Council College Green Project EIAR Chapter 7- Air Quality and Climate Factors
Rev 1 | Issue | October 2017 | Arup \\GLOBAL\EUROPE\DUBLIN\JOBS\252000\252740-00\4. INTERNAL\4-03 DESIGN\4-03-02 CONSULTING\FI\RESPONSES\Q1\EIAR\CHPT. 7 AIR QUALITY AND CLIMATE FACTORS\CHPT 7 AIR CLIMATE_ISSUE_OCTOBER_2017_FINAL.DOCX
Chp 7-7
The selection of the appropriate meteorological data has followed the guidance issued by the USEPA (USEPA, 2016). A primary requirement is that the data used should have a data capture of greater than 90% for all parameters. Dublin Airport meteorological station, which is located approximately 8.5 km north of the site, collects data in the correct format and has a data collection of greater than 90%. Long-term hourly observations at Dublin Airport meteorological station provide an indication of the prevailing wind conditions for the region (see Figure 7.1). Results indicate that the prevailing wind direction is from south to westerly in direction over the period 2011 - 2015. The mean wind speed is approximately 5.3 m/s over the period 1981-2010. Calm conditions account for only a small fraction of the time in any one year peaking at 26 hours in 2013 (0.3% of the time) as shown in Appendix 7.1. There are also no missing hours over the period 2011 – 2015.
• A receptor grid of 31 x 31 points was created at which concentrations would be modelled in order to determine the concentration gradient in the study area. Receptors were mapped at intervals of 50m in the E-W direction and at 33.3m in the N-S giving a total of 961 calculation points for the model as shown in Figure 7.2. In addition, intelligent gridding (CERC, 2015) was employed leading to a minimum along-source spacing between extra receptors of 6.1m. For each run typically an additional 1,936 extra receptors were added with an additional 4,875 points interpolated between these extra receptor points.
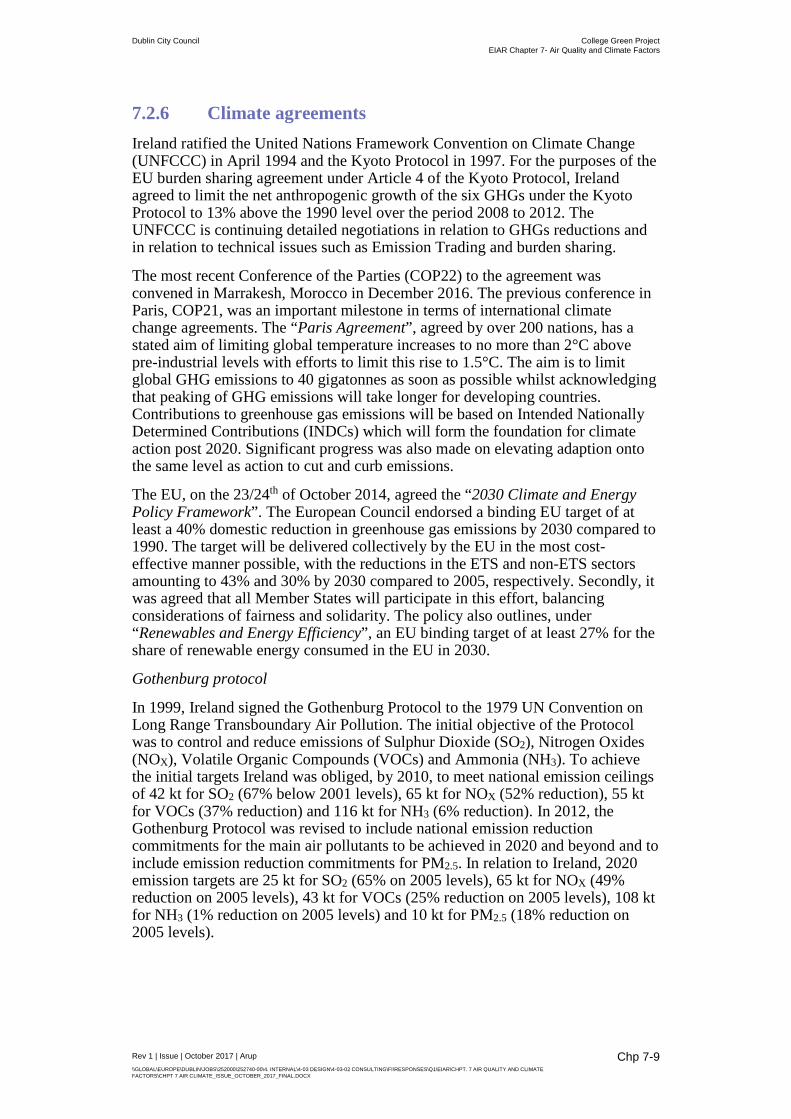
• Specific receptors were also mapped at the façade of the buildings along the main traffic routes (as shown in Figure 7.3). 1,149 receptors were created at which concentrations would be modelled in order to determine the concentration gradient in the study area. Receptors heights were input at 1.8m to represent breathing height and at 4.0m to represent first-floor receptors.
Figure 7.1: Dublin Airport Windrose 2011 – 2015
Dublin City Council College Green Project EIAR Chapter 7- Air Quality and Climate Factors
Rev 1 | Issue | October 2017 | Arup \\GLOBAL\EUROPE\DUBLIN\JOBS\252000\252740-00\4. INTERNAL\4-03 DESIGN\4-03-02 CONSULTING\FI\RESPONSES\Q1\EIAR\CHPT. 7 AIR QUALITY AND CLIMATE FACTORS\CHPT 7 AIR CLIMATE_ISSUE_OCTOBER_2017_FINAL.DOCX
Chp 7-8
Figure 7.2: Receptor Grid Points (Green) and Road Sources (Yellow)
Figure 7.3: Specific Receptor Points (Yellow), Road Sources (Pink) and 3-D Building Information (Green)
Dublin City Council College Green Project EIAR Chapter 7- Air Quality and Climate Factors
Rev 1 | Issue | October 2017 | Arup \\GLOBAL\EUROPE\DUBLIN\JOBS\252000\252740-00\4. INTERNAL\4-03 DESIGN\4-03-02 CONSULTING\FI\RESPONSES\Q1\EIAR\CHPT. 7 AIR QUALITY AND CLIMATE FACTORS\CHPT 7 AIR CLIMATE_ISSUE_OCTOBER_2017_FINAL.DOCX
Chp 7-9
7.2.6 Climate agreements Ireland ratified the United Nations Framework Convention on Climate Change (UNFCCC) in April 1994 and the Kyoto Protocol in 1997. For the purposes of the EU burden sharing agreement under Article 4 of the Kyoto Protocol, Ireland agreed to limit the net anthropogenic growth of the six GHGs under the Kyoto Protocol to 13% above the 1990 level over the period 2008 to 2012. The UNFCCC is continuing detailed negotiations in relation to GHGs reductions and in relation to technical issues such as Emission Trading and burden sharing.
The most recent Conference of the Parties (COP22) to the agreement was convened in Marrakesh, Morocco in December 2016. The previous conference in Paris, COP21, was an important milestone in terms of international climate change agreements. The “Paris Agreement”, agreed by over 200 nations, has a stated aim of limiting global temperature increases to no more than 2°C above pre-industrial levels with efforts to limit this rise to 1.5°C. The aim is to limit global GHG emissions to 40 gigatonnes as soon as possible whilst acknowledging that peaking of GHG emissions will take longer for developing countries. Contributions to greenhouse gas emissions will be based on Intended Nationally Determined Contributions (INDCs) which will form the foundation for climate action post 2020. Significant progress was also made on elevating adaption onto the same level as action to cut and curb emissions.
The EU, on the 23/24th of October 2014, agreed the “2030 Climate and Energy Policy Framework”. The European Council endorsed a binding EU target of at least a 40% domestic reduction in greenhouse gas emissions by 2030 compared to 1990. The target will be delivered collectively by the EU in the most cost-effective manner possible, with the reductions in the ETS and non-ETS sectors amounting to 43% and 30% by 2030 compared to 2005, respectively. Secondly, it was agreed that all Member States will participate in this effort, balancing considerations of fairness and solidarity. The policy also outlines, under “Renewables and Energy Efficiency”, an EU binding target of at least 27% for the share of renewable energy consumed in the EU in 2030.
Gothenburg protocol
In 1999, Ireland signed the Gothenburg Protocol to the 1979 UN Convention on Long Range Transboundary Air Pollution. The initial objective of the Protocol was to control and reduce emissions of Sulphur Dioxide (SO2), Nitrogen Oxides (NOX), Volatile Organic Compounds (VOCs) and Ammonia (NH3). To achieve the initial targets Ireland was obliged, by 2010, to meet national emission ceilings of 42 kt for SO2 (67% below 2001 levels), 65 kt for NOX (52% reduction), 55 kt for VOCs (37% reduction) and 116 kt for NH3 (6% reduction). In 2012, the Gothenburg Protocol was revised to include national emission reduction commitments for the main air pollutants to be achieved in 2020 and beyond and to include emission reduction commitments for PM2.5. In relation to Ireland, 2020 emission targets are 25 kt for SO2 (65% on 2005 levels), 65 kt for NOX (49% reduction on 2005 levels), 43 kt for VOCs (25% reduction on 2005 levels), 108 kt for NH3 (1% reduction on 2005 levels) and 10 kt for PM2.5 (18% reduction on 2005 levels).
Dublin City Council College Green Project EIAR Chapter 7- Air Quality and Climate Factors
Rev 1 | Issue | October 2017 | Arup \\GLOBAL\EUROPE\DUBLIN\JOBS\252000\252740-00\4. INTERNAL\4-03 DESIGN\4-03-02 CONSULTING\FI\RESPONSES\Q1\EIAR\CHPT. 7 AIR QUALITY AND CLIMATE FACTORS\CHPT 7 AIR CLIMATE_ISSUE_OCTOBER_2017_FINAL.DOCX
Chp 7-10
European Commission Directive 2001/81/EC, the National Emissions Ceiling Directive (NECD), prescribes the same emission limits as the 1999 Gothenburg Protocol. A National Programme for the progressive reduction of emissions of these four transboundary pollutants has been in place since April 2005. Data available from the EU in 2010 indicated that Ireland complied with the emissions ceilings for SO2, VOCs and NH3 but failed to comply with the ceiling for NOX. Directive (EU) 2016/2284 “On the Reduction of National Emissions of Certain Atmospheric Pollutants and Amending Directive 2003/35/EC and Repealing Directive 2001/81/EC” was published in December 2016. The Directive will apply the 2010 NECD limits until 2020 and establish new national emission reduction commitments which will be applicable from 2020 and 2030 for SO2, NOX, NMVOC, NH3 and PM2.5. In relation to Ireland, 2020-29 emission targets are for SO2 (65% below 2005 levels), for NOX (49% reduction), for VOCs (25% reduction), for NH3 (1% reduction) and for PM2.5 (18% reduction). In relation to 2030, Ireland’s emission targets are for SO2 (85% below 2005 levels), for NOX (69% reduction), for VOCs (32% reduction), for NH3 (5% reduction) and for PM2.5 (41% reduction).
7.3 Baseline Environment Air quality monitoring programs have been undertaken in recent years by the EPA and Local Authorities. The most recent annual report on air quality “Air Quality Monitoring Annual Report 2015” (EPA, 2016), details the range and scope of monitoring undertaken throughout Ireland. As part of the implementation of the Framework Directive on Air Quality (1996/62/EC), four air quality zones have been defined in Ireland for air quality management and assessment purposes. Dublin is defined as Zone A and Cork as Zone B. Zone C is composed of 23 towns with a population of greater than 15,000. The remainder of the country, which represents rural Ireland but also includes all towns with a population of less than 15,000 is defined as Zone D. In terms of air monitoring, Dublin City Centre is categorised as Zone A.
Background air quality is the air quality at a specific location when the local emissions of air quality have been subtracted from the measured air quality. Thus, a “background” air concentration is usually representative of a wider area (such as an urban area or sub-urban area). Baseline air quality is the current air quality at a specific location including all local and non-local sources. In order to obtain a “background” concentration from a specific measurement location, it is necessary to subtract the local sources of air emissions.
There are currently three urban monitoring stations in Dublin – Rathmines (urban background), Winetavern Street (urban traffic) and Coleraine Street (urban traffic). In contrast to Winetavern Street and Coleraine Street, Rathmines is an urban background station being a significant distance (65 m) from the nearest major road centreline (Rathmines Road) and thus is the most suitable station for use as a background station in deriving local air quality.
The ambient NO2 monitoring results for Winetavern Street, Coleraine Street and Rathmines over the period 2010 - 2015, based on a three year rolling average, are shown in Figure 7.4. The data and trend line indicates that levels are slowly decreasing at each location due to a combination of improvements in engine technology, vehicle turnover and possibly changes in traffic levels at each location. Year-on-year data over the period 2010 – 2015 is shown in Table 7.6.
Dublin City Council College Green Project EIAR Chapter 7- Air Quality and Climate Factors
Rev 1 | Issue | October 2017 | Arup \\GLOBAL\EUROPE\DUBLIN\JOBS\252000\252740-00\4. INTERNAL\4-03 DESIGN\4-03-02 CONSULTING\FI\RESPONSES\Q1\EIAR\CHPT. 7 AIR QUALITY AND CLIMATE FACTORS\CHPT 7 AIR CLIMATE_ISSUE_OCTOBER_2017_FINAL.DOCX
Chp 7-11
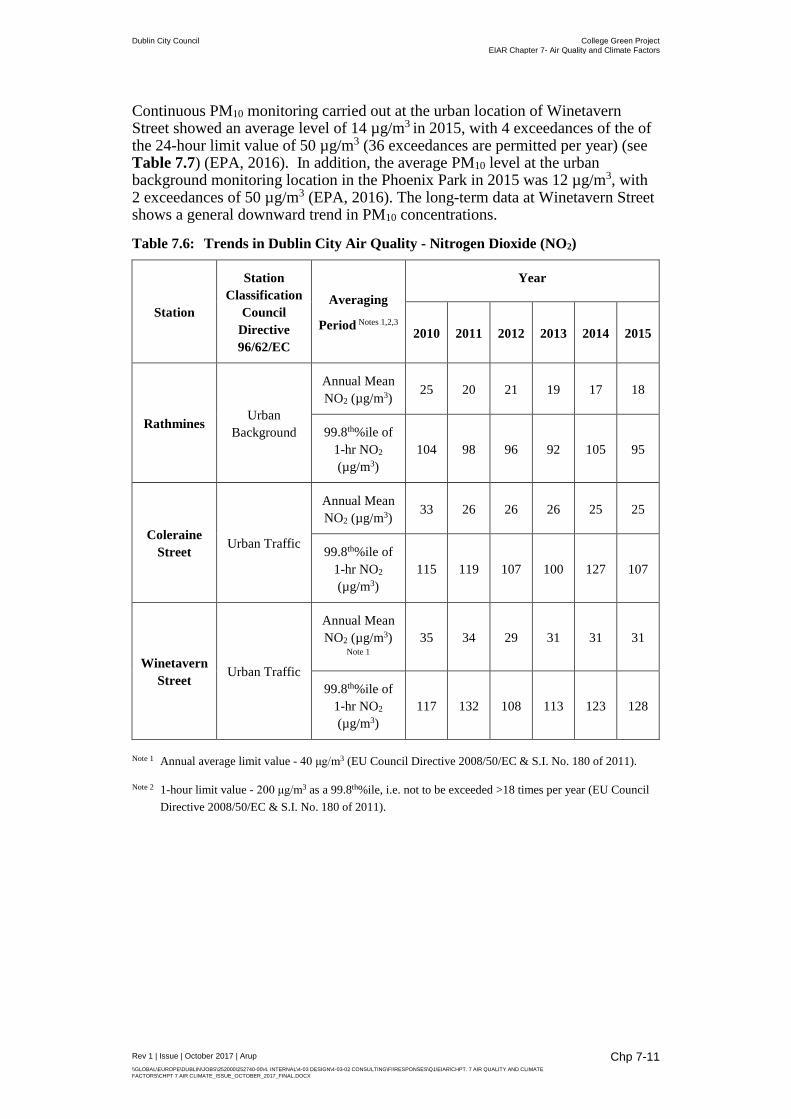
Continuous PM10 monitoring carried out at the urban location of Winetavern Street showed an average level of 14 µg/m3 in 2015, with 4 exceedances of the of the 24-hour limit value of 50 µg/m3 (36 exceedances are permitted per year) (see Table 7.7) (EPA, 2016). In addition, the average PM10 level at the urban background monitoring location in the Phoenix Park in 2015 was 12 µg/m3, with 2 exceedances of 50 µg/m3 (EPA, 2016). The long-term data at Winetavern Street shows a general downward trend in PM10 concentrations.
Table 7.6: Trends in Dublin City Air Quality - Nitrogen Dioxide (NO2)
Station
Station Classification
Council Directive 96/62/EC
Averaging
Period Notes 1,2,3
Year
2010 2011 2012 2013 2014 2015
Rathmines Urban Background
Annual Mean NO2 (µg/m3) 25 20 21 19 17 18
99.8th%ile of 1-hr NO2 (µg/m3)
104 98 96 92 105 95
Coleraine Street Urban Traffic
Annual Mean NO2 (µg/m3) 33 26 26 26 25 25
99.8th%ile of 1-hr NO2 (µg/m3)
115 119 107 100 127 107
Winetavern Street
Urban Traffic
Annual Mean NO2 (µg/m3)
Note 1 35 34 29 31 31 31
99.8th%ile of 1-hr NO2 (µg/m3)
117 132 108 113 123 128
Note 1 Annual average limit value - 40 μg/m3 (EU Council Directive 2008/50/EC & S.I. No. 180 of 2011).
Note 2 1-hour limit value - 200 μg/m3 as a 99.8th%ile, i.e. not to be exceeded >18 times per year (EU Council Directive 2008/50/EC & S.I. No. 180 of 2011).

Dublin City Council College Green Project EIAR Chapter 7- Air Quality and Climate Factors
Rev 1 | Issue | October 2017 | Arup \\GLOBAL\EUROPE\DUBLIN\JOBS\252000\252740-00\4. INTERNAL\4-03 DESIGN\4-03-02 CONSULTING\FI\RESPONSES\Q1\EIAR\CHPT. 7 AIR QUALITY AND CLIMATE FACTORS\CHPT 7 AIR CLIMATE_ISSUE_OCTOBER_2017_FINAL.DOCX
Chp 7-12
Figure 7.4: Rolling 3-Year Annual NO2 Concentration (µg/m3) With Trendlines
Table 7.7: Trends In Dublin City Air Quality – PM10
Station Station Classification
Averaging
Period Notes 1,2
Year
2010 2011 2012 2013 2014 2015
Rathmines Urban
Background
Annual Mean (µg/m3) 18 16 14 17 14 15
24-hr Mean > 50 μg/m3 (days) 5 10 2 8 3 5
Winetavern Street Urban Traffic
Annual Mean PM10 (µg/m3) 19 14 13 14 14 14
24-hr Mean > 50 μg/m3 (days) 7 7 0 3 1 4
Phoenix Park
Suburban Background
Annual Mean PM10 (µg/m3)
11 12 11 14 12 12
24-hr Mean > 50 μg/m3 (days) 1 3 0 3 0 2
Note 1 Annual average limit value - 40 μg/m3 (EU Council Directive 2008/50/EC & S.I. No. 180 of 2011). Note 2 24-hour limit value - 50 μg/m3 as a 90.4th%ile, i.e. not to be exceeded >35 times per year (EU Council Directive
1999/30/EC & S.I. No. 180 of 2011). Continuous PM2.5 monitoring carried out at the Zone A urban location of Coleraine Street showed an average level of 9 µg/m3 in both 2014 and 2015.
Dublin City Council College Green Project EIAR Chapter 7- Air Quality and Climate Factors
Rev 1 | Issue | October 2017 | Arup \\GLOBAL\EUROPE\DUBLIN\JOBS\252000\252740-00\4. INTERNAL\4-03 DESIGN\4-03-02 CONSULTING\FI\RESPONSES\Q1\EIAR\CHPT. 7 AIR QUALITY AND CLIMATE FACTORS\CHPT 7 AIR CLIMATE_ISSUE_OCTOBER_2017_FINAL.DOCX
Chp 7-13
The annual average level measured in Rathmines in 2014 and 2015 was 9 µg/m3
and 10 µg/m3 respectively. Based on this information, the ratio of PM2.5 to PM10 is estimated to be in the region of 0.65 – 0.70 with a representative background concentration of 9 µg/m3 estimated for the study area in 2018.
Road Traffic Emission Rates
Road traffic emission rates were derived from the COPERT IV database (Version 11.3 updated June 2015) which have been incorporated into the UK DEFRA Emission Factor Toolkit (EFT) Version 7.0 (released August 2016). COPERT 4v11 reflects more recent evidence on real-world emission performance of Euro 5 and 6 vehicles.
The EFT version 7.0 has been incorporated into ADMS-Roads dated August 2016. The toolkit provides emission rates from 2013 – 2030 and is based on the following sources of data:
• Fleet composition data for urban Northern Ireland; • EFT Version 7.0 was based on eight vehicle categories including petrol cars,
diesel cars, diesel LGV, rigid HGVs and buses; • Version 7.0 incorporates updated NOX and PM speed emission coefficient
equations for Euro 5 and 6 vehicles, taken from the European Environment Agency (EEA) COPERT 4 Version 11 emission calculation tool which reflects the most recent evidence on the real-world emission performance of these vehicles;
• Fleet composition based on European emission standards from pre-Euro 1 to Euro 6/VI;
• Scaling factors reflecting improvements in the quality of fuel and some degree of retrofitting; and
• Technology conversion in the national fleet.
As the urban fleet composition data for Northern Ireland has been used in the model (in the absence of the ability to use Republic Of Ireland data in ADMS-Roads), a comparison between the age profile of petrol and diesel cars, LGV, Rigid HGV and buses was undertaken based on a review of the Irish Bulletin of Vehicle & Driver Statistics (DOTTS, 2015) and Northern Ireland age profile which is embedded in the EFT Version 7.0 spreadsheet. The emission factor results show some variation in age profile between the fleets depending on vehicle type. However, the resultant composite NOX emission rate was similar along Parliament Street using both Northern Ireland defaults and the actual age profile of the Irish fleet for each type of vehicle.
Validation Study – Year 2012 Traffic Data
A validation study was undertaken based on the traffic data for the study area from the NTA traffic model for year 2012. The study compared the ambient NO2 monitored concentration on Winetavern Street with the ADMS-Roads model output for every hour of the year.
Background data was based on nitrogen oxide (NO), NO2 and ozone (O3) data from Rathmines for 2012. Rathmines was selected as the background station as it is a suburban / urban background ambient air monitoring station near Dublin City Centre. One additional urban traffic station is situated in the city centre,

Dublin City Council College Green Project EIAR Chapter 7- Air Quality and Climate Factors
Rev 1 | Issue | October 2017 | Arup \\GLOBAL\EUROPE\DUBLIN\JOBS\252000\252740-00\4. INTERNAL\4-03 DESIGN\4-03-02 CONSULTING\FI\RESPONSES\Q1\EIAR\CHPT. 7 AIR QUALITY AND CLIMATE FACTORS\CHPT 7 AIR CLIMATE_ISSUE_OCTOBER_2017_FINAL.DOCX
Chp 7-14
Coleraine Street, but is subject to significant local traffic and thus is unsuitable for use as a background station.
The emission data for the ADMS-Roads model was based on EFT Version 6.1 rather than EFT Version 7.0 which was used for the DM and DS scenarios in 2018. This selection was necessary as the EFT Version 7.0 only models the years 2013 – 2030.
As a sensitivity study, EFT Version 7.0 for 2013 was used also within the model with 2012 traffic and background input data. Results were found to be very similar using both sets of emission rates as outlined in Table 7.8.
An average traffic speed was selected for the study area based on the output from the NTA traffic model. The network average within the study area for both the 2018 DM and DS scenarios over the AM Peak, PM Peak and off-peak periods was approximately 20 km/hr. Levels along Parliament Street were a little lower averaging around 15 km/hr and thus 15 km/hr was selected for the study area as a conservative approach.
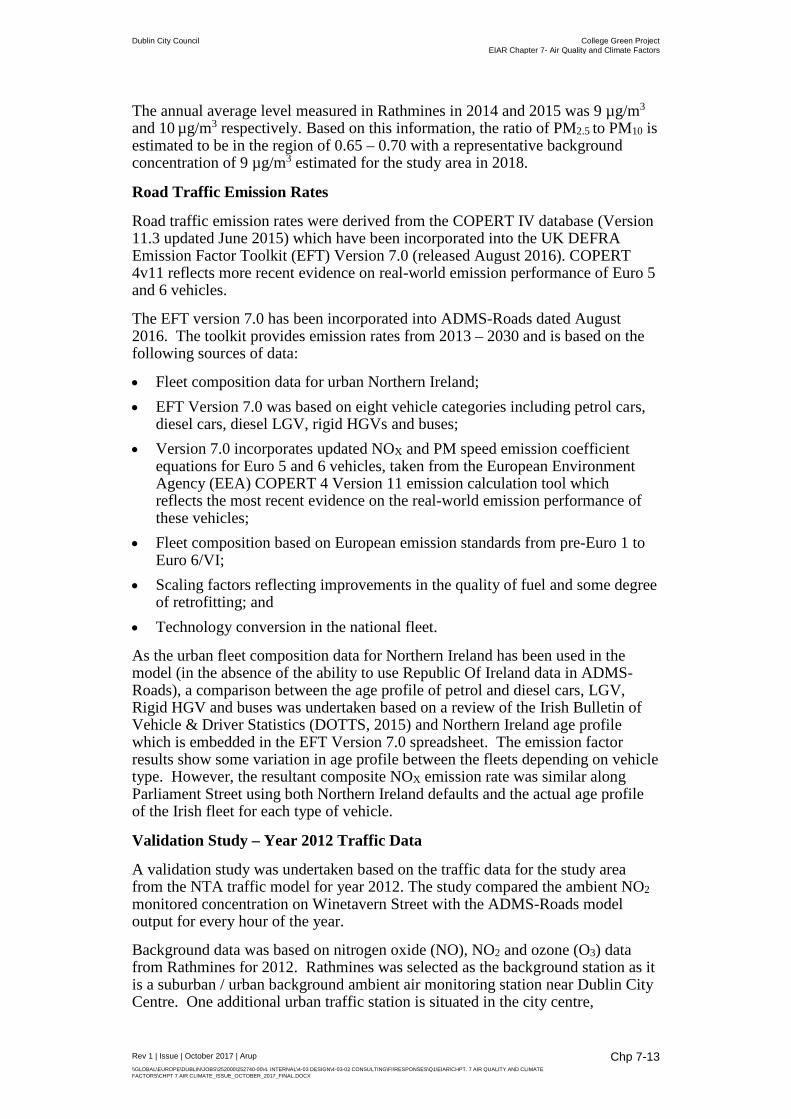
As shown in Figure 7.5, results of the quantile-quantile (Q-Q) plot for 2012, based on EFT Version 6.1, give good agreement particularly at the higher values with the modelled results tending to slightly overestimate the observed (monitored) results. Q-Q plots are created by sorting from highest to lowest the predicted and the observed concentrations which are initially paired in time and space. After sorting, the concentration pairs are no longer paired in time or location (EPA, 2010). This approach is useful in confirming whether the model can reproduce the highest recorded concentration over the course of a year rather than trying to confirm an actual concentration paired in time and space. This much more difficult test, due to inaccuracies in wind speed / direction, result in Gaussian plume models typically performing badly.
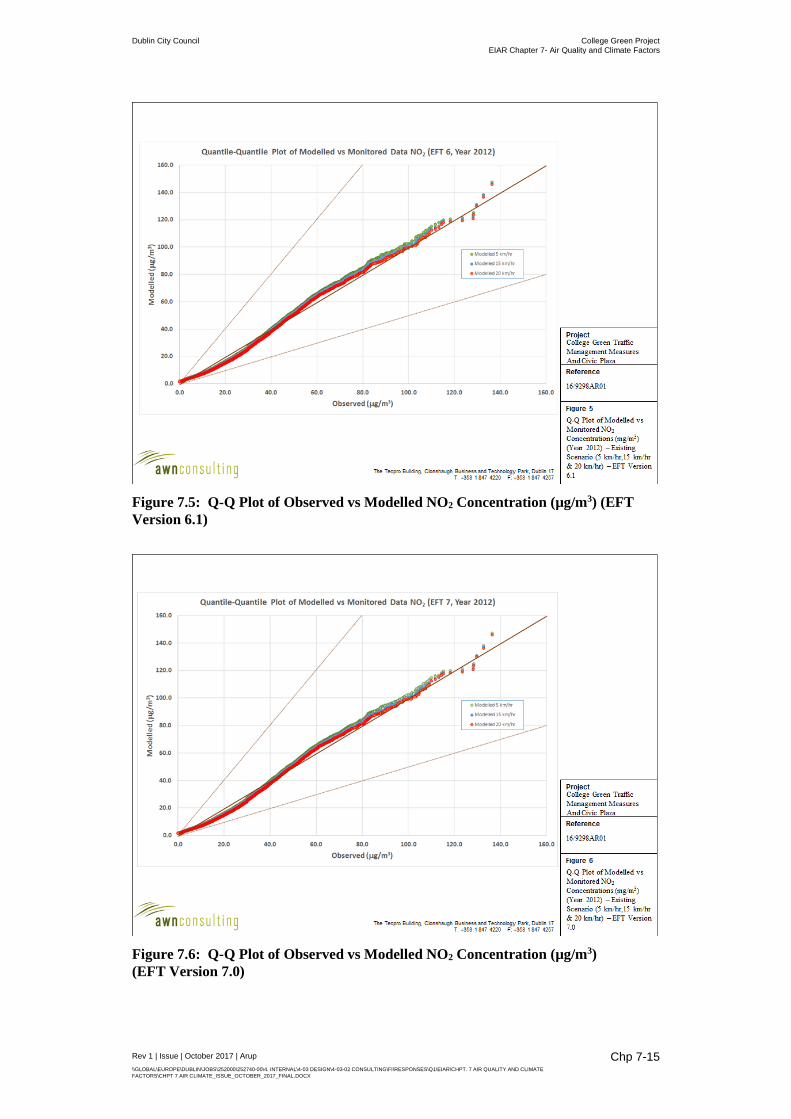
Comparing the Q-Q results when modelling different average speeds over the range 5 – 20 km/hr indicates that higher speeds lead to slightly lower concentrations along Winetavern Street as would be expected from a review of the relevant emission factors for the three average speeds investigated. Both 15 km/hr and 20 km/hr give better agreement with the measured levels than 5 km/hr, which agrees with the outputs from the NTA TRAFFIC model in relation to network traffic speeds. A comparison with the EFT Version 7.0 emission rates (based on an assessment year of 2013) also agrees quite well with monitoring data and is also in good agreement with the EFT Version 6.1 emission rates as shown in Figure 7.6.
Dublin City Council College Green Project EIAR Chapter 7- Air Quality and Climate Factors
Rev 1 | Issue | October 2017 | Arup \\GLOBAL\EUROPE\DUBLIN\JOBS\252000\252740-00\4. INTERNAL\4-03 DESIGN\4-03-02 CONSULTING\FI\RESPONSES\Q1\EIAR\CHPT. 7 AIR QUALITY AND CLIMATE FACTORS\CHPT 7 AIR CLIMATE_ISSUE_OCTOBER_2017_FINAL.DOCX
Chp 7-15
Figure 7.5: Q-Q Plot of Observed vs Modelled NO2 Concentration (µg/m3) (EFT Version 6.1)
Figure 7.6: Q-Q Plot of Observed vs Modelled NO2 Concentration (µg/m3) (EFT Version 7.0)
Dublin City Council College Green Project EIAR Chapter 7- Air Quality and Climate Factors
Rev 1 | Issue | October 2017 | Arup \\GLOBAL\EUROPE\DUBLIN\JOBS\252000\252740-00\4. INTERNAL\4-03 DESIGN\4-03-02 CONSULTING\FI\RESPONSES\Q1\EIAR\CHPT. 7 AIR QUALITY AND CLIMATE FACTORS\CHPT 7 AIR CLIMATE_ISSUE_OCTOBER_2017_FINAL.DOCX
Chp 7-16
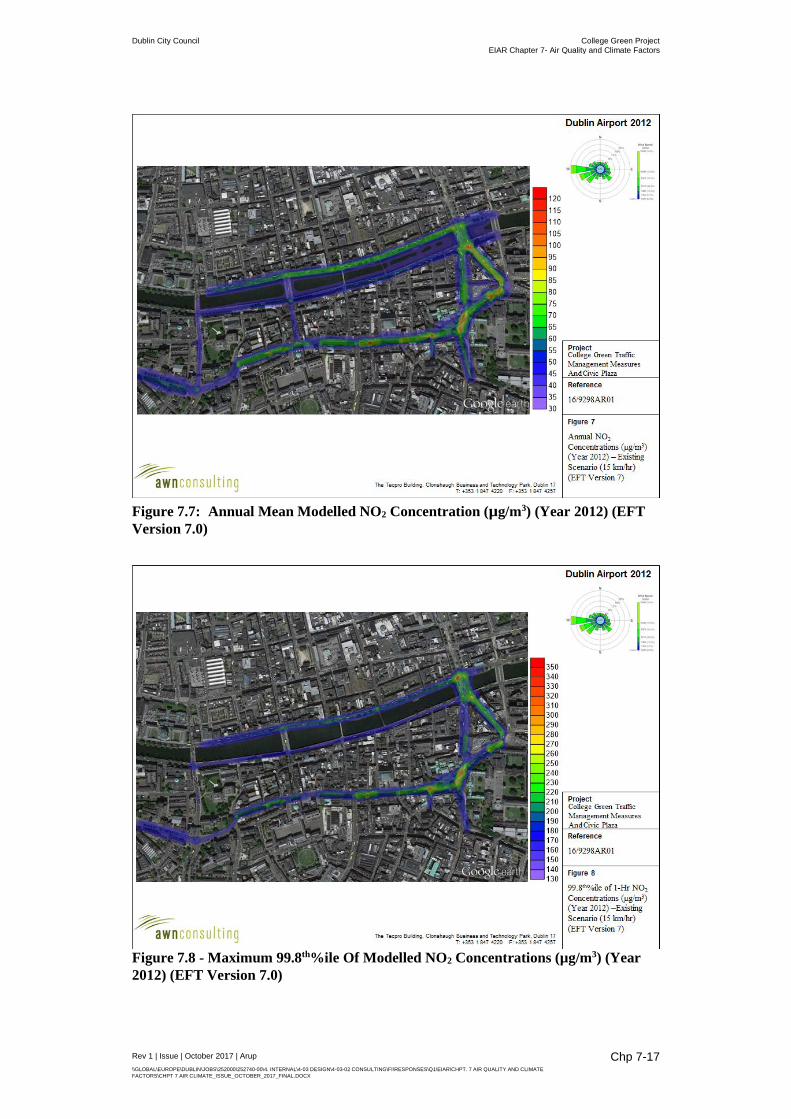
The annual mean NO2 concentration contour plot for 2012 is shown in Figure 7.7 based on an average traffic speed of 15 km/hr in the study area. Relatively high levels of NO2 are found along the main thoroughfares in Central Dublin with levels along the North Quays, Dame Street, College Green and D’Olier Street above the EU ambient annual mean limit value, peaking at approximately 100 µg/m3 at the building façade near the junction of College Street and College Green as outlined in Table 7.8.
Along Parliament Street, localised peaks are apparent at the Dame Street and Wellington Quay junctions with maximum levels of approximately 50 µg/m3, or approximately 125% of the EU ambient air quality standard.
The Winetavern Street station, for this scenario, is predicted to record a level of approximately 27 µg/m3 compared to a measured level of 29 µg/m3 recorded in 2012 and thus is in good agreement with the observed data.
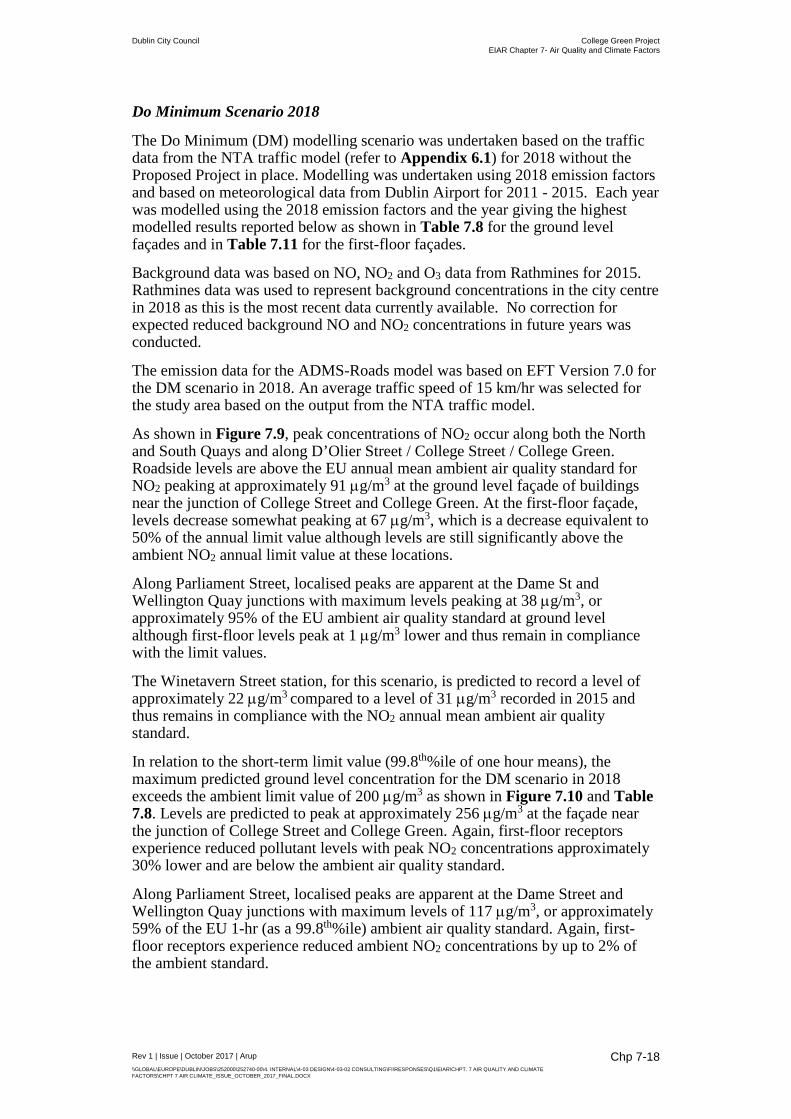
The 99.8th%ile of 1-hr mean NO2 concentration contour plot for 2012 is shown in Figure 7.8. Relatively high levels of NO2 are found again along the main thoroughfares in Central Dublin with levels along the North Quays, Dame Street and College Green above the EU ambient short-term limit value, peaking at approximately 280 µg/m3 at the building façade along College Street as outlined in Table 7.8.
Along Parliament Street, localised peaks are apparent at the Dame Street and Wellington Quay junctions with maximum levels of 165 µg/m3, or approximately 82% of the EU 1-hr (as a 99.8th%ile) ambient air quality standard.
The Winetavern Street station, for this scenario, is predicted to record a level of approximately 108 µg/m3 compared to a level of 108 µg/m3 recorded in 2012 and thus again is in good agreement with the observed data.
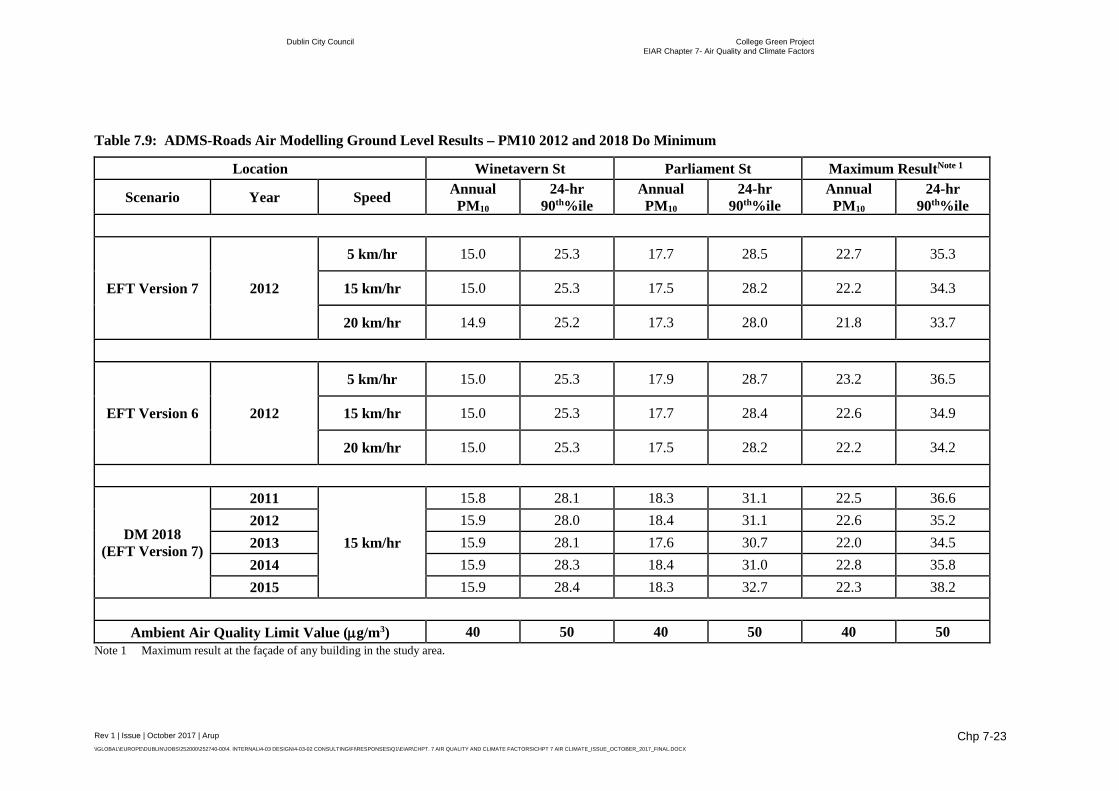
In relation to PM10 / PM2.5, modelling was also undertaken based on the assumptions outlined above for NO2. The results of the PM10 / PM2.5 modelling indicate that all locations were in compliance with the ambient air quality standards in 2012 at a traffic speed of 15 km/hr as outlined in Table 7.9 and Table 7.10. In relation to PM10 / PM2.5, results of the validation study indicated that, based on Phoenix Park PM10 data as a background station, results from the ADMS-Roads model and observed data from the Winetavern Street PM10 ambient monitor were in reasonable agreement given the many different sources of particulates in an urban setting.
Dublin City Council College Green Project EIAR Chapter 7- Air Quality and Climate Factors
Rev 1 | Issue | October 2017 | Arup \\GLOBAL\EUROPE\DUBLIN\JOBS\252000\252740-00\4. INTERNAL\4-03 DESIGN\4-03-02 CONSULTING\FI\RESPONSES\Q1\EIAR\CHPT. 7 AIR QUALITY AND CLIMATE FACTORS\CHPT 7 AIR CLIMATE_ISSUE_OCTOBER_2017_FINAL.DOCX
Chp 7-17
Figure 7.7: Annual Mean Modelled NO2 Concentration (µg/m3) (Year 2012) (EFT Version 7.0)
Figure 7.8 - Maximum 99.8th%ile Of Modelled NO2 Concentrations (µg/m3) (Year 2012) (EFT Version 7.0)
Dublin City Council College Green Project EIAR Chapter 7- Air Quality and Climate Factors
Rev 1 | Issue | October 2017 | Arup \\GLOBAL\EUROPE\DUBLIN\JOBS\252000\252740-00\4. INTERNAL\4-03 DESIGN\4-03-02 CONSULTING\FI\RESPONSES\Q1\EIAR\CHPT. 7 AIR QUALITY AND CLIMATE FACTORS\CHPT 7 AIR CLIMATE_ISSUE_OCTOBER_2017_FINAL.DOCX
Chp 7-18
Do Minimum Scenario 2018
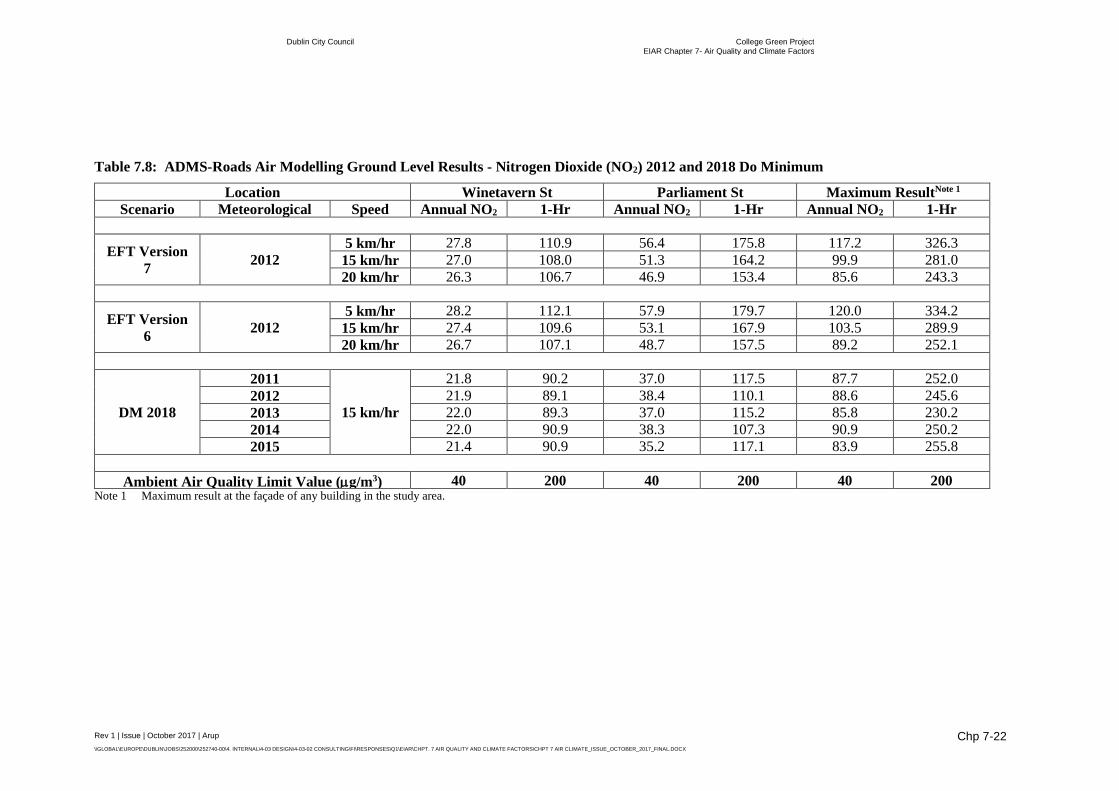
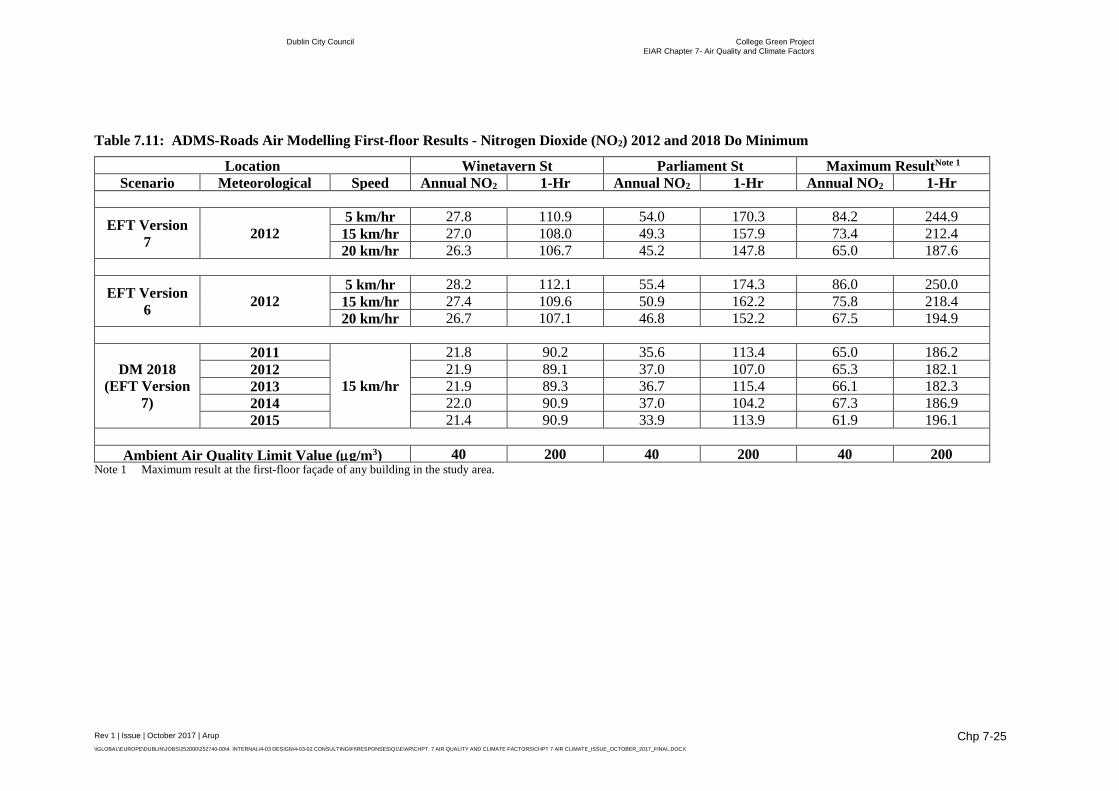
The Do Minimum (DM) modelling scenario was undertaken based on the traffic data from the NTA traffic model (refer to Appendix 6.1) for 2018 without the Proposed Project in place. Modelling was undertaken using 2018 emission factors and based on meteorological data from Dublin Airport for 2011 - 2015. Each year was modelled using the 2018 emission factors and the year giving the highest modelled results reported below as shown in Table 7.8 for the ground level façades and in Table 7.11 for the first-floor façades.
Background data was based on NO, NO2 and O3 data from Rathmines for 2015. Rathmines data was used to represent background concentrations in the city centre in 2018 as this is the most recent data currently available. No correction for expected reduced background NO and NO2 concentrations in future years was conducted.
The emission data for the ADMS-Roads model was based on EFT Version 7.0 for the DM scenario in 2018. An average traffic speed of 15 km/hr was selected for the study area based on the output from the NTA traffic model.
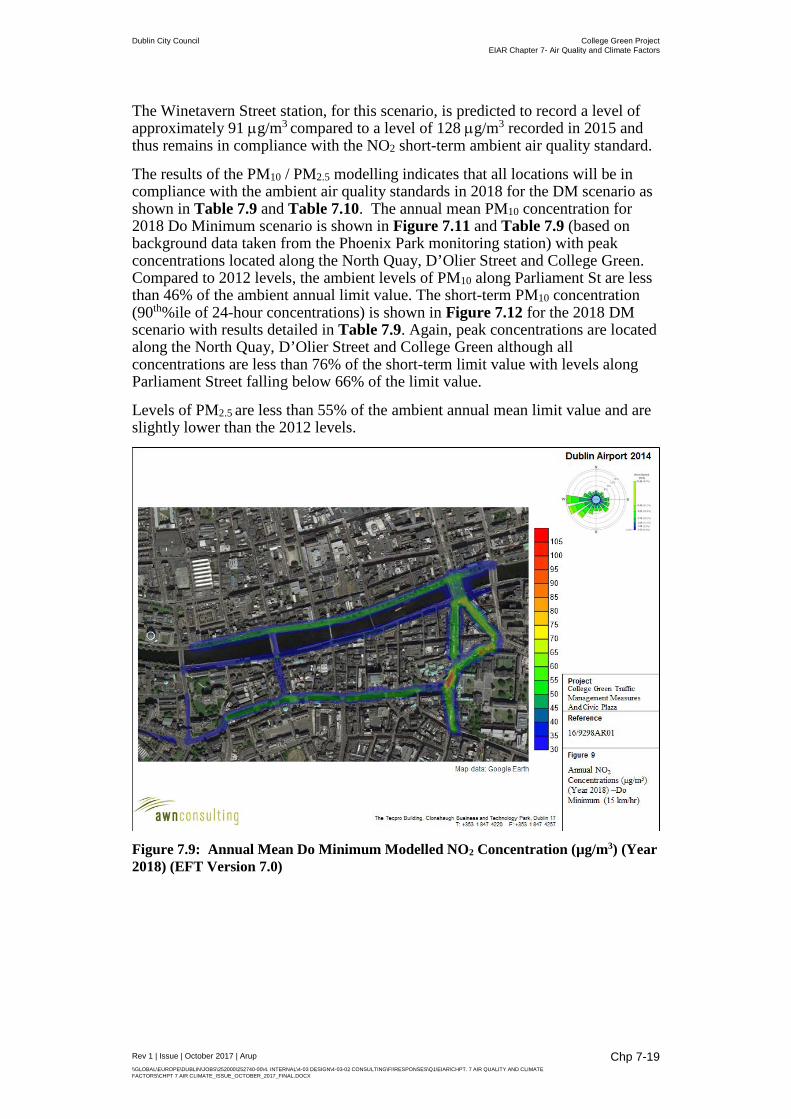
As shown in Figure 7.9, peak concentrations of NO2 occur along both the North and South Quays and along D’Olier Street / College Street / College Green. Roadside levels are above the EU annual mean ambient air quality standard for NO2 peaking at approximately 91 µg/m3 at the ground level façade of buildings near the junction of College Street and College Green. At the first-floor façade, levels decrease somewhat peaking at 67 µg/m3, which is a decrease equivalent to 50% of the annual limit value although levels are still significantly above the ambient NO2 annual limit value at these locations.
Along Parliament Street, localised peaks are apparent at the Dame St and Wellington Quay junctions with maximum levels peaking at 38 µg/m3, or approximately 95% of the EU ambient air quality standard at ground level although first-floor levels peak at 1 µg/m3 lower and thus remain in compliance with the limit values.
The Winetavern Street station, for this scenario, is predicted to record a level of approximately 22 µg/m3 compared to a level of 31 µg/m3 recorded in 2015 and thus remains in compliance with the NO2 annual mean ambient air quality standard.
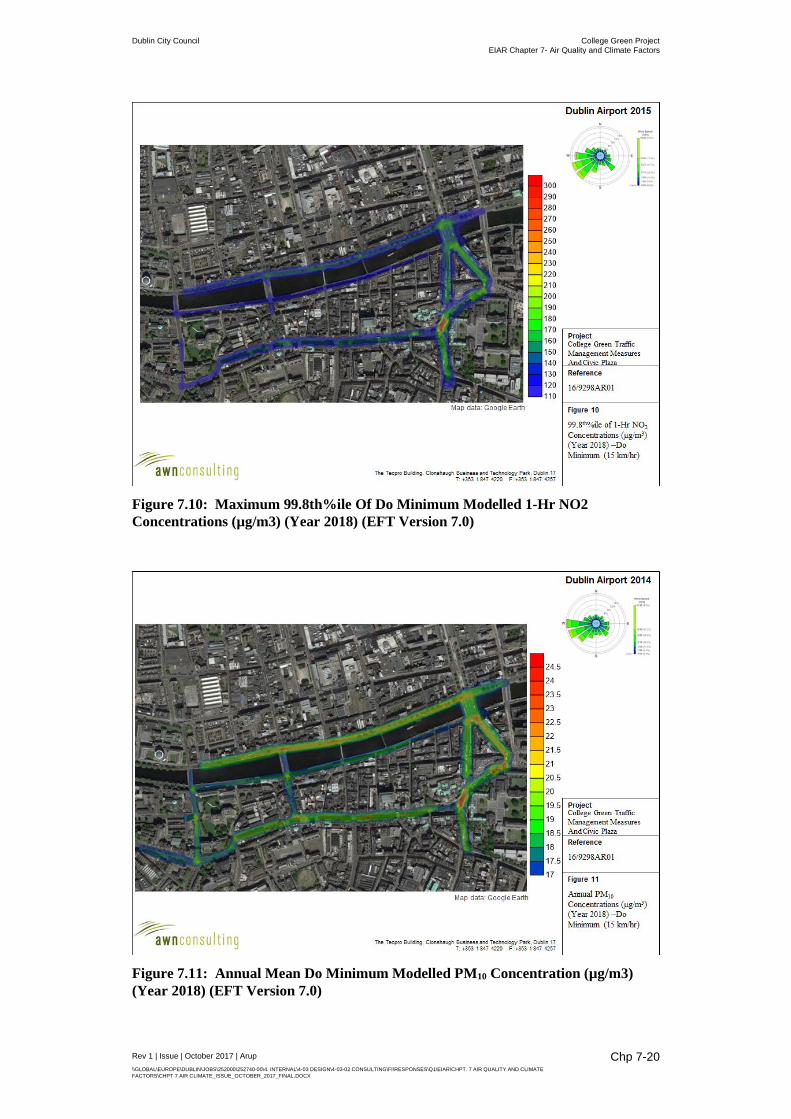
In relation to the short-term limit value (99.8th%ile of one hour means), the maximum predicted ground level concentration for the DM scenario in 2018 exceeds the ambient limit value of 200 µg/m3 as shown in Figure 7.10 and Table 7.8. Levels are predicted to peak at approximately 256 µg/m3 at the façade near the junction of College Street and College Green. Again, first-floor receptors experience reduced pollutant levels with peak NO2 concentrations approximately 30% lower and are below the ambient air quality standard.
Along Parliament Street, localised peaks are apparent at the Dame Street and Wellington Quay junctions with maximum levels of 117 µg/m3, or approximately 59% of the EU 1-hr (as a 99.8th%ile) ambient air quality standard. Again, first-floor receptors experience reduced ambient NO2 concentrations by up to 2% of the ambient standard.
Dublin City Council College Green Project EIAR Chapter 7- Air Quality and Climate Factors
Rev 1 | Issue | October 2017 | Arup \\GLOBAL\EUROPE\DUBLIN\JOBS\252000\252740-00\4. INTERNAL\4-03 DESIGN\4-03-02 CONSULTING\FI\RESPONSES\Q1\EIAR\CHPT. 7 AIR QUALITY AND CLIMATE FACTORS\CHPT 7 AIR CLIMATE_ISSUE_OCTOBER_2017_FINAL.DOCX
Chp 7-19
The Winetavern Street station, for this scenario, is predicted to record a level of approximately 91 µg/m3 compared to a level of 128 µg/m3 recorded in 2015 and thus remains in compliance with the NO2 short-term ambient air quality standard.
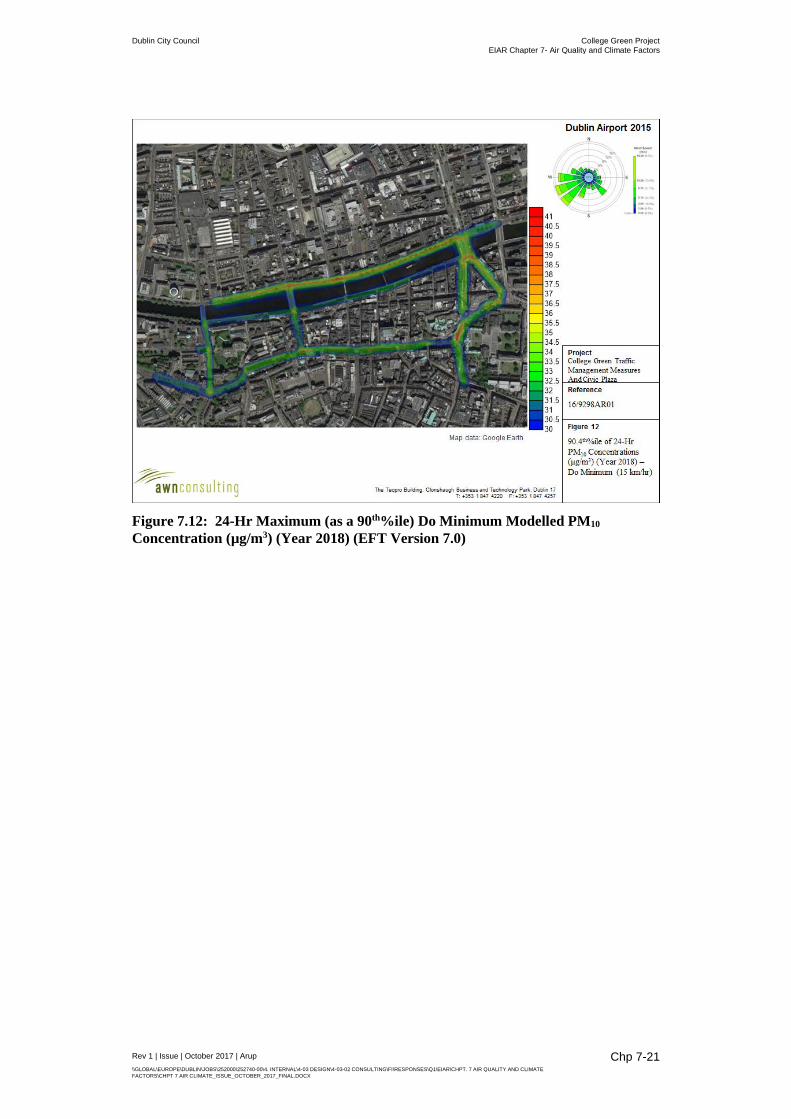
The results of the PM10 / PM2.5 modelling indicates that all locations will be in compliance with the ambient air quality standards in 2018 for the DM scenario as shown in Table 7.9 and Table 7.10. The annual mean PM10 concentration for 2018 Do Minimum scenario is shown in Figure 7.11 and Table 7.9 (based on background data taken from the Phoenix Park monitoring station) with peak concentrations located along the North Quay, D’Olier Street and College Green. Compared to 2012 levels, the ambient levels of PM10 along Parliament St are less than 46% of the ambient annual limit value. The short-term PM10 concentration (90th%ile of 24-hour concentrations) is shown in Figure 7.12 for the 2018 DM scenario with results detailed in Table 7.9. Again, peak concentrations are located along the North Quay, D’Olier Street and College Green although all concentrations are less than 76% of the short-term limit value with levels along Parliament Street falling below 66% of the limit value.
Levels of PM2.5 are less than 55% of the ambient annual mean limit value and are slightly lower than the 2012 levels.
Figure 7.9: Annual Mean Do Minimum Modelled NO2 Concentration (µg/m3) (Year 2018) (EFT Version 7.0)
Dublin City Council College Green Project EIAR Chapter 7- Air Quality and Climate Factors
Rev 1 | Issue | October 2017 | Arup \\GLOBAL\EUROPE\DUBLIN\JOBS\252000\252740-00\4. INTERNAL\4-03 DESIGN\4-03-02 CONSULTING\FI\RESPONSES\Q1\EIAR\CHPT. 7 AIR QUALITY AND CLIMATE FACTORS\CHPT 7 AIR CLIMATE_ISSUE_OCTOBER_2017_FINAL.DOCX
Chp 7-20
Figure 7.10: Maximum 99.8th%ile Of Do Minimum Modelled 1-Hr NO2 Concentrations (µg/m3) (Year 2018) (EFT Version 7.0)
Figure 7.11: Annual Mean Do Minimum Modelled PM10 Concentration (µg/m3) (Year 2018) (EFT Version 7.0)
Dublin City Council College Green Project EIAR Chapter 7- Air Quality and Climate Factors
Rev 1 | Issue | October 2017 | Arup \\GLOBAL\EUROPE\DUBLIN\JOBS\252000\252740-00\4. INTERNAL\4-03 DESIGN\4-03-02 CONSULTING\FI\RESPONSES\Q1\EIAR\CHPT. 7 AIR QUALITY AND CLIMATE FACTORS\CHPT 7 AIR CLIMATE_ISSUE_OCTOBER_2017_FINAL.DOCX
Chp 7-21
Figure 7.12: 24-Hr Maximum (as a 90th%ile) Do Minimum Modelled PM10
Concentration (µg/m3) (Year 2018) (EFT Version 7.0)
Dublin City Council College Green Project EIAR Chapter 7- Air Quality and Climate Factors
Rev 1 | Issue | October 2017 | Arup \\GLOBAL\EUROPE\DUBLIN\JOBS\252000\252740-00\4. INTERNAL\4-03 DESIGN\4-03-02 CONSULTING\FI\RESPONSES\Q1\EIAR\CHPT. 7 AIR QUALITY AND CLIMATE FACTORS\CHPT 7 AIR CLIMATE_ISSUE_OCTOBER_2017_FINAL.DOCX
Chp 7-22
Table 7.8: ADMS-Roads Air Modelling Ground Level Results - Nitrogen Dioxide (NO2) 2012 and 2018 Do Minimum
Location Winetavern St Parliament St Maximum ResultNote 1
Scenario Meteorological
Speed Annual NO2 1-Hr
Annual NO2 1-Hr
Annual NO2 1-Hr
EFT Version 7 2012
5 km/hr 27.8 110.9 56.4 175.8 117.2 326.3 15 km/hr 27.0 108.0 51.3 164.2 99.9 281.0 20 km/hr 26.3 106.7 46.9 153.4 85.6 243.3
EFT Version 6 2012
5 km/hr 28.2 112.1 57.9 179.7 120.0 334.2 15 km/hr 27.4 109.6 53.1 167.9 103.5 289.9 20 km/hr 26.7 107.1 48.7 157.5 89.2 252.1
DM 2018
2011
15 km/hr
21.8 90.2 37.0 117.5 87.7 252.0 2012 21.9 89.1 38.4 110.1 88.6 245.6 2013 22.0 89.3 37.0 115.2 85.8 230.2 2014 22.0 90.9 38.3 107.3 90.9 250.2 2015 21.4 90.9 35.2 117.1 83.9 255.8
Ambient Air Quality Limit Value (µg/m3) 40 200 40 200 40 200
Note 1 Maximum result at the façade of any building in the study area.
Dublin City Council College Green Project EIAR Chapter 7- Air Quality and Climate Factors
Rev 1 | Issue | October 2017 | Arup \\GLOBAL\EUROPE\DUBLIN\JOBS\252000\252740-00\4. INTERNAL\4-03 DESIGN\4-03-02 CONSULTING\FI\RESPONSES\Q1\EIAR\CHPT. 7 AIR QUALITY AND CLIMATE FACTORS\CHPT 7 AIR CLIMATE_ISSUE_OCTOBER_2017_FINAL.DOCX
Chp 7-23
Table 7.9: ADMS-Roads Air Modelling Ground Level Results – PM10 2012 and 2018 Do Minimum
Location Winetavern St Parliament St Maximum ResultNote 1
Scenario Year Speed Annual PM10
24-hr 90th%ile
Annual PM10
24-hr 90th%ile
Annual PM10
24-hr 90th%ile
EFT Version 7 2012
5 km/hr 15.0 25.3 17.7 28.5 22.7 35.3
15 km/hr 15.0 25.3 17.5 28.2 22.2 34.3
20 km/hr 14.9 25.2 17.3 28.0 21.8 33.7
EFT Version 6 2012
5 km/hr 15.0 25.3 17.9 28.7 23.2 36.5
15 km/hr 15.0 25.3 17.7 28.4 22.6 34.9
20 km/hr 15.0 25.3 17.5 28.2 22.2 34.2
DM 2018 (EFT Version 7)
2011
15 km/hr
15.8 28.1 18.3 31.1 22.5 36.6 2012 15.9 28.0 18.4 31.1 22.6 35.2 2013 15.9 28.1 17.6 30.7 22.0 34.5 2014 15.9 28.3 18.4 31.0 22.8 35.8 2015 15.9 28.4 18.3 32.7 22.3 38.2
Ambient Air Quality Limit Value (µg/m3) 40 50 40 50 40 50
Note 1 Maximum result at the façade of any building in the study area.

Dublin City Council College Green Project EIAR Chapter 7- Air Quality and Climate Factors
Rev 1 | Issue | October 2017 | Arup \\GLOBAL\EUROPE\DUBLIN\JOBS\252000\252740-00\4. INTERNAL\4-03 DESIGN\4-03-02 CONSULTING\FI\RESPONSES\Q1\EIAR\CHPT. 7 AIR QUALITY AND CLIMATE FACTORS\CHPT 7 AIR CLIMATE_ISSUE_OCTOBER_2017_FINAL.DOCX
Chp 7-24
Table 7.10: ADMS-Roads Air Modelling Ground Level Results – PM2.5 2012 and 2018 Do Minimum
Location Winetavern St Parliament St Maximum ResultNote 1
Scenario Year Speed Annual PM2.5 Annual PM2.5 Annual PM2.5
EFT Version 7 2012
5 km/hr 9.5 11.5 15.1 15 km/hr 9.5 11.3 14.5 20 km/hr 9.5 11.1 14.1
EFT Version 6 2012
5 km/hr 9.5 11.7 15.6 15 km/hr 9.5 11.5 14.9 20 km/hr 9.5 11.3 14.4
DM 2018 (EFT Version
7)
2011
15 km/hr
9.3 10.8 13.7 2012 9.3 10.9 13.8 2013 9.3 10.4 13.5 2014 9.3 10.8 14.0 2015 9.3 10.8 13.7
Ambient Air Quality Limit Value (µg/m3) 25 25 25 Note 1 Maximum result at the façade of any building in the study area.
Dublin City Council College Green Project EIAR Chapter 7- Air Quality and Climate Factors
Rev 1 | Issue | October 2017 | Arup \\GLOBAL\EUROPE\DUBLIN\JOBS\252000\252740-00\4. INTERNAL\4-03 DESIGN\4-03-02 CONSULTING\FI\RESPONSES\Q1\EIAR\CHPT. 7 AIR QUALITY AND CLIMATE FACTORS\CHPT 7 AIR CLIMATE_ISSUE_OCTOBER_2017_FINAL.DOCX
Chp 7-25
Table 7.11: ADMS-Roads Air Modelling First-floor Results - Nitrogen Dioxide (NO2) 2012 and 2018 Do Minimum
Location Winetavern St Parliament St Maximum ResultNote 1
Scenario Meteorological
Speed Annual NO2 1-Hr
Annual NO2 1-Hr
Annual NO2 1-Hr
EFT Version 7 2012
5 km/hr 27.8 110.9 54.0 170.3 84.2 244.9 15 km/hr 27.0 108.0 49.3 157.9 73.4 212.4 20 km/hr 26.3 106.7 45.2 147.8 65.0 187.6
EFT Version 6 2012
5 km/hr 28.2 112.1 55.4 174.3 86.0 250.0 15 km/hr 27.4 109.6 50.9 162.2 75.8 218.4 20 km/hr 26.7 107.1 46.8 152.2 67.5 194.9
DM 2018 (EFT Version
7)
2011
15 km/hr
21.8 90.2 35.6 113.4 65.0 186.2 2012 21.9 89.1 37.0 107.0 65.3 182.1 2013 21.9 89.3 36.7 115.4 66.1 182.3 2014 22.0 90.9 37.0 104.2 67.3 186.9 2015 21.4 90.9 33.9 113.9 61.9 196.1
Ambient Air Quality Limit Value (µg/m3) 40 200 40 200 40 200
Note 1 Maximum result at the first-floor façade of any building in the study area.
Dublin City Council College Green Project EIAR Chapter 7- Air Quality and Climate Factors
Rev 1 | Issue | October 2017 | Arup \\GLOBAL\EUROPE\DUBLIN\JOBS\252000\252740-00\4. INTERNAL\4-03 DESIGN\4-03-02 CONSULTING\FI\RESPONSES\Q1\EIAR\CHPT. 7 AIR QUALITY AND CLIMATE FACTORS\CHPT 7 AIR CLIMATE_ISSUE_OCTOBER_2017_FINAL.DOCX
Chp 7-26
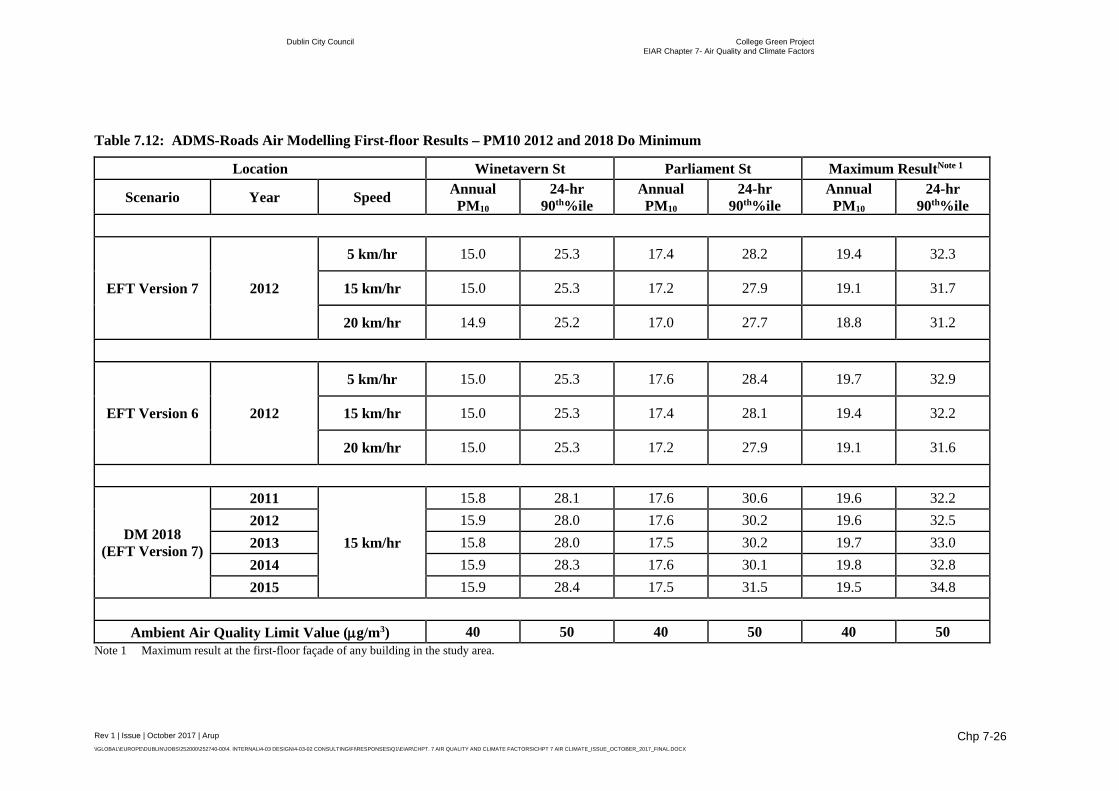
Table 7.12: ADMS-Roads Air Modelling First-floor Results – PM10 2012 and 2018 Do Minimum
Location Winetavern St Parliament St Maximum ResultNote 1
Scenario Year Speed Annual PM10
24-hr 90th%ile
Annual PM10
24-hr 90th%ile
Annual PM10
24-hr 90th%ile
EFT Version 7 2012
5 km/hr 15.0 25.3 17.4 28.2 19.4 32.3
15 km/hr 15.0 25.3 17.2 27.9 19.1 31.7
20 km/hr 14.9 25.2 17.0 27.7 18.8 31.2
EFT Version 6 2012
5 km/hr 15.0 25.3 17.6 28.4 19.7 32.9
15 km/hr 15.0 25.3 17.4 28.1 19.4 32.2
20 km/hr 15.0 25.3 17.2 27.9 19.1 31.6
DM 2018 (EFT Version 7)
2011
15 km/hr
15.8 28.1 17.6 30.6 19.6 32.2 2012 15.9 28.0 17.6 30.2 19.6 32.5 2013 15.8 28.0 17.5 30.2 19.7 33.0 2014 15.9 28.3 17.6 30.1 19.8 32.8 2015 15.9 28.4 17.5 31.5 19.5 34.8
Ambient Air Quality Limit Value (µg/m3) 40 50 40 50 40 50
Note 1 Maximum result at the first-floor façade of any building in the study area.
Dublin City Council College Green Project EIAR Chapter 7- Air Quality and Climate Factors
Rev 1 | Issue | October 2017 | Arup \\GLOBAL\EUROPE\DUBLIN\JOBS\252000\252740-00\4. INTERNAL\4-03 DESIGN\4-03-02 CONSULTING\FI\RESPONSES\Q1\EIAR\CHPT. 7 AIR QUALITY AND CLIMATE FACTORS\CHPT 7 AIR CLIMATE_ISSUE_OCTOBER_2017_FINAL.DOCX
Chp 7-27
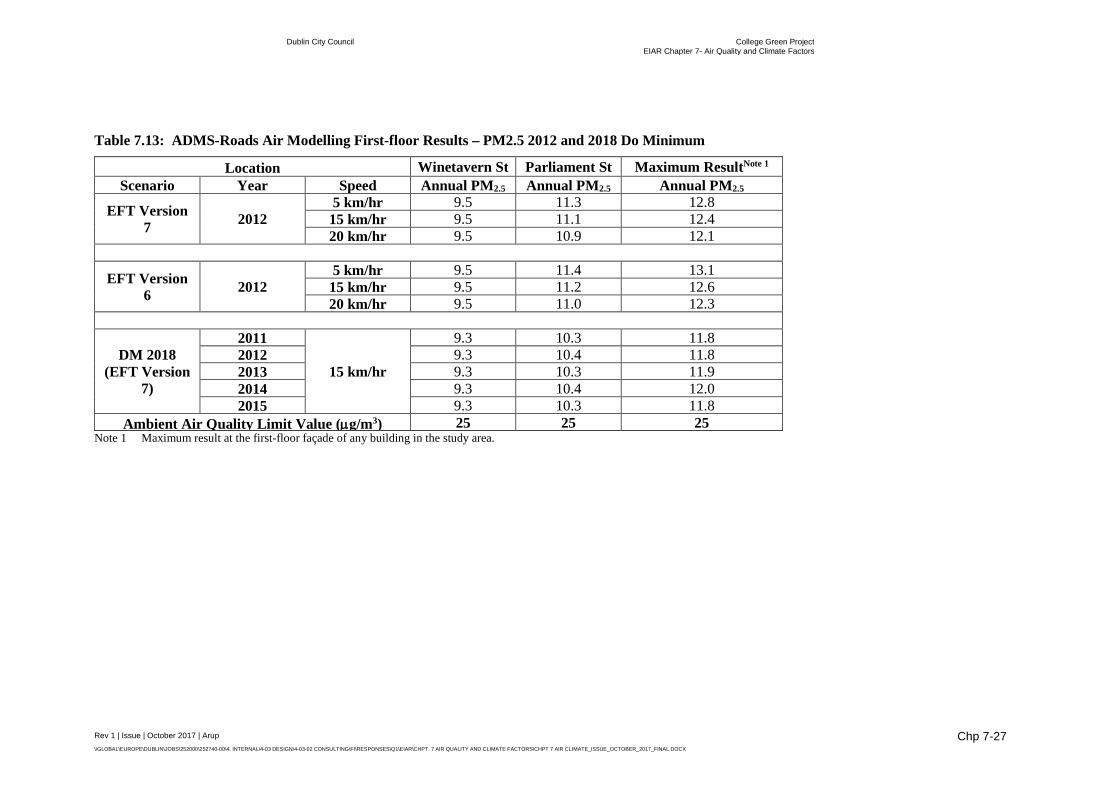
Table 7.13: ADMS-Roads Air Modelling First-floor Results – PM2.5 2012 and 2018 Do Minimum
Location Winetavern St Parliament St Maximum ResultNote 1
Scenario Year Speed Annual PM2.5 Annual PM2.5 Annual PM2.5
EFT Version 7 2012
5 km/hr 9.5 11.3 12.8 15 km/hr 9.5 11.1 12.4 20 km/hr 9.5 10.9 12.1
EFT Version 6 2012
5 km/hr 9.5 11.4 13.1 15 km/hr 9.5 11.2 12.6 20 km/hr 9.5 11.0 12.3
DM 2018 (EFT Version
7)
2011
15 km/hr
9.3 10.3 11.8 2012 9.3 10.4 11.8 2013 9.3 10.3 11.9 2014 9.3 10.4 12.0 2015 9.3 10.3 11.8
Ambient Air Quality Limit Value (µg/m3) 25 25 25 Note 1 Maximum result at the first-floor façade of any building in the study area.
Dublin City Council College Green Project EIAR Chapter 7- Air Quality and Climate Factors
Rev 1 | Issue | October 2017 | Arup \\GLOBAL\EUROPE\DUBLIN\JOBS\252000\252740-00\4. INTERNAL\4-03 DESIGN\4-03-02 CONSULTING\FI\RESPONSES\Q1\EIAR\CHPT. 7 AIR QUALITY AND CLIMATE FACTORS\CHPT 7 AIR CLIMATE_ISSUE_OCTOBER_2017_FINAL.DOCX
Chp 7-28
Do Minimum Scenario 2035
The Do Minimum (DM) modelling scenario was undertaken based on the traffic data from the NTA traffic model for 2035 without the Proposed Project in place. Modelling was undertaken using 2030 emission factors (the upper limit of the emission factor database) and based on meteorological data from Dublin Airport for 2011 - 2015. Each year was modelled using the 2030 emission factors and the year giving the highest modelled results reported below.
Background data was based on NO, NO2 and O3 data from Rathmines for 2015. Rathmines data was used to represent background concentrations in the city centre in 2035 as this is the most recent data currently available. No correction for expected reduced background NO and NO2 in future years was conducted which will be particularly conservative for this scenario.
The emission data for the ADMS-Roads model was based on EFT Version 7.0 (Year 2030) for the DM scenario in 2035. An average traffic speed of 15 km/hr was selected for the study area based on the output from the NTA traffic model.
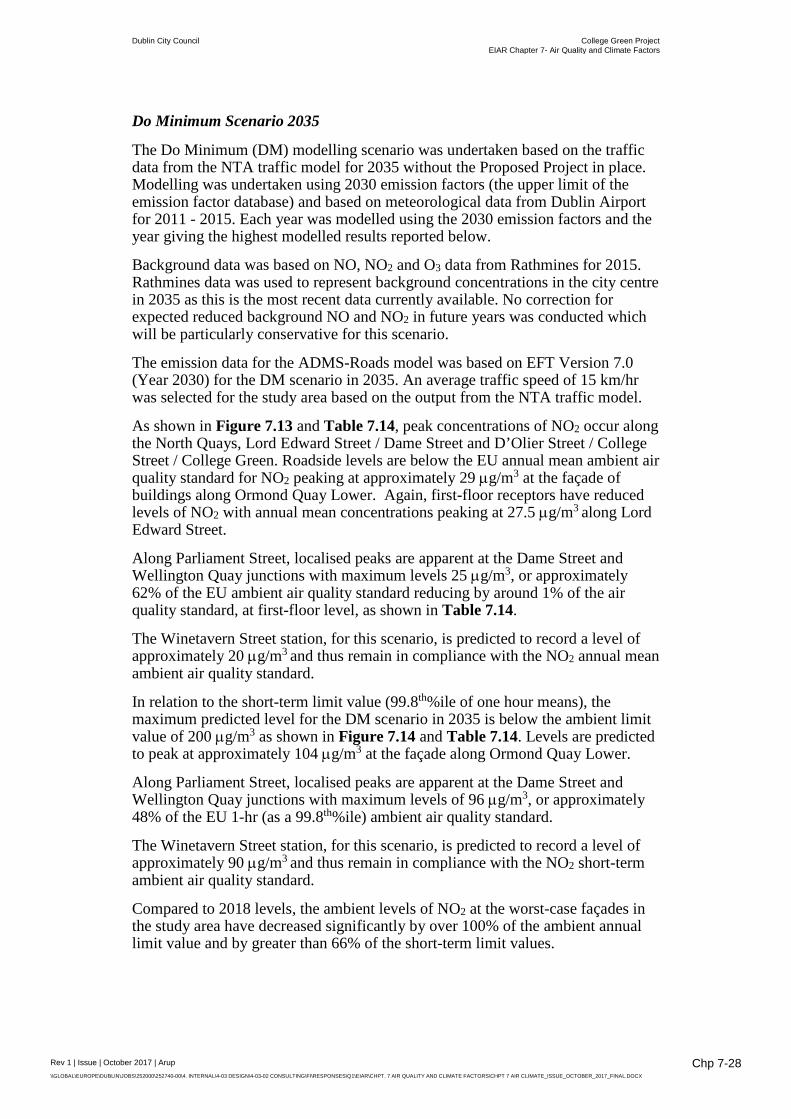
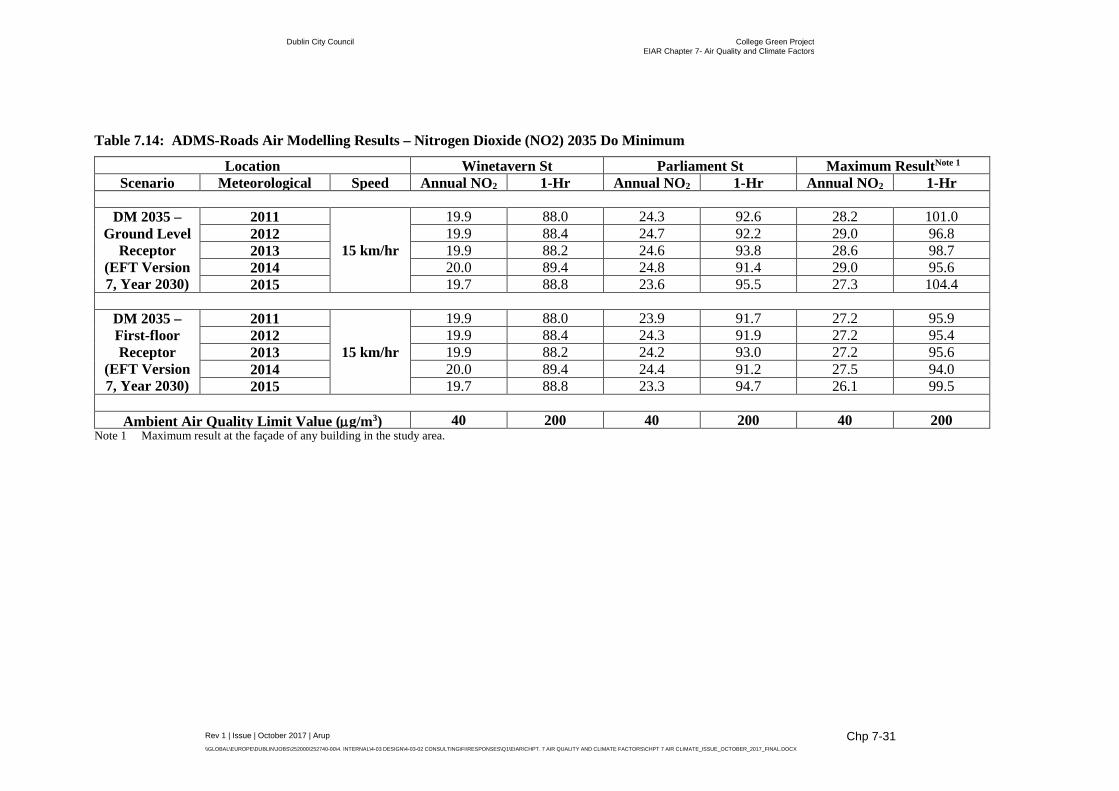
As shown in Figure 7.13 and Table 7.14, peak concentrations of NO2 occur along the North Quays, Lord Edward Street / Dame Street and D’Olier Street / College Street / College Green. Roadside levels are below the EU annual mean ambient air quality standard for NO2 peaking at approximately 29 µg/m3 at the façade of buildings along Ormond Quay Lower. Again, first-floor receptors have reduced levels of NO2 with annual mean concentrations peaking at 27.5 µg/m3 along Lord Edward Street.
Along Parliament Street, localised peaks are apparent at the Dame Street and Wellington Quay junctions with maximum levels 25 µg/m3, or approximately 62% of the EU ambient air quality standard reducing by around 1% of the air quality standard, at first-floor level, as shown in Table 7.14.
The Winetavern Street station, for this scenario, is predicted to record a level of approximately 20 µg/m3 and thus remain in compliance with the NO2 annual mean ambient air quality standard.
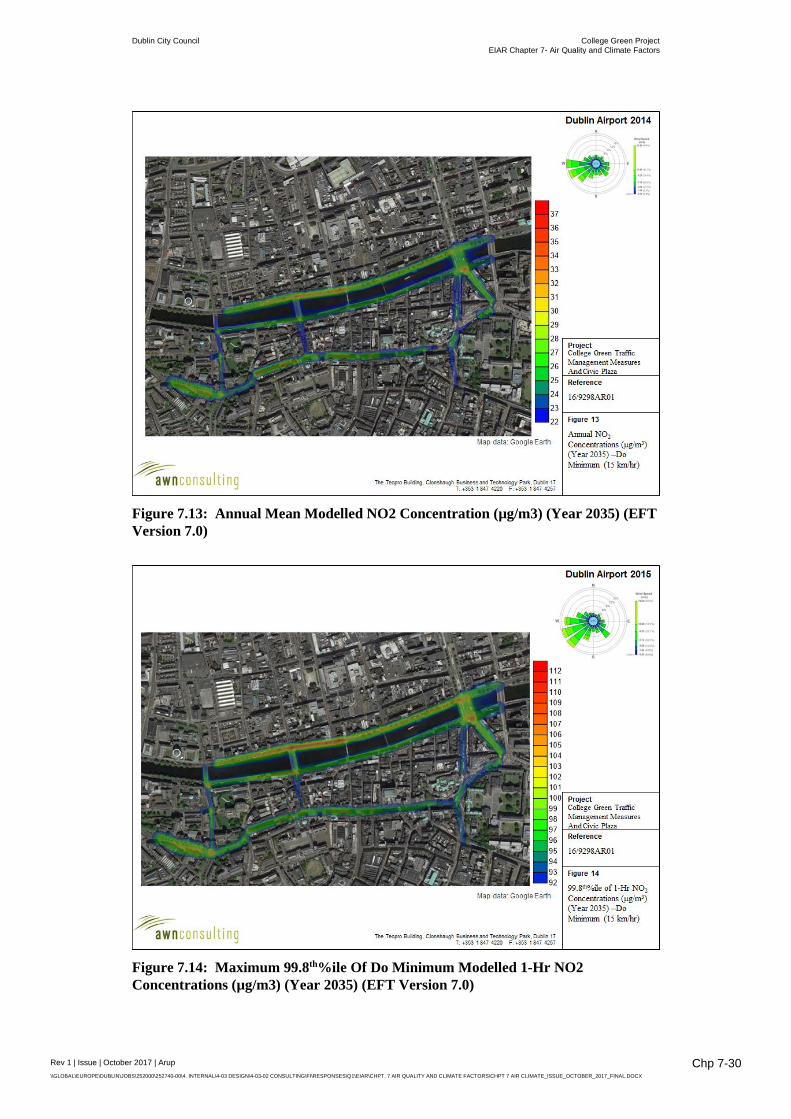
In relation to the short-term limit value (99.8th%ile of one hour means), the maximum predicted level for the DM scenario in 2035 is below the ambient limit value of 200 µg/m3 as shown in Figure 7.14 and Table 7.14. Levels are predicted to peak at approximately 104 µg/m3 at the façade along Ormond Quay Lower.
Along Parliament Street, localised peaks are apparent at the Dame Street and Wellington Quay junctions with maximum levels of 96 µg/m3, or approximately 48% of the EU 1-hr (as a 99.8th%ile) ambient air quality standard.
The Winetavern Street station, for this scenario, is predicted to record a level of approximately 90 µg/m3 and thus remain in compliance with the NO2 short-term ambient air quality standard.
Compared to 2018 levels, the ambient levels of NO2 at the worst-case façades in the study area have decreased significantly by over 100% of the ambient annual limit value and by greater than 66% of the short-term limit values.

Dublin City Council College Green Project EIAR Chapter 7- Air Quality and Climate Factors
Rev 1 | Issue | October 2017 | Arup \\GLOBAL\EUROPE\DUBLIN\JOBS\252000\252740-00\4. INTERNAL\4-03 DESIGN\4-03-02 CONSULTING\FI\RESPONSES\Q1\EIAR\CHPT. 7 AIR QUALITY AND CLIMATE FACTORS\CHPT 7 AIR CLIMATE_ISSUE_OCTOBER_2017_FINAL.DOCX
Chp 7-29
Compared to 2018 levels, the ambient levels of NO2 along Parliament Street have decreased by up to 31% of the ambient annual limit value and by 10% of the short-term limit values.
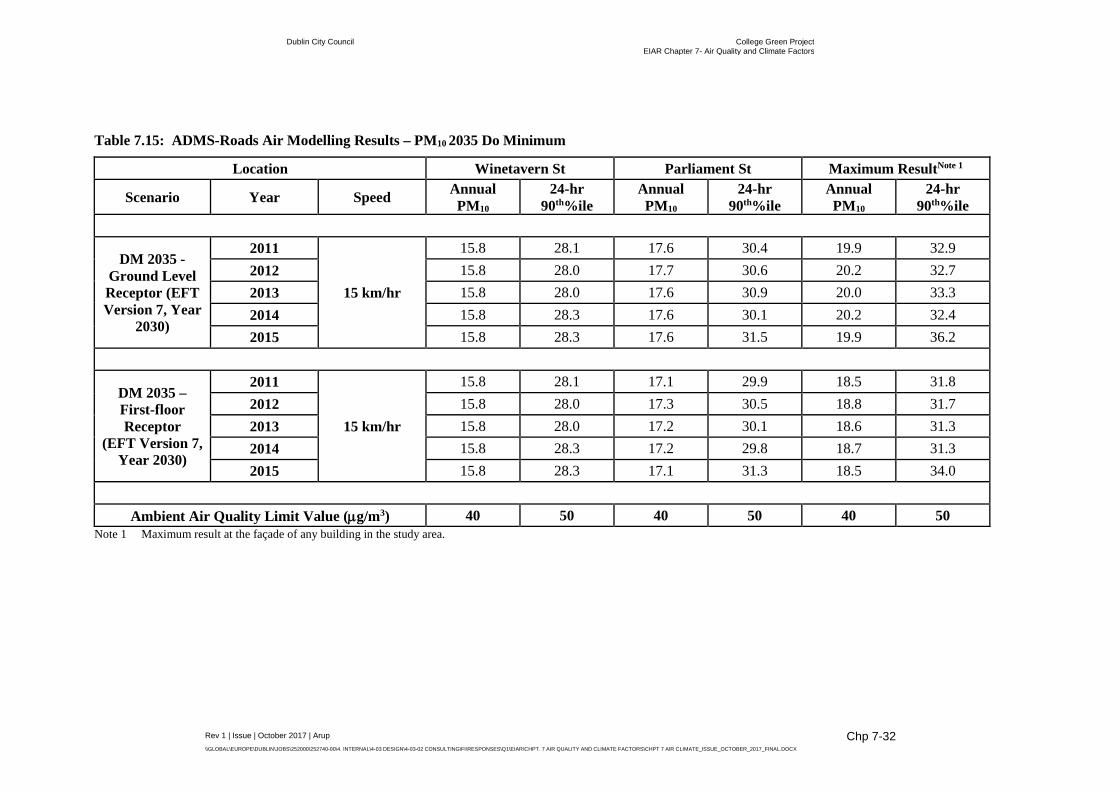
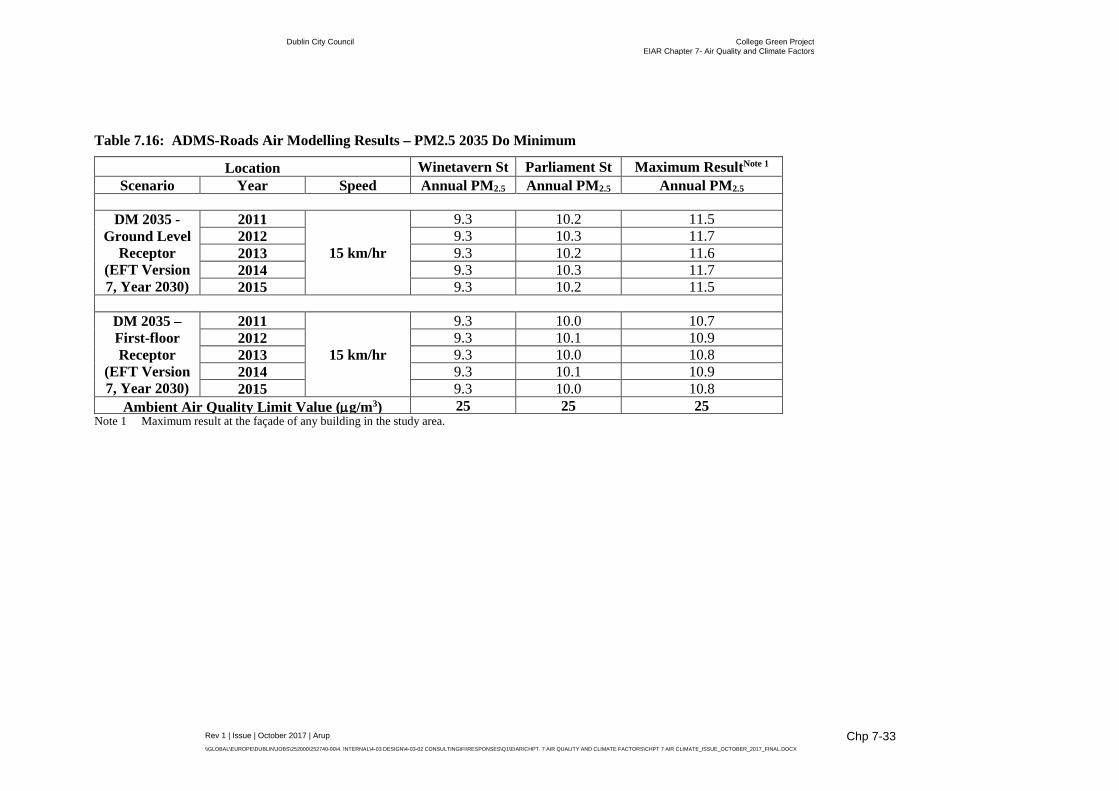
The results of the PM10 / PM2.5 modelling indicate that all locations will be in compliance with the ambient air quality standards in 2035 for the DM scenario as shown in Table 7.15 and Table 7.16. The annual mean PM10 concentration for 2035 Do Minimum scenario is shown in Table 7.15 (based on background data taken from the Phoenix Park monitoring station). Compared to 2018 levels, the ambient levels of PM10 at the worst-case façades in the study area have marginally increased by less than 1% of the ambient annual limit value and by 3% of the short-term limit value. Compared to 2018 levels, the ambient levels of PM10 along Parliament Street have remained essentially unchanged (due to the dominant role of the unchanging background concentration) with all levels less than 63% of the ambient limit values. Levels of PM2.5 are less than 47% of the ambient annual mean limit value and are essentially unchanged from the 2018 levels as outlined in Table 7.16.
Dublin City Council College Green Project EIAR Chapter 7- Air Quality and Climate Factors
Rev 1 | Issue | October 2017 | Arup \\GLOBAL\EUROPE\DUBLIN\JOBS\252000\252740-00\4. INTERNAL\4-03 DESIGN\4-03-02 CONSULTING\FI\RESPONSES\Q1\EIAR\CHPT. 7 AIR QUALITY AND CLIMATE FACTORS\CHPT 7 AIR CLIMATE_ISSUE_OCTOBER_2017_FINAL.DOCX
Chp 7-30
Figure 7.13: Annual Mean Modelled NO2 Concentration (µg/m3) (Year 2035) (EFT Version 7.0)
Figure 7.14: Maximum 99.8th%ile Of Do Minimum Modelled 1-Hr NO2 Concentrations (µg/m3) (Year 2035) (EFT Version 7.0)
Dublin City Council College Green Project EIAR Chapter 7- Air Quality and Climate Factors
Rev 1 | Issue | October 2017 | Arup \\GLOBAL\EUROPE\DUBLIN\JOBS\252000\252740-00\4. INTERNAL\4-03 DESIGN\4-03-02 CONSULTING\FI\RESPONSES\Q1\EIAR\CHPT. 7 AIR QUALITY AND CLIMATE FACTORS\CHPT 7 AIR CLIMATE_ISSUE_OCTOBER_2017_FINAL.DOCX
Chp 7-31
Table 7.14: ADMS-Roads Air Modelling Results – Nitrogen Dioxide (NO2) 2035 Do Minimum
Location Winetavern St Parliament St Maximum ResultNote 1
Scenario Meteorological
Speed Annual NO2 1-Hr
Annual NO2 1-Hr
Annual NO2 1-Hr
DM 2035 – Ground Level
Receptor (EFT Version 7, Year 2030)
2011
15 km/hr
19.9 88.0 24.3 92.6 28.2 101.0 2012 19.9 88.4 24.7 92.2 29.0 96.8 2013 19.9 88.2 24.6 93.8 28.6 98.7 2014 20.0 89.4 24.8 91.4 29.0 95.6 2015 19.7 88.8 23.6 95.5 27.3 104.4
DM 2035 – First-floor Receptor
(EFT Version 7, Year 2030)
2011
15 km/hr
19.9 88.0 23.9 91.7 27.2 95.9 2012 19.9 88.4 24.3 91.9 27.2 95.4 2013 19.9 88.2 24.2 93.0 27.2 95.6 2014 20.0 89.4 24.4 91.2 27.5 94.0 2015 19.7 88.8 23.3 94.7 26.1 99.5
Ambient Air Quality Limit Value (µg/m3) 40 200 40 200 40 200
Note 1 Maximum result at the façade of any building in the study area.
Dublin City Council College Green Project EIAR Chapter 7- Air Quality and Climate Factors
Rev 1 | Issue | October 2017 | Arup \\GLOBAL\EUROPE\DUBLIN\JOBS\252000\252740-00\4. INTERNAL\4-03 DESIGN\4-03-02 CONSULTING\FI\RESPONSES\Q1\EIAR\CHPT. 7 AIR QUALITY AND CLIMATE FACTORS\CHPT 7 AIR CLIMATE_ISSUE_OCTOBER_2017_FINAL.DOCX
Chp 7-32
Table 7.15: ADMS-Roads Air Modelling Results – PM10 2035 Do Minimum
Location Winetavern St Parliament St Maximum ResultNote 1
Scenario Year Speed Annual PM10
24-hr 90th%ile
Annual PM10
24-hr 90th%ile
Annual PM10
24-hr 90th%ile
DM 2035 - Ground Level Receptor (EFT Version 7, Year
2030)
2011
15 km/hr
15.8 28.1 17.6 30.4 19.9 32.9 2012 15.8 28.0 17.7 30.6 20.2 32.7 2013 15.8 28.0 17.6 30.9 20.0 33.3 2014 15.8 28.3 17.6 30.1 20.2 32.4 2015 15.8 28.3 17.6 31.5 19.9 36.2
DM 2035 – First-floor Receptor
(EFT Version 7, Year 2030)
2011
15 km/hr
15.8 28.1 17.1 29.9 18.5 31.8 2012 15.8 28.0 17.3 30.5 18.8 31.7 2013 15.8 28.0 17.2 30.1 18.6 31.3 2014 15.8 28.3 17.2 29.8 18.7 31.3 2015 15.8 28.3 17.1 31.3 18.5 34.0
Ambient Air Quality Limit Value (µg/m3) 40 50 40 50 40 50
Note 1 Maximum result at the façade of any building in the study area.
Dublin City Council College Green Project EIAR Chapter 7- Air Quality and Climate Factors
Rev 1 | Issue | October 2017 | Arup \\GLOBAL\EUROPE\DUBLIN\JOBS\252000\252740-00\4. INTERNAL\4-03 DESIGN\4-03-02 CONSULTING\FI\RESPONSES\Q1\EIAR\CHPT. 7 AIR QUALITY AND CLIMATE FACTORS\CHPT 7 AIR CLIMATE_ISSUE_OCTOBER_2017_FINAL.DOCX
Chp 7-33
Table 7.16: ADMS-Roads Air Modelling Results – PM2.5 2035 Do Minimum
Location Winetavern St Parliament St Maximum ResultNote 1
Scenario Year Speed Annual PM2.5 Annual PM2.5 Annual PM2.5
DM 2035 - Ground Level
Receptor (EFT Version 7, Year 2030)
2011
15 km/hr
9.3 10.2 11.5 2012 9.3 10.3 11.7 2013 9.3 10.2 11.6 2014 9.3 10.3 11.7 2015 9.3 10.2 11.5
DM 2035 – First-floor Receptor
(EFT Version 7, Year 2030)
2011
15 km/hr
9.3 10.0 10.7 2012 9.3 10.1 10.9 2013 9.3 10.0 10.8 2014 9.3 10.1 10.9 2015 9.3 10.0 10.8
Ambient Air Quality Limit Value (µg/m3) 25 25 25 Note 1 Maximum result at the façade of any building in the study area.

Dublin City Council College Green Project EIAR Chapter 7- Air Quality and Climate Factors
Rev 1 | Issue | October 2017 | Arup \\GLOBAL\EUROPE\DUBLIN\JOBS\252000\252740-00\4. INTERNAL\4-03 DESIGN\4-03-02 CONSULTING\FI\RESPONSES\Q1\EIAR\CHPT. 7 AIR QUALITY AND CLIMATE FACTORS\CHPT 7 AIR CLIMATE_ISSUE_OCTOBER_2017_FINAL.DOCX
Chp 7-34
Climate
Anthropogenic emissions of greenhouse gases in Ireland included in the EU 2020 strategy are outlined in the most recent review by the EPA. Combustion of fossil fuels for energy purposes is the greatest source of emissions at 97% of CO2. Agriculture is the greatest source of emissions at 33% of CO2eq (2014 data). The largest share of energy emissions in 2015 is from fuel combustion for power generation (19.7% of total emissions) and road transport (19.7%). Industry and commercial sources account for 10.9% of emissions in 2015. 2015 is the third year where compliance with the European Union’s Effort Sharing Decision “EU 2020 Strategy” (Decision 406/2009/EC) will be assessed. Ireland had non-ETS sectors emissions of 43.0 Mt CO2eq in 2015, when emissions covered by the EU’s emissions trading scheme for stationary and aviation operators were removed. This is 1.63 Mt CO2eq lower than Ireland’s annual target for emissions in 2015. However, the latest note from the EPA in 2016 indicates that compliance with the EU 2020 targets will be very challenging (EPA, 2016).
Greenhouse gases have different efficiencies in retaining solar energy in the atmosphere and different lifetimes in the atmosphere. In order to compare different greenhouse gases, emissions are calculated on the basis of their Global Warming Potential (GWP) over a 100-year period, giving a measure of their relative heating effect in the atmosphere. The GWP100 for CO2 is the basic unit (GWP = 1) whereas CH4 has a global warming potential equivalent to 23 units of CO2 and N2O has a GWP100 of 310.
7.4 Predicted Impacts The Proposed Project will involve the development of a civic plaza and the implementation of traffic management measures over a defined construction period. When considering a development of this nature, the potential air quality and climate impact on the surroundings must be considered for each of two distinct stages:
• construction phase; and • operational phase.
7.4.1 Construction Phase The construction phase will involve excavation over the Proposed Project site and the erection of a civic plaza over a phased construction period.
Climate
The impact of climate due to the construction phase of the Proposed Project will not be significant.
Air Quality
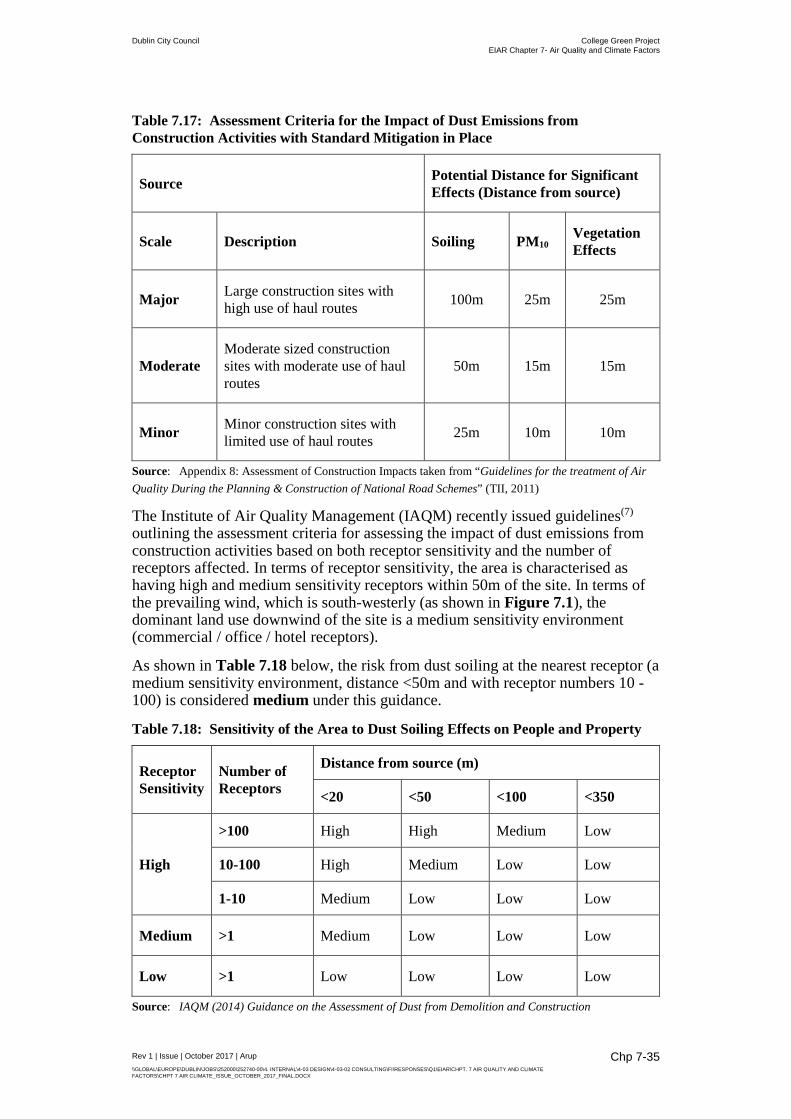
Transport Infrastructure Ireland (6) have published guidelines outlining the assessment criteria for assessing the impact of dust emissions from construction activities with standard mitigation in place. As shown in Table 7.17 below, the risk from soiling ranges from 25m – 100m and in relation to PM10, the risk ranges from 10m – 25m depending on the scale of the construction activity.
Dublin City Council College Green Project EIAR Chapter 7- Air Quality and Climate Factors
Rev 1 | Issue | October 2017 | Arup \\GLOBAL\EUROPE\DUBLIN\JOBS\252000\252740-00\4. INTERNAL\4-03 DESIGN\4-03-02 CONSULTING\FI\RESPONSES\Q1\EIAR\CHPT. 7 AIR QUALITY AND CLIMATE FACTORS\CHPT 7 AIR CLIMATE_ISSUE_OCTOBER_2017_FINAL.DOCX
Chp 7-35
Table 7.17: Assessment Criteria for the Impact of Dust Emissions from Construction Activities with Standard Mitigation in Place
Source Potential Distance for Significant Effects (Distance from source)
Scale Description Soiling PM10 Vegetation Effects
Major Large construction sites with high use of haul routes 100m 25m 25m
Moderate Moderate sized construction sites with moderate use of haul routes
50m 15m 15m
Minor Minor construction sites with limited use of haul routes 25m 10m 10m
Source: Appendix 8: Assessment of Construction Impacts taken from “Guidelines for the treatment of Air Quality During the Planning & Construction of National Road Schemes” (TII, 2011)
The Institute of Air Quality Management (IAQM) recently issued guidelines(7) outlining the assessment criteria for assessing the impact of dust emissions from construction activities based on both receptor sensitivity and the number of receptors affected. In terms of receptor sensitivity, the area is characterised as having high and medium sensitivity receptors within 50m of the site. In terms of the prevailing wind, which is south-westerly (as shown in Figure 7.1), the dominant land use downwind of the site is a medium sensitivity environment (commercial / office / hotel receptors).
As shown in Table 7.18 below, the risk from dust soiling at the nearest receptor (a medium sensitivity environment, distance <50m and with receptor numbers 10 - 100) is considered medium under this guidance.
Table 7.18: Sensitivity of the Area to Dust Soiling Effects on People and Property
Receptor Sensitivity
Number of Receptors
Distance from source (m)
<20 <50 <100 <350
High
>100 High High Medium Low
10-100 High Medium Low Low
1-10 Medium Low Low Low
Medium >1 Medium Low Low Low
Low >1 Low Low Low Low
Source: IAQM (2014) Guidance on the Assessment of Dust from Demolition and Construction
Dublin City Council College Green Project EIAR Chapter 7- Air Quality and Climate Factors
Rev 1 | Issue | October 2017 | Arup \\GLOBAL\EUROPE\DUBLIN\JOBS\252000\252740-00\4. INTERNAL\4-03 DESIGN\4-03-02 CONSULTING\FI\RESPONSES\Q1\EIAR\CHPT. 7 AIR QUALITY AND CLIMATE FACTORS\CHPT 7 AIR CLIMATE_ISSUE_OCTOBER_2017_FINAL.DOCX
Chp 7-36
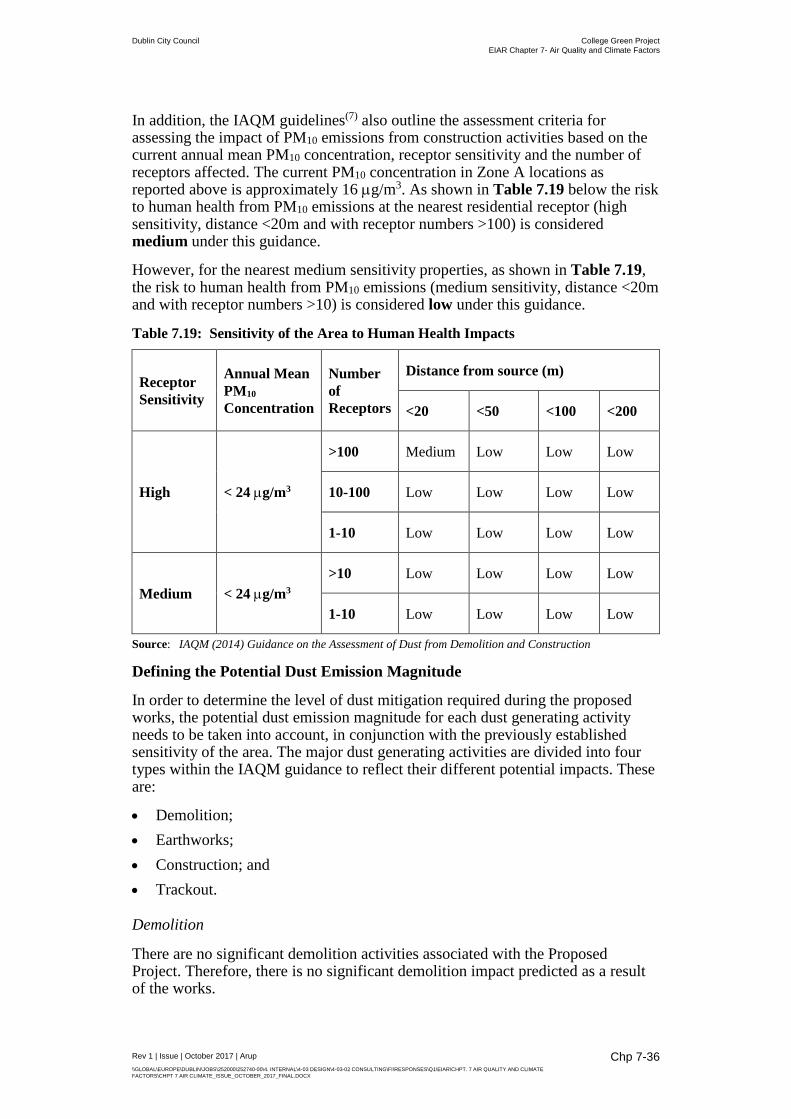
In addition, the IAQM guidelines(7) also outline the assessment criteria for assessing the impact of PM10 emissions from construction activities based on the current annual mean PM10 concentration, receptor sensitivity and the number of receptors affected. The current PM10 concentration in Zone A locations as reported above is approximately 16 µg/m3. As shown in Table 7.19 below the risk to human health from PM10 emissions at the nearest residential receptor (high sensitivity, distance <20m and with receptor numbers >100) is considered medium under this guidance.
However, for the nearest medium sensitivity properties, as shown in Table 7.19, the risk to human health from PM10 emissions (medium sensitivity, distance <20m and with receptor numbers >10) is considered low under this guidance.
Table 7.19: Sensitivity of the Area to Human Health Impacts
Receptor Sensitivity
Annual Mean PM10 Concentration
Number of Receptors
Distance from source (m)
<20 <50 <100 <200
High < 24 µg/m3
>100 Medium Low Low Low
10-100 Low Low Low Low
1-10 Low Low Low Low
Medium < 24 µg/m3 >10 Low Low Low Low
1-10 Low Low Low Low
Source: IAQM (2014) Guidance on the Assessment of Dust from Demolition and Construction
Defining the Potential Dust Emission Magnitude
In order to determine the level of dust mitigation required during the proposed works, the potential dust emission magnitude for each dust generating activity needs to be taken into account, in conjunction with the previously established sensitivity of the area. The major dust generating activities are divided into four types within the IAQM guidance to reflect their different potential impacts. These are:
• Demolition; • Earthworks; • Construction; and • Trackout.
Demolition
There are no significant demolition activities associated with the Proposed Project. Therefore, there is no significant demolition impact predicted as a result of the works.
Dublin City Council College Green Project EIAR Chapter 7- Air Quality and Climate Factors
Rev 1 | Issue | October 2017 | Arup \\GLOBAL\EUROPE\DUBLIN\JOBS\252000\252740-00\4. INTERNAL\4-03 DESIGN\4-03-02 CONSULTING\FI\RESPONSES\Q1\EIAR\CHPT. 7 AIR QUALITY AND CLIMATE FACTORS\CHPT 7 AIR CLIMATE_ISSUE_OCTOBER_2017_FINAL.DOCX
Chp 7-37
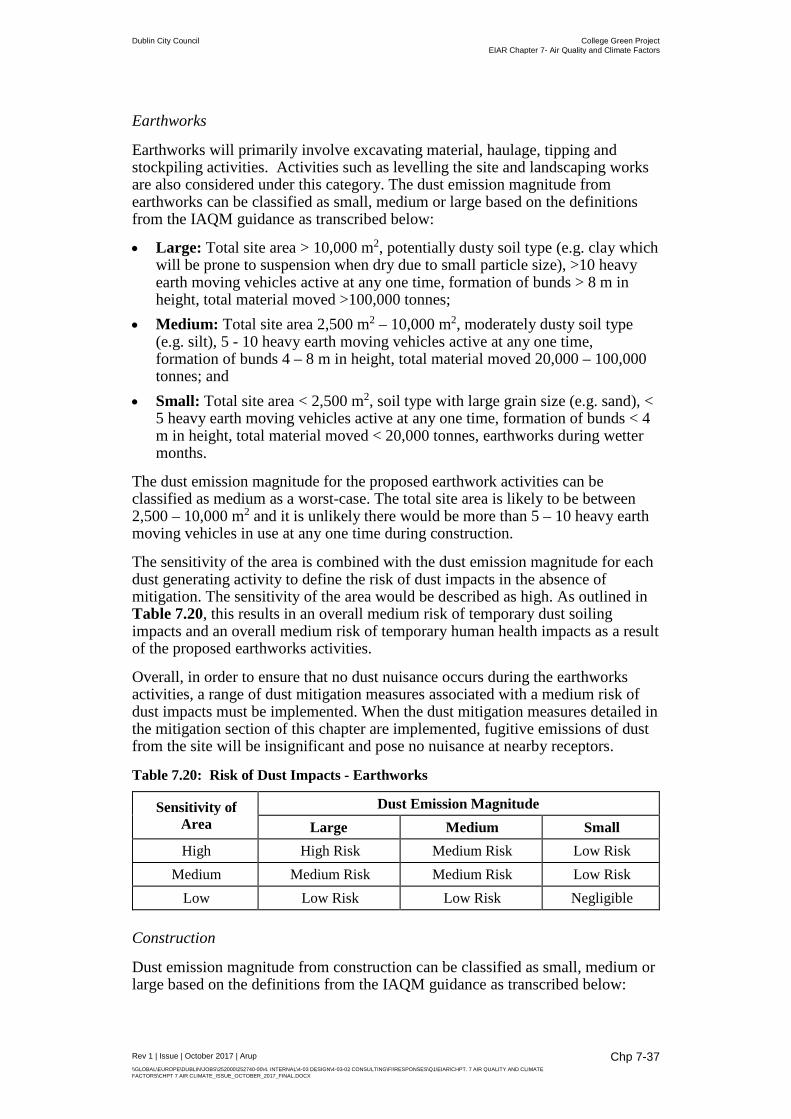
Earthworks
Earthworks will primarily involve excavating material, haulage, tipping and stockpiling activities. Activities such as levelling the site and landscaping works are also considered under this category. The dust emission magnitude from earthworks can be classified as small, medium or large based on the definitions from the IAQM guidance as transcribed below:
• Large: Total site area > 10,000 m2, potentially dusty soil type (e.g. clay which will be prone to suspension when dry due to small particle size), >10 heavy earth moving vehicles active at any one time, formation of bunds > 8 m in height, total material moved >100,000 tonnes;
• Medium: Total site area 2,500 m2 – 10,000 m2, moderately dusty soil type (e.g. silt), 5 - 10 heavy earth moving vehicles active at any one time, formation of bunds 4 – 8 m in height, total material moved 20,000 – 100,000 tonnes; and
• Small: Total site area < 2,500 m2, soil type with large grain size (e.g. sand), < 5 heavy earth moving vehicles active at any one time, formation of bunds < 4 m in height, total material moved < 20,000 tonnes, earthworks during wetter months.
The dust emission magnitude for the proposed earthwork activities can be classified as medium as a worst-case. The total site area is likely to be between 2,500 – 10,000 m2 and it is unlikely there would be more than 5 – 10 heavy earth moving vehicles in use at any one time during construction.
The sensitivity of the area is combined with the dust emission magnitude for each dust generating activity to define the risk of dust impacts in the absence of mitigation. The sensitivity of the area would be described as high. As outlined in Table 7.20, this results in an overall medium risk of temporary dust soiling impacts and an overall medium risk of temporary human health impacts as a result of the proposed earthworks activities.
Overall, in order to ensure that no dust nuisance occurs during the earthworks activities, a range of dust mitigation measures associated with a medium risk of dust impacts must be implemented. When the dust mitigation measures detailed in the mitigation section of this chapter are implemented, fugitive emissions of dust from the site will be insignificant and pose no nuisance at nearby receptors.
Table 7.20: Risk of Dust Impacts - Earthworks
Sensitivity of Area
Dust Emission Magnitude Large Medium Small
High High Risk Medium Risk Low Risk Medium Medium Risk Medium Risk Low Risk
Low Low Risk Low Risk Negligible Construction
Dust emission magnitude from construction can be classified as small, medium or large based on the definitions from the IAQM guidance as transcribed below:
Dublin City Council College Green Project EIAR Chapter 7- Air Quality and Climate Factors
Rev 1 | Issue | October 2017 | Arup \\GLOBAL\EUROPE\DUBLIN\JOBS\252000\252740-00\4. INTERNAL\4-03 DESIGN\4-03-02 CONSULTING\FI\RESPONSES\Q1\EIAR\CHPT. 7 AIR QUALITY AND CLIMATE FACTORS\CHPT 7 AIR CLIMATE_ISSUE_OCTOBER_2017_FINAL.DOCX
Chp 7-38
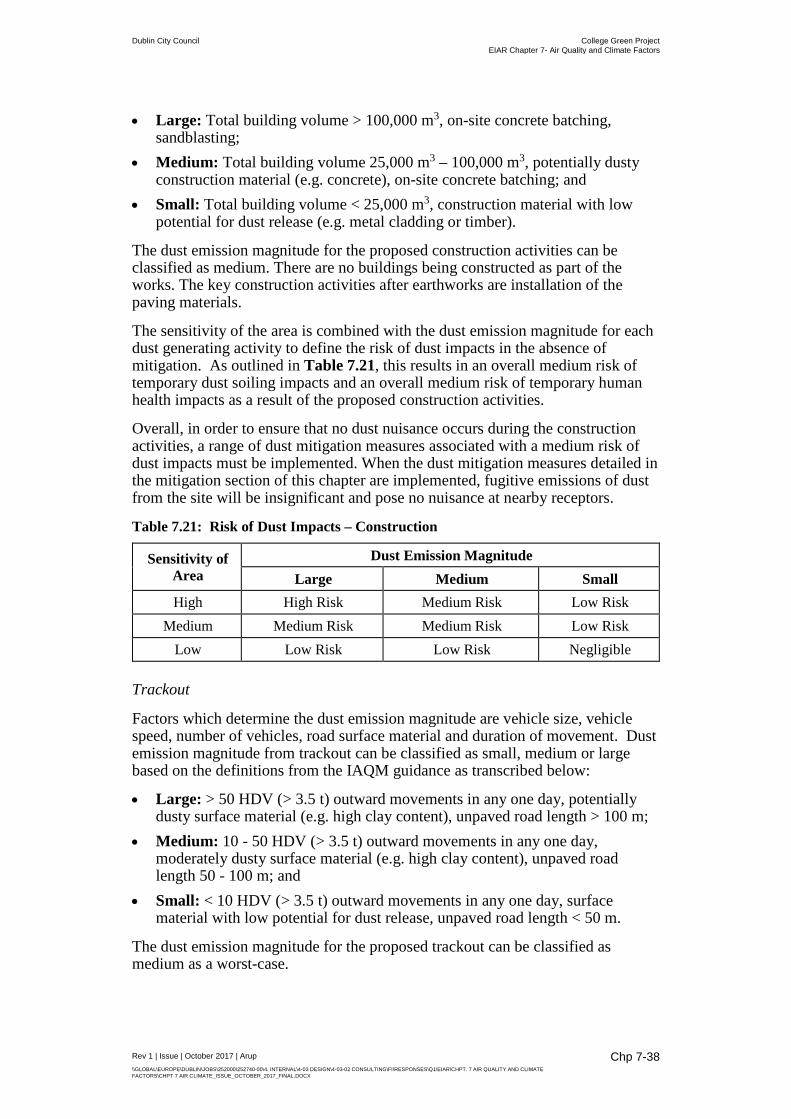
• Large: Total building volume > 100,000 m3, on-site concrete batching, sandblasting;
• Medium: Total building volume 25,000 m3 – 100,000 m3, potentially dusty construction material (e.g. concrete), on-site concrete batching; and
• Small: Total building volume < 25,000 m3, construction material with low potential for dust release (e.g. metal cladding or timber).
The dust emission magnitude for the proposed construction activities can be classified as medium. There are no buildings being constructed as part of the works. The key construction activities after earthworks are installation of the paving materials.
The sensitivity of the area is combined with the dust emission magnitude for each dust generating activity to define the risk of dust impacts in the absence of mitigation. As outlined in Table 7.21, this results in an overall medium risk of temporary dust soiling impacts and an overall medium risk of temporary human health impacts as a result of the proposed construction activities.
Overall, in order to ensure that no dust nuisance occurs during the construction activities, a range of dust mitigation measures associated with a medium risk of dust impacts must be implemented. When the dust mitigation measures detailed in the mitigation section of this chapter are implemented, fugitive emissions of dust from the site will be insignificant and pose no nuisance at nearby receptors.
Table 7.21: Risk of Dust Impacts – Construction
Sensitivity of Area
Dust Emission Magnitude Large Medium Small
High High Risk Medium Risk Low Risk Medium Medium Risk Medium Risk Low Risk
Low Low Risk Low Risk Negligible Trackout
Factors which determine the dust emission magnitude are vehicle size, vehicle speed, number of vehicles, road surface material and duration of movement. Dust emission magnitude from trackout can be classified as small, medium or large based on the definitions from the IAQM guidance as transcribed below:
• Large: > 50 HDV (> 3.5 t) outward movements in any one day, potentially dusty surface material (e.g. high clay content), unpaved road length > 100 m;
• Medium: 10 - 50 HDV (> 3.5 t) outward movements in any one day, moderately dusty surface material (e.g. high clay content), unpaved road length 50 - 100 m; and
• Small: < 10 HDV (> 3.5 t) outward movements in any one day, surface material with low potential for dust release, unpaved road length < 50 m.
The dust emission magnitude for the proposed trackout can be classified as medium as a worst-case.
Dublin City Council College Green Project EIAR Chapter 7- Air Quality and Climate Factors
Rev 1 | Issue | October 2017 | Arup \\GLOBAL\EUROPE\DUBLIN\JOBS\252000\252740-00\4. INTERNAL\4-03 DESIGN\4-03-02 CONSULTING\FI\RESPONSES\Q1\EIAR\CHPT. 7 AIR QUALITY AND CLIMATE FACTORS\CHPT 7 AIR CLIMATE_ISSUE_OCTOBER_2017_FINAL.DOCX
Chp 7-39
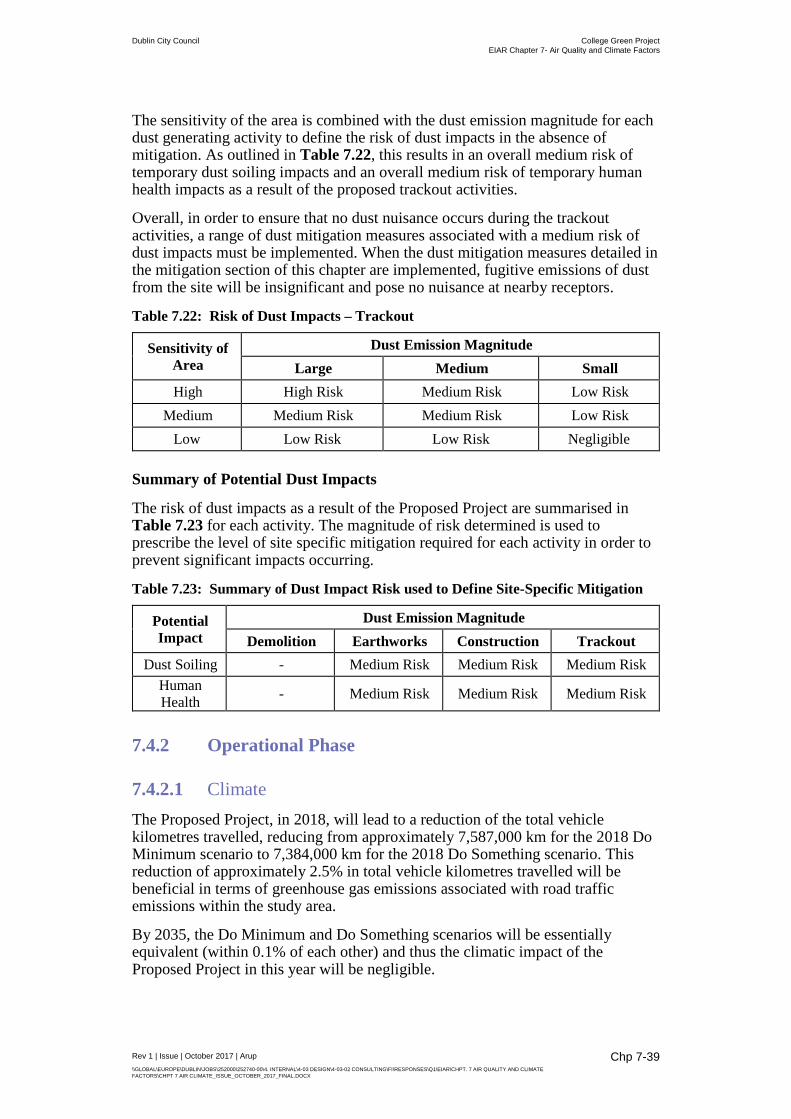
The sensitivity of the area is combined with the dust emission magnitude for each dust generating activity to define the risk of dust impacts in the absence of mitigation. As outlined in Table 7.22, this results in an overall medium risk of temporary dust soiling impacts and an overall medium risk of temporary human health impacts as a result of the proposed trackout activities.
Overall, in order to ensure that no dust nuisance occurs during the trackout activities, a range of dust mitigation measures associated with a medium risk of dust impacts must be implemented. When the dust mitigation measures detailed in the mitigation section of this chapter are implemented, fugitive emissions of dust from the site will be insignificant and pose no nuisance at nearby receptors.
Table 7.22: Risk of Dust Impacts – Trackout
Sensitivity of Area
Dust Emission Magnitude Large Medium Small
High High Risk Medium Risk Low Risk Medium Medium Risk Medium Risk Low Risk
Low Low Risk Low Risk Negligible Summary of Potential Dust Impacts
The risk of dust impacts as a result of the Proposed Project are summarised in Table 7.23 for each activity. The magnitude of risk determined is used to prescribe the level of site specific mitigation required for each activity in order to prevent significant impacts occurring.
Table 7.23: Summary of Dust Impact Risk used to Define Site-Specific Mitigation
Potential Impact
Dust Emission Magnitude Demolition Earthworks Construction Trackout
Dust Soiling - Medium Risk Medium Risk Medium Risk Human Health - Medium Risk Medium Risk Medium Risk
7.4.2 Operational Phase
7.4.2.1 Climate The Proposed Project, in 2018, will lead to a reduction of the total vehicle kilometres travelled, reducing from approximately 7,587,000 km for the 2018 Do Minimum scenario to 7,384,000 km for the 2018 Do Something scenario. This reduction of approximately 2.5% in total vehicle kilometres travelled will be beneficial in terms of greenhouse gas emissions associated with road traffic emissions within the study area.
By 2035, the Do Minimum and Do Something scenarios will be essentially equivalent (within 0.1% of each other) and thus the climatic impact of the Proposed Project in this year will be negligible.
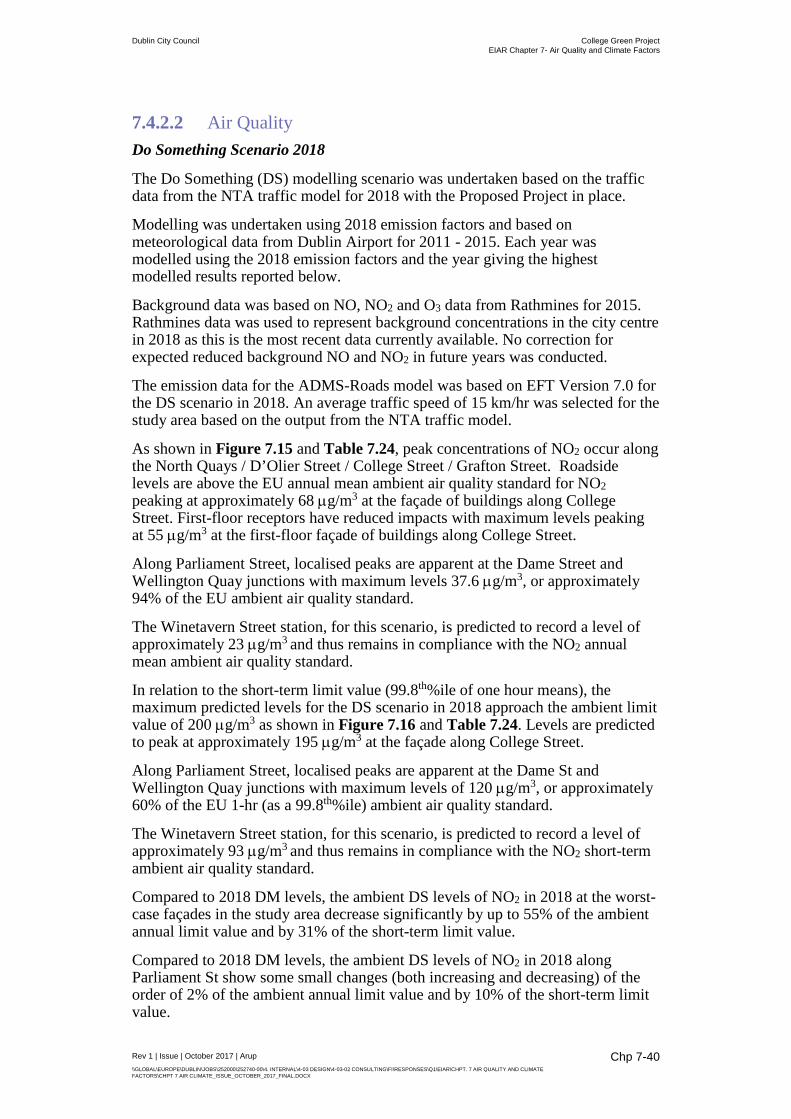
Dublin City Council College Green Project EIAR Chapter 7- Air Quality and Climate Factors
Rev 1 | Issue | October 2017 | Arup \\GLOBAL\EUROPE\DUBLIN\JOBS\252000\252740-00\4. INTERNAL\4-03 DESIGN\4-03-02 CONSULTING\FI\RESPONSES\Q1\EIAR\CHPT. 7 AIR QUALITY AND CLIMATE FACTORS\CHPT 7 AIR CLIMATE_ISSUE_OCTOBER_2017_FINAL.DOCX
Chp 7-40
7.4.2.2 Air Quality Do Something Scenario 2018
The Do Something (DS) modelling scenario was undertaken based on the traffic data from the NTA traffic model for 2018 with the Proposed Project in place.
Modelling was undertaken using 2018 emission factors and based on meteorological data from Dublin Airport for 2011 - 2015. Each year was modelled using the 2018 emission factors and the year giving the highest modelled results reported below.
Background data was based on NO, NO2 and O3 data from Rathmines for 2015. Rathmines data was used to represent background concentrations in the city centre in 2018 as this is the most recent data currently available. No correction for expected reduced background NO and NO2 in future years was conducted.
The emission data for the ADMS-Roads model was based on EFT Version 7.0 for the DS scenario in 2018. An average traffic speed of 15 km/hr was selected for the study area based on the output from the NTA traffic model.
As shown in Figure 7.15 and Table 7.24, peak concentrations of NO2 occur along the North Quays / D’Olier Street / College Street / Grafton Street. Roadside levels are above the EU annual mean ambient air quality standard for NO2 peaking at approximately 68 µg/m3 at the façade of buildings along College Street. First-floor receptors have reduced impacts with maximum levels peaking at 55 µg/m3 at the first-floor façade of buildings along College Street.
Along Parliament Street, localised peaks are apparent at the Dame Street and Wellington Quay junctions with maximum levels 37.6 µg/m3, or approximately 94% of the EU ambient air quality standard.
The Winetavern Street station, for this scenario, is predicted to record a level of approximately 23 µg/m3 and thus remains in compliance with the NO2 annual mean ambient air quality standard.
In relation to the short-term limit value (99.8th%ile of one hour means), the maximum predicted levels for the DS scenario in 2018 approach the ambient limit value of 200 µg/m3 as shown in Figure 7.16 and Table 7.24. Levels are predicted to peak at approximately 195 µg/m3 at the façade along College Street.
Along Parliament Street, localised peaks are apparent at the Dame St and Wellington Quay junctions with maximum levels of 120 µg/m3, or approximately 60% of the EU 1-hr (as a 99.8th%ile) ambient air quality standard.
The Winetavern Street station, for this scenario, is predicted to record a level of approximately 93 µg/m3 and thus remains in compliance with the NO2 short-term ambient air quality standard.
Compared to 2018 DM levels, the ambient DS levels of NO2 in 2018 at the worst-case façades in the study area decrease significantly by up to 55% of the ambient annual limit value and by 31% of the short-term limit value.
Compared to 2018 DM levels, the ambient DS levels of NO2 in 2018 along Parliament St show some small changes (both increasing and decreasing) of the order of 2% of the ambient annual limit value and by 10% of the short-term limit value.
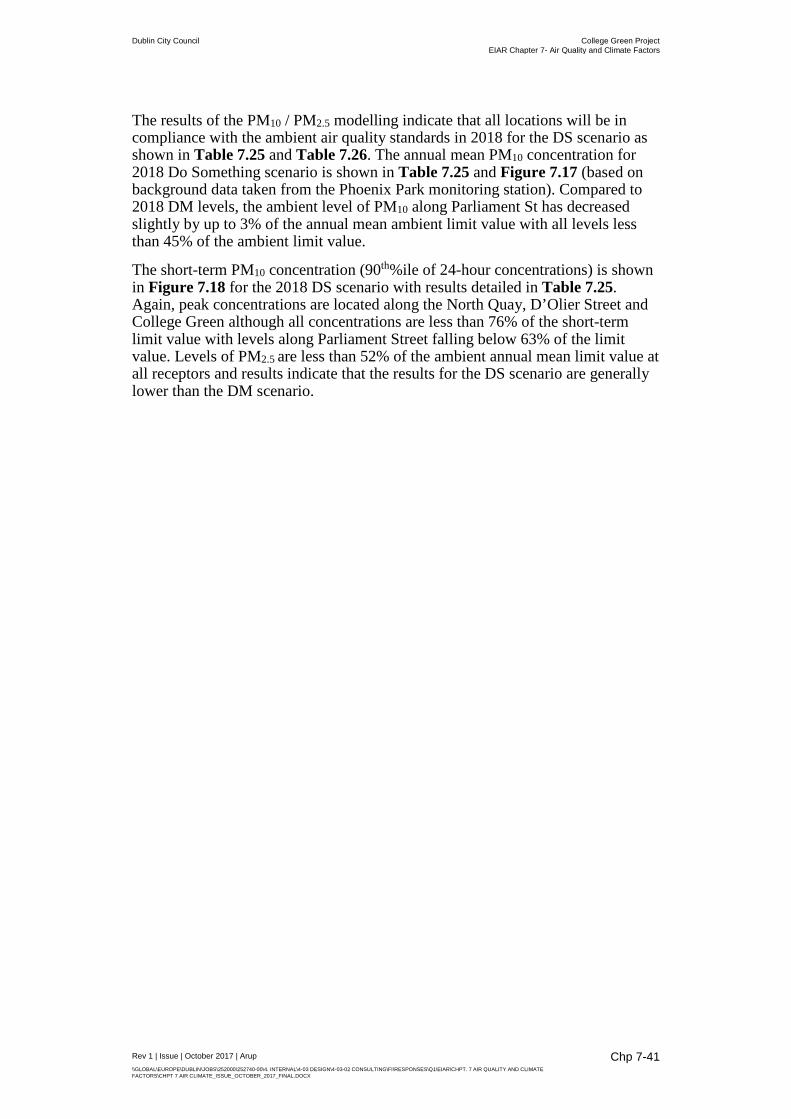
Dublin City Council College Green Project EIAR Chapter 7- Air Quality and Climate Factors
Rev 1 | Issue | October 2017 | Arup \\GLOBAL\EUROPE\DUBLIN\JOBS\252000\252740-00\4. INTERNAL\4-03 DESIGN\4-03-02 CONSULTING\FI\RESPONSES\Q1\EIAR\CHPT. 7 AIR QUALITY AND CLIMATE FACTORS\CHPT 7 AIR CLIMATE_ISSUE_OCTOBER_2017_FINAL.DOCX
Chp 7-41
The results of the PM10 / PM2.5 modelling indicate that all locations will be in compliance with the ambient air quality standards in 2018 for the DS scenario as shown in Table 7.25 and Table 7.26. The annual mean PM10 concentration for 2018 Do Something scenario is shown in Table 7.25 and Figure 7.17 (based on background data taken from the Phoenix Park monitoring station). Compared to 2018 DM levels, the ambient level of PM10 along Parliament St has decreased slightly by up to 3% of the annual mean ambient limit value with all levels less than 45% of the ambient limit value.
The short-term PM10 concentration (90th%ile of 24-hour concentrations) is shown in Figure 7.18 for the 2018 DS scenario with results detailed in Table 7.25. Again, peak concentrations are located along the North Quay, D’Olier Street and College Green although all concentrations are less than 76% of the short-term limit value with levels along Parliament Street falling below 63% of the limit value. Levels of PM2.5 are less than 52% of the ambient annual mean limit value at all receptors and results indicate that the results for the DS scenario are generally lower than the DM scenario.
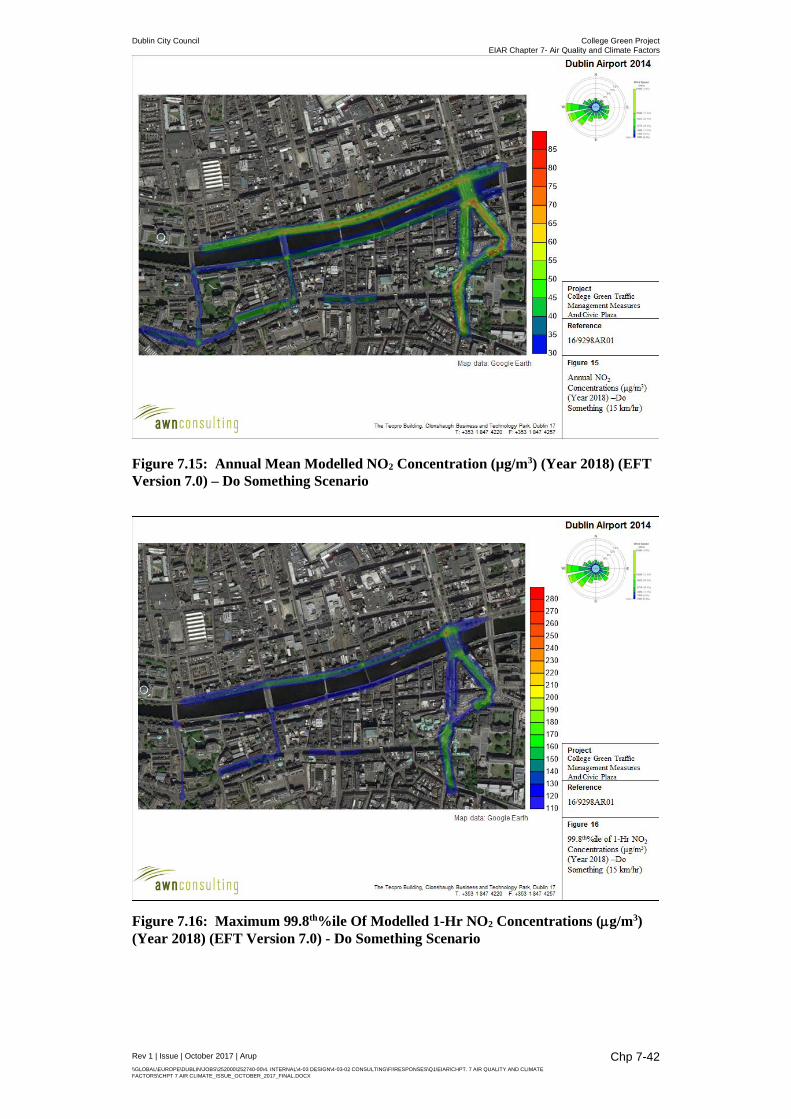
Dublin City Council College Green Project EIAR Chapter 7- Air Quality and Climate Factors
Rev 1 | Issue | October 2017 | Arup \\GLOBAL\EUROPE\DUBLIN\JOBS\252000\252740-00\4. INTERNAL\4-03 DESIGN\4-03-02 CONSULTING\FI\RESPONSES\Q1\EIAR\CHPT. 7 AIR QUALITY AND CLIMATE FACTORS\CHPT 7 AIR CLIMATE_ISSUE_OCTOBER_2017_FINAL.DOCX
Chp 7-42
Figure 7.15: Annual Mean Modelled NO2 Concentration (µg/m3) (Year 2018) (EFT Version 7.0) – Do Something Scenario
Figure 7.16: Maximum 99.8th%ile Of Modelled 1-Hr NO2 Concentrations (µg/m3) (Year 2018) (EFT Version 7.0) - Do Something Scenario
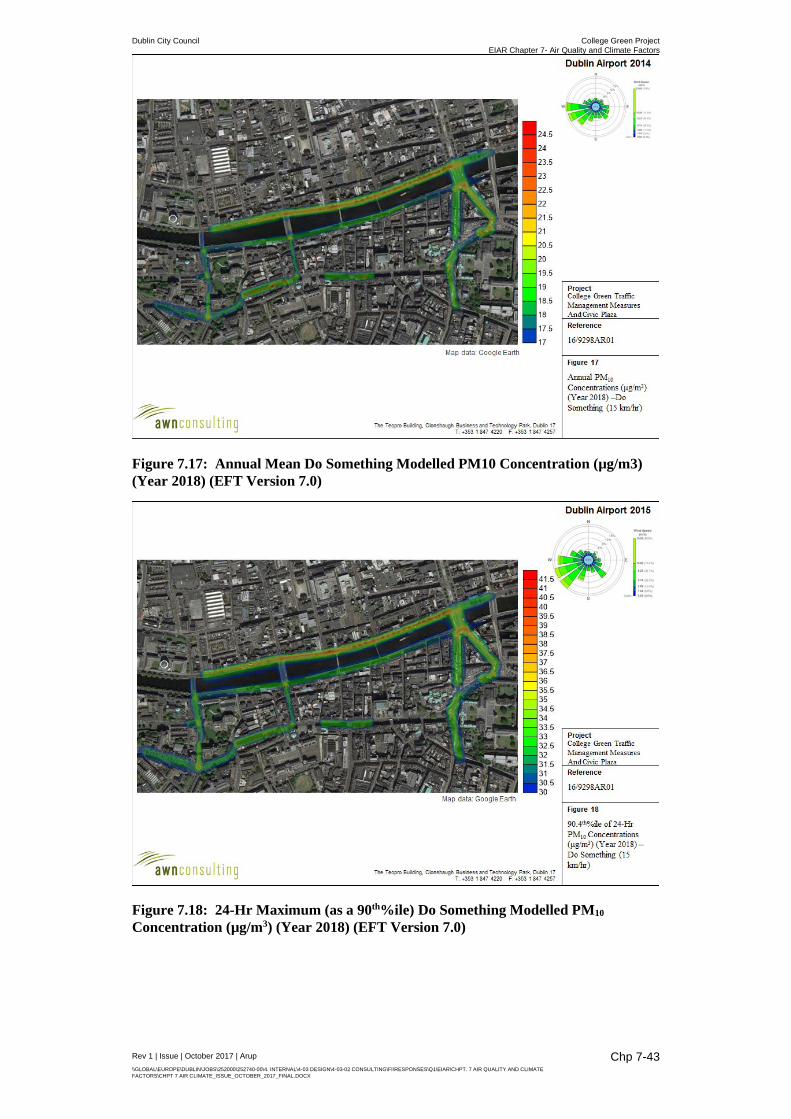
Dublin City Council College Green Project EIAR Chapter 7- Air Quality and Climate Factors
Rev 1 | Issue | October 2017 | Arup \\GLOBAL\EUROPE\DUBLIN\JOBS\252000\252740-00\4. INTERNAL\4-03 DESIGN\4-03-02 CONSULTING\FI\RESPONSES\Q1\EIAR\CHPT. 7 AIR QUALITY AND CLIMATE FACTORS\CHPT 7 AIR CLIMATE_ISSUE_OCTOBER_2017_FINAL.DOCX
Chp 7-43
Figure 7.17: Annual Mean Do Something Modelled PM10 Concentration (µg/m3) (Year 2018) (EFT Version 7.0)
Figure 7.18: 24-Hr Maximum (as a 90th%ile) Do Something Modelled PM10
Concentration (µg/m3) (Year 2018) (EFT Version 7.0)

Dublin City Council College Green Project EIAR Chapter 7- Air Quality and Climate Factors
Rev 1 | Issue | October 2017 | Arup \\GLOBAL\EUROPE\DUBLIN\JOBS\252000\252740-00\4. INTERNAL\4-03 DESIGN\4-03-02 CONSULTING\FI\RESPONSES\Q1\EIAR\CHPT. 7 AIR QUALITY AND CLIMATE FACTORS\CHPT 7 AIR CLIMATE_ISSUE_OCTOBER_2017_FINAL.DOCX
Chp 7-44
Table 7.24: ADMS-Roads Air Modelling Results - Nitrogen Dioxide (NO2) 2018 Do Something
Location Winetavern St Parliament St Maximum ResultNote 1
Scenario Meteorological
Speed Annual NO2 1-Hr
Annual NO2 1-Hr
Annual NO2 1-Hr
DS 2018 - Ground Level
Receptor (EFT Version
7)
2011
15 km/hr
22.5 91.2 36.9 117.1 65.9 190.8 2012 22.5 89.6 37.6 107.8 66.8 185.7 2013 22.5 90.1 36.9 111.9 67.4 187.7 2014 22.7 92.3 37.6 108.2 68.3 188.6 2015 22.0 92.5 35.4 121.0 63.3 195.9
DS 2018 – First-floor Receptor
(EFT Version 7)
2011
15 km/hr
22.5 91.2 35.2 112.2 53.4 151.0 2012 22.5 89.6 35.7 105.1 55.2 147.8 2013 22.5 90.1 35.1 108.4 53.2 151.8 2014 22.7 92.3 35.8 103.9 54.4 151.1 2015 22.0 92.5 33.8 113.9 51.5 158.3
Ambient Air Quality Limit Value (µg/m3)
40 200 40 200 40 200 Note 1 Maximum result at the façade of any building in the study area.
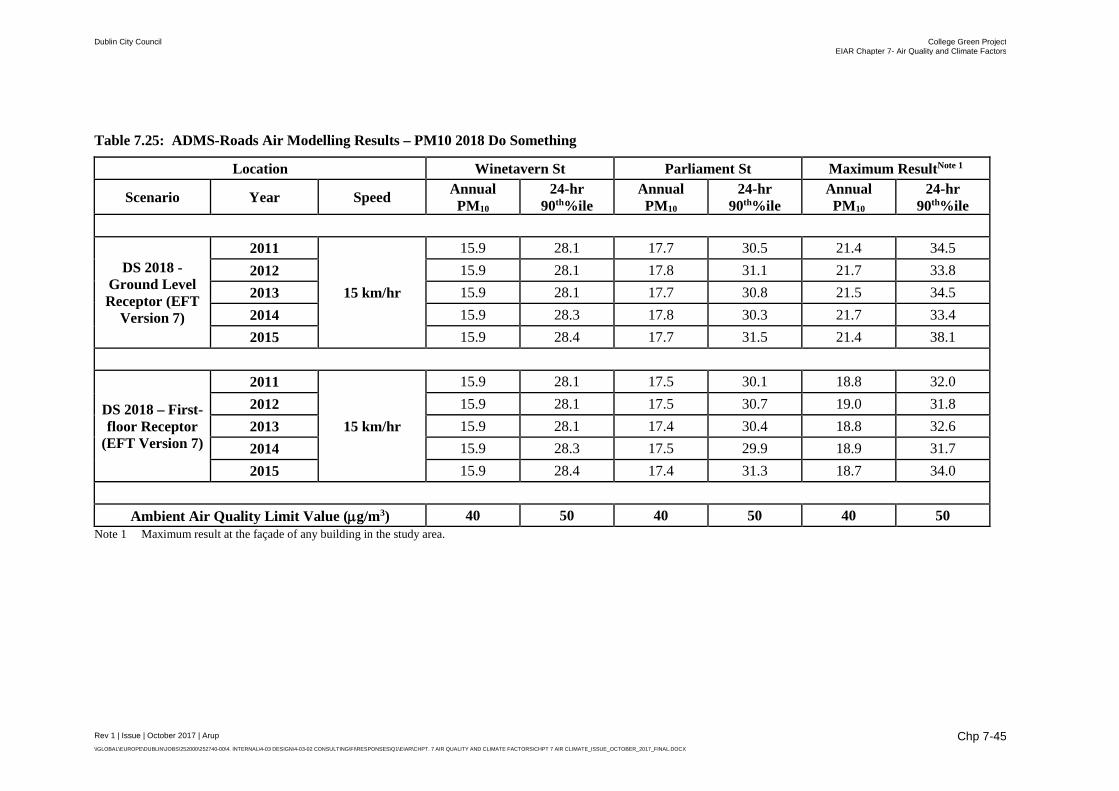
Dublin City Council College Green Project EIAR Chapter 7- Air Quality and Climate Factors
Rev 1 | Issue | October 2017 | Arup \\GLOBAL\EUROPE\DUBLIN\JOBS\252000\252740-00\4. INTERNAL\4-03 DESIGN\4-03-02 CONSULTING\FI\RESPONSES\Q1\EIAR\CHPT. 7 AIR QUALITY AND CLIMATE FACTORS\CHPT 7 AIR CLIMATE_ISSUE_OCTOBER_2017_FINAL.DOCX
Chp 7-45
Table 7.25: ADMS-Roads Air Modelling Results – PM10 2018 Do Something
Location Winetavern St Parliament St Maximum ResultNote 1
Scenario Year Speed Annual PM10
24-hr 90th%ile
Annual PM10
24-hr 90th%ile
Annual PM10
24-hr 90th%ile
DS 2018 - Ground Level Receptor (EFT
Version 7)
2011
15 km/hr
15.9 28.1 17.7 30.5 21.4 34.5 2012 15.9 28.1 17.8 31.1 21.7 33.8 2013 15.9 28.1 17.7 30.8 21.5 34.5 2014 15.9 28.3 17.8 30.3 21.7 33.4 2015 15.9 28.4 17.7 31.5 21.4 38.1
DS 2018 – First-floor Receptor
(EFT Version 7)
2011
15 km/hr
15.9 28.1 17.5 30.1 18.8 32.0 2012 15.9 28.1 17.5 30.7 19.0 31.8 2013 15.9 28.1 17.4 30.4 18.8 32.6 2014 15.9 28.3 17.5 29.9 18.9 31.7 2015 15.9 28.4 17.4 31.3 18.7 34.0
Ambient Air Quality Limit Value (µg/m3) 40 50 40 50 40 50
Note 1 Maximum result at the façade of any building in the study area.
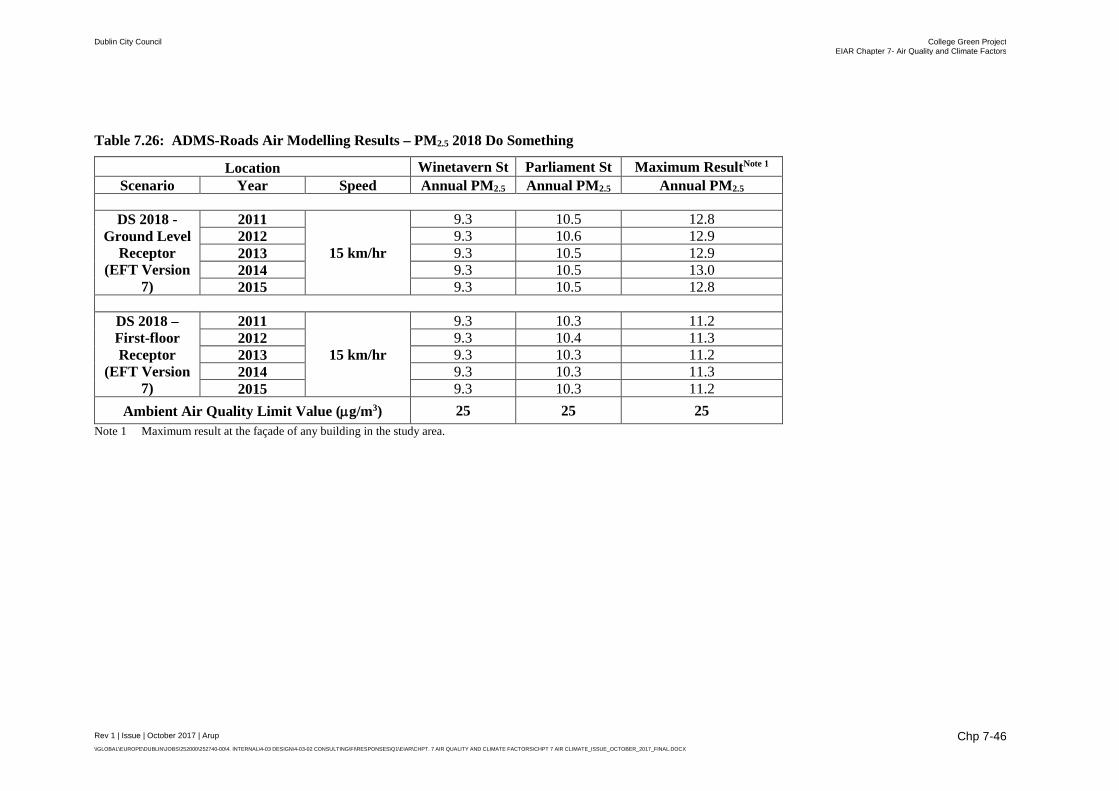
Dublin City Council College Green Project EIAR Chapter 7- Air Quality and Climate Factors
Rev 1 | Issue | October 2017 | Arup \\GLOBAL\EUROPE\DUBLIN\JOBS\252000\252740-00\4. INTERNAL\4-03 DESIGN\4-03-02 CONSULTING\FI\RESPONSES\Q1\EIAR\CHPT. 7 AIR QUALITY AND CLIMATE FACTORS\CHPT 7 AIR CLIMATE_ISSUE_OCTOBER_2017_FINAL.DOCX
Chp 7-46
Table 7.26: ADMS-Roads Air Modelling Results – PM2.5 2018 Do Something
Location Winetavern St Parliament St Maximum ResultNote 1
Scenario Year Speed Annual PM2.5 Annual PM2.5 Annual PM2.5
DS 2018 - Ground Level
Receptor (EFT Version
7)
2011
15 km/hr
9.3 10.5 12.8 2012 9.3 10.6 12.9 2013 9.3 10.5 12.9 2014 9.3 10.5 13.0 2015 9.3 10.5 12.8
DS 2018 – First-floor Receptor
(EFT Version 7)
2011
15 km/hr
9.3 10.3 11.2 2012 9.3 10.4 11.3 2013 9.3 10.3 11.2 2014 9.3 10.3 11.3 2015 9.3 10.3 11.2
Ambient Air Quality Limit Value (µg/m3) 25 25 25 Note 1 Maximum result at the façade of any building in the study area.
Dublin City Council College Green Project EIAR Chapter 7- Air Quality and Climate Factors
Rev 1 | Issue | October 2017 | Arup \\GLOBAL\EUROPE\DUBLIN\JOBS\252000\252740-00\4. INTERNAL\4-03 DESIGN\4-03-02 CONSULTING\FI\RESPONSES\Q1\EIAR\CHPT. 7 AIR QUALITY AND CLIMATE FACTORS\CHPT 7 AIR CLIMATE_ISSUE_OCTOBER_2017_FINAL.DOCX
Chp 7-47
Do Something Scenario 2035
The Do Something (DS) modelling scenario was undertaken based on the traffic data from the NTA traffic model for 2035 with the Proposed Project in place.
Modelling was undertaken using 2030 emission factors and based on meteorological data from Dublin Airport for 2011 - 2015. Each year was modelled using the 2030 emission factors and the year giving the highest modelled results reported below.
Background data was based on NO, NO2 and O3 data from Rathmines for 2015. Rathmines data was used to represent background concentrations in the city centre in 2030 as this is the most recent data currently available. No correction for expected reduced background NO and NO2 in future years was conducted.
The emission data for the ADMS-Roads model was based on EFT Version 7.0 for 2030 as this is the upper limit to the emission factor years in the EFT model. An average traffic speed of 15 km/hr was selected for the study area based on the output from the NTA traffic model.
As shown in Figure 7.19 and Table 7.27, peak concentrations of NO2 occur along the North Quays, D’Olier Street / College Street and Dame Street / Lord Edward Street. Roadside levels are above the EU annual mean ambient air quality standard for NO2 peaking at approximately 29.5 µg/m3 at the façade of buildings along Ormond Quay Lower with a reduced impact at first-floor level.
Along Parliament Street, localised peaks are apparent at the Dame St and Wellington Quay junctions with maximum levels of 24 µg/m3, or approximately 61% of the EU ambient air quality standard with again a small reduction at first-floor level.
The Winetavern Street station, for this scenario, is predicted to record a level of approximately 20 µg/m3 and thus remains in compliance with the NO2 annual mean ambient air quality standard.
In relation to the short-term limit value (99.8th%ile of one hour means), the maximum predicted level for the DS scenario in 2035 is below the ambient limit value of 200 µg/m3 as shown in Figure 7.20 and Table 7.27. Levels are predicted to peak at approximately 106 µg/m3 at the façade along Ormond Quay Lower.
Along Parliament Street, localised peaks are apparent at the Dame Street and Wellington Quay junctions with maximum levels of 96 µg/m3, or approximately 48% of the EU 1-hr (as a 99.8th%ile) ambient air quality standard.
The Winetavern Street station, for this scenario, is predicted to record a level of approximately 90 µg/m3 and thus remains in compliance with the NO2 short-term ambient air quality standard.
Compared to 2035 DM levels, the ambient DS levels of NO2 in 2035 at the worst-case façades in the study area have increased slightly by up to 2% of the ambient annual limit value and by 1% of the short-term limit values. Compared to 2035 DM levels, the ambient DS levels of NO2 in 2035 along Parliament Street have remained essentially unchanged.
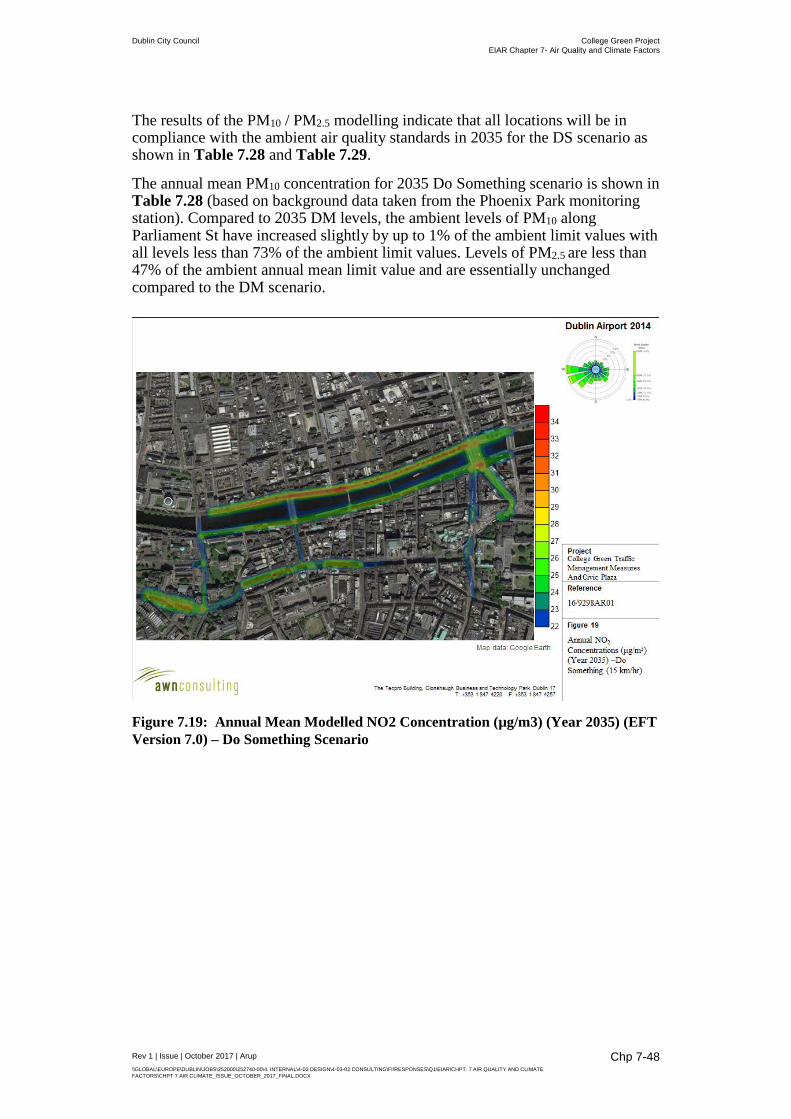
Dublin City Council College Green Project EIAR Chapter 7- Air Quality and Climate Factors
Rev 1 | Issue | October 2017 | Arup \\GLOBAL\EUROPE\DUBLIN\JOBS\252000\252740-00\4. INTERNAL\4-03 DESIGN\4-03-02 CONSULTING\FI\RESPONSES\Q1\EIAR\CHPT. 7 AIR QUALITY AND CLIMATE FACTORS\CHPT 7 AIR CLIMATE_ISSUE_OCTOBER_2017_FINAL.DOCX
Chp 7-48
The results of the PM10 / PM2.5 modelling indicate that all locations will be in compliance with the ambient air quality standards in 2035 for the DS scenario as shown in Table 7.28 and Table 7.29.
The annual mean PM10 concentration for 2035 Do Something scenario is shown in Table 7.28 (based on background data taken from the Phoenix Park monitoring station). Compared to 2035 DM levels, the ambient levels of PM10 along Parliament St have increased slightly by up to 1% of the ambient limit values with all levels less than 73% of the ambient limit values. Levels of PM2.5 are less than 47% of the ambient annual mean limit value and are essentially unchanged compared to the DM scenario.
Figure 7.19: Annual Mean Modelled NO2 Concentration (µg/m3) (Year 2035) (EFT Version 7.0) – Do Something Scenario
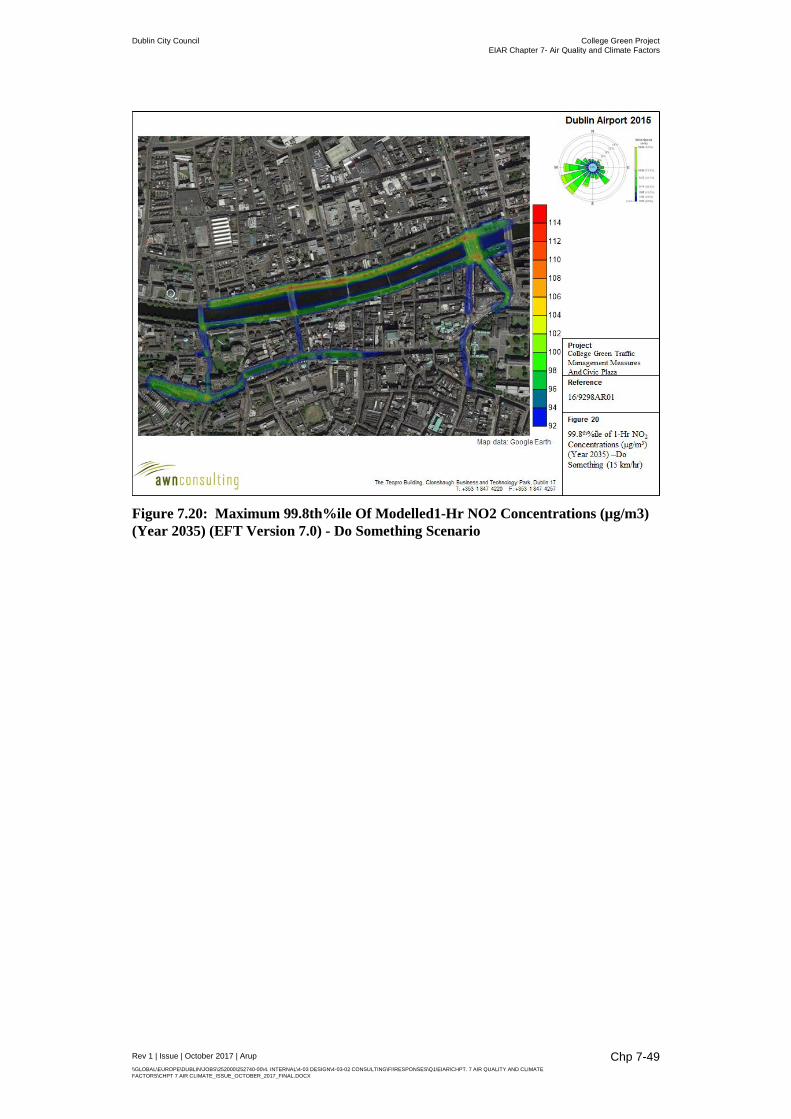
Dublin City Council College Green Project EIAR Chapter 7- Air Quality and Climate Factors
Rev 1 | Issue | October 2017 | Arup \\GLOBAL\EUROPE\DUBLIN\JOBS\252000\252740-00\4. INTERNAL\4-03 DESIGN\4-03-02 CONSULTING\FI\RESPONSES\Q1\EIAR\CHPT. 7 AIR QUALITY AND CLIMATE FACTORS\CHPT 7 AIR CLIMATE_ISSUE_OCTOBER_2017_FINAL.DOCX
Chp 7-49
Figure 7.20: Maximum 99.8th%ile Of Modelled1-Hr NO2 Concentrations (µg/m3) (Year 2035) (EFT Version 7.0) - Do Something Scenario
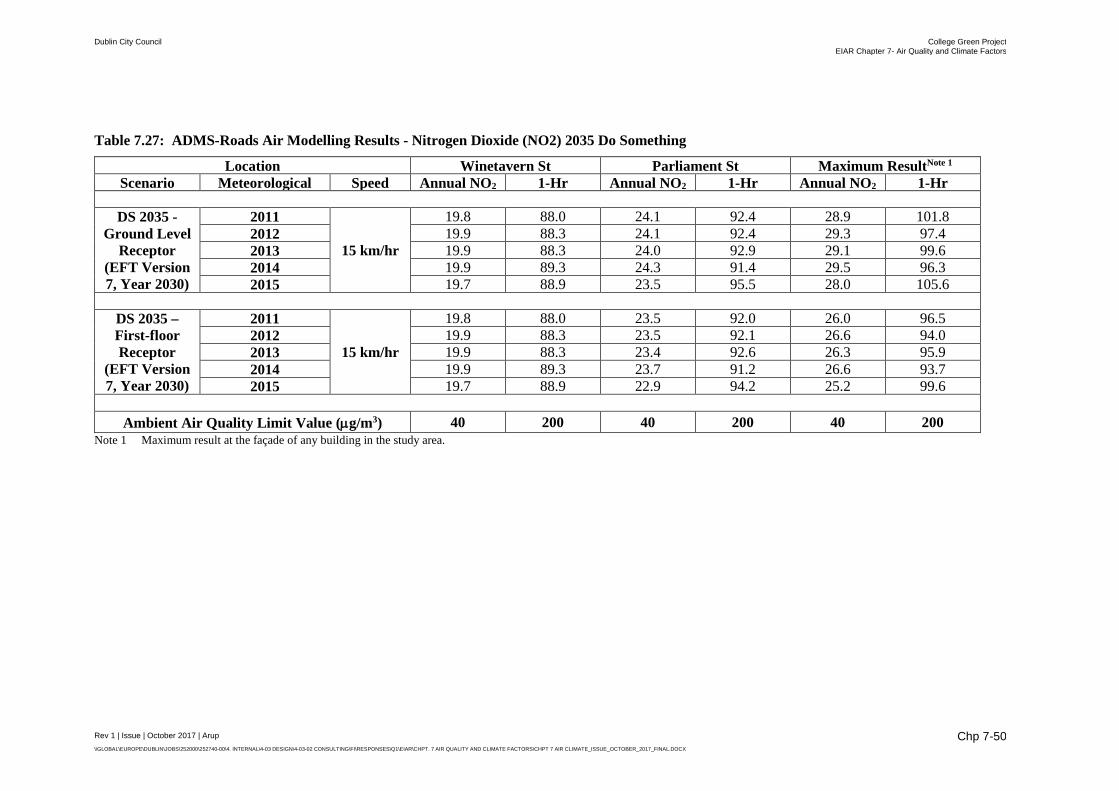
Dublin City Council College Green Project EIAR Chapter 7- Air Quality and Climate Factors
Rev 1 | Issue | October 2017 | Arup \\GLOBAL\EUROPE\DUBLIN\JOBS\252000\252740-00\4. INTERNAL\4-03 DESIGN\4-03-02 CONSULTING\FI\RESPONSES\Q1\EIAR\CHPT. 7 AIR QUALITY AND CLIMATE FACTORS\CHPT 7 AIR CLIMATE_ISSUE_OCTOBER_2017_FINAL.DOCX
Chp 7-50
Table 7.27: ADMS-Roads Air Modelling Results - Nitrogen Dioxide (NO2) 2035 Do Something
Location Winetavern St Parliament St Maximum ResultNote 1
Scenario Meteorological
Speed Annual NO2 1-Hr
Annual NO2 1-Hr
Annual NO2 1-Hr
DS 2035 - Ground Level
Receptor (EFT Version 7, Year 2030)
2011
15 km/hr
19.8 88.0 24.1 92.4 28.9 101.8 2012 19.9 88.3 24.1 92.4 29.3 97.4 2013 19.9 88.3 24.0 92.9 29.1 99.6 2014 19.9 89.3 24.3 91.4 29.5 96.3 2015 19.7 88.9 23.5 95.5 28.0 105.6
DS 2035 – First-floor Receptor
(EFT Version 7, Year 2030)
2011
15 km/hr
19.8 88.0 23.5 92.0 26.0 96.5 2012 19.9 88.3 23.5 92.1 26.6 94.0 2013 19.9 88.3 23.4 92.6 26.3 95.9 2014 19.9 89.3 23.7 91.2 26.6 93.7 2015 19.7 88.9 22.9 94.2 25.2 99.6
Ambient Air Quality Limit Value (µg/m3) 40 200 40 200 40 200
Note 1 Maximum result at the façade of any building in the study area.
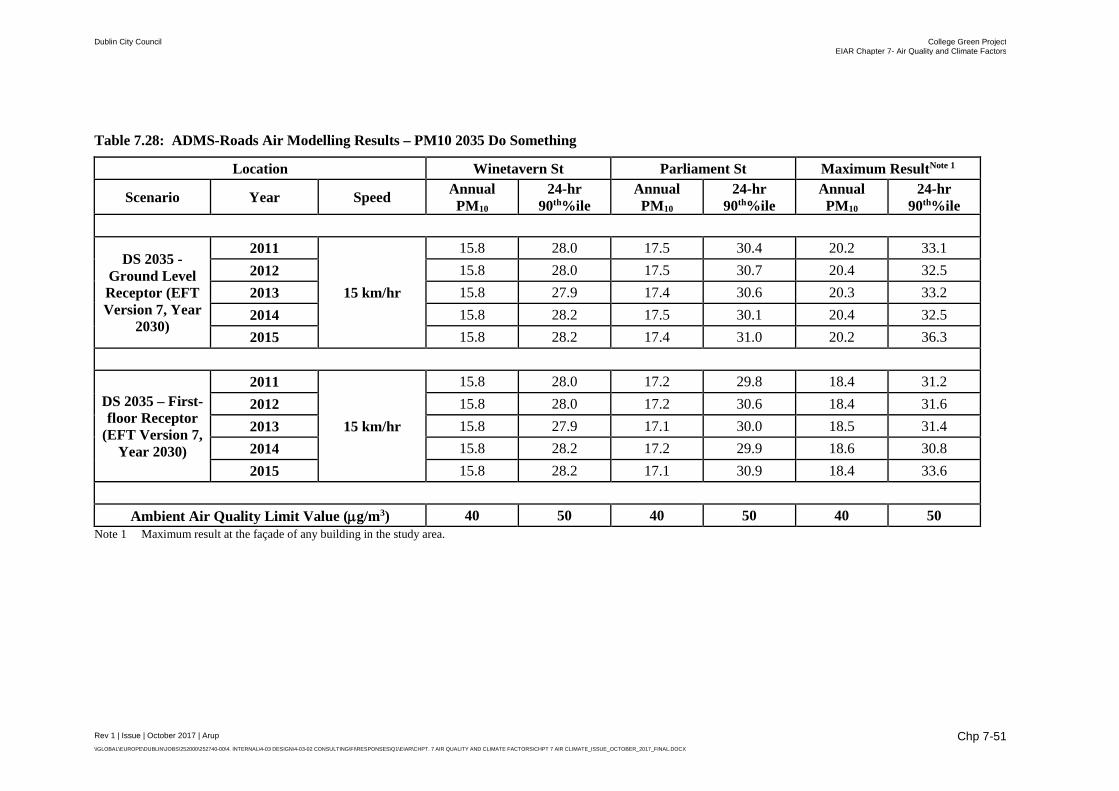
Dublin City Council College Green Project EIAR Chapter 7- Air Quality and Climate Factors
Rev 1 | Issue | October 2017 | Arup \\GLOBAL\EUROPE\DUBLIN\JOBS\252000\252740-00\4. INTERNAL\4-03 DESIGN\4-03-02 CONSULTING\FI\RESPONSES\Q1\EIAR\CHPT. 7 AIR QUALITY AND CLIMATE FACTORS\CHPT 7 AIR CLIMATE_ISSUE_OCTOBER_2017_FINAL.DOCX
Chp 7-51
Table 7.28: ADMS-Roads Air Modelling Results – PM10 2035 Do Something
Location Winetavern St Parliament St Maximum ResultNote 1
Scenario Year Speed Annual PM10
24-hr 90th%ile
Annual PM10
24-hr 90th%ile
Annual PM10
24-hr 90th%ile
DS 2035 - Ground Level Receptor (EFT Version 7, Year
2030)
2011
15 km/hr
15.8 28.0 17.5 30.4 20.2 33.1 2012 15.8 28.0 17.5 30.7 20.4 32.5 2013 15.8 27.9 17.4 30.6 20.3 33.2 2014 15.8 28.2 17.5 30.1 20.4 32.5 2015 15.8 28.2 17.4 31.0 20.2 36.3
DS 2035 – First-floor Receptor
(EFT Version 7, Year 2030)
2011
15 km/hr
15.8 28.0 17.2 29.8 18.4 31.2 2012 15.8 28.0 17.2 30.6 18.4 31.6 2013 15.8 27.9 17.1 30.0 18.5 31.4 2014 15.8 28.2 17.2 29.9 18.6 30.8 2015 15.8 28.2 17.1 30.9 18.4 33.6
Ambient Air Quality Limit Value (µg/m3) 40 50 40 50 40 50
Note 1 Maximum result at the façade of any building in the study area.
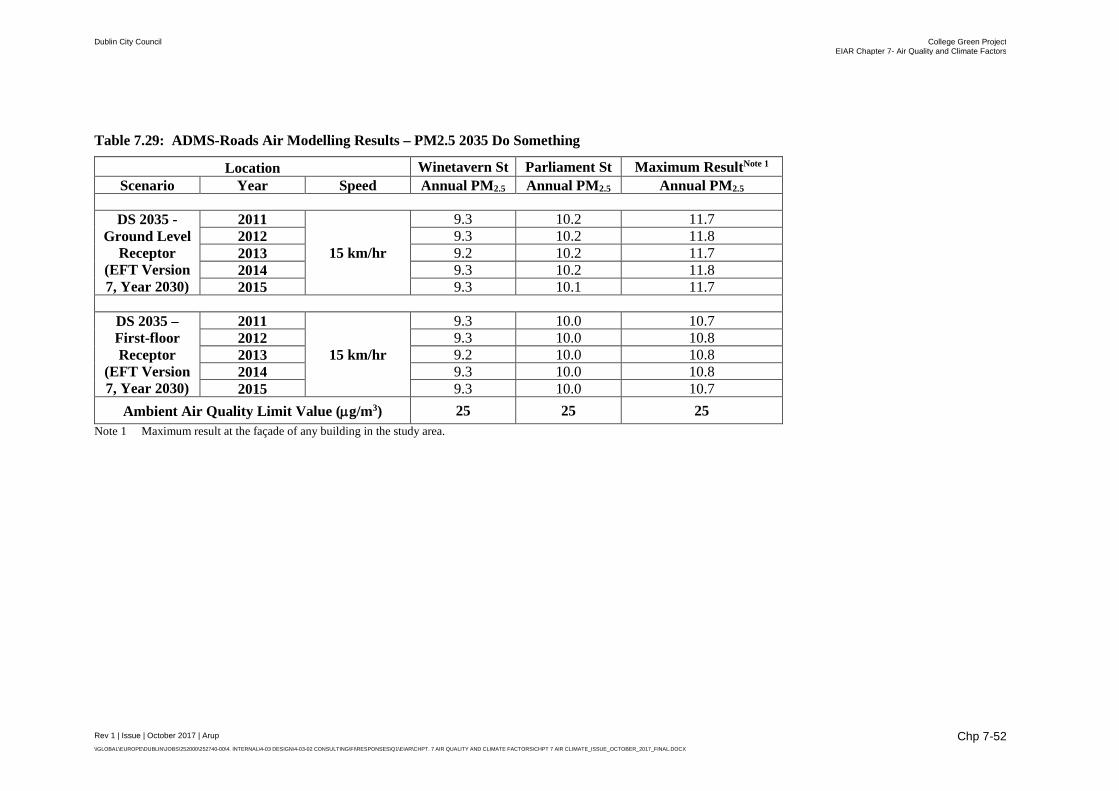
Dublin City Council College Green Project EIAR Chapter 7- Air Quality and Climate Factors
Rev 1 | Issue | October 2017 | Arup \\GLOBAL\EUROPE\DUBLIN\JOBS\252000\252740-00\4. INTERNAL\4-03 DESIGN\4-03-02 CONSULTING\FI\RESPONSES\Q1\EIAR\CHPT. 7 AIR QUALITY AND CLIMATE FACTORS\CHPT 7 AIR CLIMATE_ISSUE_OCTOBER_2017_FINAL.DOCX
Chp 7-52
Table 7.29: ADMS-Roads Air Modelling Results – PM2.5 2035 Do Something
Location Winetavern St Parliament St Maximum ResultNote 1
Scenario Year Speed Annual PM2.5 Annual PM2.5 Annual PM2.5
DS 2035 - Ground Level
Receptor (EFT Version 7, Year 2030)
2011
15 km/hr
9.3 10.2 11.7 2012 9.3 10.2 11.8 2013 9.2 10.2 11.7 2014 9.3 10.2 11.8 2015 9.3 10.1 11.7
DS 2035 – First-floor Receptor
(EFT Version 7, Year 2030)
2011
15 km/hr
9.3 10.0 10.7 2012 9.3 10.0 10.8 2013 9.2 10.0 10.8 2014 9.3 10.0 10.8 2015 9.3 10.0 10.7
Ambient Air Quality Limit Value (µg/m3) 25 25 25 Note 1 Maximum result at the façade of any building in the study area.
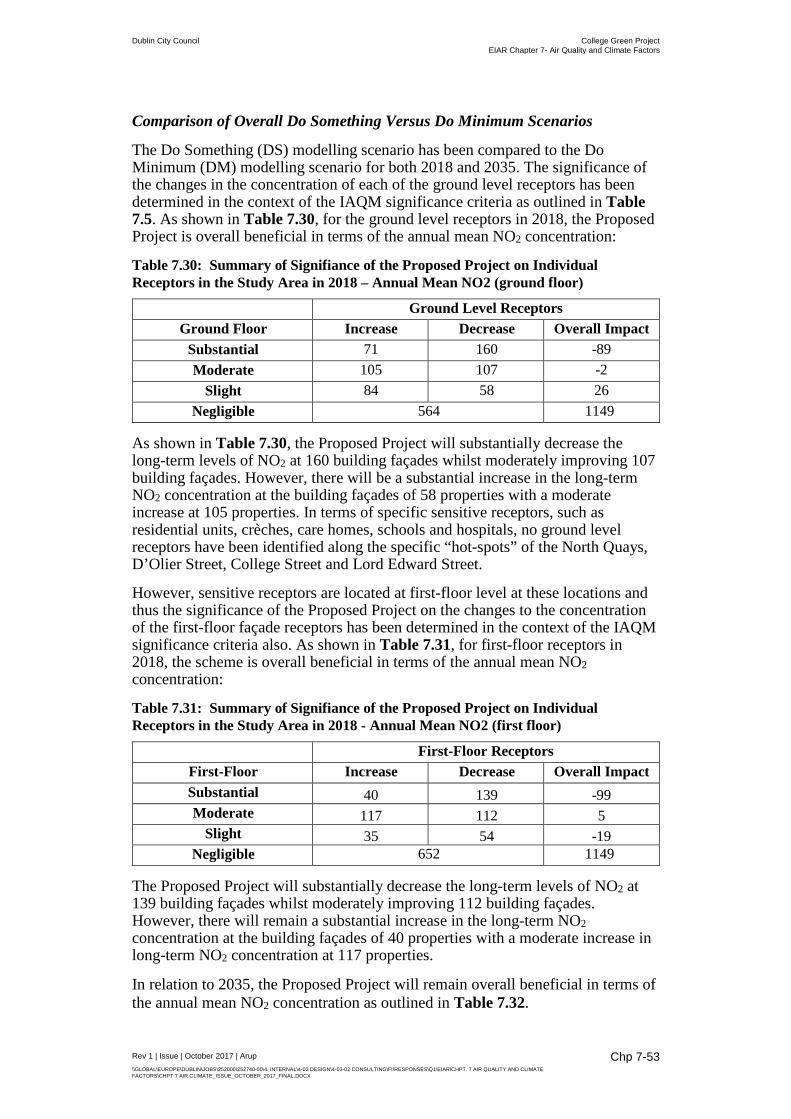
Dublin City Council College Green Project EIAR Chapter 7- Air Quality and Climate Factors
Rev 1 | Issue | October 2017 | Arup \\GLOBAL\EUROPE\DUBLIN\JOBS\252000\252740-00\4. INTERNAL\4-03 DESIGN\4-03-02 CONSULTING\FI\RESPONSES\Q1\EIAR\CHPT. 7 AIR QUALITY AND CLIMATE FACTORS\CHPT 7 AIR CLIMATE_ISSUE_OCTOBER_2017_FINAL.DOCX
Chp 7-53
Comparison of Overall Do Something Versus Do Minimum Scenarios
The Do Something (DS) modelling scenario has been compared to the Do Minimum (DM) modelling scenario for both 2018 and 2035. The significance of the changes in the concentration of each of the ground level receptors has been determined in the context of the IAQM significance criteria as outlined in Table 7.5. As shown in Table 7.30, for the ground level receptors in 2018, the Proposed Project is overall beneficial in terms of the annual mean NO2 concentration:
Table 7.30: Summary of Signifiance of the Proposed Project on Individual Receptors in the Study Area in 2018 – Annual Mean NO2 (ground floor)
Ground Level Receptors Ground Floor Increase Decrease Overall Impact
Substantial 71 160 -89 Moderate 105 107 -2
Slight 84 58 26 Negligible 564 1149
As shown in Table 7.30, the Proposed Project will substantially decrease the long-term levels of NO2 at 160 building façades whilst moderately improving 107 building façades. However, there will be a substantial increase in the long-term NO2 concentration at the building façades of 58 properties with a moderate increase at 105 properties. In terms of specific sensitive receptors, such as residential units, crèches, care homes, schools and hospitals, no ground level receptors have been identified along the specific “hot-spots” of the North Quays, D’Olier Street, College Street and Lord Edward Street.
However, sensitive receptors are located at first-floor level at these locations and thus the significance of the Proposed Project on the changes to the concentration of the first-floor façade receptors has been determined in the context of the IAQM significance criteria also. As shown in Table 7.31, for first-floor receptors in 2018, the scheme is overall beneficial in terms of the annual mean NO2 concentration:
Table 7.31: Summary of Signifiance of the Proposed Project on Individual Receptors in the Study Area in 2018 - Annual Mean NO2 (first floor)
First-Floor Receptors First-Floor Increase Decrease Overall Impact Substantial 40 139 -99 Moderate 117 112 5
Slight 35 54 -19 Negligible 652 1149
The Proposed Project will substantially decrease the long-term levels of NO2 at 139 building façades whilst moderately improving 112 building façades. However, there will remain a substantial increase in the long-term NO2 concentration at the building façades of 40 properties with a moderate increase in long-term NO2 concentration at 117 properties.
In relation to 2035, the Proposed Project will remain overall beneficial in terms of the annual mean NO2 concentration as outlined in Table 7.32.
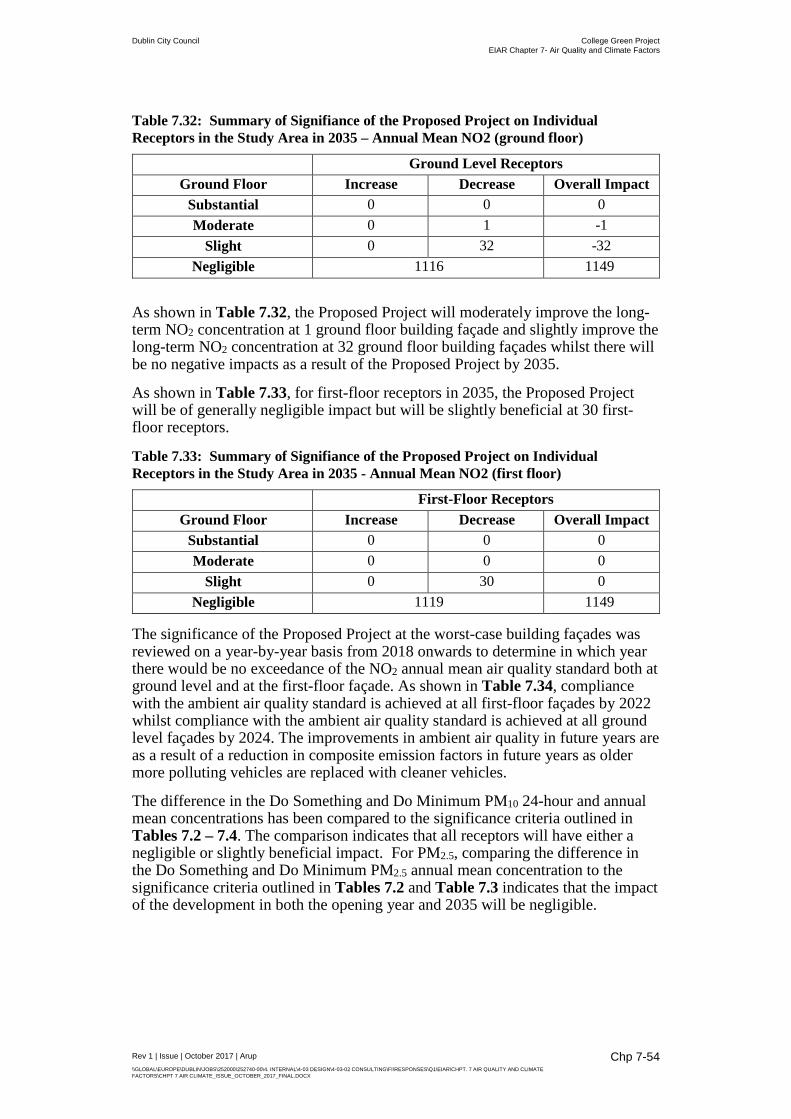
Dublin City Council College Green Project EIAR Chapter 7- Air Quality and Climate Factors
Rev 1 | Issue | October 2017 | Arup \\GLOBAL\EUROPE\DUBLIN\JOBS\252000\252740-00\4. INTERNAL\4-03 DESIGN\4-03-02 CONSULTING\FI\RESPONSES\Q1\EIAR\CHPT. 7 AIR QUALITY AND CLIMATE FACTORS\CHPT 7 AIR CLIMATE_ISSUE_OCTOBER_2017_FINAL.DOCX
Chp 7-54
Table 7.32: Summary of Signifiance of the Proposed Project on Individual Receptors in the Study Area in 2035 – Annual Mean NO2 (ground floor)
Ground Level Receptors Ground Floor Increase Decrease Overall Impact
Substantial 0 0 0 Moderate 0 1 -1
Slight 0 32 -32 Negligible 1116 1149
As shown in Table 7.32, the Proposed Project will moderately improve the long-term NO2 concentration at 1 ground floor building façade and slightly improve the long-term NO2 concentration at 32 ground floor building façades whilst there will be no negative impacts as a result of the Proposed Project by 2035.
As shown in Table 7.33, for first-floor receptors in 2035, the Proposed Project will be of generally negligible impact but will be slightly beneficial at 30 first-floor receptors.
Table 7.33: Summary of Signifiance of the Proposed Project on Individual Receptors in the Study Area in 2035 - Annual Mean NO2 (first floor)
First-Floor Receptors Ground Floor Increase Decrease Overall Impact
Substantial 0 0 0 Moderate 0 0 0
Slight 0 30 0 Negligible 1119 1149
The significance of the Proposed Project at the worst-case building façades was reviewed on a year-by-year basis from 2018 onwards to determine in which year there would be no exceedance of the NO2 annual mean air quality standard both at ground level and at the first-floor façade. As shown in Table 7.34, compliance with the ambient air quality standard is achieved at all first-floor façades by 2022 whilst compliance with the ambient air quality standard is achieved at all ground level façades by 2024. The improvements in ambient air quality in future years are as a result of a reduction in composite emission factors in future years as older more polluting vehicles are replaced with cleaner vehicles.
The difference in the Do Something and Do Minimum PM10 24-hour and annual mean concentrations has been compared to the significance criteria outlined in Tables 7.2 – 7.4. The comparison indicates that all receptors will have either a negligible or slightly beneficial impact. For PM2.5, comparing the difference in the Do Something and Do Minimum PM2.5 annual mean concentration to the significance criteria outlined in Tables 7.2 and Table 7.3 indicates that the impact of the development in both the opening year and 2035 will be negligible.

Dublin City Council College Green Project EIAR Chapter 7- Air Quality and Climate Factors
Rev 1 | Issue | October 2017 | Arup \\GLOBAL\EUROPE\DUBLIN\JOBS\252000\252740-00\4. INTERNAL\4-03 DESIGN\4-03-02 CONSULTING\FI\RESPONSES\Q1\EIAR\CHPT. 7 AIR QUALITY AND CLIMATE FACTORS\CHPT 7 AIR CLIMATE_ISSUE_OCTOBER_2017_FINAL.DOCX
Chp 7-55
Table 7.34: ADMS-Roads Air Modelling Results – NO2
Location Maximum ResultNote 1
Scenario Modelled
Speed Annual NO2 99.8th%ile
DS 2035 - Ground Level
Receptor
2019
15 km/hr
62.0 172.2 2020 56.2 157.5 2021 50.7 141.6 2022 45.8 128.6 2023 41.8 118.8 2024 38.2 110.8
DS 2035 – First-floor Receptor
2019
15 km/hr
50.2 140.1 2020 46.3 128.7 2021 42.6 118.5 2022 39.4 111.0 2023 36.7 104.1 2024 34.3 99.3
Ambient Air Quality Limit Value (µg/m3) 40 200 Note 1 Maximum result at the façade of any building in the study area.
7.5 Mitigation Measures In order to sufficiently ameliorate the likely air quality impact, a schedule of air control measures has been formulated for both construction and operational phases associated with the Proposed Project.
7.5.1 Construction phase Climate
No additional mitigation measures are required as the construction phase of the Proposed Project is predicted to have a negligible impact on climate.
Air Quality
In order to ensure that no dust nuisance occurs, a series of measures will be implemented. In summary, the measures which will be implemented will include:
• Vehicles delivering material with dust potential (soil, aggregates) will be enclosed or covered with tarpaulin at all times to restrict the escape of dust.
• Public roads outside the site will be regularly inspected for cleanliness, and cleaned as necessary.
• Material handling systems and site stockpiling of materials will be designed and laid out to minimise exposure to wind. Water misting or sprays will be used as required if particularly dusty activities are necessary during dry or windy periods.
• During movement of materials both on and off-site, trucks will be stringently covered with tarpaulin at all times. Before entrance onto public roads, trucks will be adequately inspected to ensure no potential for dust emissions.
• Hoarding will be provided around the construction site.
Dublin City Council College Green Project EIAR Chapter 7- Air Quality and Climate Factors
Rev 1 | Issue | October 2017 | Arup \\GLOBAL\EUROPE\DUBLIN\JOBS\252000\252740-00\4. INTERNAL\4-03 DESIGN\4-03-02 CONSULTING\FI\RESPONSES\Q1\EIAR\CHPT. 7 AIR QUALITY AND CLIMATE FACTORS\CHPT 7 AIR CLIMATE_ISSUE_OCTOBER_2017_FINAL.DOCX
Chp 7-56
At all times, these procedures will be strictly monitored and assessed. In the event of dust nuisance occurring outside the site boundary, movements of materials likely to raise dust would be curtailed and satisfactory procedures implemented to rectify the problem before the resumption of construction operations.
Construction vehicles, generators etc., may give rise to some CO2 and N2O emissions. However, due to short-term and temporary nature of these works the impact on climate will not be significant.
7.5.2 Operational phase Climate
No additional site-specific mitigation measures are required as the operational phase of the Proposed Project is predicted to have a negligible impact on climate.
At a national / European level, improvements in air quality are likely over the next few years as a result of the on-going comprehensive vehicle inspection and maintenance program, fiscal measures to encourage the use of alternatively fuelled vehicles and the introduction of cleaner fuels.
CO2 emissions for the average new car fleet were reduced to 120 g/km by 2012 through EU legislation on improvements in vehicle motor technology and by an increased use of biofuels. Additional measures included in the National Climate Change Strategy include: (1) VRT and Motor Tax rebalancing to favour the purchase of more fuel-efficient vehicles with lower CO2 emissions; (2) continuing the Mineral Oils Tax Relief II Scheme and introduction of a biofuels obligation scheme; (3) implementation of a national efficient driving awareness campaign, to promote smooth and safe driving at lower engine revolutions; and (4) enhancing the existing mandatory vehicle labelling system to provide more information on CO2 emission levels and on fuel economy.
Air Quality
The pedestrianisation of College Green will be beneficial in terms of air quality in the vicinity of Dame Street and College Green with the termination of the East – West traffic flow and with a significant reduction in traffic along Dame Street east of South Great Georges Street. Similarly, during the hours of 07:00 – 19:00 weekdays, Parliament Street will be restricted to taxis and buses only and will have an overall reduction in traffic and resultant air emissions.
At European level, mitigation measures in relation to traffic-derived pollutants have focused generally on improvements in both engine technology and fuel quality. EU legislation, based on the EU sponsored Auto-Oil programmes, has imposed stringent emission standards for key pollutants (REGULATION (EC) No 715/2007) for passenger cars which was complied with in 2009 (Euro V) and 2014 (Euro VI).
As outlined in the TII publication “Guidelines for the Treatment of Air Quality During the Planning and Construction of National Road Schemes” the guidance states that “for the purpose of the EIS, it should be assumed that pollutant concentrations will decline in future years, as a result of various initiatives to reduce vehicle emissions both in Europe and in Ireland” (Page 52).
Dublin City Council College Green Project EIAR Chapter 7- Air Quality and Climate Factors
Rev 1 | Issue | October 2017 | Arup \\GLOBAL\EUROPE\DUBLIN\JOBS\252000\252740-00\4. INTERNAL\4-03 DESIGN\4-03-02 CONSULTING\FI\RESPONSES\Q1\EIAR\CHPT. 7 AIR QUALITY AND CLIMATE FACTORS\CHPT 7 AIR CLIMATE_ISSUE_OCTOBER_2017_FINAL.DOCX
Chp 7-57
A range of legislation in Europe since 1992 has significantly reduced the allowable steady cycle emissions of both NOX and PM from road vehicles with NOX emission reductions for HDV (Heavy Diesel Vehicles) a factor of 20 and PM a factor of 36 over this period (Euro I to Euro VI). In relation to LDV (Light Diesel Vehicles) the reduction of NOX and PM from road vehicles has also been significant with NOX emission reductions from HDV a factor of 12 and PM a factor of 40 over this period (Euro I to Euro VI). Although actual on-road emission reductions will be less dramatic, significant reductions in vehicle-related NOX and PM emissions are to be expected over the next 5-10 years as the fleet turns over.
Improvements in air quality are also likely over the next few years as a result of the on-going comprehensive vehicle inspection and maintenance program, fiscal measures to encourage the use of alternatively fuelled vehicles and the introduction of cleaner fuels. In addition, Dublin Bus proposes to introduce cleaner, more efficient buses, including electric vehicles, in the future.
7.6 Residual Impacts
7.6.1 Construction phase
7.6.1.1 Climate There will be no residual impacts of significance on climate from the construction of the Proposed Project.
7.6.1.2 Air Quality When the dust minimisation measures detailed in the mitigation section of this chapter are implemented, fugitive emissions of dust from the site will be insignificant and pose no nuisance at nearby receptors.
Due to the size and nature of the construction activities, CO2 and N2O emissions during construction will have a negligible impact on climate.
7.6.2 Operational phase
7.6.2.1 Climate There will be no residual impacts of significance on climate from the operation of the Proposed Project.
7.6.2.2 Air Quality The air dispersion modelling assessment has found that the proposed College Green Project will be beneficial overall in the study area. By 2035, all ground level and first-floor façades will have ambient air quality in compliance with the ambient air quality standards for the do something (and do minimum) scenario.
In relation to 2018, the Proposed Project will improve air quality at significantly more receptors relative to the number of receptors which deteriorate in air quality.
Dublin City Council College Green Project EIAR Chapter 7- Air Quality and Climate Factors
Rev 1 | Issue | October 2017 | Arup \\GLOBAL\EUROPE\DUBLIN\JOBS\252000\252740-00\4. INTERNAL\4-03 DESIGN\4-03-02 CONSULTING\FI\RESPONSES\Q1\EIAR\CHPT. 7 AIR QUALITY AND CLIMATE FACTORS\CHPT 7 AIR CLIMATE_ISSUE_OCTOBER_2017_FINAL.DOCX
Chp 7-58
There will however be a period of time, between opening year and 2022, during which a number of first-floor facades are likely to remain above the annual mean NO2 ambient air quality standard and between opening year and 2024, during which some ground level façades are likely to be in excess of the annual mean NO2 ambient air quality standard.
However, in the absence of the Proposed Project, the impact on existing ground floor and first-floor façades will be greater with a higher number of receptors experiencing air quality in excess of the annual mean NO2 limit value for a period of time.
7.7 Difficulties Encountered Full resolution of traffic data on a 24 hour, 7-day week was not available for future years. In the absence of this data, the diurnal and weekday / Saturday / Sunday relative traffic profile was derived from modelled AM Peak levels for the relevant future scenario and using 2016 24-hour count data for the relevant links.
7.8 References Environmental Protection Agency (EPA) “Advice Notes On Current Practice In The Preparation Of EIS” (EPA, 2003)
Environmental Protection Agency (EPA) “Air Dispersion Modelling From Industrial Installations Guidance Note” (EPA, 2010)
Transportation Infrastructure Ireland (TII (formerly the National Roads Authority) “Guidelines For The Treatment Of Air Quality During The Planning And Construction Of National Road Schemes” (TII, 2011)
UK DEFRA Guidance “Part IV of the Environment Act 1995: Local Air Quality Management, LAQM. TG(16)” (UK DEFRA, 2016)
IAQM / EPUK “Land-Use Planning & Development Control: Planning For Air Quality”
Framework Convention on Climate Change (FCCC) (1997) Kyoto Protocol To The United Nations Framework Convention On Climate Change
European Council (2014) European Council (23 and 24 October 2014) Conclusions on 2030 Climate and Energy Policy Framework, SN 79/14
DEHLG (2004) National Programme for Ireland under Article 6 of Directive 2001/81/EC for the Progressive Reduction of National Emissions of Transboundary Pollutants by 2010
EEA (2014) NEC Directive Status Reports 2013
EPA (2016) Ireland’s Greenhouse Gas Emissions to 2020 – An Update
Department of Environment, Heritage and Local Government (2007) National Climate Change Strategy 2007-2012