7: 21 st century globalization 0. discussion: winners and losers from the asian boom and bust 1
TRANSCRIPT

7: 21st century globalization
1

Discussion: winners and losers from the Asian boom and bust
2

Evolution of trade shares with china – compare ‘close’ and ‘far’ (TAF talk)
3

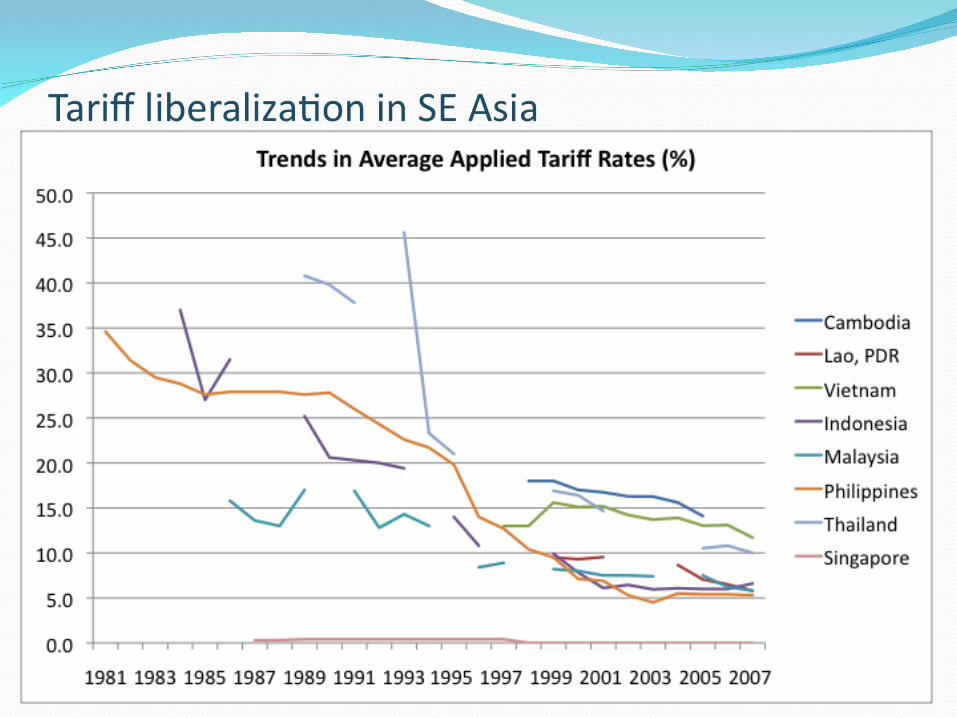
The setting: (re)globalization
During 1990s, SE Asia reintegrates with global economy through more than just commodity tradeCapital and labor marketsInternational agreements (regional: AFTA, APEC; global:
WTO)At same time, global integration by others – esp. China
1978: China’s “open door” policy initiated1980s: mainly domestic reforms1990s: China joins global marketplace (1994 devaluation)
Global impacts on product and factor marketsDevelopment impacts of SE Asian and global integration?
4

The setting: (re)globalization
China effect: changes in global markets and factor supplies
Increased demand for some goods and services; intensified competition in mkts for others (which ones?)
Successful development requires flexibility Moving up the value ladder requires increasingly
sophisticated technologies and inputs; dynamic firmsPremium on capacity for innovation, & on inputs
complementary with more advanced technologiesWhat are these? How do they assist growth? “prying open the Solow model”: 3 modifications
5

Globalization and productivity growth
Solow growth model emphasizes importance of productivity growth – in a hypothetical closed economy
Open-economy Solow: (i) intermediate inputs
Original aggregate production function:
Y = A•ƒ(K, L)
With intermediate inputs (N): assume
Y = A•ƒ(K,L)•N
==> More N more output and more productive K & L==> If intermediates are dominated by imports, then lowering
costs of importing N has positive effects on economic growth
Example: demand for N = ND = PN-1, so Y = A•ƒ(K,L)/PN
Then –∂Y/∂PN has an effect proportional to ∂Y/∂A; lowering the domestic cost of N raises TFP.
6

Globalization and int’l capital transfer
Open-economy Solow: (ii) imported capital
Original capital growth equation:
Δk = s•ƒ(k) – (d + n)•k
Savings in closed econ: S = I; s = I/Y.
In open econ: S = I + FDI, s = (I + FDI)/Y
==> Imported capital (FDI/ investment goods) also adds to capital stock
==> Lowering the cost of importing capital/investment goods is equivalent to raising the domestic savings rate, which increases economic growth
Cheaper FDI and investment goods imports may also interact with other factors (human capital, productivity) as discussed in growth/trade class.
7

8
Source: Estevadeordal & Taylor 2008
9

10Source: Gill & Kharas 2007

11
Source: Gill & Kharas 2007: 130

Innovation in product mixOpen-economy Solow (iii): climbing the product ladder
In closed economy aggregate model, diminishing returns to capital due to movement around a (single) production function This leads to convergence to steady state (zero per capita
growth) In closed-econ 2 (or more) sector model, size of domestic
market also dim returns (supply up -> price down -> lower cap returns)
In open economy, size of market is not a constraint As capital per worker accumulates, can switch production to
more capital-intensive products, sold at (constant) world prices
==> Diminishing returns do not apply, or are delayed==> High per capita growth rate can be sustained for longer, if
other conditions are favorable
“What you export matters” – Dani Rodrik
Like China, SE Asia’s most successful economies have diversified manufacturing production into increasingly capital- and skill-intensive production 12

Summary: openness, productivity, growth
In inward-oriented economies, capital is costly and factor productivity is reduced by high cost of imported intermediate goods and investment goodsGlobalization reduces investment costs and raises factor
productivityIn inward-oriented economies, the size of the market
constrains output growth, induces diminishing returnsGlobalization increases the size of the potential market,
and product innovations (i.e., climbing the product quality and sophistication ladder) can prevent diminishing returns
Globalization and innovation are complementaryWhat else is needed to realize gains?
13

14

New Asian regionalism: China
15

SE Asia in the new Asian economy
Growth of China impacts world markets, especially after 1994
South-South trade impacts: competition and complementarityCompetition - which products?Complementarity – which products?Competition - which countries?Complementarity – which countries?
16

Enter the dragon
China’s growth and globalization are changing the composition and direction of SE Asian trade
Competition with China in third-country markets is intensifyingMultifiber arrangement (which penalized Chinese
garment exports to rich countries) abolished (Jan. 2005)Yet SE Asian trade with China is growing faster than
total trade – how? What products? What is SE Asia’s comparative advantage with
respect to China?

Country Period China trade share %
Total trade growth %
Growth of trade w China %
Indonesia 85-95 4.3 143 153
95-01 6.2 32 44
Malaysia 85-95 2.4 381 118
95-01 5.6 29 133
Thailand 85-95 2.9 598 -15
95-01 6.5 34 124

China’s trade share (percent) and rank among trading partners Country 1990 1995 2000 2001 2002 2003 Malaysia Exports 2.10 2.56 3.09 4.33 5.63 10.78
Rank 10 9 9 6 5 3 Imports 1.92 2.20 3.94 5.19 7.74 6.82 7 7 5 4 4 4
Indonesia Exports 3.25 3.83 4.46 3.91 5.08 7.43 5 5 5 5 5 4 Imports 2.97 3.68 6.03 5.95 7.76 11.72 7 8 5 5 4 2
Philippines Exports 0.75 1.20 1.74 2.47 3.85 12.00 10 10 10 10 8 3 Imports 1.40 2.34 2.28 2.95 3.54 6.99 9 8 9 7 7 4
Thailand Exports 1.16 2.87 4.07 4.40 5.16 7.09 10 6 6 5 5 4 Imports 3.31 2.84 5.45 5.98 7.61 8.00 6 7 4 3 3 3
Vietnam Exports 0.31 6.44 10.61 9.44 6.45 6.40 6 3 2 2 4 4 Imports 0.16 3.94 8.96 9.91 11.82 14.06 8 6 4 4 2 1
Source: ADB back

A measure of comparative advantage
Revealed comparative advantage as captured by trade intensity:
RCAij = (Xij/XTj) / (XiWXTW) Where Xij = exports of good i from country j;
XTj = total exports from country j;XiW = world exports of good i;XTW = total world exports
RCAij > 1 ==> comparative advantage < 1 ==> comparative disadvantage

Trade data: commodity groups
Group SITC section SITC division
A.Primary products
1. Agricultural products:
- Food
- Raw materials
2. Mining products
0,1,2,3,4
0,1,4
3
22
21,23,24,25,26,29
27,28,69
B. Manufactures 5,6,7,8 Not including 68 and group 891
C. Other products 9 Group 891
SITC Revision 3 WTO International Trade Statistics 2004

22

23

24

25

26

27

0%
10%
20%
30%
40%
50%
60%
70%
80%
90%
100%
World China World China World China World China World China
Indonesia Malaysia Philippines Thailand Vietnam
1. Agriculture 2. Raw & semi-processed nat. res.
3. Heavy industry 4. Capital-intensive mfg
5. Labor-intensive mfg 6. Other
Figure 9: Sectoral composition of SE Asian exports to the world and to China
Competition and complementarity
CompetitionInvestment?Labor-intensive manufactures – ‘bottom rung’
industries
ComplementarityNatural resources – could export booms resource
curse? Skill-intensive manufactures
29

FDI net annual inflows, China and SE Asia
0
10,000
20,000
30,000
40,000
50,000
60,000
1979 1981 1983 1985 1987 1989 1991 1993 1995 1997 1999 2001 2003
Source: WDI. * Excludes Singapore.
Millions of 2000 US dollars
China
SE Asia*
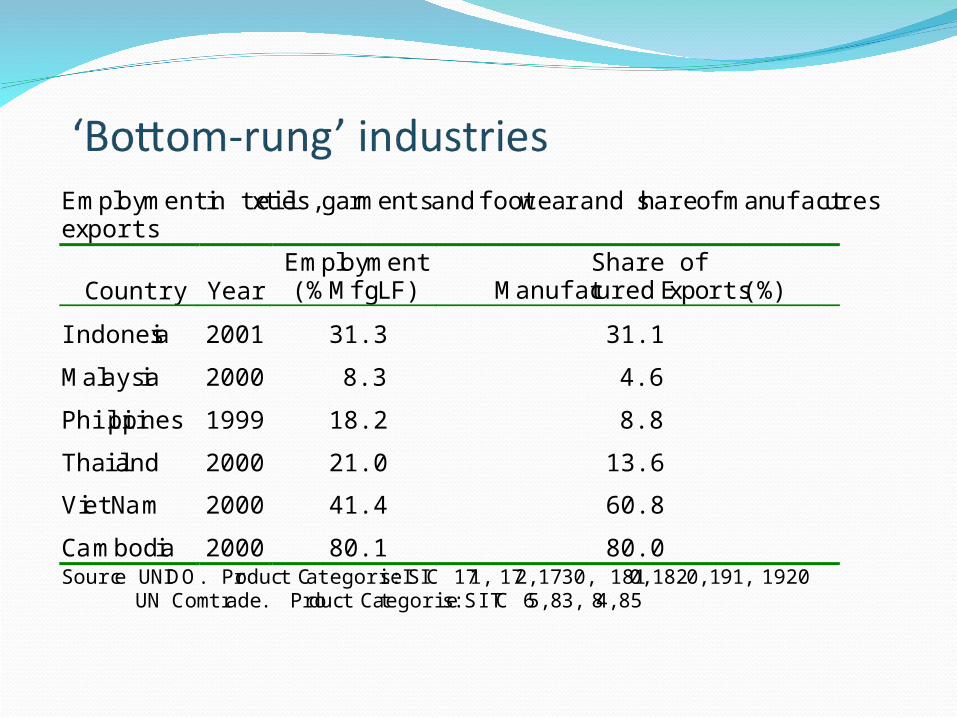
Employment in textiles, garments and footwear and share of manufactures exports
Country Year Employment (% Mfg LF)
Share of Manufactured Exports (%)
Indonesia 2001 31.3 31.1
Malaysia 2000 8.3 4.6
Philippines 1999 18.2 8.8
Thailand 2000 21.0 13.6
Viet Nam 2000 41.4 60.8
Cambodia 2000 80.1 80.0 Source UNIDO. Product Categories: ISIC 171, 172, 1730, 1810, 1820, 191, 1920 UN Comtrade. Product Categories: SITC 65, 83, 84, 85

Resource exports: resource curse?
SE Asia escaped resource curse first time aroundIn fact, their ‘miracle’ growth occurred during a decade
on historically low world commodity prices Was based on hosting FDI directed at non-resource
sectors
Could they do it again?Some econs have climbed further up industrialization
ladder than others (structure of investment; human capital accumulation). Esp. late starters.
China’s growth (and India’s…) could kick away ladder

• China’s growth raises demand for NR products– E.g. demand for forest products rose 175% 1997-2003
• Among exporters, contraction of labor-intensive industries reduces growth of low-skill labor costs• Natural resource sectors benefit from this
• Future profit rises will be highest in labor-intensive, resource-intensive activities, including– Industrial plantation crops– Agricultural crops– Inland and coastal fisheries

Environmental problems: access to natural resources
Open access & unresolved externalities characterize many aspects of natural resource extraction in Southeast Asia
Some trends toward greater central control in early 1990s
How will decentralization affect NR management?

Liquidating Indonesia’s forests
New laws unclear on ownership, use rights, responsibilities and rights of local gov’ts
Fiscal incentives for local gov’ts to increase extraction rates
Result… “a free-for-all in which forest management has become the responsibility of no-one” Demand for timber and land for ag. conversionTimber removal rates now at 3 times Jakarta’s
“sustainability criterion”

Conclusions
‘Globalization’ in China and SE Asia shifts comp. adv. toward NR products, away from labor-intensive manufacturesDynamics: investment flows may reinforce trend
Divergence within region: complementarity in skill-intensive manufactures v. complementarity in natural resourcesDecentralization may cause resource depletion to
accelerate Possibility of “new” natural resource curse in
resource-intensive economiesCaveat: ‘China effect’ reduces net gains from
globalization

Next: growth of skill-intensive manufacturing
37