6.4 1. overview of tamdar - national oceanic and ... · effect of tamdar data on ruc ... randall s....
TRANSCRIPT
13th Conference on Aviation, Range and Aerospace MeteorologyJanuary 2008, New Orleans, LA, Amer. Meteor. Soc.
6.4
EFFECT OF TAMDAR DATA ON RUC SHORT-TERM FORECASTS OF AVIATION-IMPACT FIELDS FOR CEILING, VISIBILITY, REFLECTIVITY, AND PRECIPITATION
Edward J. Szoke1,2, Stan Benjamin, Randall S. Collander1, Brian D. Jamison1, William R. Moninger, Thomas W. Schlatter3, Barry Schwartz and Tracy L. Smith1
NOAA Earth System Research Laboratory (ESRL), Boulder, Colorado1Collaboration with the Cooperative Institute for Research in the Atmosphere (CIRA), Fort Collins, Colorado
3Cooperative Institute for Research in Environmental Sciences (CIRES), Boulder, Colorado
1. OVERVIEW OF TAMDAR
The amount and distribution of moisture in the
lower troposphere is known to be critical for many weather forecasts, but accurate point observations of the vertical moisture distribution above the surface are generally available only twice per day at widely spaced, upper-air rawinsonde sites (hereafter, RAOBs). Wind and temperature data from aircraft, known as AMDAR (Aircraft Meteorological Data Relay), have been routinely used by forecasters and assimilated in numerical models, but until recently, there have been no routine aircraft measurements of moisture. This has changed with the development and experimental deployment of an aircraft sensor capable of accurate measurement of moisture, both in the boundary layer and aloft.
The NASA Aviation Safety Program funded the development of a sensor called TAMDAR (Tropospheric AMDAR) by AirDat, LLC, of Raleigh NC, designed for deployment on aircraft flown by regional airlines (Daniels et al. 2006), since 2005. The TAMDAR sensor package measures moisture as well as wind and temperature. In 2005, with the support of NASA and the FAA, these sensors were deployed on 63 commercial aircraft flying over the U. S. Midwest and Lower Mississippi Valley in an experiment called the Great Lakes Fleet Evaluation (GLFE). The GLFE officially concluded in early 2006, although the data have continued to be made available from the fleet of (now 49) aircraft flying with the TAMDAR sensor package, and in 2007, the National Weather Service (NWS) reached an agreement that made the TAMDAR data from the GLFE flights available to NWS forecasters and for use in NOAA numerical models (Moninger et al. 2008).
In addition to the added measurement of moisture, the TAMDAR aircraft in the GLFE region fly out of many smaller airports (as well as major hubs) that typically do not have coverage from current aircraft data. This increases the number of ascent/descent soundings considerably. Furthermore, the flights are at levels well below the jet stream level of typical AMDAR aircraft, adding
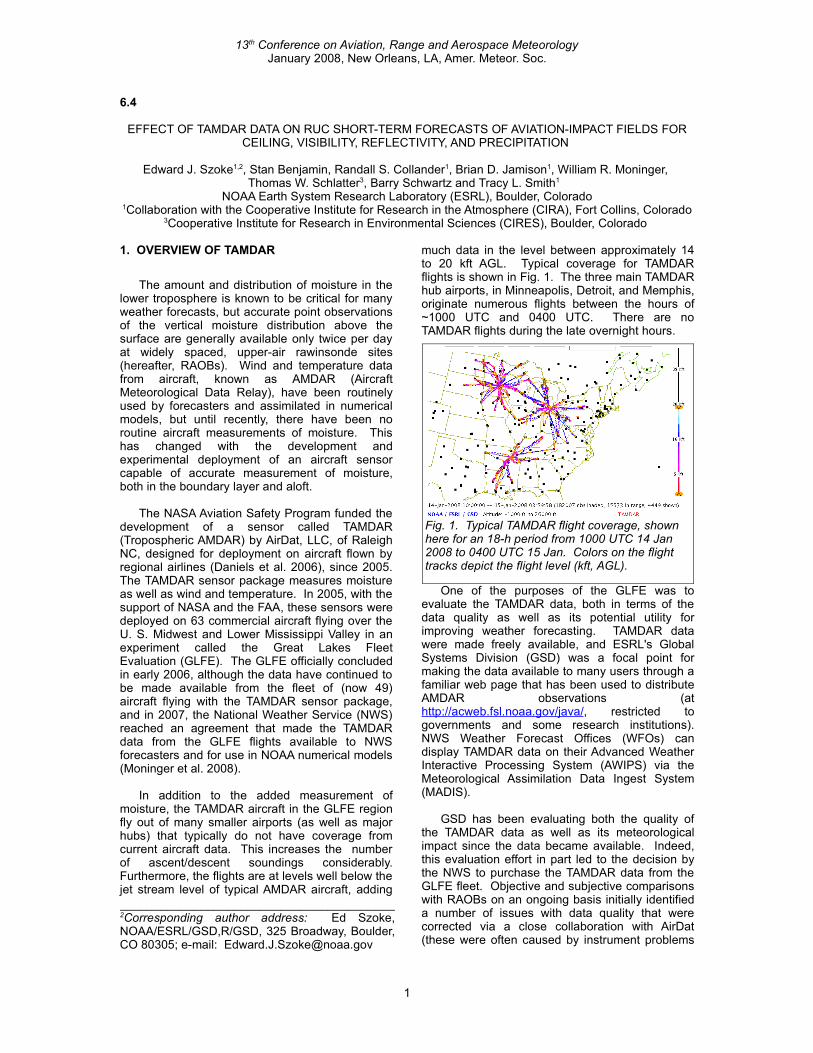
much data in the level between approximately 14 to 20 kft AGL. Typical coverage for TAMDAR flights is shown in Fig. 1. The three main TAMDAR hub airports, in Minneapolis, Detroit, and Memphis, originate numerous flights between the hours of ~1000 UTC and 0400 UTC. There are no TAMDAR flights during the late overnight hours.
One of the purposes of the GLFE was to evaluate the TAMDAR data, both in terms of the data quality as well as its potential utility for improving weather forecasting. TAMDAR data were made freely available, and ESRL's Global Systems Division (GSD) was a focal point for making the data available to many users through a familiar web page that has been used to distribute AMDAR observations (at http://acweb.fsl.noaa.gov/java/, restricted to governments and some research institutions). NWS Weather Forecast Offices (WFOs) can display TAMDAR data on their Advanced Weather Interactive Processing System (AWIPS) via the Meteorological Assimilation Data Ingest System (MADIS).
GSD has been evaluating both the quality of the TAMDAR data as well as its meteorological impact since the data became available. Indeed, this evaluation effort in part led to the decision by the NWS to purchase the TAMDAR data from the GLFE fleet. Objective and subjective comparisons with RAOBs on an ongoing basis initially identified a number of issues with data quality that were corrected via a close collaboration with AirDat (these were often caused by instrument problems
1
_________________________________________2Corresponding author address: Ed Szoke, NOAA/ESRL/GSD,R/GSD, 325 Broadway, Boulder, CO 80305; e-mail: [email protected]
Fig. 1. Typical TAMDAR flight coverage, shown here for an 18-h period from 1000 UTC 14 Jan 2008 to 0400 UTC 15 Jan. Colors on the flight tracks depict the flight level (kft, AGL).
13th Conference on Aviation, Range and Aerospace MeteorologyJanuary 2008, New Orleans, LA, Amer. Meteor. Soc.
that were then corrected). In terms of the meteorological studies, a major focus has been on the impact of TAMDAR data using the Rapid Update Cycle (RUC) model (Benjamin et al. 2004). As detailed in the next section, statistics have been calculated in real time for identical versions of the RUC model run with and without TAMDAR, comparing wind, temperature and humidity from the forecasts with coincident RAOB sites as verification points. In general, including TAMDAR data has demonstrated a consistent positive impact (the latest statistics are discussed at this conference by Moninger et al. 2008).
While demonstrating model impact is important, the data can have a significant impact on human forecasting that is more difficult to demonstrate objectively. This is often the case for the potential impact that TAMDAR might have for forecasts issued by a typical NWS WFO. These range from public forecasts of “ordinary” weather, to aviation forecasts, and for severe storm potential. Case studies are perhaps the best means to evaluate the potential impact of TAMDAR in such situations. A number of cases have documented how TAMDAR soundings benefited the forecast, with some presented at recent conferences (Brusky and Kurimski 2006; Brusky and Mamrosh 2006; Druse 2007; Fischer 2006; Mamrosh et al. 2006; and Szoke et al. 2006a, b, 2007). The Green Bay, Wisconsin WFO has been a focal point for collecting a number of these studies and organizing them on the official NOAA TAMDAR Web page (at http://www.crh.noaa.gov/tamdar/). A training CD can also be accessed from the official TAMDAR Web site.
These cases point out the significant value to forecasters from the basic TAMDAR sounding data, which for the first time provides off-RAOB time information about the above-surface moisture profile, with the same resolution as a RAOB. Studies and examples gathered by the Green Bay WFO have also demonstrated other forecast applications, in addition to convective forecasting, that forecasters have found using the TAMDAR sounding data as they have become aware of this new source of information. This includes examples of the use of TAMDAR data specifically to improve NWS WFO Terminal Aviation Forecasts (TAFs). These applications are important to note when evaluating the potential value of a new data source, since impact on numerical weather prediction models as measured by objective statistics can sometimes be difficult to interpret, or appear to be relatively small.
In this paper we will focus on both a subjective and objective evaluation of the impact of TAMDAR data on RUC short-term forecasts of aviation-impact fields. Specifically, we will look at short-term (generally 0-6 h, occasionally to 12-h or more) RUC forecasts of precipitation, ceiling and visibility. This is done by comparing two runs of
the RUC model run at 20-km horizontal grid resolution, one that includes the GLFE TAMDAR data, and an identical run that does not. We had hoped to include model forecasts of equivalent radar reflectivity as well, but at this point we are still transitioning our RUC comparison runs to a higher resolution RUC model (at 13-km horizontal grid resolution), which will be more appropriate for examining fields such as equivalent model radar reflectivity (Benjamin et al. 2008). We have considered a variety of weather systems from the last couple of years, some of which were high-impact events. The details of the model runs and verification process are discussed in the next section, and in Moninger et al. (2008).
In 2007, AirDat expanded TAMDAR data from the current Mesaba fleet to additional fleets in Alaska (Moninger et al. 2008). Additional expansion will soon occur across the Western United States. The fleets will include jet aircraft, which will expose the TAMDAR sensors to higher altitudes and higher speeds than they have been exposed to thus far. Data from these new fleets will be made available to GSD so that we can evaluate the quality of the data and the impact of these new fleets and expanded coverage on weather forecasts, similar to what was done initially with the GLFE TAMDAR data. This evaluation effort will likely factor into a decision by the government at some point whether or not to purchase the additional TAMDAR data.
2. VERIFICATION STUDIES
Since 2005, parallel versions of a 20-km horizontal grid resolution RUC have been run at hourly intervals, with one version ingesting TAMDAR and the other excluding TAMDAR (Moninger et al. 2006, 2007a, b, 2008; Benjamin et al. 2006, 2007). Otherwise, the model runs are the same. Currently, model forecasts are generated at 1-h intervals to 6 h, and at 3-h intervals out to 24 h. A number of images are made for each run, as well as several other RUC real-time runs at GSD, and posted online at http://ruc.noaa.gov/, with the RUC runs with TAMDAR labeled “20-km dev2 RUC”, and those without TAMDAR “20-km dev RUC”. The web images are displayed for the RUC TAMDAR/non-TAMDAR runs initialized at 0000 UTC, 0600 UTC, 1200 UTC and 1800 UTC, with forecasts out to 24 h. As noted above, we are planning to transition to parallel runs with the 13-km RUC model.
Our subjective evaluation has focused on cases where precipitating weather systems were moving across the Midwest and/or Ohio Valley, well within the main area of TAMDAR coverage (Fig. 1). Other cases emphasizing ceiling and visibility forecasts are chosen for weather events with relatively widespread areas of fog and/or low cloudiness. Some of the precipitation systems we
2
13th Conference on Aviation, Range and Aerospace MeteorologyJanuary 2008, New Orleans, LA, Amer. Meteor. Soc.
have examined were major cyclones, producing large swaths of rain or snow and/or severe convective weather. We chose RUC model start times when TAMDAR data would be available to the RUC initialization scheme. Typically the greatest amount of TAMDAR data would be present for the 1800 UTC and 0000 UTC RUC runs, with a lesser amount for the 1200 UTC run. In general, we examined 6-h forecasts of accumulated precipitation for the first 6 h of the model run, as this was the easiest short-term period to compare to available verification. We also compared individual 3-h and 6-h forecasts of various surface fields and precipitation to corresponding analyses overlaid with radar reflectivity. For ceiling and visibility forecast verification, we examined individual forecasts from the RUC at 3 and 6-h, and out to 12-h. Forecast images from the RUC web page were used, as well as a color-coded display of model output of ceiling and visibility interpolated to METAR sites. This display (available at http://ruc.fsl.noaa.gov/stats/cvis/plan_view/) can also be used to display the observed fields of ceiling and visibility.
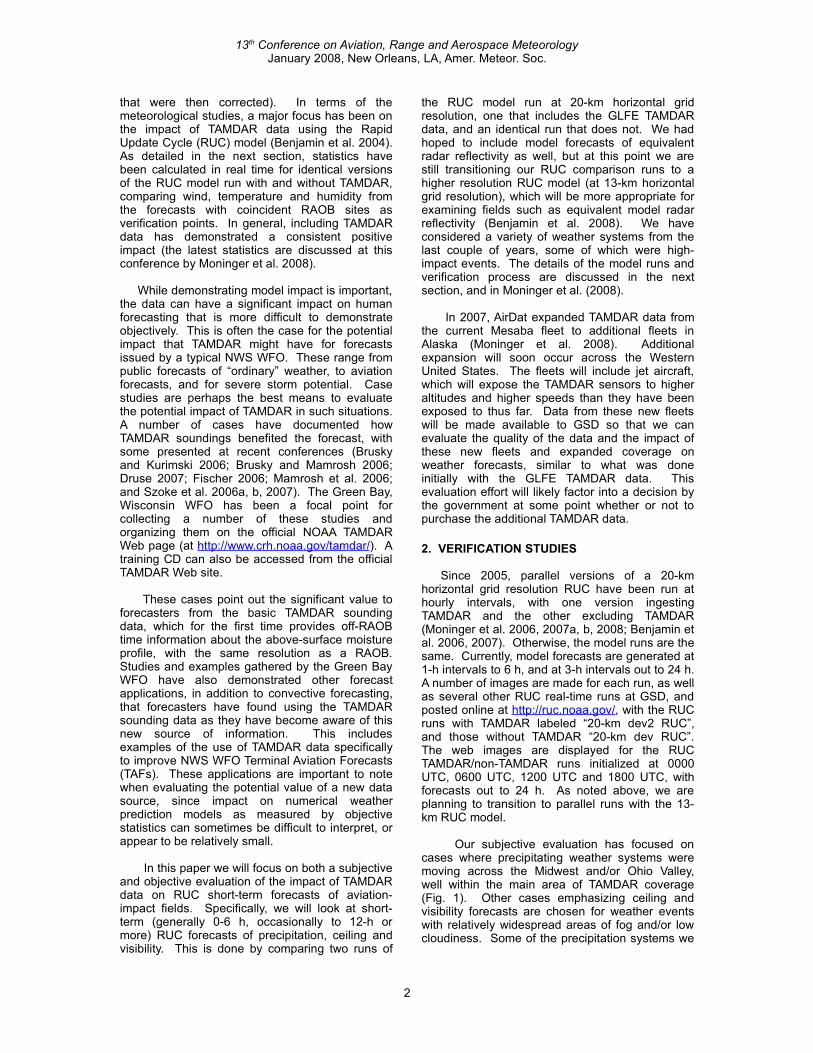
In terms of verifying precipitation, we used the near real-time 6-h quantitative precipitation estimation available from the National Precipitation Verification Unit (NPVU), at http://www.hpc.ncep.noaa.gov/npvu/index.shtml. This estimation is a combination of precipitation observations and radar estimates, which results in some limitations in terms of representing the true accumulated precipitation (Schwartz and Benjamin 2000). We have been objectively scoring RUC forecasts with and without TAMDAR since 2005 for the fields of temperature, wind, and relative humidity, by comparing the RUC output for these fields interpolated to RAOB sites. To better isolate the impact from TAMDAR, this comparison has been done objectively on the two sub-areas noted in Figure 2. The smaller of these areas contains the most concentration of TAMDAR flights.
Precipitation verification was added for these TAMDAR/non-TAMDAR runs at the beginning of 2007, using the gridded precipitation fields available from the NPVU at 4x4-km resolution, similar to what has been done for some time now with other RUC precipitation forecasts (Schwartz and Benjamin 2000). As with the other fields, we verified the precipitation over two areas, shown in Fig. 2. Since the smaller domain contains the area where most of the TAMDAR flights are located, this is presumably where the greatest impact of TAMDAR on the short-term RUC forecast would be found. The bigger area encompasses the Memphis TAMDAR hub and most of the southern extent of the TAMDAR flights. In this study we will focus on the smaller domain in Fig. 2 when discussing the objective scores. We will, however, examine the entire region subjectively using different cases.
3. CASES
Cases have been examined since 2005 for a wide variety of events, and a few of these will be shown here. The first case shown is from October 2005, and remains the most dramatic warm-season precipitation case where the RUC forecast using TAMDAR was distinctly better than the forecast without TAMDAR. Most of the cases had far less difference between the two model forecasts of 6-h accumulated precipitation than the October 2005 case. Typically, there were one or two small areas in the overall precipitation forecast where the forecasts differed. Our general subjective assessment of the cases is that when differences were present verification tended to favor the runs with TAMDAR over those without, although this certainly was not always the case.
3.1 4-5 October 2005: Midwest thunderstorms.
When we first examined this case we were quite impressed by the large differences between the two forecasts, and the better verification for the RUC runs with TAMDAR. The main meteorological feature was a stalled front reaching from central Minnesota eastward across northern Wisconsin (Fig. 3). Widespread thunderstorms formed on both sides of the front and persisted over the same area, producing heavy precipitation, with eleven reports of flooding in northern Wisconsin and over a dozen flood reports in Minnesota. Two 6-h periods were evaluated, one for the 1800 UTC 4 October forecasts ending at 0000 UTC, and another for the set of forecasts initialized 6 h later. In addition to the heavy rains, a distinct feature of this event was the very sharp cutoff to the precipitation, with basically nothing falling over central and southern Wisconsin in the periods of
3
Fig. 2. Verification domains used for the objective scoring. Triangles denote RAOB sites.

13th Conference on Aviation, Range and Aerospace MeteorologyJanuary 2008, New Orleans, LA, Amer. Meteor. Soc.
interest. This is depicted in the NPVU 6-h estimated precipitation, shown for the first period in Fig. 4. Precipitation amounts in the 1.5 to 3-in range are found over much of northern Wisconsin into the Upper Peninsula of Michigan. There is a very sharp southern cutoff, however, not only to the heavy rains, but the precipitation in general across Wisconsin.
Forecasts from the two RUC runs (with and without TAMDAR), verifying for the same period as the precipitation estimate in Fig. 4, are presented in Fig. 5. Both forecasts have precipitation extending too far south and do not resolve the sharp southern edge to the precipitation. The main difference between the forecasts occurs across the northern half of Wisconsin, where the RUC run using TAMDAR more closely matches the observed area of heavy precipitation compared to
the run without TAMDAR, which has the rainfall shifted too far north. The maximum rainfall in the run with TAMDAR is a small area of greater than one inch, still quite a bit less than what is estimated to have fallen, but more precipitation than the non-TAMDAR run predicts.
Because this period ends at 0000 UTC, it is possible to compare 6-h forecast soundings with observed soundings. A better forecast sounding by the RUC run using TAMDAR for soundings near or upstream of the precipitation region might help explain the superior precipitation forecast for the RUC run with TAMDAR. Comparison sounding forecasts for Lincoln, Illinois (ILX), and Detroit, Michigan (DTX) are illustrated in Fig. 6. While the temperature profiles for both forecasts are similar, the moisture profiles are not. For both locations the RUC run with TAMDAR (labeled dev2) is more moist, and closer to the collocated RAOB, than the forecasts from the RUC run that did not use TAMDAR (labeled dev1). The difference in the 700 to 850-mb layer at DTW is particularly striking, with
4
Fig. 5. Comparison of the 6-h accumulated precipitation forecasts from the 1800 UTC 4 October RUC runs without (a) and with (b) TAMDAR. The precipitation scale (inches) is the same for both images.
Fig. 3. Composite low-level reflectivity with surface mean sea level pressure and front analysis and METARs for 2100 UTC 4 Oct 2005.
Fig. 4. NPVU precipitation estimate for the 6-h period ending 0000 UTC 5 Oct 2005, in inches.

13th Conference on Aviation, Range and Aerospace MeteorologyJanuary 2008, New Orleans, LA, Amer. Meteor. Soc.
the dev1 forecast having a very dry layer that is not present in the observations or the sounding from the RUC forecast using TAMDAR. The drier environment in the RUC forecast for the run not using TAMDAR might explain both the smaller maximum rainfall amounts and the northward shift in the precipitation area, in the sense that a drier air mass would require greater lift to reach saturation, which would tend to occur further north of the stalled frontal boundary.
The second verification period brackets the
next RUC forecast run initialized at 0000 UTC on 5 October, when more heavy precipitation continued through the next 6 h across basically the same area of Wisconsin and Minnesota. The radar image overlaid with a frontal analysis in Fig. 7 illustrates that the rain continued to fall especially hard across northern Wisconsin, with a very sharp cutoff to the precipitation at its southern end. This is also seen in the 6-h estimated precipitation accumulation in Fig. 8, with maximum values in the 2 to 3-in range over northwest Wisconsin.
A comparison between the two RUC forecasts of 6-h accumulated precipitation for the same 6-h
period ending at 0600 UTC on 5 October is shown in Fig. 9. The differences between the forecasts with and without TAMDAR are even more distinct for this period than they were for the forecasts from the previous run. The most apparent difference is that the RUC forecast from the run that includes TAMDAR very nicely captures the very sharp southern cutoff of precipitation for this 6-h period, while the forecast from the run that did not have TAMDAR has scattered areas of rainfall all the way south into northern Illinois. Similar to the previous 6-h period, there are differences in the location of the heavy rain, with the RUC forecast for the model that uses TAMDAR data focusing the heavy rain over northwestern Wisconsin near to where it occurs, while the other forecast shifts the heavier precipitation to over Minnesota.
3.2 7 December 2007: KY rain band.
This is an interesting case not because it is particularly dramatic in terms of heavy precipitation or high impact, but because it occurs near the
5
Fig. 8. NPVU precipitation estimation for the 6-h period ending 0600 UTC 5 October, in inches.
Fig. 7. As in Fig. 3, for 0300 UTC 5 Oct 2005.
Fig. 6. Comparison of 6-h forecast soundings from the RUC 1800 UTC 5 Oct runs with (labeled dev2) and without (labeled dev1) TAMDAR, compared to observed soundings at Lincoln, Illinois (ILX, (a)), and Detroit, Michigan (DTW, (b)).

13th Conference on Aviation, Range and Aerospace MeteorologyJanuary 2008, New Orleans, LA, Amer. Meteor. Soc.
Memphis (MEM), Tennessee TAMDAR hub, where there is a concentration of TAMDAR flights (see Fig. 1). A radar overview of the “event” is shown in Fig. 10. At 1800 UTC (top, Fig. 10) on 7 December rain showers began to increase along the KY-TN border to the north of MEM, expanding eastward and lifting slightly north by 2100 UTC (Fig. 10, middle), to cover most of KY by 0000 UTC on 8 December (Fig. 10, bottom). Low ceilings and low visibility in fog were found across much of KY as this band of rain expanded. The 1800 UTC RUC forecasts are compared for this band of precipitation, which is positioned to take advantage of the concentration of TAMDAR flights that should give an advantage to the RUC forecast with TAMDAR. Forecasts from the two runs are compared in Fig. 11, using 3 and 6-h forecasts of 3-h accumulated precipitation with sea-level pressure and 1000 to 500-mb thickness from the 1800 UTC runs, valid at 2100 UTC/7 December and 0000 UTC/8 December. The 6-h estimate of accumulated precipitation from the NPVU is shown in Fig. 12.
Precipitation develops eastward too slowly in both forecasts, but by 0000 UTC the RUC run using TAMDAR has a line of precipitation west to east across KY that is in reasonable agreement with the radar echoes, and not found in the forecast that did not have the TAMDAR data. By 0000 UTC/8 December the accumulated precipitation and location of the rain band in the RUC forecast with TAMDAR compared well with the estimated precipitation, whereas the RUC forecast without TAMDAR still had not forecast any precipitation eastward across TN or KY. The closest RAOB to the band of precipitation is at Nashville, Tennessee (BNA). A comparison of interpolated soundings for BNA for 6-h forecasts from the two RUC 1800 UTC runs with the BNA RAOB is shown in Fig. 13. The main difference between the two forecasts is that the RUC run without TAMDAR is too dry in the layer between
6
Fig. 9. RUC 6-h forecasts, ending 0600 UTC 5 October, of accumulated precipitation (in) without (a) and with (b) TAMDAR.
Fig. 10. As in Fig. 3, for 1800 UTC 7 Dec 07 (top), 2100 UTC (middle), and 0000 UTC 8 Dec (bottom).

13th Conference on Aviation, Range and Aerospace MeteorologyJanuary 2008, New Orleans, LA, Amer. Meteor. Soc.
800 to 700 mb compared to the RAOB. The RUC run with TAMDAR compares very closely to the RAOB in this same layer. Overrunning of the cooler airmass to the north appears to be the primary mechanism for the development of the east-west band of rain, so the drier layer aloft in the forecast that did not have the band of precipitation could explain the lack of precipitation in the RUC run without TAMDAR. A similar sounding comparison but for the 1800 UTC analysis from both RUC runs is shown in Fig. 14, along with soundings from several nearby TAMDAR flights in the ~3 h before 1800 UTC. This comparison reveals that the dry layer found in the 6-h forecast from the RUC run without TAMDAR was also present in the analysis, through the 700 to 800-mb layer. Note how the analysis from the RUC run that used TAMDAR is more moist in this layer, similar to the greater moisture in the layer that is seen in the collection of TAMDAR soundings prior to 1800 UTC. This suggests that the TAMDAR data were important to the better forecast for this case.
3.3 7-8 January 2008: unusual late season tornado outbreak and post-frontal rain/snow.
This was an impressive event, highlighted by an unusually strong outbreak of severe weather with tornadoes occurring quite far north, into southeast Wisconsin late on 7 January 2008 (Fig. 15). The second part of this event involves an area of rain and modest snowfall in the Midwest as the system exited. Two time periods will be examined for precipitation for this case, with another for visibility and ceiling, concentrating on the Midwest. The first is for forecasts from the 1800 UTC 7 January runs, which includes the tornadoes that occurred in southeast Wisconsin between 2200-2300 UTC. A radar overview for the 1800 UTC 7 to 0000 UTC 8 January period is shown in Fig. 16. The second precipitation period
7
Fig. 12. NPVU precipitation estimation for the 6-h period ending 0000 UTC 8 December, in inches.
RUC without TAMDAR
valid at: 2100 UTC 0000 UTC
RUC with TAMDAR
Fig. 11. RUC forecasts from the 1800 UTC 7 Dec 07 runs valid at 2100 UTC/7 Dec and 0000 UTC /8 Dec. Forecast products are 3-h accumulated precipitation (image, in inches, with the scale shown above), mean sea-level pressure (mb, solid lines), and 1000-500 mb thickness (dotted lines).
Fig. 13. Comparison of 6-h forecast soundings from the RUC 1800 UTC 7 Dec 07 runs with (labeled dev2) and without (labeled dev1) TAMDAR, compared to the 0000 UTC RAOB from Nashville (BNA), Tennessee.
Fig. 14. Comparison of analysis soundings from the RUC 1800 UTC 7 Dec 07 runs with (labeled dev2) and without (labeled dev1) TAMDAR, compared to three TAMDAR soundings, into Memphis (MEM) at 1530 UTC, and Chattanooga (CHA), Tennessee, at 1653 and 1741 UTC.

13th Conference on Aviation, Range and Aerospace MeteorologyJanuary 2008, New Orleans, LA, Amer. Meteor. Soc.
is from 24 h later, when the same area experienced a modest snowfall on the cold side of a surface low that developed along the previous day's severe-weather-producing cold front.
The radar overview for the first period shows the evolution of the convection on the afternoon of 7 January. At 1800 UTC thunderstorms embedded within the cold air were found across northern Michigan westward into Wisconsin, while farther south, convection along the cold front was still disorganized. This convection blossomed however in the next few hours, with a severe weather producing broken line of storms from southwest Missouri north-northeast to northern Illinois by 2100 UTC. The line of severe storms continued to fill in further through the next 3 h ending at 0000 UTC (Fig. 16, bottom panel). The tornadoes in southeast Wisconsin developed from a couple of long-lived cells that formed in Illinois and moved across the border after 2100 UTC. This is seen in the 6-h accumulated precipitation ending at 0000 UTC/8 January (Fig. 17) as the narrow streak of heavy precipitation from northwest Illinois to southeast Wisconsin. Precipitation on this scale would clearly be better resolved by the RUC model at a 13-km horizontal grid resolution than the RUC at 20-km resolution used currently for the TAMDAR/no-TAMDAR comparison runs, and the two forecasts are both quite smeared in their 6-h accumulated precipitation fields (Fig. 18).
A closer look at the two forecasts from 1800 UTC in Fig. 18, compared to the observed 6-h precipitation (Fig. 17), indicates both models had trouble resolving the longer lived cells that composed the overall line, as would be expected with 20-km horizontal grid resolution. There are some precipitation differences between the two runs, with a mixed result in terms of which model verifies better. The run without TAMDAR predicted more precipitation in northern Illinois, which verifies better than the run that used TAMDAR. The opposite occurs in northern Wisconsin, with the TAMDAR run better in this area. Sounding
8
Fig. 15. Severe weather reports from the Storm Prediction Center for 24-h ending 1200 UTC 8 Jan.
Fig. 16. As in Fig. 3, for 1800 UTC 7 Jan (top), 2100 UTC (middle), and 0000 UTC 8 Jan (bottom).
Fig. 17. NPVU precipitation estimation for the 6-h period ending 0000 UTC 8 Jan 2008, in inches.

13th Conference on Aviation, Range and Aerospace MeteorologyJanuary 2008, New Orleans, LA, Amer. Meteor. Soc.
comparisons for this case at Green Bay (GRB), Wisconsin and Lincoln, Illinois (ILX) did not indicate substantially different forecast soundings between the two runs for this case.
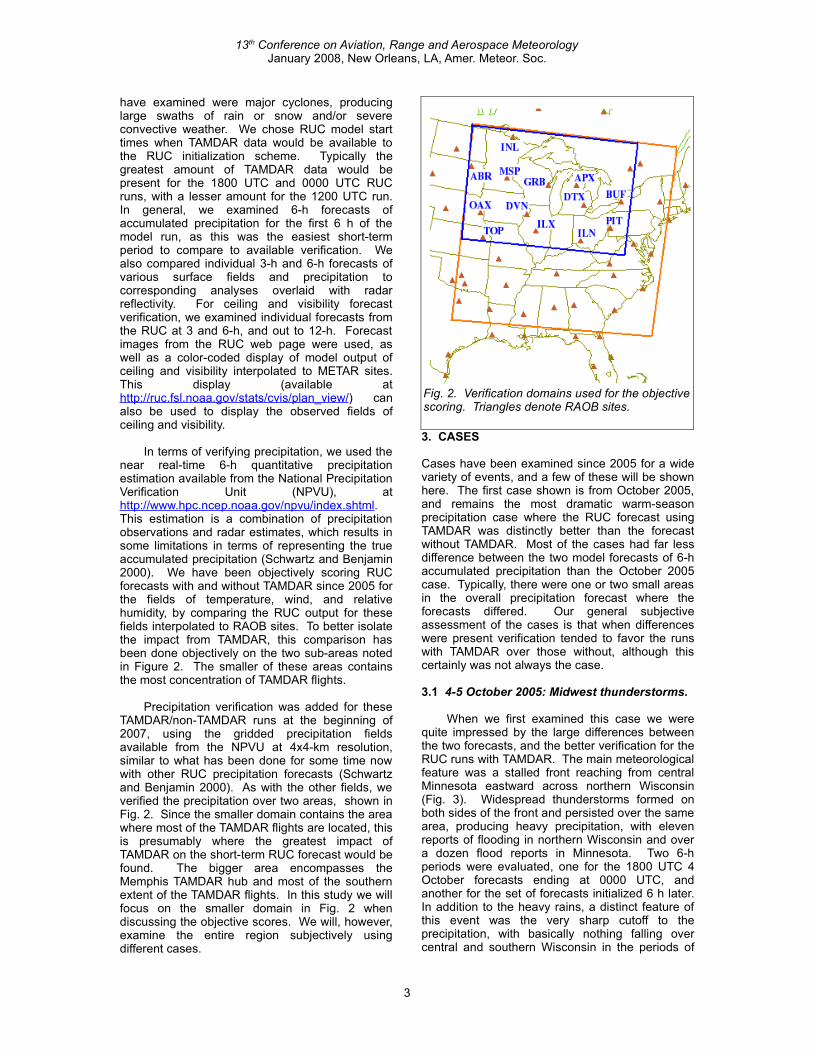
Following the severe weather outbreak, widespread fog and low ceilings became an issue over portions of the Midwest in the cold air northwest of the quasi-stationary front (Fig. 19). A close-up of the visibility and ceiling reports for the Midwest is shown in Fig. 20. Next we will examine the short-term forecasts of visibility and cloud ceiling, both critical elements for aviation concerns, from the 0000 UTC/8 January 2008 runs. RUC 6-h forecasts of visibility from the TAMDAR/no-TAMDAR runs are shown in Fig. 21, with forecasts for cloud ceiling in Fig. 22.
There are not huge differences between the two ceiling and visibility forecasts but some are found; for visibility the RUC run with TAMDAR has low visibilities extending west into northeastern South Dakota, as well as more lowest visibility
category in eastern Wisconsin. Verification (Fig. 20) is mixed, with the RUC run with TAMDAR better in eastern Wisconsin, but not verifying in the western extension into the Dakotas. For the ceiling forecasts a similar over-forecast of low ceilings by the RUC run with TAMDAR occurs in the far eastern Dakotas, otherwise the sliver of higher ceilings in southern Wisconsin in the RUC forecast from the run without TAMDAR has no support in the observations.
The last part of this case examines the RUC forecasts from the 1800 UTC/8 January runs for precipitation that occurred on the cold side of a surface low that develops along the front the day after the tornado outbreak. An overview of the weather for 8 January is shown in Fig. 22. The slow-moving cold front is still active across the middle of the CONUS, but the precipitation of
9
Fig. 18. Comparison of the 6-h accumulated precipitation forecasts from the 1800 UTC 7 January 2008 RUC runs without (left) and with (right) TAMDAR, in inches.
Fig. 19. As in Fig. 3, for 0600 UTC 8 Jan 2008.
Fig. 20. Plot of ceiling (circles, with numbers to the left giving the ceiling height above ground level in hundreds of feet) and visibility (number below circle, in miles) from METAR observations, for 0600 UTC 8 Jan 2008.
13th Conference on Aviation, Range and Aerospace MeteorologyJanuary 2008, New Orleans, LA, Amer. Meteor. Soc.
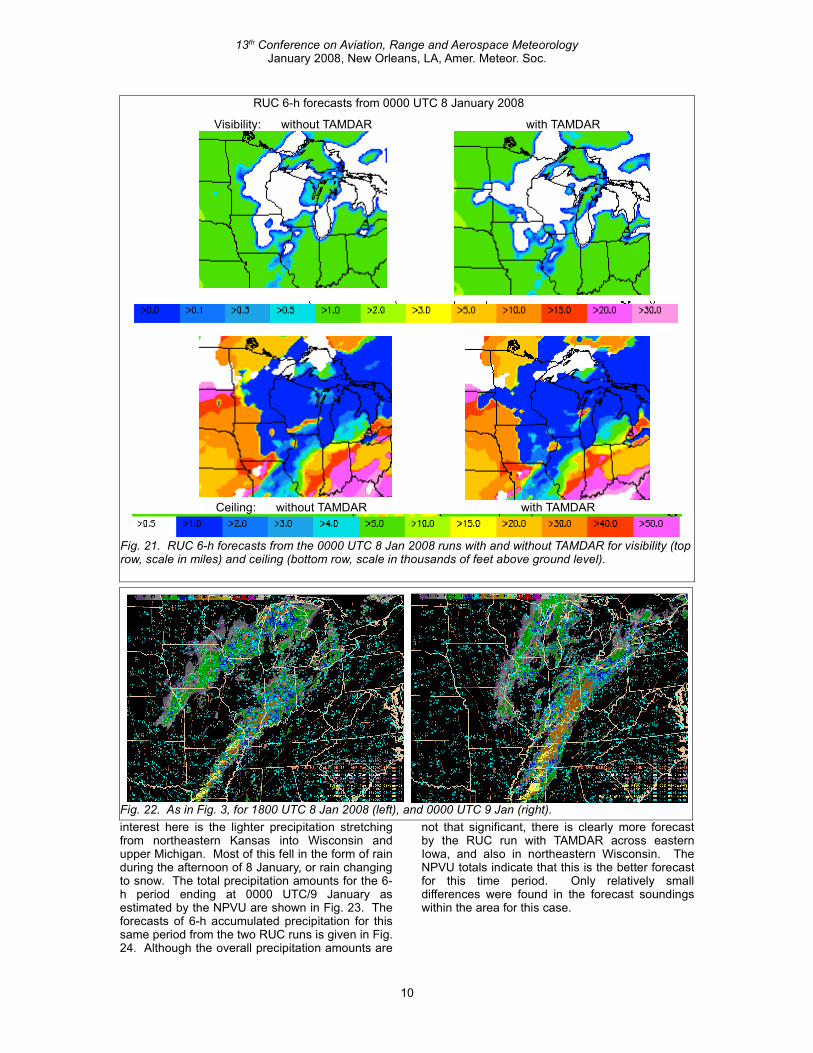
interest here is the lighter precipitation stretching from northeastern Kansas into Wisconsin and upper Michigan. Most of this fell in the form of rain during the afternoon of 8 January, or rain changing to snow. The total precipitation amounts for the 6-h period ending at 0000 UTC/9 January as estimated by the NPVU are shown in Fig. 23. The forecasts of 6-h accumulated precipitation for this same period from the two RUC runs is given in Fig. 24. Although the overall precipitation amounts are
not that significant, there is clearly more forecast by the RUC run with TAMDAR across eastern Iowa, and also in northeastern Wisconsin. The NPVU totals indicate that this is the better forecast for this time period. Only relatively small differences were found in the forecast soundings within the area for this case.
10
RUC 6-h forecasts from 0000 UTC 8 January 2008
Visibility: without TAMDAR with TAMDAR
Ceiling: without TAMDAR with TAMDAR
Fig. 21. RUC 6-h forecasts from the 0000 UTC 8 Jan 2008 runs with and without TAMDAR for visibility (top row, scale in miles) and ceiling (bottom row, scale in thousands of feet above ground level).
Fig. 22. As in Fig. 3, for 1800 UTC 8 Jan 2008 (left), and 0000 UTC 9 Jan (right).

13th Conference on Aviation, Range and Aerospace MeteorologyJanuary 2008, New Orleans, LA, Amer. Meteor. Soc.
3.4 10 Jan 2008: modest Midwest snowstorm.
The final precipitation case is a modest system that produced a swath of snow from northwestern Missouri to northern Michigan on 10 January 2008. An overview of the synoptic situation is given in
Fig. 25. Only two days after the big severe-weather producing front discussed in the previous case, a rapidly moving trough brought more severe weather to the Southeast. On the cold side of the surface low, centered over Missouri at 1800 UTC (Fig. 25), rain was changing to snow. As a result various winter weather warnings had been hoisted by the afternoon of 10 January (Fig. 26). A close-up of the radar and observations in Fig. 27 shows the precipitation changing over to snow and increasing during the evening of 10 January.
The surface low in Missouri at 1800 UTC (Fig. 25) moved slowly to the northeast through the next 12 to 18 h, with rain changing to snow from Missouri to northern Illinois, and mostly snow in Wisconsin and Iowa. Most of the precipitation from central Iowa/Illinois northward, and virtually all the snow, fell after 1800 UTC, with the storm winding down before 1200 UTC on 11 January. Given this timing, we can contrast 18-h forecasts of precipitation and snow from the two RUC models (Fig. 27) with 24-h precipitation (Fig. 28) and snowfall (Fig. 29) measurements for this case.
11
Fig. 23. NPVU precipitation estimation for the 6-h period ending 0000 UTC 9 Jan 2008, in inches.
RUC forecast without TAMDAR
RUC forecast with TAMDAR
Fig. 24. RUC 6-h forecasts of accumulated precipitation (inches) from the 1800 UTC 8 Jan 2008 runs without (top) and with (bottom) TAMDAR.
Fig. 25. As in Fig. 3, but with 500 mb height analysis from the RUC, for 1800 UTC 10 Jan 08.
Fig. 26. NWS watches, warnings and other advisories, as of 2152 UTC on 10 Jan 2008.

13th Conference on Aviation, Range and Aerospace MeteorologyJanuary 2008, New Orleans, LA, Amer. Meteor. Soc.
12
Fig. 28. NPVU precipitation estimation for the 24-h period ending at 1200 UTC 11 Jan 2008, in inches.
RUC 18-h forecasts: without TAMDAR with TAMDAR
Fig. 27. RUC 18-h forecasts of accumulated precipitation (top, in inches) and accumulated snow (bottom, inches) from the 1800 UTC 10 Jan 2008 runs without (left side) and with (right side) TAMDAR.
Fig. 29. Snowfall reports in Wisconsin for the 24-h period ending ~1200 to 1500 UTC on 11 Jan 2008, in inches.

13th Conference on Aviation, Range and Aerospace MeteorologyJanuary 2008, New Orleans, LA, Amer. Meteor. Soc.
There are some differences in several areas between the two precipitation forecasts in Fig. 27. Focusing on the snowfall forecast and the Wisconsin area, the RUC run with TAMDAR predicts greater precipitation and snowfall in the eastern half of Wisconsin than the run without TAMDAR, and based on the observed precipitation and snowfall this is a better overall forecast.
3.5 21 Dec 2007: Dense fog in the Midwest.
Widespread and persistent fog and low cloudiness raised havoc with Christmas travelers in the Midwest just before the holidays in 2007, canceling and delaying many flights. This final case looks at RUC 1800 UTC forecasts for one of
these foggy days, on 21 December 2007. Visibility and ceiling conditions during the afternoon and early evening of 21 December are shown in Fig. 30. The RUC 3- and 6-h forecasts of visibility for these same times are shown in Fig. 31. In this case the main differences between the two model forecasts, for both valid times, is greater coverage for the lowest forecast interval (0.5 miles or less) across Wisconsin and into Minnesota for the RUC run that does not use TAMDAR. In this case, comparison with the observations indicates that more fog (low visibility) coverage is the better forecast, so for this case the TAMDAR data did not lead to a better forecast. Often we have found cases where the results are mixed, with the RUC run with TAMDAR better in some areas than the run without TAMDAR, but not so in other areas.
13
Fig. 29. Snowfall reports in Wisconsin for the 24-h period ending ~12-1500 UTC on 11 Jan 2008, in inches.
Fig. 30. METAR plots of ceiling and visibility, as in Fig. 20, for 2100 UTC 21 Dec (top) and 0000 UTC 22 Dec (bottom). Plot at 2100 UTC is overlaid on a visible satellite image, while the one for 0000 UTC on a 11-3.9 micron satellite image, with fog/low clouds appearing dark (unless higher clouds are present).

13th Conference on Aviation, Range and Aerospace MeteorologyJanuary 2008, New Orleans, LA, Amer. Meteor. Soc.
For this case, one reason for the lack of improvement could be that there was less TAMDAR data available because of the fog canceling flights. The lower amount of TAMDAR data is seen by comparing flights from the late morning of 21 December 2007 with a day earlier in December with a full slate of flights (Fig. 32). Note that the TAMDAR flights into Illinois and eastern Iowa, and to a lesser extent Wisconsin, are missing on 21 December, presumably canceled because of the fog. Still, there were a lot of flights out of Minneapolis, and northern Wisconsin, and of course to the east in Michigan, so while the TAMDAR data was indeed more limited on 21 December, there was still some data available for the RUC run.
4. SOME OBJECTIVE SCORES
As noted earlier, we have been calculating various objective scores for the parallel RUC runs with and without TAMDAR. The longest running (since 2005) objective scores have come from comparison with 0000 UTC RAOB data for temperature, wind, and relative humidity. An
14
RUC forecasts: without TAMDAR with TAMDAR
Fig. 31. RUC 3-h (top row) and 6-h (bottom row) forecasts of visibility (in miles) from the 1800 UTC 21 Dec 2007 runs without (left side) and with (right side) TAMDAR.
Fig. 32. Comparison of TAMDAR flights from 15 to 18 UTC on 21 Dec (top) and 7 Dec (bottom).

13th Conference on Aviation, Range and Aerospace MeteorologyJanuary 2008, New Orleans, LA, Amer. Meteor. Soc.
update on these scores is found in Moninger et al. (2008, this conference). Scores have also been calculated for forecasts of visibility and ceiling by comparing to METAR observations, and some of these are discussed briefly below. Precipitation objective scores, discussed earlier, are also briefly highlighted here. For these fields the scoring discussed is for the area covered by the smaller box in Fig. 2.
Visibility and ceiling are scored separately, as well as via the combined aviation fields of LIFR, IFR, MVFR, and VFR, which represent the various categories important to aviation concerns and NWS Terminal Aviation Forecasts (TAFs). LIFR is the most severe and limiting category, with ceiling below 500 ft AGL and/or visibility below 1 mile. The Critical Success Index (CSI) scores for the end of 2007 into early January 2008 for LIFR for 6-h forecasts from the 1800 UTC and 0000 UTC RUC runs are shown in Fig. 33. There is
considerable day-to-day variability in the scores, with perhaps a slight trend, at least in the forecasts valid at 0000 UTC, for the run with TAMDAR (labeled dev2 in the figures) to be slightly better than the run without TAMDAR. However, there are several days where the opposite is true, and in general, at least for scores as measured by CSI for the overall area near where most of the TAMDAR flights occur (small box in Fig. 2), the improvement due to TAMDAR is small.
Precipitation scores are listed in Tables 1 and 2 for the cool season period of 1 Oct 2007 to 13 Jan 2008, for forecasts of 6-h accumulated precipitation from the RUC runs with and without TAMDAR, for the region encompassing the small box in Fig. 2. Table 1 compares the scores from the 1800 UTC runs, and Table 2 the scores from the 0000 UTC runs. Comparison of the various numbers indicates relatively small differences between the two RUC runs over this three and a half month period. The Equitable Threat Score (EQTS) is better for the run with TAMDAR by a slim margin in most of the categories for the 6-h forecasts from the 1800 UTC runs (Table 1), though this is not the case so much for the 0000 UTC runs (Table 2). Better EQTS and bias for TAMDAR runs are colored in red in the tables. Scores for a summer period (1 Jun-15 Sep 07, not shown) were quite close for all categories.
Table 1. Scores for 6-h precipitation forecasts for RUC 1800 UTC runs for 1 Oct 07-13 Jan 08.
RUC 1800 UTC run without TAMDAR
Threshold Obs Fcst Hits EQTS Bias
0.01 78375 107054 54228 0.344 1.366
0.10 21963 30718 13218 0.316 1.399
0.25 8923 10451 4086 0.260 1.171
0.50 3078 2558 883 0.184 0.831
1.00 457 323 99 0.145 0.707
1.50 121 69 26 0.158 0.570
2.00 30 14 2 0.048 0.467
RUC 1800 UTC run with TAMDAR
0.01 78375 108141 54495 0.343 1.380
0.10 21963 30977 13340 0.317 1.410
0.25 8923 10543 4062 0.256 1.182
0.50 3078 2564 890 0.185 0.833
1.00 457 315 99 0.147 0.689
1.50 121 69 27 0.166 0.570
2.00 30 14 2 0.048 0.467
Threshold = precipitation amount in inchesObs = number of observationsFcst = number of forecasts in this categoryPOD = Probability of DetectionFAR = False Alarm RatioEQTS = Equitable Threat Score
15
Fig. 33. CSI scores from 20 Nov 07 to 15 Jan 08 for 6-h forecasts from the RUC runs with TAMDAR (dev2, red line) and without TAMDAR (dev, blue line), and the difference (black line, positive if dev2 is better), valid at 0000 UTC (top) and 0600 UTC (bottom). Yellow line highlights the scores for the two cases discussed in Section 3.

13th Conference on Aviation, Range and Aerospace MeteorologyJanuary 2008, New Orleans, LA, Amer. Meteor. Soc.
Table 2. Scores for 6-h precipitation forecasts for RUC 0000 UTC runs for 1 Oct 07-13 Jan 08.
RUC 0000 UTC run without TAMDAR
Threshold Obs Fcst Hits EQTS Bias
0.01 81241 104159 55552 0.356 1.282
0.10 24406 34732 14990 0.317 1.423
0.25 9696 13069 4774 0.256 1.348
0.50 3239 3356 981 0.172 1.036
1.00 539 294 74 0.097 0.545
1.50 135 71 21 0.113 0.526
2.00 27 25 4 0.083 0.926
RUC 0000 UTC run with TAMDAR
0.01 81241 107011 56467 0.356 1.317
0.10 24406 35502 15074 0.313 1.455
0.25 9696 13081 4756 0.255 1.349
0.50 3239 3189 924 0.165 0.985
1.00 539 269 71 0.096 0.499
1.50 135 70 20 0.108 0.519
2.00 27 22 4 0.089 0.815
Individual cases of course displayed more variability, sometimes favoring the RUC run with TAMDAR by greater amounts than in these long-term values. For example, for a couple of the cases discussed earlier some comparisons of the EQTS include the following: for 6-h forecasts from the 1800 UTC runs in the 0.10-0.24 in category 0.458 for dev2 (with TAMDAR) vs. 0.425 for dev (without TAMDAR), and for the next category (0.25-0.49 in) 0.281 vs. 0.264 favoring TAMDAR. Slightly smaller differences for these two categories, generally favoring the run with TAMDAR, were seen for the 6-h forecasts from the 10 Jan 08 1800 UTC runs.
5. SUMMARY AND CONCLUSIONS
ESRL/GSD has been evaluating the impact of TAMDAR on short-term numerical model forecasts for several years using data from the GLFE in parallel runs of the RUC model; one with and the other without TAMDAR. In this paper, we have presented several examples of the forecasts from these runs for a variety of weather events, all of which have an impact on aviation. Some of the cases demonstrated that the TAMDAR data can have a positive impact, and result in a better forecast for fields such as precipitation, visibility, and cloud ceiling. Indeed, long-term statistics have indicated a general positive impact for a number of forecast variables. This is not always the case, of course, as shown by the last example, and in fact, there are often cases where the
forecast differences are small, or improved in one area but not necessarily the other. Nonetheless, the overall consensus from examination of many cases is that TAMDAR can help to improve short-term forecasts from the RUC.
5. ACKNOWLEDGMENTS
This research is in response to requirements and funding by the Federal Aviation Administration (FAA) under interagency agreement DTFAWA-03-X-02000. The views expressed are those of the authors and do not necessarily represent the official policy or position of the FAA. We thank Ed Tollerud of GSD for an internal scientific review and Annie Reiser of GSD for a technical review.
6. REFERENCES
Benjamin, S., D. Devenyi, S. S. Weygandt, K. J. Brundage, J. M. Brown, G. A. Grell, D. Kim, B. E. Schwartz, T. G. Smirnova, and T. L. Smith, 2004: An Hourly Assimilation-Forecast Cycle: The RUC. Mon. Wea. Rev., 132, 495-518.
Benjamin, S., W. Moninger, T. L. Smith, B. Jamison, and B. Schwartz, 2006: TAMDAR aircraft impact experiments with the Rapid Update Cycle. 10th Symposium on IOAS-AOLS, Atlanta, GA, Amer. Meteor. Soc., Paper 9.8.
Benjamin, S., W. Moninger, T. L. Smith, B. Jamison, E. J. Szoke and T. W. Schlatter, 2007: 2006 TAMDAR impact experiment results for RUC humidity, temperature, and wind forecasts. 11th Symposium on IOAS-AOLS, San Antonio, TX, Amer. Meteor. Soc., Paper 9.2.
Benjamin, S., S. Weygandt, K. J. Brundage, J. M. Brown, T. G. Smirnova, D. Devenyi, K. Brundage, G. Grell, S. Peckham, T. W. Schlatter, T. L. Smith, and G. S. Manikin, 2008: Implementation of the radar-enhanced RUC. 13th Conference on Aviation, Range and Aerospace Meteorology, New Orleans, LA, Amer. Meteor. Soc., Paper 6.2.
Brusky, E. S., and P. Kurimski, 2006: The Utility of TAMDAR Regional Aircraft Sounding Data in Short-term Convective Forecasting. 10th Symposium on IOAS-AOLS, Atlanta, GA, Amer. Meteor. Soc., Paper 9.5.
Brusky, E. S., and R. D. Mamrosh, 2006: The Utility of Aircraft Soundings in Assessing the Near Storm Environment. 23rd Conference on Severe Local Storms, St. Louis, MO, Amer. Meteor. Soc., Paper 2.1.
Daniels, T. S., W.R. Moninger and R.D. Mamrosh, 2006: Tropospheric Airborne Meteorological Data Reporting (TAMDAR) Overview. 10th Symposium on IOAS-AOLS, Atlanta, GA, Amer. Meteor. Soc., Paper 9.1.
Druse, C-M, 2007: Evaluating the benefits of TAMDAR data in aviation forecasting. 11th Symposium on IOAS-AOLS, San Antonio, TX, Amer. Meteor. Soc., Paper 9.5.
16

13th Conference on Aviation, Range and Aerospace MeteorologyJanuary 2008, New Orleans, LA, Amer. Meteor. Soc.
Fischer, A., 2006: The Use of TAMDAR (Tropospheric Airborne Meteorological Data Reporting) as a Convective Forecasting Supplement in the Northern Plains and Upper Midwest. 10th Symposium on IOAS-AOLS, Atlanta, GA, Amer. Meteor. Soc., Paper 9.6.
Mamrosh, R.D., E. S. Brusky, J. K. Last, E. J. Szoke, W. R. Moninger, and T. S. Daniels, 2006: Applications of TAMDAR Aircraft Data Reports in NWS Forecast Offices. 10th Symposium on IOAS-AOLS, Atlanta, GA, Amer. Meteor. Soc., Paper 9.4.
Moninger, W.M., F. Barth, S. G. Benjamin, R. S. Collander, B. D. Jamison, P. A. Miller, B. E. Schwartz, T. L. Smith, and E. Szoke, 2006: TAMDAR evaluation work at the Forecast Systems Laboratory: an overview. 10th Symposium on IOAS-AOLS, Atlanta, GA, Amer. Meteor. Soc., Paper 9.7.
Moninger, W.M., F. Barth, S. G. Benjamin, R. S. Collander, B. D. Jamison, T. W. Schlatter, T. L. Smith, and E. Szoke, 2007a: TAMDAR/AMDAR data assessments using the RUC at NOAA's Global Systems Division. 11th Symposium on IOAS-AOLS, San Antonio, TX, Amer. Meteor. Soc., Paper 9.1.
Moninger, W.M., F. Barth, S. G. Benjamin, B. D. Jamison, T. W. Schlatter, T. L. Smith, and E. J. Szoke, 2007b: TAMDAR and its impact on Rapid Update Cycle (RUC) forecasts. 22nd Conference on Weather Analysis and Forecasting/18th Conference on Numerical Weather Prediction, Park City, UT, Amer. Meteor. Soc., Paper 4A.3.
Moninger, W.M., S. G. Benjamin, B. D. Jamison, T. W. Schlatter, T. L. Smith, and E. Szoke, 2008: New TAMDAR fleets and their impact on Rapid Update Cycle (RUC) forecasts. 13th Conference on Aviation, Range and Aerospace Meteorology, New Orleans, LA, Amer. Meteor. Soc., Paper 2.20.
Schwartz, B., and S. Benjamin, 2000: Verification of RUC2 Precipitation Forecasts Using the NCEP Multisensor Analysis. 4th Symposium on Integrated Observing Systems, Long Beach, CA, Amer. Meteor. Soc., Paper 5.2.
Szoke, E. J., R. S. Collander, B. D. Jamison, T. L. Smith, T. W. Schlatter, S. G. Benjamin, and W. R. Moninger, 2006a: An Evaluation of TAMDAR Soundings in Severe Storm Forecasting. 23rd Conference on Severe Local Storms, St. Louis, MO, Amer. Meteor. Soc., Paper 8.1.
Szoke, E.J., B.D. Jamison, W.R. Moninger, S.G. Benjamin, B.E. Schwartz, and T.L. Smith, 2006b: Impact of TAMDAR on RUC forecasts: Case studies. 10th Symposium on Integrated Observing and Assimilation Systems for Atmosphere, Oceans, and Land Surface (IOAS-AOLS), Atlanta, GA, Amer. Meteor. Soc., CD-ROM, 9.9.
Szoke, E.J., S.G. Benjamin, R. S. Collander, B.D. Jamison, W.R. Moninger, T. W. Schlatter, and T.L. Smith, 2007: Impact of TAMDAR on the RUC model: A look into some of the statistics. 11th Symposium on Integrated Observing and Assimilation Systems for Atmosphere, Oceans, and Land Surface (IOAS-AOLS), San Antonio, TX, Amer. Meteor. Soc., Paper 9.4.
17