6.1. towards energy-efficient buildings in...
TRANSCRIPT

6.1.1 INTRODUCTION
The New Energy Policy was adopted by the European Council in spring 2007 (EC2008). Later in December, 2008 the European Parliament adopted a number of measures designed to: estab-lish a new energy policy, combat climate change, and boost the EU’s energy security and com-petitiveness. This integrated climate change and energy policy (EU 2002) aims to ensure that Europe has a sustainable future based on a low-carbon, energy-efficient economy. The ambi-tious targets of the agreement were identical with the Action Plan on the energy-efficiency of European Commission that introduced the goal to limit raise of the global average temperature to 2°C, compared to pre-industrial level (EU2007a). To achieve this, the EU is promoting a goal of 30% reduction in greenhouse gas emissions by 2020, compared to 1990 levels, in developed countries. Further, it has made an independent commitment to achieve at least 20% reduction. The targets for various measures up to 2020 in the EU include:
- 20% improvement of energy-efficiency of cars, buildings and appliances, and especially - 30% reduction of final energy use of buildings - 20% share of renewable energy in average - 10% share of biofuels - ≈0% emissions of new power plants. The carbon dioxide (CO2) is dominant among the greenhouse gases (GHG). A major part of
CO2 emissions is related to energy, either to production or consumption, and combustion of coal and oil fuels is the main emitter. The Kyoto protocol states a goal to reduce the amount of six Greenhouse gases at least by 5% by the year 2012 compared with the year 1990; the EU-15 countries have agreed a target of 8%.
Technologies that could reduce global CO2 emissions from energy combustion
22
24
26
28
30
32
34
36
38
2005 2010 2015 2020 2025 2030
Gt C
O2-
eq
EnergyEfficiency
Fossil fuelswitch
Renewableenergies
Nuclear energy
Carbon captureand storage
RemainingCO2 emissions
Figure 6.1.1. Potential of various technologies to affect globally to GHG emissions.
Chapter 6 – Environmental performance of constructions Coordinator: Valeriu Stoian
6.1. Towards energy-efficient buildings in Europe
Heli Koukkari VTT Technical Research Centre of Finland, Espoo, Finland [email protected]
Luís Bragança University of Minho, School of Engineering, Department of Civil Engineering, Guimarães, Portugal [email protected]
______________________________________________________________________________________________________Part II – Eco-efficiency
257

According to the communication of Commission of the European Communities (2007), most technologies to reduce GHG emissions either exist or are at an advanced stage of preparation and can reduce emissions (see Figure 6.1.1). This view concerning the construction sector has been stated by the Intergovernmental Panel on Climate Change, too (IPCC 2007).
For the EU, reducing overall consumption of energy is of great importance due to commer-cial and political reasons, too. The European Environment Agency calls the situation as “twin-challenges of climate change and energy supply security” (EEA 2006a). Dependence on the im-ported primary energy is expected to grow up to 70% in 2030 when it is nowadays 54% (Com-mission of the European Communities 2001, EEA 2008). In the EU, use of the residential and tertiary sector buildings consumes roughly 40% of total final energy use. Their energy needs are satisfied mainly by oil and gas - around 60% - whose import dependence e.g. on Russian sources is great.
From the points of views of sustainable construction, the “twin-challenges” are only a part of the picture: the fossil fuel depletion is a serious environmental load. In the Life-Cycle-Analysis of a building, the energy used in the construction process comprises the direct energy used on the construction site and the indirect energy used in the manufacture of the building materials. The indirect energy component, known as embodied energy of materials, is increas-ingly being considered because manufacture of construction materials uses about 1/3 of all en-ergy used in industries. Also, the relative importance of the embodied energy is rising when energy consumption for operation of buildings is reducing.
For all these reasons, improvements in the energy-efficiency of the European construction sector, and especially that of the existing building stock, are important for the sustainability of the construction sector. Among the measures to response the challenges, the EU is expanding the scope of the Directive on Energy performance of buildings and introducing EU perform-ance requirements that promote concepts of very low energy and neutral energy buildings.
The purpose of the paper is to give an overview on the energy consumption and energy-related emissions of the European building stock, and technologies available to respond to the challenge of major savings. Further, the state-of-the-art of methods to verify the energy per-formance of buildings as a part of a sustainability assessment is studied. The methods of the study are surveys on statistics and literature.
6.1.2 ENERGY, EMISSIONS AND BUILDINGS IN PRACTICE
6.1.2.1 Statistics about energy and buildings The European buildings are argued to be responsible of around 40% of the total final energy consumption. However, this proposition of consumption consists of two parts: operation of technical systems (heating, cooling, ventilation, warm water) and use for work and living (lighting, appliances, elevators, computers, home entertainment, saunas). The importance of this separation is due to the role of users; in particular the latter part is highly dependent on user’s behavior and aspirations.
The overall energy consumption is as such an important factor of greenhouse gas emissions: energy-related greenhouse gas (GHG) emissions account for 80 % of the total emissions (EEA 2008). Decreasing energy demand of operation and use of buildings is thus beneficial in any circumstances. On the other hand, production and sources of energy are extremely important for the impacts that are commonly and shortly addressed to “buildings”. The largest emitting economic sector in Europe is electricity and heat production, and transport follows. Both of these sectors affect in turn the energy use of the “built environment”.
Several approaches have been developed in recent years in order to support the demanding political decision-making. The European Environment Agency EEA has introduced a set of en-ergy and environment indicators that are a part of the EU’s indicators for sustainable develop-ment (EEA 2006b, Eurostat 2009). These indicators include e.g. final energy consumption by sector, greenhouse gas intensity (including carbon intensity), and total energy consumption by fuel/energy source.
The energy consumption in and of buildings is one category in statistics that in common ap-ply three main categories (“sectors”) of Industry, Buildings and Transport. The category of
Integrated Approach towards Sustainable Constructions______________________________________________________________________________________________________
258

buildings excludes industrial buildings, and consists of two subdivisions: residential and terti-ary, or households and service sector. The tertiary or service sector includes offices, wholesale and retail trade, hotels, restaurants, schools, hospitals, sport halls, indoor swimming pools etc.
In Table 6.1.1, the final energy consumption in the EU is presented. (One should take a no-tice that there are slight differences between various EU documents, and starting from the Eu-rostat or national statistics is recommended; further, the statistics tend to become more precise over time.) In figures, the negative sign of dependence shows net export of energy, and the Figure 6.1.above 100% is caused by situation of stocks. The proportions of households and services of the final energy consumption is calculated here based on the total energy consump-tion by country shown in the reference statistics. Table 6.1.1. The import dependency of gross inland consumption; total and per capita CO2 emissions; final energy consumption of households and services; and proportion of space heating inside these two sectors. (The temperature correction is not taken into account)
Country CO2 emissions in 2006
(EC 2009)
Import depen-dency (EEA 2008)
Final Energy Consumption in households and ser-vices in 2006, and its proportion of total con-
sumption of all sectors (Mtoe = Million tons of oil equivalent; and 1 Mtoe = 11630 GWh or
41868 TJ according to IEA)
Space heating alone of energy consumed in-side the respective sector 2004 (EC
2007) Households &
Services Total Per cap-
ita 2006
Totally Propor-tion
House-holds alone
Propor-tion of house-holds
House-holds
Services
Mt tn % Mtoe % Mtoe % % % BE 150 14.2 77.9 14.1 36.9 8.9 23.3 77 69 BG 55.9 7.3 46.2 3.4 34 2.2 22 - - CZ 129 12.6 28 10.5 40.1 6.5 24.8 77 75 DK 63.6 11.7 -36.8 7.4 47.4 4.4 28.2 67 45 DE 910 11 61.3 104.1 46.7 69.1 31 77 47 EE 16.7 12.4 33.5 1.4 50 0.9 32.1 72 41 EL 122.3 12 90.9 8,7 40,5 5,5 25,6 76 63 ES 395.9 9 71.9 27,2 27,9 14,8 15,2 55 20 FR 429.8 6.8 81.4 72,1 45,7 44,6 28,3 75 55 IE 50.6 11.9 51.2 4,9 37,7 3,1 23,8 68 61 IT 503.8 8.5 86.8 48.4 37 29.9 22.9 68 62 CY 9.7 12.5 102.5 0.6 33.3 0.3 16.7 0 0 LV 9.1 4 65.7 2.3 54.8 1.5 35.7 78 91 LT 15.1 4.4 64 2.2 46.8 1.4 29.8 75 58 LU 13.3 28.2 98.9 0.7 15.9 0.6 13.6 73 47 HU 61 6.1 62.5 9.8 54.7 6.2 34.6 71 68 MT 5.3 13 ? 0.1 20 0.1 20 0 0 NL 239 14.7 38 21.8 42.9 10 19.7 68 81 AT 79.1 9.6 72.9 10.3 38.4 6.6 24.6 74 62 PL 332.7 8.7 19.9 30 49.3 19.2 31.6 75 75 PT 68.4 6.5 83.1 5.7 30.8 3.2 17.3 18 36 RO 111.5 5.2 29.1 10.9 44.1 7.8 31.6 - - SI 17 8.5 52.1 1.7 34.7 1.2 24.5 72 62 SK 40.1 7.4 64 4.3 40.2 2.3 21.5 0 61 FI 71.3 13.5 54.6 8.4 31.5 4.9 18.4 59 64 SE 60.7 6.7 37.8 11.9 35.8 7 21.1 51 47 UK 597.2 9.9 21.3 60.9 40.5 42.1 28 60 57 All 4560 11 53.8 483.9 41.1 304.3 25.9
In average, the operation and use of buildings account roughly for about 40% of total final
energy consumption; this Figure 6.1.includes all energy consumption. The division between households and services is roughly 60 and 40%. Inside these statistical sectors, control of the indoor temperature consumes the major part of energy (traditionally heating dominates). Table 6.1.1 shows thus some directions for planning of technical improvements of the European building stock but true impact analysis needs also data about energy mix.
Six countries with the greatest numbers of population account for 820 Millions tons of equivalent oil (Mtoe’s) as the final energy consumption out of 1177 which makes 70%. These countries are Germany, France, Italy, Poland, Spain and the U.K. The same countries account for 3070 Mt’s of CO2 emissions that are about two thirds of the total amount of 4560 Mt’s.
When the efficiency of various energy saving measures is studied, differences between macro-economic indicators of countries cannot be overlooked, like energy sources used for
______________________________________________________________________________________________________Part II – Eco-efficiency
259

space heating, green house gas intensities and import dependency. The “energy profiles” pro-duced and published by Eurostat give detailed information by fuel how the final energy is sup-plied to the various sectors (Eurostat 2009). However, further data would be still be needed how e.g. use of electricity is divided to operation and use of building. The average European values are more indicative, and give information about trends at the EU level (Table 6.1.2). The new data shows that a reduction in energy consumption took place in EU27 in 2007 on which the German taxation policy had a great influence (EEA 2009b). Table 6.1.2. Proportion of households and services sector in final energy consumption by fuel in EU27 in 2006 (Eurostat 2008). About conversion coefficients see Table 6.1.1. Final energy demand by fuel
Total final energy
demand
Mtoe
Residential buildings
alone
Mtoe
Buildings (residential and
tertiary)
Mtoe
Share of en-ergy sources
used for buildings
%
Proportion of buildings by fuel
%
Proportion of buildings
of the total fi-nal energy
demand, % Solid fuels 55 9.9 12.5 2.6 22.7 1.1 Petroleum products 496 53.2 74.1 15.4 14.9 6.3 Natural gas 268 120.3 174 36.1 64.9 14.8 Electricity 243 69 137.4 28.5 56.5 11.7 Derived heat 20.1 29.8 6.2 Renewables 59 32.9 36.5 7.6 61.9 3.1 Else 17.3 3.6 Total 1175 481.6 100
6.1.2.2 Energy indicators of the European building stock The energy indicators of buildings are related on the other hand to the typologies of the build-ing stock and on the other hand to social and demographic information. For example, increas-ing wealth, decreasing size of households and increasing usable area per person indicate that the overall consumption of households would still increase. The slow replacement of old building stock - only 0.07% in average - is a factor that supports this trend.
In analysis of various retrofitting needs of buildings, it is common to classify the building stock into age groups according to the completing years. This approach is justified due to the similar building technologies. Table 6.1.3 gives basic information for energy-related indicators of the building stock. However, the official national statistics should be used in studies because there are differences between sources; the UNECE and Boverket have some great differences.
The number of dwellings in EU-27 is about 215 millions, of which about three fourths is concentrated in six countries: Germany (18.0%), Italy (12.3%), UK (11.9%), France (13.7%), Spain (9.7%), Poland (5.5%).
There is a significant difference between occupied (treated) floor area and the total area. Again, one should have a real data about the heated area when indicators like consumption per m2 or m3 or the potential of energy savings are evaluated. For example, in Finland there is a stock of secondary houses that is more and more used also during the winter time, and thus heated to some extent.
Several European studies have been performed concerning indicators and data needed for the evaluation of the energy performance of buildings. As the most accessible data concerns residential buildings, the work has very much concerned to it. The list of Odyssee project is similar with the indicators used in practical assessments (Odyssee 2007):
- Unit consumption per households (total, for various purposes, per m2, with climatic cor-rections, in useful energy) - Energy efficiency index - Specific consumption of new dwellings (per m3, flat, houses) - CO2 emissions (direct, total, per dwelling, for space heating)
Integrated Approach towards Sustainable Constructions______________________________________________________________________________________________________
260

Table 6.1.3. Characteristics of European building stock related to energy (UNECE 2007, Boverket 2005) Dwellings in total Age distribution of the housing stock (Boverket 2005)
Coun-try
Popula-tion 2008
(EU 2009) x103
Number Millions
Total area per per-son, m2
< 1919 1919 - 1945
1946 - 1970
1971 - 1980
1981 - 1990 > 1990
BE 10 667 4.8 86.3 15.0 16.5 29.0 15.2 9.2 15.1 BU 7 640 3.7 CZ 10 381 4.3 76.3 10.9 14.7 26.3 22.5 16.4 8.2 DK 5 476 2.6 109.1 20.2 16.9 28.3 17.6 9.7 7.4 DE 82 218 38.9 89.7 14.6 12.6 47.2 10.9 14.6 - EE 1 341 0.6 60.2 9.4 14.2 30.0 21.5 19.6 5.3 EL 11 076 5.5 82.7 3.1 7.2 31.8 24.5 19.1 14.3 ES 45 283 20.9 90.0 8.9 4.2 33.5 24.1 13.6 15.7 FR 61 876 29.5 89.6 19.9 13.3 18.0 26.0 10.4 12.4 IE 4 401 1.4 104.0 9.7 8.2 16.4 17.5 16.2 31.9 IT 59 619 26.5 90.3 18.0 19.0 47.3 18.2 9.4 7.1 CY 789 0.3 - 7.4 16.9 20.7 27.4 27.1 LV 2 271 1.0 55.4 11.0 13.8 27.7 22.6 21.1 3.7 LT 3 366 1.3 60.6 6.2 23.3 33.1 17.6 13.5 6.3 LU 484 0.2 125.0 11.9 14.8 27.0 14.9 11.6 17.1 HU 10 045 4.1 75.0 13.9 12.5 26.1 22.3 17.7 7.4 MT 410 0.1 106.4 14.9 11.0 29.4 16.9 15.8 11.8 NL 16 405 6.8 98.0 7.1 13.2 30.9 18.9 29.8 - AT 8 332 3.3 92.9 18.6 8.1 27.4 15.9 12.4 17.6 PL 38 116 11.8 68.2 10.1 13.1 26.9 18.3 18.7 12.9 PT 10 618 5.3 83.0 5.9 8.5 22.9 18.3 44.4 - RO 21 529 8.1 SI 2 026 0.8 75.0 15.3 7.9 28.1 23.6 16.2 8.7 SK 5 401 1.7 56.1 3.4 6.6 35.1 25.6 21.0 6.8 FI 5 300 2.6 77.0 1.6 8.8 30.6 23.4 20.0 14.4 SE 9 183 4.4 91.6 12.4 20.2 33.1 17.4 9.7 7.2 UK 61 186 25.6 86.9 20.8 17.7 21.2 21.8 18.5 - Data and information needed in evaluation of energy used in the building stock can be
found more frequently in publications, based on several European and international projects and networks, like e.g. International Energy Agency IEA (2007), European Programme for In-telligence Energy Europe IEE in the Competitiveness and Innovation Framework Programme (IEE 2007), European Framework Programmes for Research (especially Themes for Environ-ment and Energy) and COST Actions.
6.1.2.3 Potential of energy-efficiency of buildings Energy saving in the European building stock is a paramount effort of the construction sector at the moment. Three types of objectives exist: reduction of total final energy consumption up to the amount that is consumed for operation, reduction of energy-related greenhouse gas emissions and savings up to 80% of the operational costs. Energy-efficiency is a central part of the European Economic Recovery Plan (Commission 2008) that channels funding to R&D ac-tivities, too.
Estimated amounts of the greenhouse gas emissions from buildings and their use vary in large ranges in presentations and publications. The highest estimation says “Energy use in buildings accounts for about 70% of the total CO2 emissions associated with the use of energy in the City of Toronto (Harvey 1994). In EU27, residential and service sector buildings account less than 20% of GHGs when the production of electricity and district heating is not taken into account (EEA 2008). However, one EraBuild report tells about “the importance of reducing en-ergy consumption in buildings - responsible for over 40% of Europe's greenhouse gas emis-sions” (Itard et al 2008). Many publications tell about USA that buildings account close to half of CO2 emissions. The differences in data are in common caused by the method how electricity consumption is taken into account but there are also differences in ways the statistical data is collected and recorded. Figure 6.1.2 presents the context in which the energy consumption and energy-related GHG emissions are considered.
______________________________________________________________________________________________________Part II – Eco-efficiency
261

Primary inlandenergyconsumption
Oil
Natural Gas
Hydro
Nuclear
Coal
Final energyconsumptionby fuel
Ownresour-ces
Import
Export
Heatandelectri-cityproduc-tion
Wind
Petr. products
Natural Gas
Coal et al
Lignite et al
Renewables
Electricity
Der. heat
Final energyconsumptionby sector(e.g. households)
Heating
Cooling
Cooking
Warm water
Appliances
GHG emissionsdirectly from operation of buildings
GHG emissionsrelated to use of buildingsbut caused byenergy productionTV, PC's
Figure 6.1.2. Context to identify energy-related problems and opportunities.
In European statistics – based on official statistics of the Member States – energy-related in-
formation is based on measured data on production and consumption. GHG or CO2 emissions can be calculated based on source of energy. Macro-economic data is however only indicative with respect to potential of technical improvements in the building stock. Several studies have been conducted in order to combine the relevant technical information about buildings with the energy consumption data.
Reduction of energy consumption in buildings and its environmental and economic impacts can be studied through various scenarios and by the aid of various frameworks (Figure 6.1.3).
Figure 6.1.3. System analysis – covering the whole energy chain (DTU 2008).
The CO2 emissions of residential buildings in the EU27 were 10% of total energy-related
emissions and those of service sector 6% in 2005 (EEA 2008). In these figures, energy and heat production is excluded; its share was 27%. The tons of CO2 equivalent per a ton of oil equiva-lent of energy vary according to the energy sources; for more information see e.g. the Report 8 of the EEA (2006b).
Integrated Approach towards Sustainable Constructions______________________________________________________________________________________________________
262

The greenhouse gas emissions from energy consumption in buildings have been decreasing at a longer run in Europe (Table 6.1.4). This is partly due to improved efficiency of the build-ing stock, but also that of appliances and equipment.
Table 6.1.4. Greenhouse gas emissions from energy use in buildings (services and households) in EU27, except electricity; proportion of all the GHG emissions (EEA 2009)
Change in years Statistical sector Share of total GHG
Share of total GHG 1990-2007 2000-2007
Services 3.5 3.1 - 17.8 - 5.0 Households 8.7 7.7 - 17.3 - 11.6
Reducing growth in electricity consumption will be crucial from an environmental view-
point, especially for consumption from fossil-fuel based electricity. Two to three units of en-ergy input are needed for producing one unit of electricity form fossil fuels with the rest being lost in the process, unless the heat is recovered in combined heat and power process.
6.1.2.4 Embodied energy of a building Embodied energy is the energy consumed by all processes associated with the production of a building, from the acquisition of natural resources to delivery, and to the maintenance and re-pair activities during the operational phase. Example of embodied energy in low-energy case-study buildings in Sweden, Norway and Denmark is shown in Figure 6.1.4. Research has shown that the embodied energy content of a building can be the equivalent of many years of operational energy. Basic information can be found in literature and databases (Table 6.1.5).
Figure 6.1.4. Example of the breakdown of embodied and operational energy in a building (Thormark 2002) Table 6.1.5. Example of embodied energy of a composite steel beam and concrete slab (steeluniversity 2007).
Energy, GJ m−2 CO2 Emissions, kg m−2 Years 0 10 20 30 40 50 60 0 10 20 30 40 50 60 Structure Embodied 2.6 2.7 2.7 2.8 2.8 2.8 2.9 242 246 250 254 258 262 267
______________________________________________________________________________________________________Part II – Eco-efficiency
263

The importance of embodied energy calculations is increasing for two reasons: saving natu-ral material resources increases gradually the recycling and reuse content in buildings, and re-ducing the total energy consumption in operation of buildings changes the share of embodied energy.
6.1.3 ENERGY PERFORMANCE OF BUILDINGS
6.1.3.1 Thermal performance characteristics Knowledge on the energy-performance of buildings is needed for evaluation of the potential of energy-savings of existing buildings and for verification of the thermal performance of a new building during design process. The main interest is nowadays in the overall consumption in the context of indoor climate; in other words “energy conversation and thermal comfort”. This approach means that performance and interaction of all systems of a building have to be dealt at the same time (Figure 6.1.5).
Figure 6.1.5. Development of calculation methods and requirements in Germany since 1995 for a typical single family house in Germany (Koukkari et al 2003). As long as the construction technologies were based on natural ventilation, air leakages and varying indoor conditions, development of thermal performance was concentrating solely to envelopes. For that reason, tested values of thermal and moisture properties of materials and structural solutions, or calculations based on them, became gradually regulated. In academia, the building physics was applied to thermal performance calculations already in the beginning of 19th century.
Prescribed coefficients for heat transfer, so-called U-values (unit W/m2K) for the building’s envelopes – floor, walls and roof – are used in many countries as the principal criteria for de-sign. Nowadays, there are calculators available in the web. Also, “typical” U-values can be found there. In some countries, a more holistic ’Energy Performance’ (EP) regulation was used (the calculated energy consumption of the building, usually expressed in kWh/m2).
The year of building construction provides useful insight with regard to the type of envelope construction. On the other hand, the history of U-values is also usable when potential of en-ergy-savings is estimated. U-values as such do not tell about the energy-consumption unless the climatic conditions and the consumption patterns are not taken into account. This holds espe-cially the Southern countries in which only recently the heating and cooling demands have in-creased. Further, the regulated U-values can in many ways differ from the actual values of buildings, to both directions.
Integrated Approach towards Sustainable Constructions______________________________________________________________________________________________________
264

More than half of the existing residential buildings in EU-25 were built before 1970 and about 1/3 of the dwellings were built during the 1970–1990. On an average, new European dwellings are about 60% more energy efficient than the ones constructed before the first oil cri-sis in the 1970s, and consume 28% less than dwellings built in 1985. Actually, the most signifi-cant improvement was observed after 1990 due to the stricter measures taken by several EU member states and the introduction of higher energy standards in the mid-1990s. As a result, dwellings built in 2002 consume 24% less than dwellings built in 1990.
The Directive on Energy Performance of Buildings EPBD (EU 2002) has adopted an inte-grated approach that is similar to the Construction Products Directive, CPD. In the reasoning of the EPBD, the estimation of the saving potential of 22 % by the year 2010 is based upon sav-ings in all consumption areas, namely heating, hot water, air-conditioning and lighting. The Di-rective concerns the residential sector and the tertiary sector (offices, public buildings, etc.).
The key points of the Directive concerning structures are: - Common methodology for calculating the integrated energy performance of buildings - Minimum standards on the energy performance of new buildings and existing buildings
that are subject to major renovation
- Systems for the energy certification of new and existing buildings and, for public build-ings.
The status of the implementation of the EPBD to the national regulation in the Member States is presented at the EU’s official webpage buildingsplatform.eu, where country reports summarize the development and give links to the national regulations and tools. Several pro-jects have been conducted based on the new databases that utilize information collected for the certificates, e.g. under the CIP Framework Programme’s Intelligent Energy Europe Pro-gramme.
A proposal for the revision of EPBD was presented by the European Commission in No-vember 2008. This proposal of the EPBD recast recommended that all EU Member States en-dorse national plans and targets in order to promote the uptake of very low and close to zero energy buildings. It became indorsed in June 2010 (EU 2010). The new legislation underlines the importance of creating an energy efficient building stock as a pivotal part in the creation of a sustainable urban environment.
The aim of the EPBD recast is to clarify, strengthen and extend the scope of the 2002 direc-tive, as well as to reduce the large differences between Member States' practices in the building sector. Overall, its provisions cover energy needs for space and hot water heating, cooling, ventilation and lighting for new and existing, residential and non-residential buildings. Net zero energy buildings are now the goal within the action plan for new buildings.
6.1.3.2 Modeling and simulation Modelling and simulation based on building physics and thermodynamics are sophisticated methods for analysis of components, structures, buildings or even building stocks. They are extensively used in calculating heat losses and temperatures in buildings, in order to verify thermal performance during a design process. There are hundreds of software tools and guide-lines on the market.
Data for an energy simulation is basically the same as that for simplified energy calculation. Before carrying out the simulation, one must collect information about the local climatic data, building design, air-conditioning system and control method. The local outdoor climatic condi-tions over a year are an important piece of information and it is better to have the hourly values of the climatic data. This data is often recorded in a typical year. If the weather data for a par-ticular location is not available, it may take a lot of efforts to collect and establish this data.
The dynamic simulation of building energy consumption focuses on the hourly variations of the outdoor climatic conditions and the indoor design criteria about temperature and humidity. The air-conditioning loads and energy consumption for 8760 hours in a year or for several years are determined. Beside the part-load energy consumption, the maximum load over the year(s) will also be included.
The modelling methods are used also to analyse the condition of a building stock in an area, suburb, city or a country, and further to assess the needs and solutions of technical improve-
______________________________________________________________________________________________________Part II – Eco-efficiency
265

ments (Figure 6.1.6). In a model, typical buildings are rated for specific annual energy con-sumption per m2, and then the surface of each age-class is multiplied by the specific annual en-ergy consumption to predict the overall consumption (Kohler & Hasler 2002). Other factors and indicators can be chosen for modeling, especially when trends and impacts are studied like in Erabuild report about renovation market. Validation of these models can be achieved by comparing the sum of estimated consumption to the statistically known building energy con-sumption.
Final energyconsumptionby fuel
Petr. products
Natural Gas
Coal et al
Lignite et al
Renewables
Electricity
Der. heat
Final energyconsumptionby sector(e.g. households)
Heating
Cooling
Cooking
Warm water
Appliances
TV, PC's
Historic buildings
Buildings < 1919
Knowledge about distribution of consumptionto various purposes, and to building typologies
Buildings 1919 -1945Buildings 1945 - 1970
Building typologiesin relation to energy consumption - factors e.g.- completing year- mainstream technologies- climatic regions- technical systems- energy production- regulations- traditions
etc
Modelling ofenergy performanceand potential ofeconomic, technical,and social changes
Validation ofmodels (measured data)
IDENTIFICATIONOF SAVING POTENTIAL ANDSOLUTIONSAND IMPACTSOF PLANNEDACTIONS
IDENTIFICATIONOF HINDRANCES
Figure 6.1.6. Identification of potential of energy-efficient of building stock by modeling.
6.1.4 STRATEGIES TO IMPROVE SUSTAINABLE CONSTRUCTION
6.1.4.1 District level solutions Research and development as well as demonstration and dissemination programmes of the European Unions various organisations are emphasizing district and community level policies and solutions for energy-related challenges. Europe has launched various programmes such as ECO-BUILDINGS (more than 100 projects from FP 5, FP 6 and FP 7 in many different Euro-pean cities), CONCERTO (18 projects covering 46 different CONCERTO communities), SAVE projects in Intelligent Energy Europe (in total about 50 projects), ERACOBUILD , as well as a number of related national programmes.
In European Action Plans aiming at improved environmental performance of products and services, integrated approaches are favoured. In energy-efficiency – and overall sustainability – urban planning approaches play an important role.
Integrated research and development is requested also in the implementation of the Euro-pean Economy recovery Plan through the Framework Programme 7: “Research on the applica-tion of technological, design and organisational improvements at district-level with the aim of reducing the energy and resource consumption” is expected.
6.1.4.2 Passive and zero-energy building concepts The energy-efficiency goals of buildings have been studied in the context of the whole
building stock and built environment. There are arguments that only the zero-energy or energy neutral solutions of new buildings will have the desired impact to the needs of absolute sav-ings; less stringent goals of new building means savings of 50-80% in space heating compared the average level of current use. Various concepts have been developed in many countries. For example, NREL participates in the United States in “creation of the technology and knowledge base for cost-effective zero-energy buildings by 2025. A zero energy building is defined in the following way (NERL 2007): “…produces as much energy on-site as it consumes on an annual basis, primarily through energy efficiency with any small remaining loads met by photovoltaics and other solar energy technologies”. The Energy Research Centre of the Netherlands gives a
Integrated Approach towards Sustainable Constructions______________________________________________________________________________________________________
266

definition of a zero-energy house that “annually the energy demand can be met by locally gen-erated renewable energy” (Opstelten et al. 2007).
In fact, low energy buildings are known under different names across Europe. A survey car-ried out in 2008 by the Concerted Action supporting EPBD identified 17 different terms in use to describe such buildings used across Europe, among which the terms low energy house, high-performance house, passive house/Passivhaus, zero carbon house, zero energy house, en-ergy savings house, energy positive house, 3-litre house etc (Commission 2008). In the relevant literature additional terms such as ultra-low energy house can be found. Finally, concepts that take into account more parameters than energy demand again use special terms such as eco-building or green building. Variations exist not only as regards the terms chosen, but also what energy use is included in the definition. Ideally, the minimum performance requirements should take into account all types of energy use that is demand for space heating (cooling), wa-ter heating, air conditioning as well as consumption of electricity. This is often not the case. On the contrary, the definition may cover only space heating ignoring all electricity demand that may cover most heating needs for instance in office buildings. The following illustration on se-lected low energy performance standards shows the different scopes and calculation methods:
A Passive House concept has been under development since the 90ies. The Passive House Institute has given a definition that it is “a building in which the heat requirement is so low that a separate heating system is not necessary and there is no loss of comfort” (Feist 1997).The concept is gaining more and more support among practitioners and stake-holders, as it intro-duces clear targets for energy-consumption in technical terms. In total, more than 6.000 houses have now been built in Germany and elsewhere in central Europe (for example Austria, Bel-gium, Switzerland, Sweden) which conform to the Passivhaus standard. The standard funda-mentally consists of three elements: i) an energy limit; ii) a quality requirement; iii) a defined set of preferred Passive Systems with cost efficiency.
The Passive House has a heating demand of 15 kWh/m2 floor area per year, whilst the total primary energy use in the house is restricted to 120 kWh/m2 per year (see Figure 6.1.7).
For the Northern Scandinavia and other countries with cold climates, a more flexible defini-tion of the Passive House concept is set. For Southern climates (<40° latitude), where passive cooling is more dominant, a second addition to the definition should be made:
- Nordic passive houses (> 60° northern latitudes) - Central European passive Houses (40° - 60° northern latitude) - Mediterranean passive houses (IEE project Passive-On < 40° northern latitude) According the most optimistic but still realistic scenario of the potential savings, the passive
houses are projected to realize a goal that exceeds the Kyoto target in the new building sector.
annual building energy use for space heating
15
200
100 700
100
200
300
Averageexistingbuilding
Requirement1995
Requirement2002
PassiveHouse
kWh/(m² a)
Figure 6.1.7. Annual building energy use for space heating (net energy use for heating) for single family houses in Germany (Koukkari et al 2007)
______________________________________________________________________________________________________Part II – Eco-efficiency
267
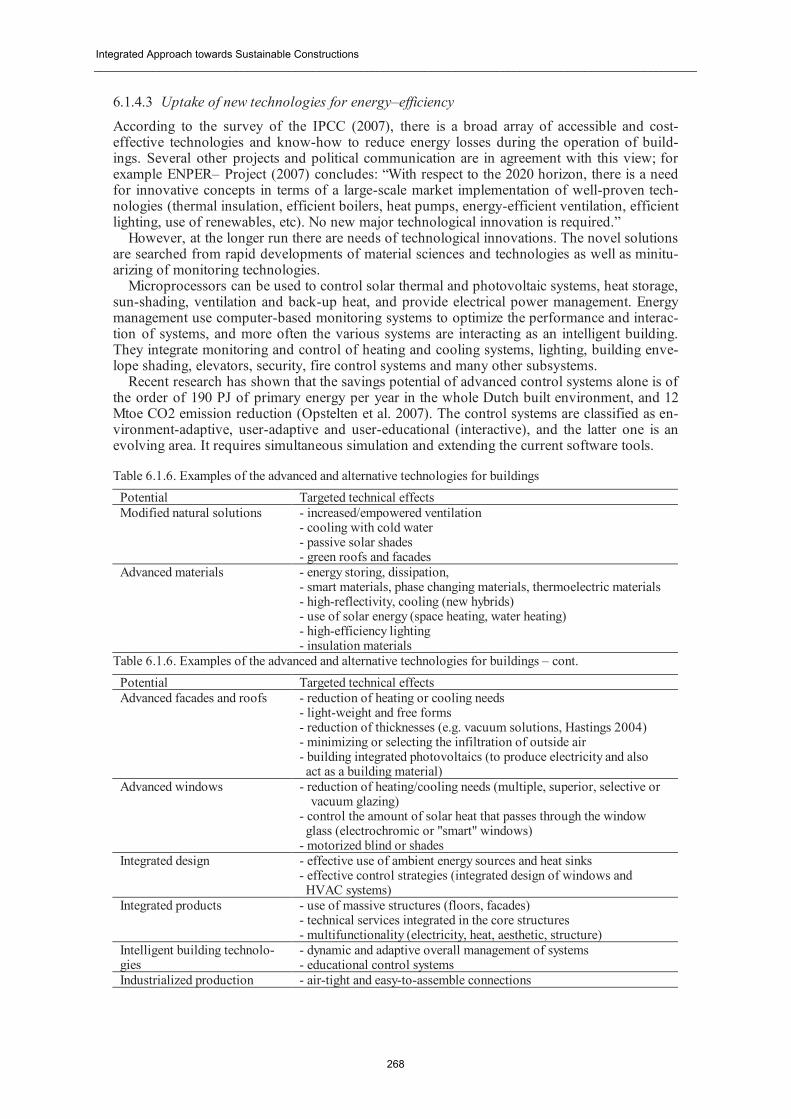
6.1.4.3 Uptake of new technologies for energy–efficiency According to the survey of the IPCC (2007), there is a broad array of accessible and cost-effective technologies and know-how to reduce energy losses during the operation of build-ings. Several other projects and political communication are in agreement with this view; for example ENPER– Project (2007) concludes: “With respect to the 2020 horizon, there is a need for innovative concepts in terms of a large-scale market implementation of well-proven tech-nologies (thermal insulation, efficient boilers, heat pumps, energy-efficient ventilation, efficient lighting, use of renewables, etc). No new major technological innovation is required.”
However, at the longer run there are needs of technological innovations. The novel solutions are searched from rapid developments of material sciences and technologies as well as minitu-arizing of monitoring technologies.
Microprocessors can be used to control solar thermal and photovoltaic systems, heat storage, sun-shading, ventilation and back-up heat, and provide electrical power management. Energy management use computer-based monitoring systems to optimize the performance and interac-tion of systems, and more often the various systems are interacting as an intelligent building. They integrate monitoring and control of heating and cooling systems, lighting, building enve-lope shading, elevators, security, fire control systems and many other subsystems.
Recent research has shown that the savings potential of advanced control systems alone is of the order of 190 PJ of primary energy per year in the whole Dutch built environment, and 12 Mtoe CO2 emission reduction (Opstelten et al. 2007). The control systems are classified as en-vironment-adaptive, user-adaptive and user-educational (interactive), and the latter one is an evolving area. It requires simultaneous simulation and extending the current software tools. Table 6.1.6. Examples of the advanced and alternative technologies for buildings
Potential Targeted technical effects Modified natural solutions - increased/empowered ventilation
- cooling with cold water - passive solar shades - green roofs and facades
Advanced materials - energy storing, dissipation, - smart materials, phase changing materials, thermoelectric materials - high-reflectivity, cooling (new hybrids) - use of solar energy (space heating, water heating) - high-efficiency lighting - insulation materials
Table 6.1.6. Examples of the advanced and alternative technologies for buildings – cont. Potential Targeted technical effects Advanced facades and roofs - reduction of heating or cooling needs
- light-weight and free forms - reduction of thicknesses (e.g. vacuum solutions, Hastings 2004) - minimizing or selecting the infiltration of outside air - building integrated photovoltaics (to produce electricity and also act as a building material)
Advanced windows - reduction of heating/cooling needs (multiple, superior, selective or vacuum glazing)
- control the amount of solar heat that passes through the window glass (electrochromic or "smart" windows) - motorized blind or shades
Integrated design - effective use of ambient energy sources and heat sinks - effective control strategies (integrated design of windows and HVAC systems)
Integrated products - use of massive structures (floors, facades) - technical services integrated in the core structures - multifunctionality (electricity, heat, aesthetic, structure)
Intelligent building technolo-gies
- dynamic and adaptive overall management of systems - educational control systems
Industrialized production - air-tight and easy-to-assemble connections
Integrated Approach towards Sustainable Constructions______________________________________________________________________________________________________
268

There are several disciplines and industrial branches that are interested and involved in the research and development work aiming at new solutions for the construction sector. The objec-tives and roadmaps developed among the various European Technology platforms give good introductions to the advanced and alternative technologies. Similar concepts can be found in several European projects (Table 6.1.6).
6.1.4.4 Strategic alliances and public-private-partnerships Considering the huge politic efforts and investment of the European Union towards a more en-ergy-efficient building sector as well as the industrial awareness of the urgency of the situation it is expected a fast implementation of the EU energy policy.
A good example of this strong will is the document “Multiannual Roadmap and Longer Term Strategy”, presented in December 2009 by the Ad-hoc Industrial Advisory Group of the Energy Efficient Building European Initiative (E2B EI), Energy Efficient Buildings Association (E2BA) and the European Construction Technology Platform (ECTP), and published by the European commission in 2010 (EU 2010b).
The EeB PPP Roadmap defines research priorities and “wave” actions for industry assuming that the knowledge gained in the first “waves” feeds into the successive of projects at the de-sign stage, realising the continuous implementation of the process.
As a result of this “wave action” it is expected to achieve an impact following a stepped ap-proach within a ten year time perspective, namely:
- Step 1: Reducing the energy use of buildings and its negative impacts on environment; - Step 2: Buildings cover their own energy needs; - Step 3: Transformation of buildings into energy providers, preferably at district level. The EeB PPP Roadmap also identified several overlaps across the three application areas
(Existing Buildings, New Buildings and Districts/Communities) of the research priorities and respective actions. Figure 6.1.8 shows the inter-relationship among the research challenges, high-lighting those “cross-cutting challenges” which are relevant for more than one of the ap-plica-tion areas. For instance, this is the case of “Energy Storage”, which is identified as “cross-cutting challenge” as well as a specific challenge for Districts/Communities, or “Systems and Equipment for Energy Use”, which is identified as a “cross-cutting challenge” as well as a spe-cific challenge for New and Existing Buildings.
Although, it is clear that some of the cross-cutting challenges build on different requirements and address different constraints, depending on the application area considered, the type of re-search required, including expertise and knowledge, is quite similar.
______________________________________________________________________________________________________Part II – Eco-efficiency
269
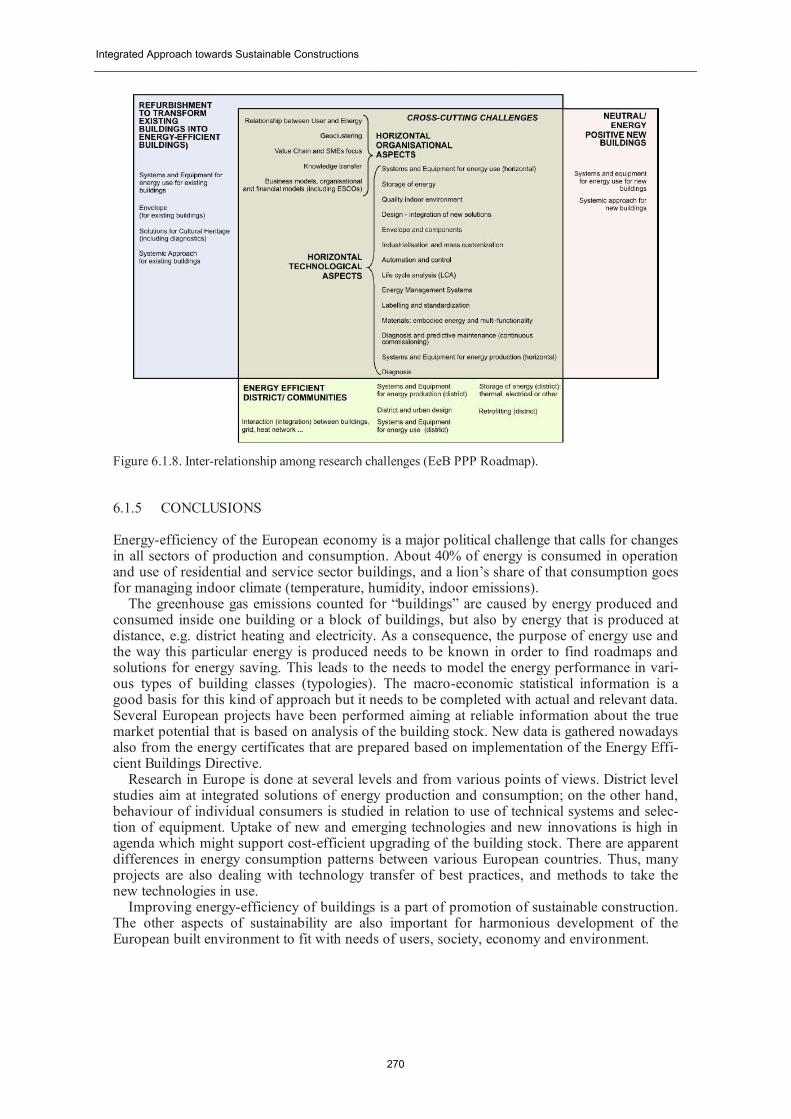
Figure 6.1.8. Inter-relationship among research challenges (EeB PPP Roadmap).
6.1.5 CONCLUSIONS
Energy-efficiency of the European economy is a major political challenge that calls for changes in all sectors of production and consumption. About 40% of energy is consumed in operation and use of residential and service sector buildings, and a lion’s share of that consumption goes for managing indoor climate (temperature, humidity, indoor emissions).
The greenhouse gas emissions counted for “buildings” are caused by energy produced and consumed inside one building or a block of buildings, but also by energy that is produced at distance, e.g. district heating and electricity. As a consequence, the purpose of energy use and the way this particular energy is produced needs to be known in order to find roadmaps and solutions for energy saving. This leads to the needs to model the energy performance in vari-ous types of building classes (typologies). The macro-economic statistical information is a good basis for this kind of approach but it needs to be completed with actual and relevant data. Several European projects have been performed aiming at reliable information about the true market potential that is based on analysis of the building stock. New data is gathered nowadays also from the energy certificates that are prepared based on implementation of the Energy Effi-cient Buildings Directive.
Research in Europe is done at several levels and from various points of views. District level studies aim at integrated solutions of energy production and consumption; on the other hand, behaviour of individual consumers is studied in relation to use of technical systems and selec-tion of equipment. Uptake of new and emerging technologies and new innovations is high in agenda which might support cost-efficient upgrading of the building stock. There are apparent differences in energy consumption patterns between various European countries. Thus, many projects are also dealing with technology transfer of best practices, and methods to take the new technologies in use.
Improving energy-efficiency of buildings is a part of promotion of sustainable construction. The other aspects of sustainability are also important for harmonious development of the European built environment to fit with needs of users, society, economy and environment.
Integrated Approach towards Sustainable Constructions______________________________________________________________________________________________________
270

REFERENCES
Boverket 2005. Housing Statistics in the European Union 2004. National Board of Houses, Buildings and Planning Sweden & Ministry for Regional Development of the Czech Republic. Available at: www.boverket.se
Casals, X.G. 2006. Analysis of building energy regulation and certification in Europe: Their role, limita-tions and differences. Energy and Buildings 38(2006)5, p. 381-392.
Commission of the European Communities 2005 Doing more with less. Green Paper on Energy Effi-ciency. ISBN 92-894-9819-6. 45 p.
Commission of the European Communities 2006. A European Strategy for Sustainable, Competitive and Secure Energy. Green Paper.
Commission of the European Communities 2007. Limiting Global Climate Change to 2 degrees Celsius. The way ahead for 2020 and beyond.
Commission of the European Communities 2008. A European Economic Recovery Plan. COM(2008) 800 final. Brussels, 26.11.2008
DTU 2008. Sustainable buildings, report about a workshop 19.6.2008 at the Technical University, Lyngby, Denmark.
EEA 2006a. Greenhouse gas emission trends and projections in Europe 2006. European Environment Agency, EEA Reporet No 9/2006. ISSN 1725 – 9177. ISBN 92-9167-885-6. 68 p.
EEA 2006b. Energy and environment in the European Union. Tracking progress toward integration. Euro-pean Environment Agency, EEA Report No 8/2006. ISBN 92-9167-877-5. 52 p.
EEA 2008. Energy and environment report 2008, Report No 6/2008. Copenhagen 2008. ISBN 978-92-9167-980-5.
EEA 2009. Greenhouse gas emission trends and projections in Europe. EEA Report No 9/2009. ISBN 978-92-9213-035-0. Available at http://www.eea.europa.eu/publications/eea_report_2009_9
ENPER-Exist. 2007. Applying the EPBD to improve the Energy Performance Requirements to Existing Buildings – ENPER-EXIST. WP4, Roadmap for energy efficiency measures/policies in the existing building sector, Final Report, June 2007. Available at www.enper-exist.com/pdf/reports/Roadmap.pdf
EC 2008. Europe’s energy position - present and future. European Communities. Demand, resources, in-vestments. ISBN 978-92-79-10036-9.
EC 2009. Energy and transport in figures. Statistical Pocketbook. European Communities 2009. ISBN 978-92-79-10768-3.
EC DG TREN 2009. Low energy buildings in Europe: Current state-of-the-play, definitions and best prac-tice. Report 25.9.2009. European Commission, Directorate General for Energy and Transport, Direc-torate D New and Renewable Energy Sources, Energy Efficiency & Innovation.
EU 2002. Directive 2002/91/EC of the European Parliament and of the Council of 16 December 2002 on the energy performance of buildings, EPBD.
EU 2007a. Action Plan on Energy-Efficiency. Communication. Available at http://ec.europa.eu/energy/action_plan_energy_efficiency/index_en.htm
EU 2007b. Energy & Transport in Figures, 2006. European Commission, Directorate-General for Energy and Transport in co-operation with Eurostat.
EU 2009. EU energy and transport in figures, statistical pocketbook European Commission, Directorate-General for Energy and Transport. ISBN 978-92-79-10728-3.
EU 2010a. Directive 2010/31/EU of the European Parliament and of the Council of 19 May 2010 on the energy performance of buildings, EPBD (recast)
EU 2010b. Energy-efficient buildings ppp, Multiannual Roadmap and Longer Term Strategy, prepared by the Ad-hoc Industrial Advisory Group. European Commission, Directorate-General Research, Indutrial Technologies. ISBN 978-92-79-15228-3. Available at http://www.ectp.org/groupes2/params/ectp/download_files/36D1191v1_EeB_Roadmap.pdf
European Communities, 2007a. Living conditions in Europe, data 2002 – 2005. Eurostat statistical hand-books. ISSN 1725-5988.
European Communities. 2007b. Panorama of Energy. Energy Statistics to support EU policies and solu-tions. Available at http://epp.eurostat.ec.europa.eu/
Eurostat 2007. Statistics on Environment and Energy. Available at the website of Eurostat (Tables: Envi-ronment and Energy/ Energy or Climate Change and Energy / Final Energy Consumption)
Eurostat 2008. Energy, Yearly statistics 2006. EC 2008. ISBN 978-92-79-09566-5. Eurostat 2009. Panorama of energy. ISBN 978-92-79-11151-8 E2B 2009. Energy efficient buildings, European Initiative. E2B Brochure 30.09.2009. www.e2b-ei.eu Feist, W. 1997. Life-Cycle Energy Analysis: Comparison of Low-energy house, Passive house, Self-
Sufficient house. (Comments of the author in 2007)
______________________________________________________________________________________________________Part II – Eco-efficiency
271