6-plain strain compression - uet lahore. j. engg. & appl. sci. vol. 1 july 2007 42 ... large...
TRANSCRIPT

Corresponding Author: S. Maqbool ([email protected])
Large-Scale Plane Strain Compression Tests on Compacted Gravel
Sajjad Maqbool1 & Junichi Koseki2 1Department of Civil Engineering, University of Engineering and Technology Lahore. 2 Institute of Industrial Science, University of Tokyo, Japan.
Abstract
This paper describes the results from a series of monotonic plane strain compression tests on large-scale prismatic specimens of compacted gravel under drained condition. The purpose of this study was to investigate the effect of compaction on strength and deformation properties. Specimens were rectangular prismatic with dimensions of 50 cm high and 22 cm times 25 cm in cross-section. To obtain highly dense specimens, compaction was made by impact loading operated either manually or by employing a motor driven system. Because of having large-size particles (Dmax = 38 mm) in gravel material, a special compaction mould was prepared to compact gravel up to a maximum compaction energy of 8685 kJ/m3. All compacted soil specimens, after finishing at the top surface, were used for plane strain tests. In these tests, the vertical stress was measured by a load cell located just above the top cap inside the triaxial cell. Deformations were measured not only by using external measurement but also with the help of local deformation transducers (LDTs) set on the sides of the specimen. This was done to avoid the effects of membrane penetration at the side surface of the specimen and of bedding error at the top and bottom ends of the specimen on the measured strains. The study revealed that the intermediate principle strain ε2, measured locally with the help of horizontal local deformation transducers (H-LDTs) was not zero even though the confining plates were fixed. Secondly, a relationship was developed between dry density and peak strength on the one hand and compaction energy and peak strength on the other hand under plane strain condition. Finally, shear bands were observed in dense specimens that had very clear strain softening behavior. Keywords: Large-Scale Plane Strain Apparatus; Compaction; Strength; Deformation;
Shear Band.
1. Introduction Compaction consists of closely packing the soil particles together by mechanical means, thus increasing the soil dry unit weight. The mechanical improvement of ground through compaction is a cost effective alternative to many stabilization techniques and involves densification of soil by applying mechanical energy. Compacted gravel has been the major constituents for the construction of embankments for dams, roads, railway tracks and airports. Plane strain compression tests are necessary to model, for example, the behavior of long embankments for roads or railways where the strain parallel to the longitudinal axis of the embankment is almost zero. In these tests, a standard procedure for plane strain compression tests [1-2] is to keep two lateral sides of the rectangular prismatic specimen fixed, using two confining plates, while the major principal stress is increased under constant confining pressure
(= σ3) until complete failure of the specimen. In these tests fixed confining plates were employed to resist against the expansion of specimen in the intermediate principal strain ε2 direction.
2. Large Scale True Triaxial Apparatus
A large-scale true triaxial apparatus [3] was employed to conduct plane strain compression tests on gravel. The tests were conducted during years 2002 – 2005 in Koseki Laboratory, Institute of Industrial Science, The University of Tokyo, Japan. This apparatus (Figure 1) consists of a triaxial cell, axial and lateral loading devices, and a cell pressure-control device. The definition of three coordinates is presented in Figure 2a. The normal stress σ1 is the vertical (axial) stress, σ2 is the horizontal (lateral) stress applied by using the lateral loading device which prevents strain in that direction and σ3 is the other horizontal stress applied by the cell pressure.

Large Scale Plain Strain Compression tests on Compacted Gravel
41
A: Confining plate (three pieces on measuring side) B: Reaction plate C: Tie rod connecting reaction plates (4 @ φ20 mm) D: Load cell to measure σ2 E: Load cell to measure friction between specimen and confining plate F: Cross-roller bearing G: Confining plate (one piece on loading side)
Figure 1: Schematic diagram of large-scale true triaxial apparatus.
The pressure cell and the top and bottom plates of the triaxial cell are made of stainless-steel. The triaxial cell has a capacity of 1 MPa for the cell pressure. Four observation windows were installed on the pressure cell. The specimen is prismatic, 220 mm-wide, 250 mm-long and 500 mm-high.
The axial loading device employs an electro-hydraulic actuator, having a capacity of 490 kN with a stroke of 200 mm. The axial displacement of the piston of the actuator is precisely controlled by using a device called “zero-balance system” [4]. The zero-balance system is driven by an AC servo-motor, which is connected to a series of reduction gears, electro-magnetic brakes and clutches [5], and it can control the vertical position of a target with a resolution of 60 µm or less. In strain-
controlled tests, a small-range displacement transducer having a stroke of +3 mm detects the location of the loading shaft relative to the target, and a feedback is applied to the electro hydraulic actuator through a digital-servo control unit in such a way that the loading shaft smoothly follows the vertical displacement of the target. In stress-controlled tests, on the other hand, another feedback is applied in such a way that the zero-balance system controls the position of the loading shaft. The loading shaft follows a prescribed history of axial load based on the signal from a load cell located inside the triaxial cell and immediately above the top cap of the specimen. The output from the load cell is free from the effects of friction at the bearing that supports the loading shaft.
Pak. J. Engg. & Appl. Sci. Vol. 1 July 2007
42
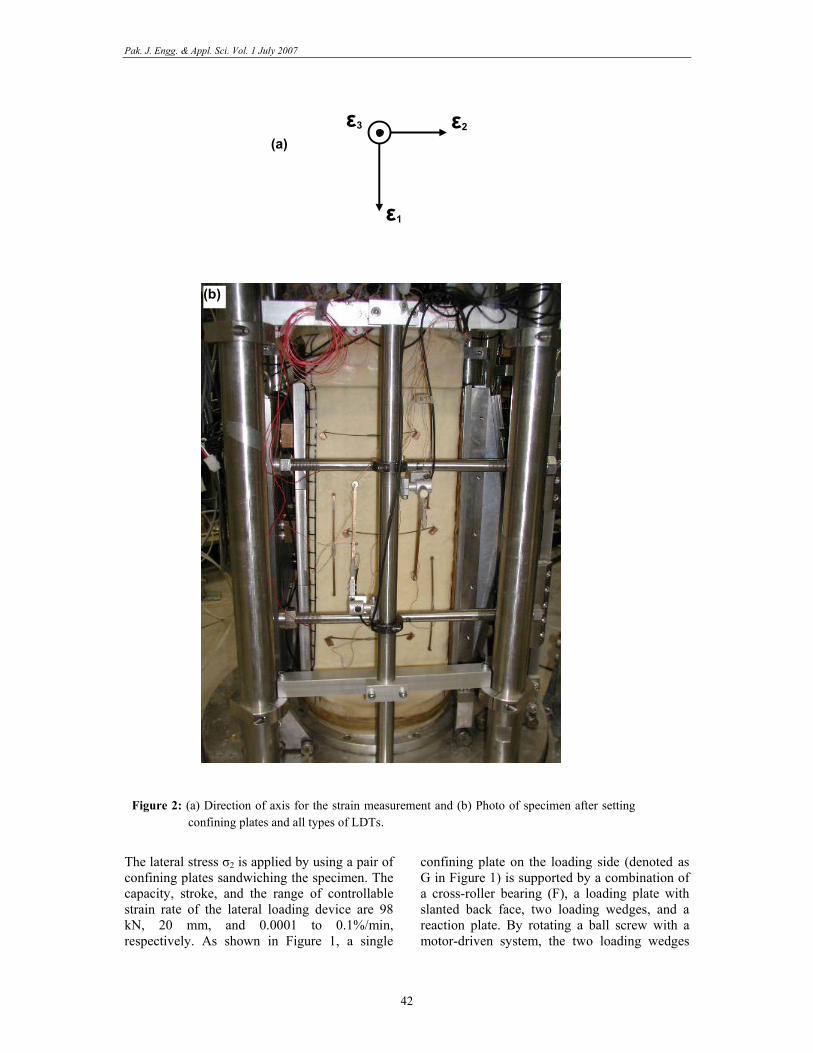
The lateral stress σ2 is applied by using a pair of confining plates sandwiching the specimen. The capacity, stroke, and the range of controllable strain rate of the lateral loading device are 98 kN, 20 mm, and 0.0001 to 0.1%/min, respectively. As shown in Figure 1, a single
confining plate on the loading side (denoted as G in Figure 1) is supported by a combination of a cross-roller bearing (F), a loading plate with slanted back face, two loading wedges, and a reaction plate. By rotating a ball screw with a motor-driven system, the two loading wedges
Figure 2: (a) Direction of axis for the strain measurement and (b) Photo of specimen after setting confining plates and all types of LDTs.
(b)
(a)
ε1
ε2 ε3

Large Scale Plain Strain Compression tests on Compacted Gravel
43
are moved vertically in the direction opposite to each other. Vertical displacement is converted into horizontal displacement through the sliding movement along the slanted back face of the loading plate. The motor-driven system is similar to the above-mentioned device for controlling the target vertical displacement. The other confining plate (A) on the measuring side consists of three platens located at the upper-, middle-, and lower-third heights of the specimen. The platens are attached to independent load cells (D) that are fixed to the other reaction plate (B).
The reaction plates on both sides are tightly connected to each other by using four tie rods (C). The reaction plates are mounted on roller bearings placed on the base of the cell to allow possible horizontal displacements of the specimen. In order to accommodate such horizontal displacements, a universal joint is employed to connect the ball screw to control system outside the cell. Vertical friction forces between the specimen and the confining plates are measured with two load cells (F) attached to the bottom of each confining plate.
To measure the lateral force, three load cells (D) were set at the confining plate on the measuring side. Each of these load cells has a capacity of 58.8 kN. To ensure free horizontal and vertical movements of the confining plates, the width of the cap and pedestal (in the direction perpendicular to the confining plate) is 4 mm smaller than the specimen width. When setting the confining platens on the lateral surfaces of the specimen, a horizontal gap of 2 mm was left between the lateral plates and the top cap or pedestal for each side. It is considered that the stress and strain distributions are not affected significantly by these gaps in the present study where a gravel having Dmax = 38 mm and D50 = 11 mm was used (Figure 4).
As shown in Figure 2, axial strain (ε1) was measured by three pairs of vertical local deformation transducers (V-LDTs) [6] in addition to external measurement by linear variable differential transducer (LVDT). One of the two lateral strains (ε2) was measured by another three pairs of horizontal local deformation transducers (H-LDTs) and the second lateral strain (ε3) was measured by two pairs of cantilever local deformation transducers (C-LDTs). The directions of ε1, ε2 and ε3 are shown in Figure 2a. The LDTs are
free from the effects of membrane penetration. The photo of the test specimen after setting all three types of LDTs is shown in Figure 2b. The schematic diagram showing the location of all LDTs over the specimen is shown in Figure 3. The potential non-uniformity of the specimen can be evaluated by measuring local strains at three different heights. To reduce the effects of friction developing between the specimen and the confining plates, top cap, and pedestal, a lubrication layer 200 µm-thick of Dow grease layer (commercially available as EM-30L Grease from Dow Corning Toray Silicone, Japan) and a 0.8 mm-thick membrane was inserted in between. The configuration of the lubrication layer was based on results from a series of direct shear tests performed on the gravel following the procedures employed by [7].
In the present study, while analyzing the test results, for each direction of local strain measurement, the mean of the data measured with all two or three pairs of transducers set in the respective direction was used.
3. Tested Material and Testing Program The test material was a well-graded crushed sandstone having Uc = 30 and Gs = 2.71 (called Chiba gravel) [8-9]. It could be categorized as well-graded sandy gravel. The gradation chart of the tested material is given in Figure 4. Specimens were prepared with varying dry density while keeping the same values of initial moisture content, as will be described later. Test conditions and results are given in Table 1. Throughout the tests, the backpressure was set equal to the atmospheric pressure. All the specimens were first subjected to isotropic consolidation (denoted as I.C. in the relevant figures) from a stress state of 49 kPa up to 98 kPa (stress path 1 in Figure 5). It was followed by isotropic unloading from a stress state of 98 kPa down to 49 kPa (stress path 2 in Figure 5). After isotropic consolidation with small cyclic loading at several stress levels, the specimens were again subjected to isotropic consolidation from stress level of 49 kPa to 98 kPa without applying any small cycles of loading (stress path 3 in Figure 5). It was followed by drained plane strain compression (denoted as P.S.C.) in the vertical direction at σ3 = 100 kPa (stress path 4 in Figure 5).

Pak. J. Engg. & Appl. Sci. Vol. 1 July 2007
44
Table 1: Test conditions and results
Specimen No
Test code
Compaction energy (kJ/m3)
Confining stress (kPa)
Dry density (g/cm3)
Manual/auto compaction
1 PS-12 680 100 1.90 manual 2 PS-19 2700 100 2.02 auto 3 PS-14 6200 100 2.07 manual 4 PS-15 8685 100 2.15 auto
Fixed confining plates
22 cm
25 cm
50 cm
1σ
2σ
3σSid
e-ASid
e-B
T
M
B
T
M
B
U
L
Side- D
Side- C
T: Top, M: Middle, B: Bottom
(Vertical local deformation transducers, V-LDTs)
T: Top, M: Middle, B: Bottom (Horizontal local deformation transducers, H-LDTs)
U: Upper, L: Lower
(Contact points of cantilever local deformation transducers, C-LDTs)
Figure 3: Positioning of LDTs on plane strain compression test specimen.

Large Scale Plain Strain Compression tests on Compacted Gravel
45
Figure 4: Gradation Curve of tested Material.
Figure 5: Stress path employed.

Pak. J. Engg. & Appl. Sci. Vol. 1 July 2007
46
The detailed analysis of small strain measurement (static or dynamic) during isotropic loading and shearing will be reported elsewhere.
In this study, major and minor principal stresses are denoted as σ1 and σ3 and their corresponding principal strains are called as ε1 and ε3 respectively.
4. Test Results and Discussions
4.1 Preparation of compacted specimen
A large compaction mould (Figure 6) with inner dimensions of 25.4 cm x 22.4 cm in cross-section and 49.8 cm in height was used to prepare compacted gravel specimen of required size. The frame of the mould consisted of four plates bolted together. Lateral bracing was provided at mid-height of the mould to provide additional resistance against lateral spreading of compacted material during heavy compaction. The mould was fixed over the pedestal of the cell therefore after preparation of specimen there was no need to move the specimen from the mould since the mould could be detached by unscrewing the bolts of four plates. This mould was designed to prepare prismatic specimens for this study.
A hammer of 12 kg mass with a fall height of 48.5 cm was used to compact the specimen. The weight was lifted by “manual” effort using a rope passing over a pulley or by an “automatic”, i.e. motor driven system as shown in Figures 7 & 8. The difficulty in employing a manual technique was the need for a large manual effort otherwise reproducibility was same in both techniques [10]. In the “automatic” technique of compaction, not only the mass was lifted and dropped automatically but also the blows were counted automatically by using a counter as shown in Figure 8a.
The compaction was performed in 11 - 12 layers with a compacted thickness of 4 - 4.5 cm per layer. Before placing the material for the next layer, the surface of the compacted preceding layer was excavated to a small depth to ensure a good interlocking between vertically adjacent layers. During this study, particle breakage by heavy compaction was also checked and it was found insignificant as typically shown in Figure 9. The dry density of the heavily compacted specimens was close to typical field values [11]. To obtain optimum moisture content, before
preparing the actual specimens, compaction curves were drawn for three levels of compaction energy i.e. 620, 2700 and 7820 kJ/m3 and are shown in Fig.10.
It was found that the values of the optimum moisture content were different for each level of compaction. Therefore, in order to maintain consistency, the optimum moisture content obtained for the maximum level of compaction (= 5.5%) was employed for all compaction levels to prepare the test specimens in this study.
4.2 Relationship between compaction energy and dry density
The relationship between compaction energy and dry density can help to compute the exact amount of compaction needed for a certain dry density. As a result of this study, the trend of the curve between compaction energy and dry density is found non-linear as shown in Fig.11. Their relationship is given in the following equation.
Y = 1.91 + 3.68E-5 X – 1.10E-9 X2 (1)
Here ‘Y’ is the dry density of the specimen in g/cm3 and ‘X’ is the compaction energy employed to prepare specimen in kJ/m3. The relationship given in Eq.1 is non-linear therefore an increase in compaction energy beyond certain limit would not result in significant increase in the dry density. Thus there is a limit to the dry density and hence the strength of the gravel. A similar trend was also observed by [10] in preparing triaxial test specimens of slightly different size. 4.3 Stress-strain relationships of compacted gravel specimens The stress-strain relationship for all four compacted specimens of Chiba gravel during plane strain compression (stress path 4) is shown in Figure 12. The testing conditions for all four specimens were similar except for the dry density which was varied by the change in compaction energy, while keeping the initial moisture content constant at 5.5%. In an overall comparison, only PS-12 didn’t show any strain-softening behavior that could be due to lower dry density. All other specimens showed a clear strain softening behavior after reaching the peak stress.

Large Scale Plain Strain Compression tests on Compacted Gravel
47
Figure 6: Large compacted mold to prepare gravel specimens.

Pak. J. Engg. & Appl. Sci. Vol. 1 July 2007
48
Figure 8: (a) Counter used to count number of blows and (b) Pulley, motor and clutch system to liftthe hammer for free fall.
Figure7: (a) Compactor fixed over the mould, (b) Hammer having mass of 12 kg used for compactionand (c) schematic diagram for the plan view of hammer.
(a) (b)
22.5 cm
22.5 cm
12.0 cm 4.5 cm4.0 cm
(c)
16 cm

Large Scale Plain Strain Compression tests on Compacted Gravel
49
0.01 0.1 1 10 100 1000
0
20
40
60
80
100 Chiba gravel
Before compaction
After compaction (C.E = 7820 kJ/m3)
Perc
ent f
iner
by
wei
ght (
%)
Grain size (mm)
Figure 9: Gradation curves of tested material (before and after compaction).
2 3 4 5 6 7 8 9 10 11 12 13 14 15 16 171.6
1.7
1.8
1.9
2.0
2.1
2.2
2.3
2.4
2.5
2.6
2.7
Chiba gravel Compaction energy = 620 kJ/m3
Compaction energy = 2700 kJ/m3
Compaction energy = 7820 kJ/m3
Dry
den
sity
(g/c
m3 )
Moisture content , w (%)
100% saturation line(Gs = 2.71)
Figure 10: Compaction curves of tested material.

Pak. J. Engg. & Appl. Sci. Vol. 1 July 2007
50
Figure 11: Relationship between compaction energy and dry density of gravel specimens Intermediate deviator stress (q2 = σ2 - σ3) for all four specimens also showed the effect of different densities (Figure 13). It is worth mentioning that even though the confining plates were moved, with the help of the lateral loading system, as explained in Section 2, to touch the sides of a specimen after completing isotropic consolidation, q2 (Figure 13) for all four specimens clearly indicates that the σ2 stress was not mobilized properly at the beginning of shearing. It could be due to bedding error between each confining plate and side of specimen.
As a result of such a response, the ratio of the major to intermediate deviator stresses (b = (σ2-σ3) / (σ1-σ3)) also showed a gradual increase in the beginning of shearing (Figure 14). b started from zero and reached a level of about “0.3” by the end of shearing. Lubrication layers provided between the side surface of the specimens and the confining plates were so effective that the side friction angle measured by friction load cells provided at the base of each confining plate was insignificant as typically shown in Figure 15. During all four tests, the confining stress (σ3)
was set automatically to be constant using an external pressure of about 100 kPa as typically shown in Figure 16.
4.4 Deformation characteristics of compacted gravel
The intermediate principle strain ε2, measured locally by three pairs of horizontal local deformation transducers (H-LDTs) was found to be in the range of 0.5 – 2.20% in all four specimens although measurements had to be terminated before completion of shearing due to over-scaling in most of the cases. Typical results are shown in Figure 17. Such trends show that the local ε2 between two fixed confining plates does not remain zero even though the confining plates are not allowed to move i.e. the global ε2 between two confining plates is zero. A detailed study was also made to see the change in strength properties of similar specimens by keeping the local ε2 equal to zero even though the global ε2 was non-zero due to movement of one of the two confining plates.
As explained before, the minor principle strain, ε3, was measured by two pairs of cantilever local deformation transducers (C-LDTs) set at the upper and lower portion of the specimen.

Large Scale Plain Strain Compression tests on Compacted Gravel
51
-1 0 1 2 3 4 5 6 7 8 9 10 11 12 13 14
0
200
400
600
800
1000
1200
1400
1600
qmax
qmaxqmax
qmax
PS-12 (1.90)
PS-15(2.15)
PS-19(2.02)
ε1 (%) by external measurement
q1 =
σ1 -
σ3 (k
Pa)
Chiba gravelPS-14(2.07) ( ): dry density in g/cm3
qmax: peak deviator stress
Figure 12: Externally measured axial strain versus deviator stress (q1).
-1 0 1 2 3 4 5 6 7 8 9 10 11 12-50
0
50
100
150
200
250
300
350
PS-15 (2.15)
PS-14 (2.07)
ε1 (%) by external measurement
q 2 = σ
2 - σ
3 (kPa
)
Chiba gravel
PS-19 (2.02)PS-12 (1.90)
( ): dry density in g/cm3
σ2: average stress of all three lateral load cells
σ3: confining stress of 100 kPa
Figure 13: Externally measured axial strain versus intermediate deviator stress (q2).

Pak. J. Engg. & Appl. Sci. Vol. 1 July 2007
52
-1 0 1 2 3 4 5 6 7 8 9 10 11 12-0.05
0.00
0.05
0.10
0.15
0.20
0.25
0.30
0.35
PS-14(2.07)
PS-15(2.15)
PS-12 (1.90)
PS-19(2.02)
( ): dry density in g/cm3
Chiba gravel
b = (σ2 - σ3)/(σ1- σ3)
ε1 (%) by external measurement
b-va
lue
Figure 14: Externally measured axial strain versus b-value.
-1 0 1 2 3 4 5 6 7 8 9 10 11 12
-0.4
-0.2
0.0
0.2
0.4
0.6
0.8
1.0
1.2
22 c m
25 cm
50 cm
Side-ASide
- BT
M
B
T
M
B
U
L
Side- D
Side- CChiba gravel
PS-14 (side-D)
PS-14 (side-C)
PS-12 (side-D)
ε1 (%) by external measurement
Side
fric
tion
angl
e (d
egre
es)
PS-12 (side-C)
friction angle (degrees) = tan-1(friction stress/σ2)x180/π
Figure 15: Externally measured axial strain versus side friction angle.

Large Scale Plain Strain Compression tests on Compacted Gravel
53
Figure 16: Externally measured axial strain versus confining stress (σ3).
-1 0 1 2 3 4 5 6 7 8 9 10 11 12 13-2.5
-2.0
-1.5
-1.0
-0.5
0.0
D
CB
Bottom-B
Mid-B
Top-B
Bottom-AMid-ATop-A
Chiba gravelPS-14
ε1 (%) by external measurement
ε 2 (%
) by
horiz
onta
l LD
Ts
Max. ε2 = 2.12%
A
Figure 17: Externally measured axial strain versus intermediate principle strain (ε2).
The measurements of upper and lower C-LDTs showed similar trends (Figure 18). The response of C-LDTs at different levels was similar confirming uniformity of specimen density.
Finally dilatancy properties were compared based on relationships between axial strain ε1 and nominal volumetric strain that was computed by the following equation (Eq.2).

Pak. J. Engg. & Appl. Sci. Vol. 1 July 2007
54
εvol =ε1 + ε3 (2) Here εvol is the nominal volumetric strain, ε1 is the axial strain measured externally and ε3 is the strain measured by C-LDTs. As shown in Figure 19, looser specimens (PS-12 and PS-19) showed relatively less dilative behaviour than the denser ones (PS-14 and PS-15). Such difference in dilatancy curves represented the difference in compaction level or dry density for all four specimens.
4.5 Strength characteristics of compacted gravel
The peak strength of specimen can be represented either by the maximum deviator stress (qmax) or by the peak angle of internal friction (φmax) that was computed from the values of major principle stress σ1 and the confining stress σ3 by assuming no cohesion as: φmax = Sin-1[(σ1-σ3)/(σ1+σ3)] (3) In the first part of comparison, the maximum deviator stress (q1 = σ1-σ3) was plotted against axial strain (ε1) for all four specimens compacted at different compaction energies. It was observed that qmax values corresponding to similar axial strain was larger in denser specimens than those in relatively loose specimens.
To see the trend of change in qmax values with respect to change in compaction energy, only qmax values from Figure 12 were taken and are plotted in Figure 20. It was found that qmax versus dry density relationship was linear as given in the following equation. Y = - 4526.5 + 2724.5 X (4) In this equation, “Y” corresponds to qmax in kPa and “X” is for dry density in g/cm3. With the increase in dry density, the peak strength of gravel increases in a linear manner although after getting certain level of density, practically it would be impossible to obtain further increase in density beyond that level.
The relationship between qmax values and compaction energy was found to be non-linear as given in the following equation and plotted in Figure 21. Y = 585.68 + 0.13 X – 5.29E-6 X2 (5)
In this equation “Y” is used for qmax in kPa and “X” is about compaction energy in kJ/m3.With the increase in compaction energy, the peak strength of gravel increases in a non-linear manner with the slope of the curve becoming reducing; therefore, as mentioned before, there will be an optimum condition for the compaction level beyond which its execution in practice becomes uneconomical.
In the second part of the analysis, φmax values were plotted against dry density and compaction energy as shown in Figures 22 and 23. The relationship between φmax and dry density was found linear as given in the following equation.
Y = 47 + 0.0018 X – 7.3E-8 X2 (6) In this equation, “Y” is φmax in degrees and “X” is dry density in g/cm3.
As was the case with qmax, the relationship between φmax and compaction energy was found rather non-linear as given in the following equation.
Y = 48.64 + 0.002 X – 1.02E-7 X2 (7)
In this equation, “Y” is the φmax in degrees and “X” is the compaction energy in kJ/m3. Note that specimen for PS-19 was prepared by employing compaction energy of 2700 kJ/m3 which is the maximum level of compaction recommended by “American Society for Testing Materials”[12] to obtain compaction curves.
4.6 Shear band development
Dense granular materials are known to exhibit strain softening behavior during shearing, which is associated with strain localization or formation of a shear band. These properties have been considered in evaluating rationally the seismic earth pressure that is exerted to retaining walls from compacted backfill soils [13]. As shown in Figure 13, strain softening behavior could not be observed in PS-12 while in all other tests the behavior was very clear. Such trend is due to the difference of density. As a result of this trend, a shear band could not be observed in PS-12 as shown in Figure 24. A very clear shear band was observed in all other three specimens as shown in Figures 25, 26 & 27. The formation of a shear band is directly linked with the density or compaction level of the gravel specimens.

Large Scale Plain Strain Compression tests on Compacted Gravel
55
-1 0 1 2 3 4 5 6 7 8 9 10-24-22-20-18-16-14-12-10-8-6-4-202
ε3 (L)
L
U
Average
ε3 (U)
Chiba gravelPS-14
ε1 (%) by external measurement
ε 3 (%
) by
cant
ileve
r LD
Ts
A
U: Upper C- LDT L: Lower C- LDT
ε3(U) = Strain measured by U on side-A + Strain measured by U on side-B
DB*
C
* similar to side-A
Figure 18: Externally measured axial strain versus minor principle strain (ε3).
-1 0 1 2 3 4 5 6 7 8 9 10 11 12-10
-9
-8
-7
-6
-5
-4
-3
-2
-1
0
1
2Chiba gravel
( ): dry density in g/cm3
PS-15(2.15)
ε1 (%) by external measurement
Nom
inal
vol
umet
ric s
trai
n, ε vo
l (%
)
εvol = ε1 (external measurement)+
ε3(avg. of C-LDTs)
PS-14(2.07)
PS-19(2.02)PS-12 (1.90)
Figure 19: Externally measured axial strain versus nominal volumetric strain (εvol).

Pak. J. Engg. & Appl. Sci. Vol. 1 July 2007
56
0 1000 2000 3000 4000 5000 6000 7000 8000 9000400
500
600
700
800
900
1000
1100
1200
1300
1400
1500
Y: Maximum deviator stress in kPaX: Compaction energy in kJ/m3
Y = 585.68 + 0.13X - 5.29E-6 X2
(equation for the best fit line)
Chiba gravel
Compaction energy (kJ/m3)
q m
ax (k
Pa)
Figure 21: Compaction energy versus maximum deviator stress (qmax).
Figure 20: Dry density versus maximum deviator stress (qmax).

Large Scale Plain Strain Compression tests on Compacted Gravel
57
0 2000 4000 6000 8000 1000040
45
50
55
60
65
70
Y: φ maxcorresponding to maximum deviator stress in degreesX: Compaction energy in kJ/m3
Y = 48.64 + 0.002 X - 1.02E-7 X2
(equation for the best fit line)
Ang
le o
f int
erna
l fric
tion,
φm
ax (d
egre
es)
Compaction energy (kJ/m3)
Chiba gravel
Figure 23: Compaction energy versus maximum angle of internal friction (φmax).
Figure 22: Dry density versus maximum angle of internal friction (φmax).

Pak. J. Engg. & Appl. Sci. Vol. 1 July 2007
58
Figure 24: Shear band formation in PS-12 with dry density of 1.90 g/cm3.
No shear band
Figure 25: Shear band formation in PS-19 with dry density of 2.02 g/cm3.
Shear band

Large Scale Plain Strain Compression tests on Compacted Gravel
59
Figure 27: Shear band formation in PS-15 with dry density of 2.15 g/cm3.
Shear band
Figure 26: Shear band formation in PS-14 with dry density of 2.07 g/cm3.
Shear band

Pak. J. Engg. & Appl. Sci. Vol. 1 July 2007
60
Conclusions
1- Intermediate principle strain ε2, measured locally with the help of H-LDTs was found to be non- zero even though the confining plates were fixed.
2- With the increase in compaction energy, the peak strength of gravel under plane strain condition increases in a non-linear manner with the slope of the curve reducing. There will be an optimum condition for the compaction level beyond which its execution in practice becomes uneconomical.
3- Formation of shear band was found directly linked to the density.
References [1]. T. Yoshida, F. Tatsuoka; Proc. of the
Fourteenth International Conference on Soil Mechanics and Foundation Engineering, Hamburg, Germany, 1(1997) 237-240.
[2]. J. Dong, K. Nakamura; Proc. of the Fourteenth International Conference on Soil Mechanics and Foundation Engineering, Hamburg, Germany, 1(1997) 81-84.
[3]. L.Q. AnhDan, J. Koseki, T. Sato; Geotechnical Testing Journal, 29(2006), No.5 (in print).
[4]. K. Hayano, J. Koseki, T. Sato, F. Tatsuoka; Proc. of Pre-failure Deformation Characteristics of Geomaterials, Jamiolkowski, Lancellotta and Lo Presti (eds.), 1(1999) 191-198.
[5]. F. Santucci de Magistris, J. Koseki, M. Amaya, S. Hamaya, T. Sato, F. Tatsuoka; Geotechnical Testing Journal, ASTM, 22(1999), No.1, 44-60.
[6]. S. Goto, F. Tatsuoka, S. Shibuya, Y. S. Kim, T. Sato; Soils and Foundations, 1(1991), Vol.31, 169-180.
[7]. F. Tatsuoka, O. Haibara; Soils and Foundations, 25(1985), No.1, 89-98.
[8]. S. Maqbool, J. Koseki, T. Sato; Bulletin of Earthquake Resistant Structure (ERS), IIS, The University of Tokyo, 37(2004) 41-50.
[9]. S. Maqbool; PhD thesis submitted to Civil Engineering Department, The University of Tokyo, Japan (2005).
[10]. S. Maqbool, J. Koseki, T. Sato; Journal of Geotechnical and Geoenvironmental Engineering, ASCE, (submitted in 2007 for possible publication).
[11]. Y. Kohata, F. Tatsuoka, J. Dong, S. Teachavorasinskun, K Mizumoto; Proc. of International Symposium on Pre-failure Deformation of Geomaterials, 1(1994) 3-10.
[12]. ASTM D1557-00: Standard test methods for laboratory compaction characteristics of soil using modified effort (2700 kN-m/m3).
[13]. J. Koseki, F. Tatsuoka, Y. Munaf, M. Tateyama, K. Kojima; Soils and Foundations, Special Issue on Geotechnical Aspects of the January 17 1995 Hyogoken-Nambu Earthquake, 2(1998) 209-216.