6 drought and water resources management in japan drought and water resources management in japan...
TRANSCRIPT

6 Drought and Water Resources Management in Japan
AKIRA KAWAMURA & YASUHISA KUZUHA
INTRODUCTION Since the ancient civilizations of the world, water resources and water supply have played fundamental roles in the development and organization of many societies. Nevertheless, the importance and increasing complexity of today’s water resources systems makes the management goal a bigger challenge than ever. For example, Fukuoka Metropolitan Area, a fast growing economic and cultural centre in Kyushu, Japan, is always exposed to potential drought. The limited water resources are now becoming one of the fundamental constraints for appropriate development of the area. In this chapter, drought and water resource management in Japan are introduced. First, the water resources situation in Japan is described. Second, a brief outline of water resources management in Japan, including the past and present situation and tasks for the future, is presented. Then, a depth–area–duration analysis of the temporal and spatial distribution of scarce precipitation for the whole Japan is presented. Finally, the integrated water resources management strategies in Fukuoka Metropolitan Area are detailed as an excellent example of water resource management. THE WATER RESOURCES SITUATION IN JAPAN The Japanese archipelago extends in a narrow strip from north to south in the Asian Monsoon region. Annual precipitation for representative countries worldwide is shown on the left of Fig. 6.1. The average annual precipitation in Japan is 1714 mm year-1 (30-year mean, 1966–1995, of the average value of 1300 observation points distributed all over the country). This is almost twice the world average of 973 mm year-1. The total volume of water, calculated from the product of the precipitation and the land surface area of Japan (378 × 103 km2), is approximately 650 billion m3 year-1. Water availability per person is 5100 m3 year-1, which is about a quarter of the world average of 21 800 m3 year-1 per person as shown on the right of Fig. 6.1. Thus, in spite of the large amount of annual precipitation, water availability per person is relatively small because of the high population density. Figure 6.2 shows the water balance in Japan for an ordinary precipitation year (JSCE, 2000). The potential water resource is estimated to be about 1100 mm year-1 because 600 mm year-1 of annual precipitation is lost through evapotranspiration. Out of this quantity, 230 mm year-1 is now used for water resources. The remaining precipi-tation, 880 mm year-1, is discharged to the ocean as direct runoff, mainly as flood. Figure 6.3 shows the long-term fluctuation of precipitation in Japan, calculated using the precipitation data of 46 representative observation points distributed all over

58 PUB: International Perspectives on the State of the Art and Pathways Forward
Fig. 6.1 Left: annual precipitation. Right: annual precipitation and potential water resources per person.
Fig. 6.2 Water balance in Japan.
the country. It shows that the precipitation trend is one of the decline, and that the difference between high and low annual precipitation has increased in recent years. The potential water resources situation for different periods is indicated in Fig. 6.4. The potential water resources have decreased drastically during the past 40 years. For example, the potential water resources of 330 billion m3 year-1 for the period 1956–1975 under the 10-year return period, correspond to those of the 4-year return period for the 1976–1995 period. The amount of potential water resources under the 10-year return period for the period 1976–1995 decreased by 70 billion m3 year-1.

A. Kawamura & Y. Kuzuha Chapter 6, Drought and Water Resources Management in Japan 59
Fig. 6.3 Long-term fluctuation of annual precipitation in Japan (MLIT, 2002).
Fig. 6.4 Potential water resources for different periods (MLIT, 2000).
Figure 6.5 shows the distribution of drought occurrence for a recent 20-year period. It indicates the number of years in which water supply cuts, or supply at reduced water pressure, were enforced in each area. Droughts have occurred quite frequently all over the country. The Japanese Pacific Belt Zone and the Okinawa district are especially vulnerable to drought.

60 PUB: International Perspectives on the State of the Art and Pathways Forward
Fig. 6.5 Drought occurrence for a recent 20-year period (MLIT, 2002).

A. Kawamura & Y. Kuzuha Chapter 6, Drought and Water Resources Management in Japan 61
WATER RESOURCES MANAGEMENT: PRESENT SITUATION AND TASKS Water resources management in Japan since the war Water resources management in Japan after the war is described by MLIT (2000) and JSCE (2000). There are four notable features. First, a new framework of water use and water resources development was established corresponding to the development of the social and economic system. Various kinds of laws were established relating to the rapidly increasing industrial and domestic water demands. Water rights were allocated by the method of developing new water resources. Multi-purpose dams were exten-sively constructed for the purpose of water resources development as well as flood control. The second aspect is that measures for reservoir areas became the major issue for water resources development. The third aspect is that industrial water works were identified as a factor in land subsidence prevention. As a result, the source of industrial water shifted from ground-water to river water. In connection with the high economic growth, the water use system for urban areas is now highly developed. The diffusion rates for water supply and sewage systems were 96.1% in 1997 and 58% in 1998, respectively. However the sewage system diffusion rate for the cabinet-order designated cities reaches 97%. The present direction of water resources development Domestic water demand in Japan is still increasing. The gap between the average daily water demand per person between urban and rural areas is rapidly closing. Industrial water demand is almost flattening out. Agricultural water demand forms two-thirds of the total water demand in Japan. In spite of the decrease of paddy field areas, the agricultural water demand is almost at the same level as earlier. The stability of water supply is decreasing all over the country, and the robustness of the water supply system differs greatly from area to area. Water resources develop-ment methods are diverse; various water sources must be considered to satisfy the increased water use. Recently, the natural hydrological cycle has been changed to a great extent by human activities. Due to these changes, various kinds of problems related to water resources, such as urban flooding and groundwater contamination, have emerged as important issues. Future tasks for water resources management Japan will become an aged society in the 21st century, and the population total will definitely decrease. People will put more importance on water quality rather than quantity. Furthermore, the impact of global warming on water resources will be more obvious. As a result, it is estimated that both extremes (drought and flood) shall happen more frequently. New water needs, i.e. water reserves for emergencies such as drought or earthquake disasters, will become more important. To cope with the various water needs, effective water use must be considered with a long-term perspective. There are two major tasks for water resources management in the 21st century. The first is to achieve a comprehensive water resources policy. There are many administrative organizations involved in water resources related problems. All of these administrative bodies should cooperate seriously in order to establish a water use

62 PUB: International Perspectives on the State of the Art and Pathways Forward
system on each river basin, to maintain the water environment, and to foster the water culture. The various types of information that each organization at present owns only for their use, must be gathered and summarized, and it should be opened widely to the public through a wide range of media, including Internet sites. Public consensus is expected to build up through opening-up the information. A second task is international cooperation. Japan imports a large percentage of its food. Because a large amount of water is used overseas to produce those foods, it is crucial to consider global water resources. Related to this problem, the Third World Water Forum was held in Japan in March 2003. STUDY OF TEMPORAL AND SPATIAL DISTRIBUTIONS OF SCARCE PRECIPITATION BY DEPTH–AREA–DURATION ANALYSES Due to its seriousness and frequency of occurrence, it is clear that drought is one of the most important natural disasters from the viewpoint of disaster prevention, and analys-ing and clarifying the mechanism of drought is essential for retaining water as water resources for human society and activities, not only in arid countries but also in Japan. Although the contributing factors include a variety of natural and man-made phenomena (e.g. scarce precipitation, high summer temperatures, problems with water supply systems), scarce precipitation is clearly the main cause of drought from the hydrological viewpoint. Depth–area–duration analysis (DAD) is frequently employed as a technique for analysing heavy rainfalls since it is effective in clarifying the general characteristics of the temporal and spatial distributions of such rainfall. Disasters caused by heavy rainfall are the opposite of those caused by scarce precipitation (drought). Here, the analysis of temporal and spatial distributions of scarce precipitation is attempted by applying a method similar to DAD. In addition, the seriousness of drought is evaluated using the probability of occurrence, that is, a technique analogous to the depth–duration curve. Data The data used for this study are the daily precipitation records of AMeDAS (Automated Meteorological Data Acquisition System) over a 24-year period (1976–1999) provided by the Japan Meteorological Agency. Initially, actual daily precipitation data were sorted to yield a time series of data comprising 8766 values of daily precipitation (1 January 1976 to 31 December 1999) at all the observation points (1578 points where at least one datum is available). Note that a large number of non-observation days are included in the data. In analysing the data, these non-observation days were treated as days with extraordinarily heavy rainfall. This was to prevent the mistaken conclusion that long-term non-observation corres-ponded to the occurrence of scarce precipitation. Depth–duration (DD) analysis using daily precipitation data The DD analysis was carried out using the time series data for daily precipitation. The purpose of the DD analysis was to obtain the relationship between the duration of precipitation (this term means “duration of the accumulation of precipitation depth” for scarce precipitation) and the depth of the minimum point precipitation, not the
A. Kawamura & Y. Kuzuha Chapter 6, Drought and Water Resources Management in Japan 63
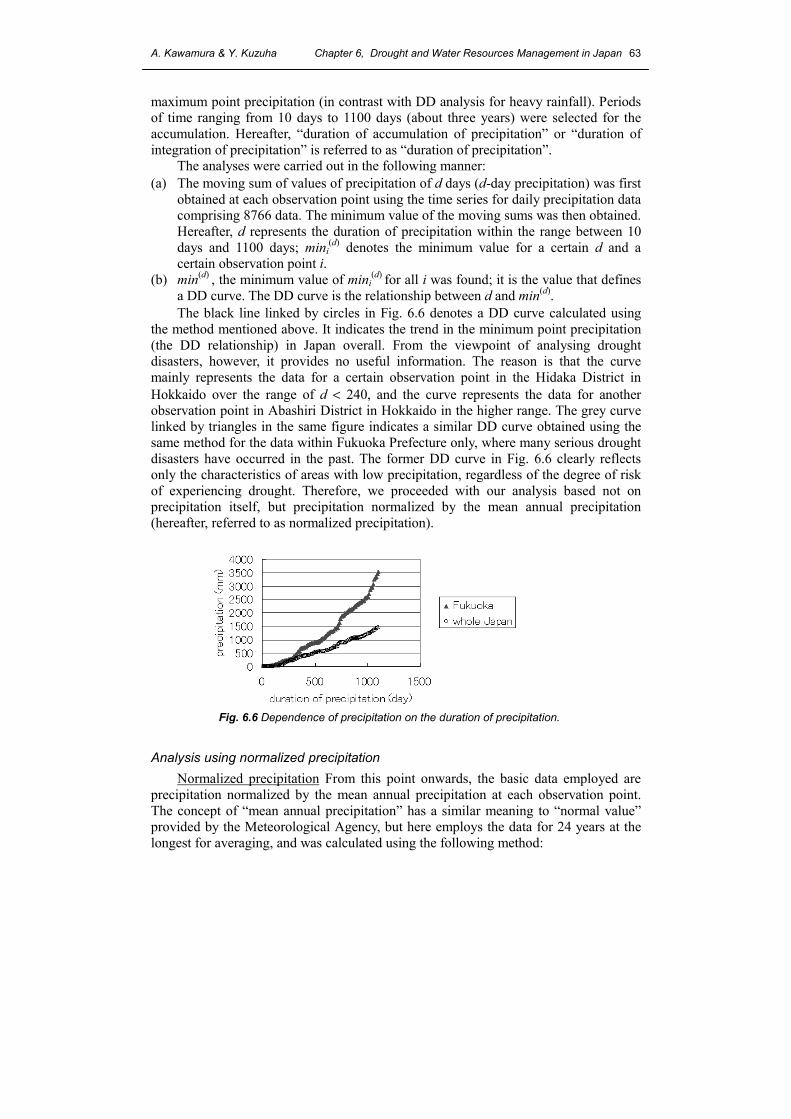
maximum point precipitation (in contrast with DD analysis for heavy rainfall). Periods of time ranging from 10 days to 1100 days (about three years) were selected for the accumulation. Hereafter, “duration of accumulation of precipitation” or “duration of integration of precipitation” is referred to as “duration of precipitation”. The analyses were carried out in the following manner: (a) The moving sum of values of precipitation of d days (d-day precipitation) was first
obtained at each observation point using the time series for daily precipitation data comprising 8766 data. The minimum value of the moving sums was then obtained. Hereafter, d represents the duration of precipitation within the range between 10 days and 1100 days; mini
(d) denotes the minimum value for a certain d and a certain observation point i.
(b) min(d) , the minimum value of mini(d) for all i was found; it is the value that defines
a DD curve. The DD curve is the relationship between d and min(d). The black line linked by circles in Fig. 6.6 denotes a DD curve calculated using the method mentioned above. It indicates the trend in the minimum point precipitation (the DD relationship) in Japan overall. From the viewpoint of analysing drought disasters, however, it provides no useful information. The reason is that the curve mainly represents the data for a certain observation point in the Hidaka District in Hokkaido over the range of d < 240, and the curve represents the data for another observation point in Abashiri District in Hokkaido in the higher range. The grey curve linked by triangles in the same figure indicates a similar DD curve obtained using the same method for the data within Fukuoka Prefecture only, where many serious drought disasters have occurred in the past. The former DD curve in Fig. 6.6 clearly reflects only the characteristics of areas with low precipitation, regardless of the degree of risk of experiencing drought. Therefore, we proceeded with our analysis based not on precipitation itself, but precipitation normalized by the mean annual precipitation (hereafter, referred to as normalized precipitation).
Fig. 6.6 Dependence of precipitation on the duration of precipitation.
Analysis using normalized precipitation Normalized precipitation From this point onwards, the basic data employed are precipitation normalized by the mean annual precipitation at each observation point. The concept of “mean annual precipitation” has a similar meaning to “normal value” provided by the Meteorological Agency, but here employs the data for 24 years at the longest for averaging, and was calculated using the following method:

64 PUB: International Perspectives on the State of the Art and Pathways Forward
(a) First, the observation points are narrowed down using the following condition, i.e. the “available year” contains effective (“effective” means that a datum exists) daily precipitation data for more than 26 days in February and more than 28 days in other months, and observation points which have more than 20 available years are an “available observation point”.
(b) Values of mean annual precipitation are then calculated for the above selected observation points using values of the annual precipitation for all available years.
(c) Note that an available year still contains non-observation days. Therefore the annual precipitation is obtained by adding the values of monthly precipitation corrected using the following equation: monthly precipitation (corrected) = (sum of the values of daily precipitation for effective days) × (number of total days in the month) / (number of effective days).
Normalized precipitation was defined as the value obtained by dividing the time series daily precipitation data, which comprises 8766 values for each observation point, by the previously described mean annual precipitation, and then multiplying by 1000. For reasons of simplicity, the normalized precipitation is sometimes called precipitation hereafter. The number of observation points that satisfied the above-mentioned condition for the mean annual precipitation was 606 (refer to Fig. 6.7 for their positions). The data on these points only is employed hereafter. DD relationship Another DD curve was calculated using the normalized precip-itation in a similar manner to the previous section (circle-lined curve in Fig. 6.8). The solid line in the figure denotes an approximate line based on the secondary polynomial approximation. There is the following relationship between the precipitation (p0; mm) and the duration of precipitation (d; day):
)0( 05.1168671.00008.0 02
0 ≥−+= pddp (1)
This is a relationship for d ≤ 1100. For the relationship with d ≤ 360, the following equation was obtained. Later depth–area (DA) analyses employ equation (2):
)90360( 845.153741.00032.0 20 ≥≥+−= dddp (2)
Evaluation of the seriousness of drought based on probability of occurrence Evaluations of the scale or the seriousness of droughts in 1978, 1984, and 1994 were carried out using their probability of occurrence. The DD curve obtained in the previous section was based on all the time series data from 1976 to 1999. In this section, probability of occurrence was first calculated from the DD relationship in each year as follows: (a) Assuming that rij is a daily precipitation value (note that it is the normalized
precipitation) at i (observation point number) on the day whose day number is j (starting from 1 for 1 January 1976 and ending in 8766 for 31 December 1999), the following statistical quantity (equation (3)) is obtained for the duration of precipitation d in the year n (n = 1976, 1977, ... 1999):
��
���
��
���
= �+=
=∈
∈
)(
,
IJ
)( mind-1j1j2
j1jji
ij1
dn rx (3)

A. Kawamura & Y. Kuzuha Chapter 6, Drought and Water Resources Management in Japan 65
Fig. 6.7 The location of AMeDAS observation points (shown as squares in the figure) and the circle of smallest precipitation (The durations of precipitation are shown in the figures. The values of the radius of the scanning circles are set to 500, 400, 300, 250, 200, 150, 100, 75, 50, 30, and 20 km).
Fig. 6.8 Dependence of normalized precipitation on the duration of precipitation.
I denotes a set of observation points, J a set of day numbers corresponding to year
n, and j1 is the day number which corresponds to 1 January to 31 December of year n.
(b) Supposing the number of xn(d) obtained is N for a certain d, the probability of
occurrence of the k-th smallest xn(d) is expressed as “k-th among N”.
Yoshikawa & Takeuchi (1975) discussed the drought duration curve and the non-exceeding probability, namely Pk = k/(N + 1), as degree of risk. Takara et al. (1997) evaluated the degree of risk or the seriousness of drought using the return period that is given by Tk = 1/Pk = (N + 1)/k. The data employed were as long as 40–50 observation years for the former, and about 100 years for the latter. By contrast, the data in this discussion were limited to 20–24 years, casting doubt on the suitability of the evaluation of the seriousness of drought using the return period. Therefore, we use, from this point onwards, the expression “k-th among N”. Figure 6.9 illustrates the dependence of xn
(d), the normalized precipitation on d for 1978. Each line in the figures illustrates the relationship between the duration of

66 PUB: International Perspectives on the State of the Art and Pathways Forward
Fig. 6.9 Normalized precipitation vs the duration of precipitation (The seriousness of a drought can be evaluated statistically using these figures. The relationship is divided into five sequences depending on the duration.)
precipitation and the normalized precipitation whose seriousness (of drought or scarce precipitation) is “k-th among N”. In the legends, only values of k are shown. Note that 23 items of xn
(d) are obtained at d ≤ 365, and smaller numbers of xn(d) are obtained at
larger d values depending on the number (N) because of the definition of xn(d). When d
is less than 360, there are 23 xn(d) and an initial point for calculating xn
(d) is one of 23 years (1976–1996). However, with larger d values, the initial point is one of 21 years (1976–1996). This means that the polygonal unbroken line corresponds to “k-th among 23” in the former; and “k-th among 21” in the latter. Figure 6.9 illustrates the relation-ship between the seriousness of drought expressed in terms of probability and the duration of precipitation. Using the relationships in Fig. 6.9, we tried to estimate the seriousness of droughts in the years 1978, 1984 and 1994, which are known as years of serious drought. First, relationships between the duration of precipitation and the

A. Kawamura & Y. Kuzuha Chapter 6, Drought and Water Resources Management in Japan 67
accumulated precipitation depth were calculated for each of the three years. However, to obtain xn
(d) for the three years, equation (4) (not equation (3)) was employed:
��
���
��
���
= �+=
=∈∈∪∈
)(
,
I)J(J)(
)( mind-1j1j2
j1jji
ij2j1
dn rx (4)
The reason for using equation (4) here is that xn(d) derived using equation (3) cannot
include the following case, i.e. an accumulated precipitation whose duration includes a part of year n = very small because of scarce precipitation in year n, but the duration of precipitation is relatively longer and its starting point is in year n – 1. However, of course, it should not contain the case which is not related to scarce precipitation in year n. The thick unbroken line in Fig. 6.9 denotes the relationship between the duration of precipitation and scarce precipitation in 1978. From the figures, the following conclusions are deduced. (a) Under the conditions of d ≤ 60 days, the precipitation is zero, indicating the lowest
precipitation in the last 23 years. (b) With increasing d values up to d = 250, the value indicates about the fifth scarcest
precipitation. (c) Further, at 500 ≤ d ≤ 930, the value generally indicates records of scarce precip-
itation at more than the third class, while occasionally reaching the first class. However, there is not much difference from the first class to the third class.
The abnormally scarce precipitation in 1978 was assessed in detail in this way. Similar figures were generated for the other two abnormal years, 1984 and 1994. However, discussion of them is omitted here. Next the changes in the seriousness of drought (Y axis), or ranks of k (k-th among N) were examined for the duration of precipitation (X axis) for the three years. The results are shown in Fig. 6.10. In none of the years did the precipitation show significant abnormality under conditions of d ≤ 200, but with longer d, especially in 1978 and 1994, it exhibited a distinct scarcity abnormality.
Fig. 6.10 Temporal changes in the seriousness of drought for 1978, 1984 and 1994.
DA and DAD relationships In DAD analysis chiefly focusing on heavy rainfall, it is a standard practice to obtain DA curves illustrating the relationships between the areal size of a region and the maximum areal rainfall in the region. The objective of this paper is to analyse scarce precipitation, so the dependence of the areal size of a region

68 PUB: International Perspectives on the State of the Art and Pathways Forward
(in practice, the radius of a scanning circle is employed for reasons described later) on the minimum areal precipitation in the region was pursued in the following way: (a) Precipitation values were obtained for all observation points over a specified
period of which accumulated precipitation established the DD curve. Note that precipitation again means “normalized precipitation”.
(b) The minimum areal precipitation was calculated in a scanning circle of radius r according to the “area fixed method” (Takara et al., 1999), described later. “Areal precipitation” means the value that is obtained by averaging precipitation values which are included in a certain scanning circle, and “minimum” means the small-est value among the values of areal precipitation obtained by moving the circle.
(c) For example, the minimum point precipitation for a 50-day precipitation is 0 (mm), while the same value is found at 376 cases which are different in either an observation point or the starting point of the scarce precipitation of 0 (mm) for d = 50 days. Therefore, the smallest value among the values of the “minimum areal precipitation” determined in (b) was adopted as the “minimum areal precipitation for d and r” (hereafter we refer to this simply as the “minimum areal precipitation”).
(d) The dependence of the lowest areal precipitation on a radius r was plotted by parameterizing the duration of precipitation.
The “area fixed method”, which was employed by Takara et al. (1999) for the DAD analysis of heavy rainfall, divides the designated area using a grid, and defines a precipitation value at each grid point. Then a circle of specified area is made to shift over the whole range of the catchment area to obtain areal rainfall in the circle from the precipitation at the grid points within it. By shifting the circle, the maximum areal rainfall is also determined. Note that although we use the grid points when the circle is shifted, we do not calculate the precipitation value at each grid point. The areal precipitation values are obtained by simply arithmetically averaging the precipitation values in the circle. If the circle contains fewer than six observation values, it is excluded from our calculations. This means that the number of available areal precipitation values is relatively few when the radius of a scanning circle (hereafter, often referred to as radius) is small. In cases of a radius under 100 km, the minimum areal precipitation was calculated by setting the grid distance to 1 km. For larger radii, the distance was set to 5 km owing to limitations in computation resources. The purpose of the DA analysis for heavy rainfall is to pursue depth–area relationships fundamentally. However, in this study, the DA method was modified and rather than the area of the region (i.e. the area of a scanning circle), the radius of a scanning circle was employed for investigating the relationship with the precipitation. This reason are as follows: (a) in this study, setting a relatively large spatial scale was necessary to allow the investigation of DA relationships for scarce precipitation; (b) due to the arcuate form of the Japanese islands, and due to the large spatial scale, scanning circles of the area fixed method include many sea areas where precipitation data are not available; (c) because of (b), evaluation of “area” is difficult. During the actual execution of the DA analyses, the observation points, that is, AMeDAS observation points, were plotted on a plane of two-dimensional x–y coordinates. The origin was set at 33°N, 129°30′E (refer to Fig. 6.7). The scanning circle was shifted within a square diagonalized with (0, –300) and (1400, 1400) points. All of the circle should be included in the square.

A. Kawamura & Y. Kuzuha Chapter 6, Drought and Water Resources Management in Japan 69
Figure 6.11 illustrates the relationships produced by the procedure above with the horizontal axis as the radius (km) and the vertical axis set to the minimum areal precipitation. The scale runs at intervals of 50 days showing the duration of precipi-tation from 100 days to 350 days. The minimum point precipitation which is obtained by the DD analysis is plotted on the position of the radius of 0 km. With the radius of 20 km, high precipitation values are shown for each value of the duration of precipi-tation. The same tendency was found for other duration values (days) (data not shown). Because of the grid distances for the AMeDAS observation points, applying the condition that more than six observation points should be included within scanning circles is relatively severe for the radius of 20 km. In reality, the number of scanning circles that satisfy this condition ranges between 400 and 1800. (This number varies with the number of available observation points depending on the duration of precipitation.) This number is smaller by one order than for the radius of 30 km. The reason for the large precipitation values at the radius of 20 km is that the distances between AMeDAS observation points are relatively large compared to the radius of the scanning circles, that is, 20 km. Except for the case of radius 20 km, the minimum areal precipitation increases linearly with increasing radius of the scanning circle for each value of the duration of precipitation (Fig. 6.11). The curves obtained with the range of the radius from 0 km to 500 km reveal negative values in the secondary differential, indicating an upward convex tendency. Let us suppose that the DA relationship allows linear approximation within a range of 0 to 250 km for the radius of a scanning circle. For the reason given above, the case of the radius of 20 km is excluded. Therefore, the approximated linear relationship is expressed by: P = ar + b (5) Here, P denotes precipitation, and r denotes the radius of a scanning circle in km. The constant b is calculated from the relationship (equation (2)) between the minimum point precipitation and the duration of precipitation:
)90360( 845.153741.00032.0 2 ≥≥+−= dddb (6)
Then DA curves like Fig. 6.11 were plotted for d that satisfies the condition 90 ≤ d ≤ 360,
Fig. 6.11 Dependence of the radius of a scanning circle on the minimum areal precipitation. Figures in the legend indicate the duration of precipitation (days). Approximated lines, based on a linear regression, are also shown in the figure.

70 PUB: International Perspectives on the State of the Art and Pathways Forward
Fig. 6.12 Dependence of constant a in equation (5) on the duration of precipitation, d.
which then yields a regressive equation using equations (5) and (6), namely the constant a in equation (5). The relationship obtained between d and a is illustrated in Fig. 6.12. It is approximated by: 0.2646 0.0039 −= da (7) In summing up, equations (5), (6) and (7) were obtained for the DAD relationship shown in Fig. 6.11 by solid lines. It shows that the DAD relationship obtained closely reproduces the plotted data in Fig. 6.11 within the range of 90 ≤ d ≤ 360 and 0 ≤ r ≤ 250. The detailed physical significance of the DAD relationship shown here remains to be examined in future studies, but conclusions are: (a) The ability to express the DD relationship by means of a quadratic polynomial
(equations (1) and (6)) which indicates a downward convex tendency, is due to diminishing scarce precipitation tendencies with increasing size of the temporal scale.
(b) Monotonic increase of the DA relationship can be attributed to diminishing scarce precipitation tendencies with increasing spatial scale.
Finally, the relationship between the region where the tendency of scarce precipi-tation is remarkable and “scale” was investigated in order to clarify the temporal and spatial structures of scarce precipitation, and in order to verify the result mentioned above. In this context, scale means either temporal scale (the duration of accumulating precipitation) or spatial scale (the radius of a scanning circle). More specifically, we confirmed the position of the scanning circles by which the values of minimum areal precipitation are calculated for variations of the duration of precipitation (temporal scale) and the radius of a scanning circle (spatial scale). Figure 6.7 illustrates the scanning circle giving the minimum areal precipitation (hereafter referred to as “circle for the smallest precipitation”). From Fig. 6.7 as well as the results of other values of the duration of precipitation not shown here, the following conclusions are deduced: (a) Except for the cases of d = 200 and 210 days, the circle for the smallest
precipitation, with a radius of 500 km, contacts with the southwest corner of the scanned range. It indicates that a tendency of scarce precipitation is remarkable in the southwestern part of Japan if the radius of a scanning circle, that is, spatial scale is large and around 500 km. Contact of the circle of the smallest precipitation with the southwest corner also indicates that the circle may shift further to the southwest if conditions for the scanning range are altered. In cases of d = 200 and

A. Kawamura & Y. Kuzuha Chapter 6, Drought and Water Resources Management in Japan 71
d = 210 days, the circle of the smallest precipitation, with a radius of 500 km, was shown to shift slightly to the east with its centre on (775, 200).
(b) In the case of d = 220 days, the circle of the smallest precipitation with a larger radius contacts with the southwest corner, and lots of the circle of the smallest precipitation with smaller radius, except for 20 km radius, contacts with the west side corner with their centre around y = 0 km. Note that all the centres of the circles whose radius are 20 km are located in the Kinki district when d is 220 days or larger. Some of the circles of the smallest precipitation having a radius of 30 km or 50 km are located quite close to the western corner, but do not contact it. These results suggest that southwestern Japan shows a marked tendency to experience scarce precipitation at scales of less than 400 km radius when the duration of precipitation is 220 days or larger. Similar to (a), the possibility of the circle of the smallest precipitation shifting to the west remains when conditions for the scanning area are altered. Considering the above-mentioned tendency observed for the circles of the smallest precipitation having radii of 30 and 50 km, the region where a remarkable tendency for scarce precipitation is evident at these spatial scales is the western side of Kyushu’s central northern part. (That is, it does not necessarily shift further to the west.)
(c) When d is smaller than 210 days, two areas where a remarkable tendency for scarce precipitation is shown are an area whose centre is around the east of Kyushu district, and an area whose centre is around the Kanto district under the condition that a radius or spatial scale is smaller then 300 km.
(d) Some of the circles of the smallest precipitation slant noticeably towards the sea area. This phenomenon may be due to the scanning range of the circle; it poses problems requiring further research. Since many of these circles contain observation points on Tokyo’s isolated islands, and most of the scanning circles contain sea areas due to the peculiar shape of the Japanese land area, these deviations are unlikely to cast doubt on the conclusions of this study.
INTEGRATED WATER RESOURCES MANAGEMENT IN FUKUOKA METROPOLITAN AREA Fukuoka Metropolitan Area, a fast growing economic and cultural centre in Kyushu, western Japan, was struck by a severe drought in 1978 that resulted in water rationing for 287 days at Fukuoka City. The drought was a great challenge for the authorities which needed to develop countermeasures to secure a stable water supply. Sixteen years after that drought, in 1994, another intense drought hit the same area again, testing the authorities’ efforts at countermeasures (Kawamura & Jinno, 1996). Fukuoka City is located in the northern part of Kyushu, western Japan, at 33°35′N, 130°24′E. The city area is 338 km2 and the population was 1.33 million in October 1999. Fukuoka Metropolitan Area consists of Fukuoka City and 20 surrounding cities. The area has mild weather and climate, and no severe earthquakes or floods have ever been recorded. The annual average temperature is 15–16°C, and the annual precipit-ation is approximately 1800 mm with little snow. Because of seasonal winds, there is both an early summer rain season (June–July) and a typhoon season (September–October).

72 PUB: International Perspectives on the State of the Art and Pathways Forward
The present status of integrated water resources management in Fukuoka Metropolitan Area, including measures to halt the rapid increase of water demand and a number of unique water resources development projects which have been carried out since the 1978 drought, are illustrated here. Also, the natural and social situations at the time of the two droughts are compared (Kawamura & Jinno, 1996). Present waterworks situation In Japan, water resources planning is designed for a drought with a targeted 10-year return period. Waterworks are governed by public organizations, and in general each municipality is responsible for its residents’ water supply. By law the waterworks in each municipality have to be operated on a self-funding basis. So, each municipality has to set its own water rate to make sufficient funds to cover both the water develop-ment and management costs. The sources of water supply in Fukuoka Metropolitan Area are surface water (87%), river-bed water (3%), and groundwater (10%). However, for Fukuoka City these percentages are 95%, 4% and 1%, respectively, indicating that groundwater as a water supply source is extremely small, whereas the percentages are 66%, 1% and 33% for the surrounding municipalities where groundwater is much more important. One reason for the small use of groundwater in Fukuoka City is that the alluvial aquifer here is very thin and so salt water intrusion may occur if too much groundwater is pumped out. Another reason is recent groundwater pollution problems caused by chlorinated hydrocarbons, such as trichloroethylene and tetrachloroethylene, and also pesticides and herbicides. Furthermore, there are no major rivers in Fukuoka Metropolitan Area, only several small rivers, so that the river water utilization rate is very high, e.g. in Fukuoka the rate is 58% in a normal year and 67% in a designed drought year. Since Fukuoka City started the water supply service in 1923, expansion projects have been carried out on 18 occasions in order to cope with the rapid increase of water demand due to the concentration of population in the urban areas, the development of industries (urban infrastructure), the increase of living standards, etc. The big number of expansion projects shows the efforts which the city has taken to develop and efficiently utilize the scarce water resources.
Figure 6.13 illustrates the present waterworks facilities, water sources and conveyance system of Fukuoka City. Fukuoka City withdraws water from five small rivers that flow through the city that are managed by the Prefectural Government. These rivers do not have a sufficiently stable discharge due to their small catchment areas. The city is also receiving water (purchasing water) from the Chikugo River located outside the Metropolitan Area limits. It is the biggest river in Kyushu managed by the National Government. There are five water purification plants and all treat water by rapid-filtration.
Table 6.1 details the dams supplying water to Fukuoka City; generally the capacities and catchment areas of these dams are small. Unique water resources development and management
As mentioned above, in order to meet increasing water demand in areas with scarce water resources, development projects with innovative ideas, unique to Japan, have been carried out. Also, various kinds of measures to halt the rapid increase of water

A. Kawamura & Y. Kuzuha Chapter 6, Drought and Water Resources Management in Japan 73
Fig. 6.13 Waterworks facilities, water sources and conveyance system of Fukuoka City.
Table 6.1 Dams supplying water to Fukuoka City.
Name of dam Catchment area (km2)
Capacity (103 m3)
Purpose Jurisdiction
Magaribuchi 11.4 2 270 C City Minamihata 27.5 5 560 F,Ir,C,E Prefecture Kubaru 0.9 1 460 C City Egawa 30.0 24,000 Ir,C,In,E Corp. of WRD Sefuri 5.5 4 401 C City Zuibaiji 7.2 2 270 F,Ir,C Prefecture Nagatani 1.8 4 850 C City Ino 5.5 4 910 F,Ir,C Prefecture Narubuchi1 6.8 4 160 F,Ir,C Prefecture Gokayama2 18.9 39 700 F,Ir,C,D Prefecture 1 Under construction 2 Planned F, Flood control; Ir, Irrigation; C, City water; In, Industry; E, Electric power; D, Drought measures
demand have been introduced; those projects, classified into six categories (A to F), are listed in Table 6.2. Some of the projects in the list are explained below: Pumping up storage reservoir This type of reservoir stores surplus water pumped up from rivers during the season when irrigation is not necessary. The Kubaru Dam and the Nagatani Dam are examples of this. These dams’ catchment areas are very small as

74 PUB: International Perspectives on the State of the Art and Pathways Forward
Table 6.2 Project list of unique water resources development and management.
A Preservation of forested infiltration areas B Reservoir development 1. Pumping up storage reservoirs
2. Dredging of dam beds 3. Reservoir for drought control
C Improvements of water usage and existing facilities 1. Increasing efficiency of irrigation water
2. Advanced water treatment 3. Water leakage prevention 4. Water supply control
D Water quality improvements 1. Utilization of treated sewage water
2. Desalination of seawater E Regional water transfer F Measures for controlling water demand 1. Popularizing water saving equipment
2. Increase of water saving awareness 3. Water cost policy 4. Regulations concerning water supply rejection
shown in Table 6.1 and almost correspond to their reservoir surface areas. This type of dam is not efficient for natural rainwater collection, but work well in Fukuoka City. Increasing efficiency of irrigation water Generally irrigation water is supplied by an open channel, however, there are usually great losses involved in this method. Therefore, in order to use water efficiently and to prevent losses, pipes are laid to replace open irrigation channels. As a result, excess water brought about by this system is now diverted for service water. This method was implemented at two water intakes on the Naka River in 1969 and 1980. It saved 50 000 m3 day-1 in total. Water supply control The set up of a water supply control system started when the great drought occurred in 1978. Manual valve operation during the drought was extremely hard work and optimal pressure control was impossible without a water supply control system. Water pressure control by this system commenced in 1981 after completion of the Water Control Center. As a part of this project, old distribution pipes were replaced and new networks were set up to make transfer of water between different water purification plants possible. Fukuoka City was the first city to introduce this system in Japan. It includes 120 water pressure gauges, 68 flow meters, and 150 electric control valves located at all important points along the water distribution pipes as of March 2001. An engineer can by visual control operate electric valves by remote control in order to secure the necessary water pressure through the pipe system. By utilizing this system, it has become possible to reduce excessive high water pressure and to secure an appropriate and constant water pressure in order to provide a better service and reduce water leakage from the pipes. Desalination of seawater A desalination plant was completed in 2005. The capacity of this plant, 50 000 m3 day-1, which uses the reverse osmosis method, is the largest in Japan.

A. Kawamura & Y. Kuzuha Chapter 6, Drought and Water Resources Management in Japan 75
Regional water transfer Among the water resources development projects, the water withdrawn from the Chikugo River (Fig. 6.13), which is located outside of the Fukuoka Metropolitan Area, supplies approximately one third of the total water for Fukuoka City. The Fukuoka District Waterworks Agency, which is composed of representatives of each municipality of the Fukuoka Metropolitan Area, was established in 1973 and aims to supply water to the entire metropolitan area. Regional water transfer from the Chikugo River commenced in 1983, even though it was opposed by people living in the river basin. This was because of decreased flow rates for fisheries and because of environmental issues. The Agency was originally transferring water from the Chikugo River only, but now other rivers are also involved. At present, the Agency is playing a very important role as a water supply administration agency for the metropolitan area. Regulations concerning water supply rejection Eight small municipalities surroun-ding Fukuoka City, for which the water supply situation is very stringent due to the rapid population increase (commuting towns for Fukuoka City), have introduced regulations which enable the authorities not to supply water to newly constructed large buildings. In one of the municipalities, however, a housing developer brought a lawsuit against the regulations to court. The point of this lawsuit is whether the authorities have to obey the water supply responsibility as stated in the waterworks law or if they can decide their own regulations. The judicial dispute was over in 1999, and finally the regulation was approved in the Supreme Court. Comparison between the 1978 and 1994 droughts In 1994, high temperatures and low precipitation were very dominant all over Japan resulting in severe drought. Many municipalities were forced to use water rationing, especially in the Fukuoka Metropolitan Area where 14 municipalities out of 21 carried out water rationing, whereas nine had used water rationing in the 1978 drought. Water rationing in Fukuoka City lasted for 295 days in the 1994, and 287 days in the 1978 drought. Table 6.3 shows the status of waterworks in the year previous to each drought. There was a major increase in the spread rate of sewerage and in population. However, the mean daily individual water supply was 331 L in 1994, a decrease of 8.8%. The quantity of 331 L is much smaller than that of other large cities in Japan. The capacity of the waterworks facilities had increased by 47% resulting in enough water supply capacity in reserve for the target 10-year return period drought. Sixty-two percent Table 6.3 Waterworks situation in the previous year of the droughts.
Year 1977 1993 Rate of increase (%)
Water supply population (103) 985 1243 26.2 Capacity of facility (103 m3 day-1) 478 705 47.4 Maximum daily water supply (m3 day-1) 443 491 10.9 Mean daily water supply (m3 day-1) 357 411 15.1 Maximum daily individual water supply (L day-1 capita-1)
450 395 –12.2
Mean daily individual water supply (L day-1 capita-1)
363 331 –8.8
Spread rate of sewerage (%) 36.1 94.7 162.3

76 PUB: International Perspectives on the State of the Art and Pathways Forward
of the increase of the capacity was due to the regional water transfer from the Chikugo River. The decrease of water demand and increase of capacity were all due to the efforts of promoting integrated water resources development and management, discussed earlier. Annual precipitation in 1994 was, however, extremely low as shown in Table 6.4. The total of only 891 mm easily broke the previous lowest-ever record by 109 mm, i.e. it was the lowest for 105 years since 1890. As a result of the low precipitation, water supply from the Chikugo River was cut by 55% at the worst, and the total effective storage of seven dams in Fukuoka City drastically decreased from full storage in June to a quarter in September, as shown in Fig. 6.14. Table 6.4 Descending order of annual precipitation.
Order Year Precipitation(mm) 1 1994 891.0 2 1939 999.8 3 1894 1025.1 4 1978 1137.5 Normal year 1604.3
Fig. 6.14 Total effective storage of dams of Fukuoka City.
Figure 6.15 shows the shut-off hours of water supply for both droughts. In the 1978 drought, water supply restrictions started suddenly on 20 May with a nine-hour shut-off when the storage fell below 20% of the total effective volume of the dams. The restriction was soon tightened sharply into a 19-hour shut-off on 1 June. As a result, many waterworks staff members and self-defence officials were urged to deliver water with water supply wagons. At the time, it really caused a panic. In the 1994 drought, on the other hand, the authorities began water supply restrictions much earlier than in 1978, when the storage was still 50%. Thanks to the great efforts in integrated water resources development and management, and especially with the assistance of water supply control systems, many fewer people were called out to manually close and open the valves, and no water supply wagons were used. In spite of the strict precipitation

A. Kawamura & Y. Kuzuha Chapter 6, Drought and Water Resources Management in Japan 77
Fig. 6.15 Shut-off hours water supply per day.
situation, the total of 2452 hours of water supply shut-off was much shorter than the 4054 hours in the 1978 drought. In contrast to the citizens’ trying experience in the 1978 drought, attitudes were calm and no panic situations occurred among the citizens this time. One of the remarkable features of the 1994 Fukuoka Metropolitan drought, was that the vulnerability to drought of the surrounding municipalities was highlighted. In contrast to the reduction of drought damage in Fukuoka City, the number of surrounding municipalities that were forced to use water rationing increased and the drought damage itself was much more severe. This was not only because of the lower precipitation but also because almost no room for water resources development remains within each small municipality. With this drought as a momentum, a policy in which the total robustness of the water resources system of the whole Fukuoka Metropolitan Area is strengthened, is strongly expected. References JSCE (Japan Society of Civil Engineers) (2000) J. Japan Soc. Civil Engrs 85, 3–47. Kawamura, A. & Jinno, K. (1996) Integrated water resources management in Fukuoka Metropolitan Area.
Environmental Research Forum, nos 3 & 4, 97–109. Kuzuha, Y., Tomosugi, K., Kishii, T. & Hayano, M. (2002) A study on temporal and spatial distributions of
scarce precipitation by depth–area–duration analyses. J. Hydrosci. Hydraul. Engng 20(2), 27–39. MLIT (2000) Water Resources in Japan. Ministry of Land, Infrastructure and Transport, Tokyo, Japan. MLIT (2002) Water Resources in Japan. Ministry of Land, Infrastructure and Transport, Tokyo, Japan. Takara, K., Ikebuchi, S. & Watanabe, H. (1997) The spatial and temporal analysis, statistical evaluation, and
mapping of drought based on the precipitation data at 46 sites in Japan. Report of Grant-in Aid for Scientific Research, Research on Meteorological and Hydrological Investigation on Drought in 1994 and Risk Management for Drought, 59–70.
Takara, K., Imamoto, H., Hayashi, T., Nakakita, E. & Ichikawa, Y. (1999) Storm and flood disaster in the Nakagawa Basin in 1998. Ann. Disaster Prevention Research Institute, Kyoto University 42(B-2), 235–253.
Yoshikawa, H. & Takeuchi, K. (1975) Characteristics of drought duration curve and its application. J. Hydraulic, Coastal Environ. Engng JSCE 234, 61–71.