5th report 2017 the elusive... · (imk) guillaume allègre, céline antonin, christophe blot,...
TRANSCRIPT

independent Annual Growth Survey5th Report
iAGS2017
THE ELUSIVE RECOVERYSpecial studies on Greece and Germany
March 23rd, 2017
With the contribution from:

iAGS is an independent open project subject to the Creative Commons Licence
Financial support from the S&D Group of the European Parliament
within the context of their Progressive Economy Initiative,is gratefully acknowledged
The positions expressed in this report are those of iAGS
and are fully independent of the views of its sponsors

The 2017 iAGS was produced during 2016 autumn by a team involving 4 insti-tutes AK Wien (Austria), ECLM (Denmark), IMK (Germany), OFCE (France) andwith the financial support of the S&D group of the European Parliament.
The authors are
Georg Feigl, Markus Marterbauer, Miriam Rehm, Matthias Schnetzer, Sepp Zuckerstätter (AKW)
Lars Andersen, Thea Nissen, Signe Dahl (ECLM)
Peter Hohlfeld, Benjamin Lojak, Thomas Theobald, Achim Truger, Andrew Watt (IMK)
Guillaume Allègre, Céline Antonin, Christophe Blot, Jérôme Creel, Bruno Ducoudré, Paul Hubert, Sabine Lebayon, Sandrine Levasseur, Hélène Périvier, Raul Sampognaro, Aurélien Saussay, Vincent Touzé, Sébastien Villemot (OFCE)
Coordination by Xavier Timbeau (OFCE).
With the contribution from:
Giorgos Argitis, Nasos Koratzanis, Christos Pierros (INE)
iAGS ContactsScientific: [email protected]
Press: [email protected]
http://www.iags-project.org
Released on March 23rd, 2017

iAGS 2017 — independent Annual Growth Survey 5th Report (Special studies on Greece and Germany)
THE ELUSIVE RECOVERYSpecial studies on Greece and Germany
iAGS 2017
Chapter 6The Greek crisis: Outlook and an alternative economic policy . . . . .5Giorgos Argitis, Nasos Koratzanis, and Christos Pierros
APPENDIX: An analysis of Greece’s debt sustainability . . . . . . . . . . .42Sébastien Villemot
Chapter 7Germany in the position of leader . . . . . . . . . . . . . . . . . . . . . . . . . .51OFCE-IMK
Table

Chapter 6
THE GREEK CRISIS: OUTLOOK AND AN ALTERNATIVE ECONOMIC POLICY
Giorgos Argitis,1 Nasos Koratzanis2, and Christos Pierros3
6.1. Introduction
For the last seven years the Greek economy has been entrapped in a dramaticcrisis in depth, intensity and duration. The scale of the disruption the crisis hasleft behind is exceptional in the economic history of the country and is clearlyvisible in every aspect of the economic, social and political life. The aim of thissurvey is to present and critically evaluate the consequences of the creditors’crisis resolution strategy and to propose the basic pillars of an alternativeeconomic policy that could help Greece exit the crisis. This issue gains in impor-tance, particularly at the current juncture, in the light of three interrelatedfactors. First, the implementation of the third bail-out programme that hasextended the regime of austerity in the country at least up to 2018. Second, thetransition of the economy to a phase of stagnation, which Greek and EU author-ities expect to end after the successful completion of the second review of theprogramme, the implementation of the short-run debt relief measures4 and theensuing inclusion of Greece in the ECB’s quantitative easing (QE) programme.Third, the vibrant debate currently spurred among all participants in the Greekprogramme on the long-term sustainability of the country’s public debt andfuture fiscal targets.
The thrust of our argument is that the very architecture of the macroeconomicadjustment programmes implemented in Greece since 2010 is incompatible
1. Professor of Macroeconomics at the National and Kapodistrian University of Athens andScientific Director of the Labour Institute of the Greek General Confederation of Labour (INEGSEE).
2. Researcher at the INE GSEE.3. Researcher at the INE GSEE.4. On the array of short-term measures recently decided for relieving Greece’s public debt see
iAGS 2017 — independent Annual Growth Survey 5th Report (Special studies on Greece and Germany)
Eurogroup (2016).

iAGS 2017 — independent Annual Growth 5th Report6
with the country’s consumption-led growth model. Thus, any attempt toaddress Greece’s sovereign debt crisis and lacking competitiveness by means ofa frontloaded mix of fiscal discipline and internal devaluation is destined to fail,aggravating the country’s financial instability, productive deficiencies and socialdistress. In view of that, any real prospect for Greece to escape from the crisisand return to market financing in the coming months is highly uncertain.Greece is rather in urgent need of pursuing an alternative policy strategy thatwould target investment and employment creation as a means of restoringeconomic growth and financial stability.
The remainder of this report is organised as follows:5 Section 2 exposes thefiscal conditions in Greece and underlines the failure of the creditors’ fiscal planto resolve Greece’s sovereign solvency problem. Section 3 focuses on the failureof the internal devaluation strategy to foster employment and export competi-tiveness in the country. Section 4 briefly reports the impact of the creditors’policy agenda on the financial stability of the Greek private sector. Section 5pays attention to the impact of the two adjustment programmes on the Greeklabour market and industrial relations, as well as on poverty and living condi-tions. Section 6 presents the main pillars of an alternative policy proposal thathas been elaborated by the Labour Institute of the Greek General Confederationof Labour (INE GSEE).
6.2. Fiscal austerity and sovereign debt crisis
Seven years after the outbreak of the sovereign debt crisis, the Greek economycontinues to be stuck in a debt trap with the near-term fiscal outlook remaininggloomy and uncertain. The main reason for this is twofold: a) creditors’ overem-phasis on fiscal austerity that has proven incapable of restoring the country’ssolvency, credibility and creditworthiness, thereby feeding market perceptionsof a possible debt default; and b) the imposition of a pro-cyclical fiscal tight-ening amid deflationary conditions that has caused negative growth effects,thus further raising the country’s credit risk. Against this backdrop and irrespec-tive of the extent of the forthcoming debt restructuring measures, the route ofthe Greek economy over the coming years will primarily depend on its growthperformance and thereby its ability to generate on a sustainable basis a primarybudget surplus to service its debt payments.
5. This report heavily relies on a series of studies and reports edited by INE GSEE. See, for instance,INE GSEE (2015), INE GSEE (2016a) and INE GSEE (2016b).

The Greek crisis: Outlook and an alternative economic policy 7
Figure 1 provides a clear indication of the currently fragile financial position ofthe Greek public sector, tracing the evolution of the gross public debt andbudget balance ratios to GDP from 1995 to 2017. It becomes clear thatfollowing a long period of fiscal imprudence and excessive deficits, since 2010Greece has engaged in an extremely ambitious fiscal consolidation plan. Thegovernment budget deficit has declined from 15.1% of GDP in 2009 to 1.1% in2016,6 while in structural terms the improvement of the fiscal balance in theperiod 2010-2016 has reached 13.6 percentage points, the largest seen acrossthe EU. This extraordinary fiscal consolidation performance over the past yearshas been greatly facilitated by the package of harsh austerity measuresembarked upon by the Greek authorities since 2010 in the context of the threeMemoranda of Understanding (MoU). Nonetheless, the cost of this staggeringfiscal adjustment in terms of social services provision, public investment andemployment has been tremendous. According to the European Commission,
6. Note that the size of the deficit in 2013 and 2015 is overestimated due to the recapitalisation of
Figure 1. Gross public debt and public budget deficit(Greece, 1995-2017)
% of GDP
Note: Forecast values for 2017.Source: AMECO.
the Greek banking sector.

iAGS 2017 — independent Annual Growth 5th Report8
between 2009 and 2015 the number of persons employed in the public sectorhas dropped by roughly 26%.7 Moreover, compared to 2009 social transfers inkind and social benefits other than social transfers in kind have fallen in 2016 by40.7% and 14.6% respectively, while the corresponding drop in public invest-ment spending in nominal terms has surpassed 48%.8
However, fiscal austerity has been unsuccessful in reducing the gross debt-to-GDP ratio. More specifically, the ratio has reached a peak over the adjustmentperiod, increasing from around 126.7% in 2009 to 179.7% in 2016, despite thelarge debt ‘haircut’ agreed in early 2012. Additionally, according to the latestestimates, the debt burden is set to remain essentially stable in 2017, breaching177% of GDP. This is a fairly disappointing track record, given creditors’ initialanticipations on the allegedly expansionary results of fiscal consolidation, andtherefore on the usefulness of a front-loaded austerity plan for ensuring soundpublic finances and long-run fiscal sustainability. The fact that the ratio of publicdebt-to-GDP has remained for too long at unacceptable record high levelsposes a direct challenge to the very credibility of the macroeconomic adjust-ment programmes, which have failed to improve risk sentiment in financialmarkets and create prospects for a return to market financing in the foreseeablefuture. The main drivers behind the over-indebtedness of the Greek publicsector have been the massive bailout loans granted to the country to avoiddefault and the recessionary effects of the fiscal adjustment programmes imple-mented thereafter.9
A closer look at the major factors that have influenced the trajectory of thepublic debt-to-GDP ratio over the past few years helps explain Greece’s nega-tive debt profile. As shown in Table 1, during the first phase of macroeconomicadjustment (2010-2013) the austerity-led contraction of real GDP along withextraordinary high interest payments and sizeable primary budget deficits haveset the tone for the serious debt overhang episode in the country and theensuing solvency crisis. Nevertheless, the year 2014 has been a turning point inthe process with the achievement of a positive primary balance that has yetbeen insufficient to arrest debt dynamics. With the arrival in power of the new,SYRIZA-ANEL, government, Greece’s fiscal position has worsened substantiallyamid escalating macro-financial instability emerged by the lengthy negotiations
7. See EC (2016a).8. See AMECO database.9. See ETUI (2016) for a comprehensive analysis on the failure of austerity policies to restore fiscal
sustainability in Europe.

The Greek crisis: Outlook and an alternative economic policy 9
over the completion of the second programme and fierce speculations over alikely Grexit. Moreover, despite the achievement of a primary surplus of 2.3% ofGDP, many of the debt-increasing parameters have remained in full force in2016 and put strain on the country’s public finances. The debt-to-GDP ratio isfinally set to return on a downward path in 2017 in response to the over-ambi-tious growth assumptions and the projection of a primary surplus of 2.2%.However, debt sustainability has not been restored and it is not expected to beso in the near future under the existing austerity regime and the debt paymentprofile of the country. In fact, the IMF itself has repeatedly questioned Greekdebt sustainability given the country’s gross financing needs (GFN) scheduleand inability to generate a primary surplus greater than 1.5% over the medium-term (see IMF, 2016a).
The failure of austerity to improve the financial credibility of the Greek publicsector is confirmed by Figure 2 that shows the variation of the solvency index ofthe Greek public sector over the period 1995-2017.10
Figure 2 provides evidence that for the period 1995-2001 the financial structureof the Greek public sector has been fragile, situated in a Ponzi regime. From2002 to 2009, the index has registered a sudden plunge, moving into the ultra-
Table 1. Greece’s gross public debt dynamics (2010-2017)
Note: Forecast values 2017.Source: AMECO (authors’ calculations).
10. For the construction of the solvency index see Argitis (2012), Michopoulou (2014) and Argitisand Nikolaidi (2014a). According to this index sovereign solvency depends on thegovernment’s capacity to generate primary surpluses in order to meet a large part, if not all, ofits interest payment commitments. The public sector is considered to be: (a) in a solventspeculative regime, when the annual primary surplus exceeds the annual interest expenses onthe outstanding debt; (b) in a fragile Ponzi regime, when the primary surplus is less than theannual interest payment obligations. In this case the country’s solvency risk critically depends onits growth performance; and (c) in an insolvent ultra-Ponzi regime, when it runs a primarybudget deficit.
2010 2011 2012 2013 2014 2015 2016 2017
Public debt ratio 146.2 172.1 159.6 177.4 179.7 177.4 179.7 177.2Change in the public debt ratio: (1)+(2)+(3) 19.5 25.8 -12.5 17.9 2.3 -2.3 2.3 -2.5
1. Primary balance 5.3 3.0 3.7 9.1 -0.4 3.9 -2.3 -2.22. Snow-ball effect: (i)+(ii) 12.3 20.7 19.3 13.3 6.7 5.9 2.7 -3.7i. Interest payments 5.9 7.3 5.1 4.0 4.0 3.6 3.4 3.3
ii. Impact of the nominal increase of GDP 6.5 13.4 14.2 9.3 2.7 2.3 -0.6 -7.0
3. Stock-�low adjustment 1.9 2.1 -35.6 -4.6 -4.0 -12.1 1.9 3.4Real GDP growth -5.5 -9.1 -7.3 -3.2 0.4 -0.2 0.3 2.7
Annual % change in GDP de�lator 0.7 0.8 -0.4 -2.4 -1.8 -1.0 0.0 1.3

iAGS 2017 — independent Annual Growth 5th Report10
Ponzi regime. This shift exposes the exceptionally fragile financial position inthe years just before the eruption of the global financial crisis. Moreover, overthe first six years (2010-2015) of extreme austerity the Greek public sector hasfor the most part remained ultra-Ponzi, exhibiting high credit and solvency risk.Only in 2014, following a substantial fiscal tightening, the solvency index hasreached its highest value in response to the achievement of a primary surplus.Yet, this improvement has been short-lived, as the financial structure of theGreek government worsened again in 2015, turning back to the ultra-Ponziregime. For 2016 the index has jumped to the Ponzi position as a result ofimproved fiscal performance, while the projection for 2017 looks similar.Despite this improvement, Greece’s credit risk is set to remain elevated, with itspublic sector financial position situated at the fragile Ponzi regime.
The profound reason for this is the depressing effects of austerity on internaldemand that constantly drags down economic growth and hence the ability ofthe public sector to build an adequate primary surplus on a sustainable basis.This adverse effect also explains why Greece’s impending participation in theECB’s QE programme may not solve the country’s solvency problem, despite itspositive contribution to relaxing the public sector’s grave liquidity constraints in
Figure 2. Solvency index for the Greek public sector (1995-2017)
Note: Forecast values for 2017.Source: AMECO (authors’ calculations).

The Greek crisis: Outlook and an alternative economic policy 11
bond markets. Note also that Greece’s imminent growth and sustainabilityprospects are today subject to two considerable downward risks. The first refersto the deflationary impact expected this year from the enactment of an extra2.4 billion euros worth (1.4% of GDP) package of austerity measures, mostly onthe revenue side. The second risk is related to the uncertainty about thesuccessful conclusion of the second review of the programme, which iscurrently held in abeyance, due, among other reasons, to the unreasonabledemands of creditors for: a) further labour market deregulation, includingincreasing the collective dismissal ceiling from 5% to 10% and enshrining theemployers’ option of locking-out; and b) more austerity measures, such as thereduction of the tax income threshold and pensions, required for Greece tosafeguard large primary surpluses during and after the end of the currentprogramme.11 Undoubtedly, implementing these demands is about to re-inflate recessionary dynamics in Greece, thus putting at stake economicrecovery and debt sustainability prospects.
This danger becomes even more tangible in the light of the heavy toll alreadytaken by austerity on ordinary people’s living standards. In fact, as depicted inTable 2, the ratio of households’ income tax and social security contributions togross disposable income has considerably increased between 2010 and 2015,particularly for low-income households. The same also holds for the ratio ofwealth tax to gross income, thus pointing out the disproportionate tax-burdenborne by poorer households in the period of austerity. This evidence simplysuggests that a further reduction of the income tax threshold is very likely, thatwill aggravate inequality in Greece, further depressing private consumption anddomestic demand. Such implications will be even stronger bearing in mind thedata presented in Figure 3 that exposes the key role of pensions in Greece inalleviating income inequality. As depicted, in 2015 pensions have contributedto lowering the Gini index by 24.2 percentage points, in fact being the onlyeffective tool of social protection in the country. This role becomes even morecritical, taking into account that, as a result of the record high levels of jobless-ness in the country, an increasing number of households nowadays depend onthe family’s pensions to make the ends meet.
11. Such fiscal targets ostensibly revolve around need of re-establishing Greece’s long-run debtsustainability, thereby allowing the IMF to contribute funds to the current bail-out programmeand paving the way for the inclusion of the country in the ECB’s QE.

iAGS 2017 — independent Annual Growth 5th Report12
All in all, austerity has not succeeded in consolidating sound and sustainable
fiscal conditions in Greece and helping public authorities regain access to
private bond markets. What it has succeeded in doing instead is to have
plunged the Greek economy into a disastrous spiral of debt-deflation and reces-
sion12 that consistently constrains the country’s debt servicing capacity and
Table 2. Households’ tax burden in Greece (2010 and 2015)
Sources: ELSTAT (authors’ calculations), INE GSEE (2017).
Figure 3. Gini coefficient after and before social transfers in Greece (2010 and 2015)
Source: Eurostat.
12. See also Gechert and Rannenberg (2015) for the contractive effects of fiscal austerity on GDPduring the period of macroeconomic adjustment.
2010 2015 2010 2015
6.13% 9.08% 0.14% 6.04%28.41% 30.04% 0.12% 2.46%
Income tax & social security contributions/ total gross income Wealth tax/total gross incomeHigh-income householdsLow-income households

The Greek crisis: Outlook and an alternative economic policy 13
prolongs excessive macroeconomic and financial instability. This is plausible,since the creditors’ strategy seems to completely neglect the adverse financialeffects of austerity and strict fiscal discipline. In fact, the strong commitment toa policy of aggressive budget consolidation, rather than operating as a devicefor restoring growth, employment and debt sustainability, has instigated a deepliquidity crisis in the economy that systematically contracts domestic demandand employment. The creditors’ fiscal consolidation programme is, therefore,self-defeating in that it creates no prospects for positive growth rates andsustainable primary surpluses in an environment of social and political stability.
6.3. The failure of the internal devaluation strategy
Internal devaluation was, and still remains, at the epicentre of the creditors’strategy to boost price competitiveness and gear the Greek economy towards apath of export-led growth.13 Achieving high level sustainable growth is alsoperceived as a necessary condition in order for the economy to alleviate therecessionary effects of austerity and for the public sector to generate steadily anadequate primary surplus required to restore its sovereign solvency. Yet, theingredients of the creditors’ remedy, namely a combination of reducing theminimum wage, de-collectivising wage bargaining and lowering non-wagecosts, have proven profoundly mistaken. The major reason for this is that thisstrategy has failed to consider the Greek economy’s heavy reliance on domesticdemand.14
In fact, it was only in 2014 that Greece had some signs of economic growth,with real GDP slightly expanding by 0.4% for the first time since the outbreakof the crisis, before falling again in 2015 and virtually stagnating in 2016. Notethat, although the recessionary dynamics in Greece have begun to ebb awayover the last three years, the cumulative loss of real GDP over the period 2010-2016 has reached nearly 25%. The main reason for this has been the collapse ofinternal demand (see Figure 4). Specifically, over the period under considera-tion the free fall of private consumption has cumulatively contributed by -18%to the change of GDP, with investment (-12.4%) and public consumption(-5.6%) following suit. Meanwhile, any positive growth contribution of thetrade balance (9.8%) has arisen largely thanks to the pronounced drop in
13. See Theodoropoulou (2014) for the philosophy underlying the creditors’ internal devaluationstrategy and for the relevant policy measures prescribed by Memoranda.
14. On that issue see also Theodoropoulou (2016).

iAGS 2017 — independent Annual Growth 5th Report14
imports. For 2017, GDP growth is expected to rebound remarkably on the backof a dynamic recovery of investment and private consumption. Alas, such aprediction is exposed to substantial downward risks, taking into account thehigh level of uncertainty currently sparked in the economy due to theprotracted negotiations for the completion of the second review, the anticipa-tion of new harsh fiscal measures and the very fragile financial position ofinstitutional sectors provoked by austerity and internal devaluation. The unex-pected contraction of real GDP in the fourth quarter of 2016 by 1.1%compared to the same quarter of 2015 seems to confirm our doubt for theimminent growth prospects in Greece.
A key factor behind depressed demand and protracted economic slump overthe last years has been certain developments in labour markets. During themacro adjustment period, a trend of aggressive wage compression has takenplace, leading average nominal compensation per employee to plummet byover 19% relative to the 2009 level (Figure 5).15 This outcome has been mainlytriggered by the range of administrative and legislative measures taken towardsgreater labour market flexibility and wage cost reduction as part of the credi-
Figure 4. Contributions to the change of real GDP (Greece, 2007-2017)
Note: Forecast values for 2017.Source: AMECO (authors’calculations).

The Greek crisis: Outlook and an alternative economic policy 15
tors’ internal devaluation strategy. Significant wage-reducing effects had alsobeen produced by deep public spending cuts, as well as by the explosive rise ofunemployment that further eroded trade unions’ bargaining power in an envi-ronment of labour market deregulation. Meanwhile, the contraction of nominallabour compensation has been accompanied by stagnant growth of labourproductivity, following the steep fall of productivity recorded in the first phaseof the Greek crisis (2008-2010). The combined outcome has been a sharpdownward adjustment in unit labour costs for the aggregate economy, espe-cially in the period 2011-2015 when unemployment surged to over 25%. Notealso that, while unit labour cost has slightly edged up in 2016, this develop-ment has been primarily attributed to the fall of productivity rather than to arobust increase in labour compensation. Finally, for 2017 the path of unitlabour cost is projected to remain virtually unchanged.
15. Onaran and Obst (2016) document evidence on the existence of a wage-led growth regimeacross EU-15 member states (including Greece) and underscore the deflationary effects of thecurrently dominant policy paradigm.
Figure 5. Compensation of employees, unit labour cost and unemployment rate (Greece, 2006-2017)
2009=100
Note: Forecast values for 2017.Source: AMECO (authors’calculations).

iAGS 2017 — independent Annual Growth 5th Report16
However, labour cost restraint and increased labour market flexibility have failedto spur investment and competitiveness. What has instead occurred is that theconsumption of private capital has gathered momentum, indicating the cut-back or closure of private firms and the consequent destruction of fixed capitalassets (see Figure 6). This process has deepened the weakness of the Greekeconomy and greatly contributed to the declining performance of virtually allbranches of economic activity. Specifically, in the period between the fourthquarter of 2010 and the fourth quarter of 2016 all key branches, other than realestate activities and agriculture, forestry and fisheries, have witnessed apronounced drop in real gross value added. The steepest fall has occurred inconstruction (35.6%) followed by professional, scientific and technical activities(31%) and information and communication (26.7%). Real gross added value inmanufacturing, a key sector with substantial productivity potential, has alsodeclined by 10.2%. Needless to say, the gap between the consumption of fixedcapital and private gross fixed capital formation traced in Figure 6 clearlyreflects these developments and indicates the negative contribution of invest-ment to GDP growth. The closure of this gap requires huge investment in fixedcapital and this is of paramount importance in order for the private sector tocontribute to the transition of the economy from a vicious circle of deflationand crisis to the virtuous circle of growth and job creation.
Figure 6. Investment and capital accumulation (Greece, 2006-2017)
Note: Forecast values for 2017.Source: AMECO.

The Greek crisis: Outlook and an alternative economic policy 17
On top of that, internal devaluation has proven incapable of propping upGreece’s export performance. In fact, while the Greek economy has slid into adeflationary phase from the start of 2012 and unit labour cost has droppedsubstantially over the adjustment period, export prices of Greek goods andservices, at least up to the fourth quarter of 2012, have remained on a strongupward trajectory (see Figure 7). Subsequently, the price competitiveness ofGreek exports has improved substantially, but this development has notresulted in any notable rebound in export growth that could substantiate anexport-led transformation of the Greek economy. Greece’s exports of goodsand services have on average expanded at a particularly modest rate between2012 and 2016, hardly outstripping 2.3% per year, despite the strong growthof the country’s tourism industry from 2013 on.
It becomes apparent that the most prominent contributor to the correction ofthe country’s persistent current account deficits has been the dramatic declinein imports (Figure 8). From the second quarter of 2010 until the second quarterof 2016, imports of goods and services have contracted by 12% mainly due toshrinking domestic demand. Nevertheless, it is worth noting that the volume of
Figure 7. Unit labour cost, export prices and export volumes of goods and services (2006Q1-2016Q4)
2006Q1=100
Source: Eurostat, OECD (authors’ calculations).

iAGS 2017 — independent Annual Growth 5th Report18
imports mildly recovered from the first quarter of 2014 on the back of slightlyimproved demand conditions, before dropping again abruptly in the secondand third quarter of 2015 due to the imposition of capital controls and theensuing drop in consumption and investment spending. Subsequently, slightlystronger private consumption fueled import growth in the last few quarters,which along with subdued export performance, inflated again the Greek tradedeficit, thus weighting on economic growth. This sensitivity of Greece’s tradebalance to the movements of domestic demand underlines the country’sproductive deficiencies and highlights the critical role of public investment as atool for fostering both macroeconomic stability and structural competitiveness.
6.4. Austerity and the private sector’s financial position
Apart from aggravating the economy’s productive problems, internal devalua-tion and fiscal austerity have also put intense pressures on the financial balanceof the private sector, thus feeding back economic stagnation and solvency risk.As depicted in Figure 9, the correction of the public sector’s financial imbalanceover the adjustment period16 did not occur at a time of growing private invest-
Figure 8. Exports, imports and net exports of goods and services (Greece, 2006Q1-2016Q4)
Source: Eurostat.

The Greek crisis: Outlook and an alternative economic policy 19
ment. In addition, whereas the surplus of the external sector has recentlysmoothed out, any correction in the economy’s trade balance has been inade-quate to fully offset the contractive effect of austerity on internal demand andGDP growth.17 Thus, it is clear that, in the absence of a sizeable current accountsurplus in the coming years, a new dose of austerity to achieve theprogramme’s primary balance target of 3.5% of GDP in 2018 and beyond isvery likely that will exacerbate inter-sectoral financial adjustments, thus under-mining the capacity of the economy to reach its projected growth path.
The creditors’ agenda has also corroded private households’ financial health.Figure 10 supports this claim by exposing the evolution of household consump-tion and gross disposable income as a percentage of GDP over the period 2005-2016. Given the extent of tax evasion, it is evidenced that since 2012 the levelof private consumption has started to exceed that of disposable income, with
16. Recall that the public sector’s financial deficit and corporations’ financial surplus in 2013 and2015 appear inflated due to recapitalisation of the Greek systemic banks.
17. Note that for the external sector a negative (positive) financial balance indicates a currentaccount surplus (deficit). For a comprehensive analysis on balance sheet adjustments under aregime of fiscal austerity, see Kregel (2011) and Kregel (2015).
Figure 9. Sectoral financial balances in Greece, 2005-2016
% of GDP
Source: AMECO (authors’ calculations).

iAGS 2017 — independent Annual Growth 5th Report20
the underlying process continuing uninterruptedly throughout the adjustmentperiod. This trend implies a gradual drop in savings flows and deposits18 in thehousehold sector and results from the efforts of ordinary people to keep adecent level of consumption in a context of high unemployment and fallingincomes. The plunge of household savings lies at the heart of the mal-perfor-mance of austerity in Greece for several reasons. First, it has starkly degraded thefinancial position of households, hence preventing any real prospect for avigorous recovery of consumer spending in the near future. On top of that, ithas exposed the Greek banking system to a greater credit risk by underminingthe loan portfolio quality and the capital adequacy ratio of banking institutions.In fact, in 2016 the ratio of non-performing loans (NPLs) has climbed to 37%,19
while according to the IMF the ratio has been even higher, i.e. close to 50%(IMF, 2016b). Last but not least, the squeeze of households’ savings has severelylimited citizens’ taxpaying capacity, thereby sidetracking consolidation effortsand perpetuating financial instability through the ‘bank-sovereign-nexus’.
18. Given households’ negative credit expansion. On that issue, see below.19. See World Bank database at: http://data.worldbank.org/indicator/FB.AST.NPER.ZS
Figure 10. Households’ consumption and gross disposable income in Greece, 2006-2015
% of GDP
Source: Eurostat (authors’ calculations).
Gross disposable income
Consumption

The Greek crisis: Outlook and an alternative economic policy 21
The grave financial repercussions of the creditors’ policy agenda are alsoreflected in Figure 11 that portrays the evolution of the debt-to-gross earningsratio for Greek households and non-financial corporations (NFCs) from 2006until 2015.
It is clearly evident that the household debt ratio has been on a strong upwardtrajectory up to 2013 (i.e., a rise of 35.2% compared to the 2009 level), beforefalling in the period 2014-2015 thanks to the faster reduction of household debtthan gross disposable income. Though, in the entire macro adjustment period,household debt has shrunk by 24 billion euros, while the corresponding fall inhousehold disposable income has amounted to 43 billion euros, suggesting thehighly fragile financial structure of the Greek household sector. Regarding NFCs,the relevant index in the same period has also grown, though more moderately,as a result of the stronger decline in gross operating surplus (-28%) than debt(-13%). In absolute terms, between the first quarter of 2010 and the firstquarter of 2016 the cumulative reduction of NFCs debt burden has totaled33 billion euros, indicating the process of deleveraging currently in motion thatsystematically chocks off the level of domestic demand in the economy.
Figure 11. Households’ and NFCs’ debt-to-gross earnings ratio in Greece, 2006-2015
2010=100
Source: Eurostat, Bank of Greece (authors’ calculations).
Non-financial corporations
Households

iAGS 2017 — independent Annual Growth 5th Report22
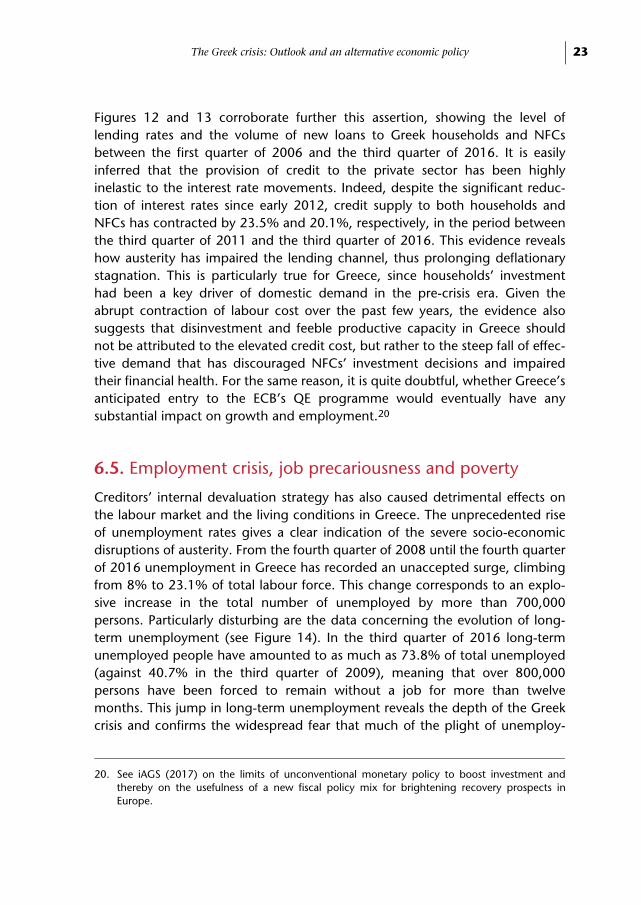
Figure 12. Lending rates and new loans (Household sector, Greece)
2006Q1-2016Q3
Source: Bank of Greece (authors’ calculations).
Figure 13. Lending rates and new loans (NFCs, Greece)
2006Q1-2016Q3
Source: Bank of Greece (authors’ calculations).
The Greek crisis: Outlook and an alternative economic policy 23
Figures 12 and 13 corroborate further this assertion, showing the level oflending rates and the volume of new loans to Greek households and NFCsbetween the first quarter of 2006 and the third quarter of 2016. It is easilyinferred that the provision of credit to the private sector has been highlyinelastic to the interest rate movements. Indeed, despite the significant reduc-tion of interest rates since early 2012, credit supply to both households andNFCs has contracted by 23.5% and 20.1%, respectively, in the period betweenthe third quarter of 2011 and the third quarter of 2016. This evidence revealshow austerity has impaired the lending channel, thus prolonging deflationarystagnation. This is particularly true for Greece, since households’ investmenthad been a key driver of domestic demand in the pre-crisis era. Given theabrupt contraction of labour cost over the past few years, the evidence alsosuggests that disinvestment and feeble productive capacity in Greece shouldnot be attributed to the elevated credit cost, but rather to the steep fall of effec-tive demand that has discouraged NFCs’ investment decisions and impairedtheir financial health. For the same reason, it is quite doubtful, whether Greece’santicipated entry to the ECB’s QE programme would eventually have anysubstantial impact on growth and employment.20
6.5. Employment crisis, job precariousness and poverty
Creditors’ internal devaluation strategy has also caused detrimental effects onthe labour market and the living conditions in Greece. The unprecedented riseof unemployment rates gives a clear indication of the severe socio-economicdisruptions of austerity. From the fourth quarter of 2008 until the fourth quarterof 2016 unemployment in Greece has recorded an unaccepted surge, climbingfrom 8% to 23.1% of total labour force. This change corresponds to an explo-sive increase in the total number of unemployed by more than 700,000persons. Particularly disturbing are the data concerning the evolution of long-term unemployment (see Figure 14). In the third quarter of 2016 long-termunemployed people have amounted to as much as 73.8% of total unemployed(against 40.7% in the third quarter of 2009), meaning that over 800,000persons have been forced to remain without a job for more than twelvemonths. This jump in long-term unemployment reveals the depth of the Greekcrisis and confirms the widespread fear that much of the plight of unemploy-
20. See iAGS (2017) on the limits of unconventional monetary policy to boost investment andthereby on the usefulness of a new fiscal policy mix for brightening recovery prospects inEurope.

iAGS 2017 — independent Annual Growth 5th Report24
ment acquires increasingly structural characteristics, despite the small decline inthe unemployment rate over the last two years or so.
What is even more upsetting is that the scourge of high unemployment hasmostly ravaged the more vulnerable groups within society. Figure 14 shows thatthe youth unemployment rate has hit a record high during the years of austerity,ascending by over 30 percentage points compared to the pre-programmeperiod level. Despite the gradual drop in youth unemployment recordedrecently, young people in the country find it very difficult to take up a job, with45% of the labour force aged 15-24 years, i.e. a total of 118,000 persons, effec-tively remaining out of work. Furthermore, the female unemployment rateconstantly surpasses the nation-wide average, standing at 27.6%. At the sametime, the risk of unemployment threatens all, no matter what their educationalattainment level—even those who hold a postgraduate degree. This evidencesubstantiates the role of demand-led economic policies for combating bothcyclical and structural unemployment.21
Figure 14. Unemployment rate by social group and long-term unemployment
2006Q1-2016Q4
Note: Data on long-run unemployment are available up to 2016Q3.Source: Eurostat.

The Greek crisis: Outlook and an alternative economic policy 25
A more complete picture of the adverse conditions prevailing in the labourmarket can be obtained by looking at some quantitative and qualitative aspectsof employment. Figure 15 shows that the employment rate in Greece has virtu-ally plunged, falling from 61.4% in the third quarter of 2008 to 52.4% in thethird quarter of 2016.
The steepest decline in employment has been observed in the constructionsector, which has lost a total of 253,300 jobs, with manufacturing (188,200losses) and wholesale and retail trade (172,000 losses) following suit. The sumof 613,500 jobs lost in those three sectors represents about 70% of the totalemployment losses which have occurred in the economy in recent years, indi-cating the sectors that have borne the brunt of the economic crunch andausterity. Besides the sharp contraction of employment, major changes havealso taken place in working conditions and in the terms of employment. Specif-
21. Antonopoulos et al. (2014) and Ioannidis and Pierros (2015) provide a detailed overview of theemployment crisis in Greece and offer a proposal for combating unemployment through directjob creation programmes.
Figure 15. Total and part-time employment rates
2006Q1-2016Q3
Source: Eurostat.

iAGS 2017 — independent Annual Growth 5th Report26
ically, the share of part-time work in total employment has increased withinseven years by 4 percentage points (9.8% in the third quarter of 2016 against5.8% in the third quarter of 2009), while that of involuntary part-timers hasreached astonishingly high levels, standing at 72.6% of total part-timeemployees in 2015. All these transformations manifest a wider shift in theworking environment and industrial relations in the country and reveal theimpact of the creditors’ policy agenda on expanding ‘in work’ insecurity andprecarious employment conditions.
In addition, the real minimum wage level has registered a decline of 20.8%during the period between second semester of 2010 and the second semesterof 2016 (see Figure 16) with an even greater decline for young people aged lessthan 25 years. Similar results are reached when comparing minimum wagesacross the EU calculated in terms of purchasing power standard. Greece hasslumped from the 7th to the 11th place in the ranking among member stateswith a national statutory minimum wage, underperforming with respect toSpain and even to some new member states. It is worth mentioning that theabovementioned developments have been the direct outcome of the extensiveamendments in labour law that have been requested by the creditors.
Figure 16. Real monthly minimum wage in the EU
Percentage change, 2010S2-2016S2
Source: Eurostat (authors’ calculations).

The Greek crisis: Outlook and an alternative economic policy 27
More specifically, since 2010 industrial relations in Greece have been in the eyeof the storm of the crisis, being an integral part of the internal devaluationstrategy. So far, a range of regressive labour market reforms has been promotedthrough active state intervention geared towards promoting flexible andprecarious forms of employment and reforming collective bargaining.22 Suchmeasures inter alia include: the suspension of all branch and occupationalcollective agreements extension as long as Greece’s economic adjustmentprogramme is in full effect; the suspension of the so-called ‘favourability prin-ciple’ in collective bargaining; and the prevalence of company level agreementsin the case of overlapping with the relevant branch level collective agreement.
Additional legal provisions have accompanied these arrangements, further chal-lenging the institutional standing of trade unions and labour rights. In particular,a new legal framework has been enacted enabling non-trade union representa-tives (i.e. associations of persons), as well as firms with fewer than 50 employeesto reach special company-level collective agreements. Also, far-reaching inter-ventions have been undertaken in the content and universality of the generalnational collective agreement, including a 22% reduction by decree in thenational nominal minimum wage and a further 10% cut for employees aged lessthan 25 years old; the enactment of legislation providing exclusive competenceto the government, rather than to social partners, to set the minimum wagelevel; the introduction of special provisions regulating the setting of minimumwages for long-term unemployed and the removal of the ‘universal applicabilityprinciple’ of the general national collective agreement on wages.
On top of that, the duration of the ‘after effect’ of collective agreements hasbeen curbed to three months. A special clause put in place also stipulates that inthe absence of a collective agreement, then after a period of three months fromthe expiry or termination of the prior collective contract, only the termsregarding the basic wage and four allowances are applicable.23 Besides, wageincreases thanks to seniority contained in law and/or in collective agreementshave all been suspended, while major legislative amendments have beenadopted concerning the mediation and arbitration process. From 2012 on,recourse to arbitration is permitted only by the unanimous consent of all partiesconcerned and arbitrators’ decisions are strictly limited only to issues related tothe determination of the basic wage. It is obvious that these deregulation meas-
22. See Karamessini (2015) and Schulten (2015) for an overview of the labour market reformsimposed by the two Memoranda.
23. These allowances refer to seniority, child, educational attainment and hazardous employment.

iAGS 2017 — independent Annual Growth 5th Report28
ures undertaken over the last years have radically modified the balance of socio-political power towards employers, narrowing dramatically the range of choicesand the bargaining power of trade unions. Certainly, this trend would intensifyif additional arrangements related to industrial action and collective dismissalswere to be undertaken as requested by the third bailout programme.
Unfortunately, the dismantlement of collective bargaining institutions and wagesuppression have obstructed the path towards any socially inclusive economicrestructuring of Greece. Besides, drastic cutbacks in social welfare spendinghave led to an unparalleled deterioration in living conditions, thus widening thedevelopment and income gap separating the country and the rest of its EU part-ners. As depicted in Figure 17, real GDP per capita in Greece has dropped by24.5% in the period 2008-2016, standing today at nearly 17 thousand euros.This figure corresponds to only 63.3% of the average per capita real income inthe EU-28 (compared to 86% in 2008), indicating a disturbing process of diver-gence between Greece and the EU in terms of living standards currently inmotion. Even more worrying is the fact that this trend has not attracted suffi-cient attention in the current European policy agenda, despite its profoundeconomic and political repercussions and the centrifugal dynamics it creates.
Figure 17. Real GDP per capita in Greece and the EU-28 (2005-2016)
Source: AMECO (authors’calculations), INE GSEE (2017).

The Greek crisis: Outlook and an alternative economic policy 29
In addition, the data suggest that relative poverty in the country has increasedby 1.7 percentage points, from 19.7% in 2009 to 21.4% in 2015 (see Figure18). It is important to note that the figure misrepresents the profile of poverty inGreece because this poverty indicator is computed on the basis of the medianequivalised disposable (after taxes) income, which has plunged precipitatelysince 2009. Hence, a more comprehensive depiction of poverty developmentsin Greece gives the poverty gap index, which over the period 2009-2013 hasmarkedly deteriorated, growing from 24.1% to 32.7%, before falling somewhatin 2014-2015. Despite this slight improvement, the figures underline the verylarge decline in incomes of the poorest subgroups of the society during thetime of austerity; in other words that the poor are getting poorer.24
Moreover, looking at an alternative index of poverty, namely the poverty rateanchored at a fixed moment in time (2008), the evidence is more striking. It isfound that in 2015 the share of total population with disposable income below
Figure 18. Key poverty indices for Greece (2009-2015)
Source: Eurostat.
24. For a detailed analysis on recent developments concerning poverty and inequality in Greece,see also Giannitsis and Zografakis (2015) and OECD (2015a).

iAGS 2017 — independent Annual Growth 5th Report30
the 2008 poverty line has climbed to 48% (against 18.9% in 2009). This simplymeans that in 2015 the total number of people living in poverty has been morethan double compared to that in 2008, or equally that almost 5 out of 10 peoplein the country have had disposable income below the 2008 poverty threshold.
Figures 19 and 20 disclose the role of creditors’ policy in proliferating episodesof impoverishment in Greece. Figure 19 depicts the relationship between thesize of fiscal consolidation and the change in anchored poverty rates in Greeceand in other Euro area member states in the 2010-2015 period. It is evidencedthat austerity has exerted a severe impact upon living conditions in Greece,leading to a dramatic upsurge of anchored poverty, thus underscoring the roleof creditors’ fiscal agenda in deteriorating living standards in the country.
The same is also true for internal devaluation strategy and the trend of wagecompression underway since 2010 (Figure 20). It is also important to note that,together with the striking increase in poverty, over the last six years an ever-growing part of the population in Greece suffers also from material deprivation.For instance, the latest data from Eurostat suggest that in 2015 53.4% of thecountry’s citizens did not have the ability to meet unexpected, though neces-
Figure 19. Fiscal consolidation and anchored poverty in the Euro area (2010-2015)
Source: Eurostat, AMECO (authors’calculations).

The Greek crisis: Outlook and an alternative economic policy 31
sary, expenses (against 26.6% in 2009), while the corresponding share of thosefacing difficulties to pay even regular expenses, including the rent, utility billsand mortgages, has risen from 28.7% in 2009 to 49.3% in 2015. Equallyalarming is also the fact that nearly one third of the population (29.2%) inGreece is not able to afford heating expenses, compared to 15.7% in 2009.
What deserves special recognition is that the austerity agenda has impingeddisproportionally upon the living conditions of different population groups(Figure 21). Whereas for the general population in Greece the index of severematerial deprivation has more than doubled in recent years (21.3% in 2015against 10.6% in 2009), it is the unemployed persons who have suffered themost from deprived living conditions. Specifically, for this population groupsevere material deprivation has risen from 20.2% in 2009 to 43.4% in 2015,meaning that more than 4 out of 10 jobless people do not have the means tomeet at least four key requirements for decent life. This development highlightsthe worrisome degradation of Greece’s social protection system over the macroadjustment period as a result of sizable public spending cuts and the retreat ofthe welfare state. Equally worrying and indicative of the worsening workingconditions in Greece over the period 2009-2015 is the striking surge of severe
Figure 20. Labour compensation and anchored poverty in the Euro area (2010-2015)
Source: Eurostat, AMECO (authors’calculations).

iAGS 2017 — independent Annual Growth 5th Report32
material deprivation episodes among employed persons by 7.6%, with 14.8%of employees and 18% of employed persons except employees in 2015 beingseverely materially deprived.
Besides, the share of regular pensioners living under severely deprived condi-tions in 2015 has reached 13.1% (compared to 10.2% in 2009). In the sameyear, the corresponding rate for those who have opted to remain out of thelabour force has been even higher, standing at 26.3% (compared to 14.5%in 2009).
6.6. The INE GSEE policy proposal for Greece to exit the crisis
Following the formal request of the Greek authorities for financial support fromthe ESM, in August 2015 the Greek government and the European Commissionhave concluded a third economic adjustment programme that shall accompanythe country’s financial aid of an amount of up to 86 billion euros for the period2015-2018.25 The specific terms and requirements of the agreement have been
Figure 21. Severe material deprivation rate by activity status (Greece, 2009 and 2015)
Source: Eurostat.

The Greek crisis: Outlook and an alternative economic policy 33
set forth and compliance with them has been under the supervision of andregular reviews by the institutions (i.e. the EU Commission, ESM, ECB and IMF)as a precondition for loan disbursements to the Greek government.26 The over-riding objectives of the new MoU are the same as the previous two, namely torestore fiscal sustainability, secure stable financial conditions, improve competi-tiveness and modernise public administration.
Specifically, in the fiscal area, the programme imposes a wide range of reformsin order for Greece to achieve a primary budget balance of -0.25%, 0.5%,1.75% and 3.5% of GDP in 2015, 2016, 2017 and 2018, respectively. On therevenue side, such measures include, inter alia, the modification of the VATsystem, the removal of several tax incentives and exceptions, the restructuringof personal income tax schemes, the creation of appropriate mechanisms forfilling revenue losses and strengthening tax enforcement. On the spending side,the Greek government is committed to controlling social expenditure bycurbing healthcare spending and introducing a broad social welfare andpension reform agenda, involving strong discouragement of early retirement.The Greek authorities have also committed to taking any action required tocorrect any deviation from the fiscal targets. Up until the completion of the firstreview of the programme (June 2016), the Greek government had already legis-lated fiscal measures estimated to generate a net saving of 3% of GDP (5.7billion euros) in the period 2016-2018. These measures have supplemented aninitial 1.7% of GDP adjustment put in place in July and August 2015.27
To secure financial stability and improve liquidity conditions in the economy,the Greek government has also launched a procedure for the recapitalisation ofthe banking sector, improving the governance framework of the Hellenic Finan-cial Stability Fund (HFSF) and resolving the problem of NPLs. To boostcompetitiveness and economic growth, an independent body of experts hasalso been set up entrusted with evaluating several labour market reforms,acknowledging international best practices. Despite that, the Greek govern-ment has also committed to not making any amendment to the current system
25. The programme’s content and objectives have been set in liaison with the ECB and withtechnical support from the IMF.
26. See Council implementing decision EU (2015) 2015/1411 and also ‘Memorandum ofUnderstanding between the European Commission acting on behalf of the European StabilityMechanism and the Hellenic Republic and the Bank of Greece’, available at: http://ec.europa.eu/economy_finance/assistance_eu_ms/greek_loan_facility/pdf/01_mou_20150811_en.pdf.
27. See EC (2016a).

iAGS 2017 — independent Annual Growth 5th Report34
of collective bargaining in the country and abstaining from any action that mayendanger a shift back to past labour market arrangements that presumably areunconducive to sustainable growth. Moreover, Greece has been requested tofully implement an extensive set of comprehensive product market reformsincluded in the OECD competition Toolkits I and II, open up closed professions,enhance energy market competition, ease investment licensing processes andactivate large-scale privatisations, transferring valuable public-owned assets toan independent fund.28
Finally, to modernise public administration, the Greek government hascommitted to setting up a three-year action plan geared towards reinforcingand depoliticising administration structures. To this end, Greek authorities arerequired to rationalise wage bill in the public sector, connect pay with skills andefficiency, foster e-government and transparency and improve the proceduresrelating to the selection of managers and further promote employee mobility inthe public sector. On top of that, special provisions have been laid down forcombating corruption and dispensing justice, including the launch of a newframework concerning the funding of political parties, the insulation of the judi-cial system from political interference and pressures, speeding up justice andpromoting e-justice. Last but not least, the government is also obliged to takeaction to improve the credibility and statutory independence of ELSTAT andsupport the autonomy of independent bodies.29
There is no doubt that Greece suffers from low-quality public institutions, aswell as poor performing tax administration. In fact, according to the WorldEconomic Forum competitiveness report, the country ranks only 17th amongEMU member states in terms of government and public institutions efficiency(WEF, 2015-2016). At the same time, OECD data indicate that in 2013 the taxdebt-to-net revenue collection ratio has surpassed 130% (OECD, 2015b), whileVAT gap approached 28%, two times above the EU average (EC, 2016b).However, it is also true that any effort to upgrade public administration struc-tures and improve tax compliance vitally hinges on people’s living standardsand trust on public institutions. In this regard, austerity is clearly an ill-advisedway of achieving these goals. It is not only the deep recession that has suffo-
28. The monetisation of these assets is planned to be used for debt repayment purposes, forcovering part of the bank recapitalization cost and for financing investment projects in thecountry.
29. For further details and an updated version of the measures imposed by the third MoU along theabovementioned lines see the Supplemental Memorandum of Understanding (June 2016)available at: http://ec.europa.eu/info/sites/info/files/ecfin_smou_en.pdf

The Greek crisis: Outlook and an alternative economic policy 35
cated citizens’ tax-paying capacity and skyrocketed pessimism about Greece’seconomic prospects.30 It is also the erosion of core pillars of welfare state in theera of economic adjustment that had drag down confidence on publicsphere.31 In our opinion, modernising public administration and combating taxfraud and corruption presuppose a stable macro and social environment neces-sary to restore trust on public institutions and build social consent to the needof reform. Yet, this, first and foremost, calls for a pragmatic and viableprogramme for stimulating employment and economic growth.
Thus, bearing in mind the adverse socio-economic consequences of the twoprevious adjustment programmes, the third MoU leaves no room for optimismfor the country’s economic and social conditions in the near future. It is far fromevident that Greece needs to shift away from the creditors’ failed austerityexperiment and embark on a credible recovery strategy. The INE GSEE policyproposal is built upon three pillars that are fully compatible with the particularfeatures of the country’s growth model, putting employment creation at theepicentre of the effort to deliver economic, social and financial stability inGreece.32
Pillar 1: An alternative debt crisis management framework
Austerity has evidently failed to fulfil one of its chief stated goals: to restorepublic sector’s solvency and help the country regain access to private bondmarkets. Therefore, a fundamental change in the financing architecture ofGreece’s debt management strategy is urgently required. In our view, thepublic debt is sustainable when it can be served. For that reason, we propose anew financing architecture in line with the principle: ‘sustainable primarysurplus-sustainable debt’. Sustainable primary surplus is the one derived by thecountry’s growth performance and the underlying social conditions. It is not theone achieved by austerity, which is both futile and socially unfeasible. Hence, ata first stage, a new financing architecture is crucially needed that would set the
30. The Eurobarometer survey published in December 2016 shows that 97% of citizens in Greececonsider the economic situation as bad, while 64% and 61% of those questioned expect afurther deterioration of employment and economic conditions, respectively, in the next year(see Eurobarometer, 2016).
31. For instance, in the period 2009-2014 public expenditure (measured in terms of real per capitaeuros) on public health, education and social protection in Greece has plunged by 45.6%,16.3% and 15.1%, respectively (INE GSEE, 2017). Moreover, in 2014 the percentage of citizenshaving confidence in national government has declined by 19 percentage points relative to2007, standing at only 19% (against 42% in the OECD economies). See OECD (2015c).
32. For a more detailed presentation of the INE GSEE proposal see INE GSEE (2015).

iAGS 2017 — independent Annual Growth 5th Report36
annual interest payments at least equal to a lower, pre-specified sustainableprimary surplus target. If so, the public sector would stop accumulating newdebt, thereby increasing its credibility and solvency in capital markets in anenvironment conducive to social cohesion. In this context, debt-restructuringdoes not necessarily imply a ‘haircut’, but a new repayment schedule and muchlower average interest rates.
Pillar 2: Interventions for stimulating domestic demand
The Greek economy is a consumption-led growth economy (INE GSEE, 2015).This structural constraint should be taken into account in any policy aiming atdelivering macroeconomic stability in the short-term. At the same time, aninvestment-led productive transformation of the Greek economy is also essen-tial in order for Greece to be put on a sustainable growth track and address itslong-lasting competitiveness problems. In fact, empirical evidence indicatesthat stimulating productivity by means of increasing investment spending by9% per annum over the period 2010-2017 would have produced the samecompetiveness gains in terms of real effective exchange rate as the ones causedby cutting wages, without the recessionary effect of the latter option. Inparticular, the contribution of the investment spending stimulus to GDP wouldhave amounted to as much as 2% per year, leading the debt-to-GDP ratio todecline to 120% by 2016. It is also important to note that the net cost of theplan would have been 32.9 billion euros, thus being far less than the totalvolume of bail-out loans granted to Greece since 2010.33
Alternatively, a sizable amount of funds for financing this project might beprovided by the so-called ‘Juncker Plan’ and/or through the appropriate restruc-turing of EU funds, the expansion of EIB functions and the attraction of FDI. Inany case, this project should be designed so as to provide support to selectedsectors and activities that have strong multiplicative effects on actual and poten-tial output and in which Greece possesses significant comparative advantages,such as: (a) agriculture and food industry; (b) high-quality and sustainabletourism activities; (c) sustainable energy networks and green power infrastruc-ture; (d) high and medium-high technology manufacturing sectors (e.g. refinedpetroleum products, manufacture of chemicals and chemical products). 34
33. For further details about this proposal see Passas and Pierros (2017).34. On empirical evidence that suggest the importance of mobilising invest funds to certain
manufacturing sectors, see Argitis and Nikolaidi (2014b).

The Greek crisis: Outlook and an alternative economic policy 37
Nonetheless, given Greece’s consumption-led growth model, reviving realinvestment activity can be stamped with success only if it runs in parallel withmeasures geared to stimulating employment in the economy. In this respect,we propose the design and activation of a ‘Job Guarantee Programme’ (JGP) inGreece. The idea heavily draws on Hyman Minsky’s view on the function of thestate as an ‘Employer of Last Resort’ (ELR) and the imperative for it to act so intimes of crisis and soaring unemployment. 35 In our view, a policy interventionof this sort is of profound relevance to Greece, given the substantial contribu-tion it could make to re-establishing sound macroeconomic and financialconditions in the country. Recent empirical studies have justified the case forembarking on a JGP on the back of its strong positive (both direct and indirect)impact on employment and thereby on GDP growth, private sector balancesheets, tax revenues and ultimately on the public sector’s financial status.36 Thislatter effect provides the crucial linkage between the first and the second pillarsof our policy proposal and it is where employment creation becomes highlyimportant for resolving the debt crisis. To the extent that the primary surpluswould ensue from the growth-stimulating effects of the programme, such asurplus would become practically sustainable and could be used for coveringGreece’s annual interest payments.
Pillar 3: Re-regulating labour market
To expand employment and economic growth in Greece, it is also vital theimmediate abolition of the measures taken recently in the direction of greaterlabour market flexibility and the adoption of a new, socially inclusive reformagenda for reshaping labour market conditions. In this context, a range ofpolicy interventions that could serve this goal includes, inter alia, the full resto-ration of collective bargaining system, the unconditional application of allcollective bargaining agreements and the re-establishment of all legal provi-sions guiding the mediation and dispute settlement procedures in the pre-crisisperiod.
The abovementioned pillars incorporate the distinctive structural aspects of theGreek economy and are fully consistent with the complex institutional setting inwhich it is embedded. Thus, they deal a decisive blow to both the causes andeffects of the crisis and offer an immediate relief from the current unfortunateconditions, without putting Greece’s participation in EMU at stake.
35. See, for instance, Minsky (1986) and Papadimitriou and Minsky (1994).36. See Antonopoulos et al. (2014) and Ioannidis and Pierros (2015).

iAGS 2017 — independent Annual Growth 5th Report38
Simulations of INE-GSEE’s policy proposal
In order to evaluate the impact of our policy proposal on Greece’s solvencyprospects,37 we have opted for three different scenarios and calculated the scaleof a JGP required to build in 2020 a primary fiscal surplus equal to interestpayments. In our baseline scenario, we have estimated the size, as well as thegrowth and fiscal effect of a JGP needed to satisfy the solvency condition underthe present interest obligations of Greece. Scenarios 1 and 2 incorporate anadjustment of the interest payment schedule by 30% and 60%, respectively.38
Table 3 illustrates the results of our simulations under the aforementionedscenarios. In our baseline scenario, real GDP should grow by 2.4% in order forthe public sector to achieve a primary surplus of 3.5% of GDP necessary torestore its financial solvency in 2020. The cumulative size of the JGP needed tosatisfy the solvency condition amounts to 280,000 (direct and indirect) jobs,leading to a reduction of unemployment by 7.5%. Adjusting interest paymentsby 30% (scenario 1), the primary surplus target falls to 2.5%. To achieve it, therequired growth rate declines to 1.7% in 2020, while the size of the JGP suffi-cient to reach this rate lowers to 197,000 jobs, thus causing a 5.5% drop in
37. Note that according to our estimates, the achievement of a primary surplus of 3.5% of GDP in2018 would be insufficient to ensure a solvent fiscal regime and fulfil the country’s annualinterest obligations, thus paving the way for the introduction of additional austerity measures.
Table 3. Simulation results under different policy scenarios
Source: IMF (2016c), authors’ calculations.
38. In all simulations, we have assumed that public expenditure remains frozen until 2020 and thenit rises proportionally to real GDP growth. Moreover, government revenue increases with GDPat a constant rate equal to the 2016 effective tax rate (0.44%), while all other variables, such asinvestment and export, are assumed to remain constant.
Baseline scenario Scenario 1 Scenario 2
2.4% 1.7% 0.9%3.5% 2.5% 1.5%280,000 197,000 102,0005.5% 2.5%Real GDP growth in 2020 (%)Fiscal surplus in 2020 (% GDP)Cumulative size of the JGPReduction of unemployment by 2020 (% of labour force) 7.5%

The Greek crisis: Outlook and an alternative economic policy 39
unemployment. Finally, in scenario 2, which assumes a 60% interest adjust-ment, the primary surplus necessary to restore public sector solvency stands at1.5% of GDP. This target can be met by a real GDP growth rate of 0.9%attained through the creation of 102,000 new jobs. Under this scenario, theensuing decline in unemployment reaches 2.5%.39
It becomes clear that re-establishing the fiscal solvency of Greece involves acombination of employment (and/or investment)-driven growth and debtrestructuring that revises primary surplus targets. It is worth noting that theprecise way of achieving this restructuring is important, but not critical. Themost critical element is that any rearrangement of Greece’s financial obligationsshould be compatible with and responsive to the achievement of a sustainableprimary surplus. For this to happen, it is crucial to pave the way for the imme-diate transition of the Greek economy to an environment of faster economicgrowth and improved living standards.
References
Antonopoulos, R., Adam, S., Kim, K., Masterson, T., Papadimitriou, D. (2014),“Responding to the unemployment challenge: a Job Guarantee proposal for Greece“,The Levy Economics Institute/Observatory of Economic and Social Developments,Labour Institute, Greek General Confederation of Labour.
Argitis, G. (2012), Default and economic crisis: The failure and collapse of the Greek model ofcapitalism, Athens: Alexandria Publications (in Greek).
Argitis, G. and Nikolaidi, M. (2014a), “The financial fragility and the crisis of the Greekgovernment sector: A Minskian analysis“, International Review of Applied Economics,28(3): 273-291.
Argitis, G. and Nikolaidi, M. (2014b), “Economic crisis and productive reconstruction inGreece“, Observatory of Economic and Social Developments, Labour Institute, GreekGeneral Confederation of Labour, Studies/28 (in Greek).
Bank of Greece, Statistics: http://www.bankofgreece.gr/Pages/en/Statistics/default.aspx
Council implementing decision (EU) 2015/1411, Official Journal of the European Union,L219/12.
ELSTAT (2017): http://www.statistics.gr
Eurobarometer (2016), Standard Eurobarometer 86, autumn, European Commission,Brussels.
39. Undoubtedly, the fiscal and macro performance will be even better if the economy
simultaneously experiences a positive investment shock.
iAGS 2017 — independent Annual Growth 5th Report40
Eurogroup (2016), Eurogroup statement of Greece, Press release, Press office—GeneralSecretariat of the Council, Brussels, 5 December 2016.
European Commission (2017), Annual macro-economic database, AMECO database(February 2017): http://ec.europa.eu/economy_finance/db_indicators/ameco/index_en.htm
EC (2016a), Compliance Report: The third Economic Adjustment Programme for Greece. FirstReview, available at: http://ec.europa.eu/economy_finance/assistance_eu_ms/greek_loan_facility/pdf/cr_full_to_ewg_en.pdf
EC (2016b), Study and Reports on the Vat Gap in the EU-28 Member States: 2016 FinalReport, TAXUD/2015/CC/131.
Eurostat (2017), Search Database, European Commission:http://ec.europa.eu/eurostat/data/database
ETUI (2016), Benchmarking Working Europe 2016, Brussels.
Gechert, S. and Rannenberg, S. (2015), “The cost of Greece’s fiscal consolidation“, PolicyBrief, Macroeconomic Policy Institute, Hans-Böckler-Stiftung, Düsseldorf.
Giannitsis, T. And Zografakis, S. (2015), “Greece: Solidarity and adjustment in times ofcrisis“, Study No. 38, Macroeconomic Policy Istitute, Hans-Böckler-Stiftung,Düsseldorf.
iAGS (2017), Independent annual growth survey, Fifth report, November 2016.
IMF (2016a), “Preliminary debt sustainability analysis-updated estimates and furtherconsiderations“, Washington, DC: IMF, May.
IMF (2016b), “Greece: Staff concluding statement of the 2016 Article IV mission“, Wash-ington, DC: IMF, September.
IMF (2016c), World Economic Outlook, October 2016:http://www.imf.org/external/pubs/ft/weo/2016/02/weodata/index.aspx
INE GSEE (2015), Report on the Greek economy and employment in 2015, Labour Institute,Athens: Greek General Confederation of Labour (in Greek).
INE GSEE (2016a), Report on the Greek economy and employment in 2016, Labour Institute,Athens: Greek General Confederation of Labour, March (in Greek).
INE GSEE (2016b), Interim report on the Greek economy and employment in 2016, LabourInstitute, Athens: Greek General Confederation of Labour, October (in Greek).
INE GSEE (2017), Report on the Greek economy and employment in 2017, Labour Institute,Athens: Greek General Confederation of Labour, March (in Greek).
Ioannidis, G. and Pierros, Ch. (2015), “Overcoming the employment crisis: A proposal forreducing the unemployment rate by ten percent within three years“, Observatory ofEconomic and Social Developments, Labour Institute, Greek General Confederation ofLabour, Policy Studies/32 (in Greek).
Karamessini, M. (2015), “Greece as an international test-case: Economic adjustmentthrough a Troika/state-induced depression and social catastrophe“, in Lehndorff,S. (ed.), Divisive Integration. The Triumph of Failed Ideas in Europe-Revisited, Brussels:
ETUI.
The Greek crisis: Outlook and an alternative economic policy 41
Kregel, J. (2011), “Debtor’s crisis or creditors’ crisis? Who pays for the European sovereignand subprime mortgage losses?“, Public Policy Brief 121, Levy Economics Institute ofBard College, Annandale-on-Hudson, NY.
Kregel, J. (2015), “Europe at crossroads: Financial fragility and the survival of the singlecurrency“, Policy Note 1, Levy Economics Institute of Bard College, Annandale-on-Hudson, NY.
Michopoulou, S. (2014), “Debt crisis, fiscal austerity and economic crisis in the Euro-zone“, Observatory of Economic and Social Developments, Labour Institute, GreekGeneral Confederation of Labour, Studies/30 (in Greek).
Minsky, H. (1986), Stabilizing and unstable economy, New Haven: Yale University Press.
OECD (2015a), In It Together: Why Less Inequality Benefits All, OECD Publishing, Paris.
OECD (2015b), Tax Administration 2015: Comparative information on OECD and otheradvanced and emerging economies, OECD Publishing, Paris, database available at:http://www.oecd.org/tax/forum-on-tax-administration/database/
OECD (2015c), Government at a Glance 2015, OECD Publishing, Paris.
OECD (2017), OECD.Stat: http://stats.oecd.org/
Onaran, O. and Obst, T. (2016), “Wage-led growth in the EU 15 member states: Theeffects of income distribution on growth, investment, trade balance, and inflation“,Working Paper 1602, Post Keynesian Economics Study Group.
Papadimitriou, D. and Minsky, H. (1994), “Why not give full employment a chance?“,Hyman P. Minsky Archive, Levy Economics Institute of Bard College, Paper 173.
Passas C. and Pierros Ch. (2017), “The failure of internal devaluation and the case of aninvestment-led strategy to foster competitiveness in Greece“, Observatory ofEconomic and Social Developments, Labour Institute, Greek General Confederation ofLabour, forthcoming.
Schulten, T. (2015), “Opportunities for a restoration? The future of Greek collectivebargaining after the third Memorandum“, Friedrich Ebert Stiftung, Perspective,September.
Theodoropoulou, S. (2014), “Has the EU become more intrusive in shaping nationalwelfare state reforms? Evidence from Greece and Portugal“, European Trade UnionInstitute, Working Paper 2014.04.
Theodoropoulou, S. (2016), “Severe pain, very little gain: internal devaluation and risingunemployment in Greece“, in M. Mayant, S. Theodoropoulou and A. Piasna (eds),Unemployment, internal devaluation and labour market deregulation in Europe, ETUI,Brussels.
WEF (2015-2016), World Economic Forum, Competitiveness data base, available at: http://reports.weforum.org/global-competitiveness-report-2015-2016/

APPENDIX
An analysis of Greece’s debt sustainability
In this annex, we try to assess whether Greece's public debt stock is still a causefor concern—implying that some form of assistance or restructuring would beneeded—or if it can be considered as sustainable.
Three scenarios will be considered: the first one corresponds to our assessmentof the situation as of today, without no further assistance or debt relief; thesecond one corresponds to the implementation of the short-term and medium-term debt relief measures contained in the Eurogroup statement of 5 May2016; and the third scenario corresponds to a possible solution for making thedebt sustainable at virtually no financial cost for member states.
Level, composition and characteristics of the debt stock
By the end of 2016, the gross public debt of Greece, in the sense of Maastricht,amounted to 315 €bn, that is 179.7% of GDP. Even though in face value termsthis represents a significant decrease from the maximum reached in 2011(356 €bn), the picture is different when looking at the ratio to GDP: it has beenon an upward trend, despite the 2012 restructuring, because of the dramaticfall of nominal GDP.
Figure A1 shows the share held by each creditor category in the total debtstock. Following the 2012 restructuring, official creditors now hold about threequarters of this debt stock; in particular, the EFSF and the ESM together holdmore than half of the debt.
Figure A1. Creditor composition of the debt stock
Sources: Greece’s PDMA, Thomson Reuters Eikon, IMF, ESM, European Commission.
ECB and NCBs
EFSF
ESM
Eurozone governments
IMF
Private investors
Other/unknown
* Written by Sébastien Villemot.

The Greek crisis: Outlook and an alternative economic policy 43
Figure A2 shows the repayment profile of the debt principal, by creditor category(excluding short-term debt). In the short run, most repayments go to theEurosystem (mostly corresponding to bonds purchased through the SecuritiesMarket Programme that were exempted from the 2012 restructuring), to theIMF, and to private creditors (medium-term bonds issued in 2014). In the years2020-2040, the bulk of repayments concern bilateral loans from Eurozonegovernments (through the Government Loan Facility, GLF henceforth), EFSFloans and private investors (new bonds emitted during the 2012 restructuring).The ESM loans are those with the longest horizon, the last one maturing in 2059.
The fact that the bulk of the debt consists in very long-term loans (EFSF, ESM,GLF) does not however mean that Greece is protected from interest rate risk.Indeed, all these loans are serviced at a variable interest rate (indexed on theEURIBOR for the GLF, and at financing cost for EFSF and ESM). The perspectiveof the normalization of monetary policy in the Euro area is therefore a criticalissue that could substantially impact Greece's debt sustainability; we return tothis dimension below.
Figure A2. Debt principal repayment schedule, by creditorexcluding short-term debt
€ bn
Sources: Greece’s PDMA, Thomson Reuters Eikon, IMF, ESM, European Commission.
2017 2019 2021 2023 2025 2027 2029 2031 2033 2035 2037 2039 2041 2043 2045 2047 2049 2051 2053 2055 2057 20590
2
4
6
8
10
12
14
ECB and NCBs EFSF EIB ESM Eurozone governments IMF Private investors

iAGS 2017 — independent Annual Growth 5th Report44
Common hypotheses
A number of hypotheses are common to our 3 scenarios:
Principal and interest repayments. In addition to the repayment schedulefor official loans, we have constructed a detailed database of outstandingbond issues (including hold-outs from 2012), taking into account the specif-icities of some securities (inflation-linked bonds, GDP-linked securities,variable-rate coupons). Our data source is Thomson Reuters Eikon.
Potential growth. For 2017 and 2018, we use the European Commissionprojections of -0.5% and -0.2% respectively; for subsequent years (until2059), we use the estimates from the 2015 Ageing Report, that forecasts agradual increase up to 2% in 2035, then an abrupt decline towards 1%per year.
Real growth. It is the sum of the potential growth, the automatic closing ofthe output gap (based on the European Commission estimate of -9.8% in2016, and with an automatic closing speed of 15% per year) and the effectof fiscal impulses (with a short-run multiplier varying between 0 and 1.5—depending of the sign and size of the output gap— and a long-run multi-plier of zero)
Inflation. It is assumed to return to the long-run ECB target of 2%, followinga dynamic Phillips curve (with an output-gap elasticity of 0.5)
Fiscal policy. We consider that maintaining a primary surplus of 3.5% ofGDP over several decades, as assumed by the European Commission's debtsustainability analysis, is not realistic. We rather assume a long-run primarysurplus of 1.5%, which is more realistic given historical records and the polit-ical instability that a larger surplus could engender. However, in the shortrun, a bigger surplus is generated as the output gap closes, before graduallyfading away and converging towards the long-run value
Privatization proceeds. Given the past poor records, we don't believe in theobjective of 50 €bn cumulated expected proceeds. We rather assume thatthe rate of 3 €bn cumulated that has been observed over the years 2010-2014 is maintained, corresponding to about 0.3% GDP each year.
Risk-free interest rates. We rely on market futures until 2026, which fore-cast an increase to 1.7% by that date; then we assume that interest ratesgradually converge towards an equilibrium value of 3.8% (which is the sumof the long-run growth forecast for the Euro area of 1.5%, plus the ECBtarget of 2%, and a premium over the sum of the two).
1
2
3
4
5
6
7

The Greek crisis: Outlook and an alternative economic policy 45
Market interest rates for sovereign bonds. We assume that the premiumover risk-free rates is equal to 3.3 basis points for each point of the debt-to-GDP ratio over 60%. This is a conservative estimate, that was obtained usingdata for all the Euro area members except Greece (given the limited liquidityof Greece's bond).
Refinancing maturity. The average maturity of new marketable bondsissued by Greece is assumed to be 7 years.
a) Baseline scenario
In this scenario we analyze the likely path for Greece's public debt under thehypothesis that there is no new financial assistance programme after the currentone (Greece returns back to the markets in 2019) and that no more debt reliefmeasures are implemented. In particular, this means that among the short-termdebt relief measures discussed at the May 2016 Eurogroup, the only one whichis included in this scenario is the 2017 waiver for the step-up interest ratemargin on the loan for the 2012 debt buy-back; the other measures having notyet been implemented, they are not considered in this scenario.
Given our hypothesis on risk premia, the interest rate at which Greece returns tothe markets in 2019 is 4%, which is a quite optimistic hypothesis; this rate thenincreases first because of the normalization of monetary policy, then because ofthe snowball effect on the debt stock.
The official rates at which the ESM and EFSF lend are computed assuming thatthey continue financing themselves at risk-free rates, with an average maturityof 5 years as they currently do.
Figure A3 shows the path for the debt-to-GDP ratio under this scenario. It ishighly explosive: after a decrease under 150% of GDP in the mid 2030s, theratio starts to increase again because of the rise of the apparent interest rate(both because market rates increase, and because the share of official loansdecreases).
Figure A4 pictures the trajectory of the primary surplus under this scenario: itfirst increases and reaches a peak at 2.9% in 2023, then decreases to 1.5% in2031 and stabilizes there.
Another way of presenting this scenario consists in computing the long-runprimary surplus that would be consistent with a stabilization of the debt-to-GDPratio, all other hypotheses kept unchanged. In this case, the computation gives
8
9

iAGS 2017 — independent Annual Growth 5th Report46
a primary surplus of 3.1% (to be maintained forever) in order to stabilize thedebt at 119% of GDP. Such a long-run surplus is highly unrealistic however.
Figure A3. Baseline scenario, debt/GDP ratio
In %
Source: authors’ calculations.
Figure A4. Baseline scenario, primary surplus In %
Source: authors’ calculations.
2012 2016 2020 2024 2028 2032 2036 2040 2044 2048 2052 205650
100
150
200
250
300
2012 2015 2018 2021 2024 2027 2030 2033 2036 2039 2042 2045 2048 2051 2054 2057-10
-8
-6
-4
-2
0
2
4

The Greek crisis: Outlook and an alternative economic policy 47
This analysis shows that under this scenario the debt is highly unsustainable:under a reasonable primary surplus hypothesis, the debt stock enters into asnowball dynamics. This justifies that some debt relief measures be taken.
b) Limited debt relief scenario
Indeed, some debt relief measures have been discussed at the May 2016 Euro-group, and this second scenario analyzes them. They comprise short-termmeasures (i.e. to be implemented before the end of the ESM programme) andmedium-term measures (i.e. to be implemented at the end of the programme),which can be summarized as follows:
— changing the financing strategy of the EFSF and ESM in order to lock-inas much as possible the current low interest rates (given the expectedincrease due to the normalization of the monetary conditions); and addi-tionally implementing a partial repurchase of the GLF loans by the ESM inorder to lower interest rates;
— reprofiling the EFSF and GLF loans in order to increase the average matu-rity and to smooth the repayment profile;
— abolishing the step-up interest rate margin on the loan for the 2012 debtbuy-back;
— restoring the transfer of SMP and ANFA profits to the Greek government.
Given that these measures have not yet been implemented, we need to makehypotheses for the first two of them.
Concerning the official interest rates, we make the hypothesis that the EFSF andESM increase their average borrowing maturity from 5 years to 15 years,starting from 2017. This has the consequence of delaying the transmission ofthe risk-free short-term rates increases to Greece. We also assume that the GLFloans will now bear the same interest rate as the ESM ones (instead of a 50basis points premium over the 3-month EURIBOR), i.e. we are implicitlyassuming that these loans are repurchased by the ESM (therefore at no cost formember states).
Concerning the reprofiling of the EFSF and GLF loans, we make the hypothesisthat their maturity is increased up to 2059, and that their repayment profile issmoothed (without a nominal haircut). Figure A5 gives the new principal repay-ment schedule hypothesis.

iAGS 2017 — independent Annual Growth 5th Report48
Figure A6 pictures the path for the debt-to-GDP ratio under this scenario. Asone can see, the improvement is notable compared to the baseline scenario,but is still insufficient to make the debt burden sustainable.
Again, looking differently at this scenario, the long-run primary surplus requiredto stabilize the debt-to-GDP ratio (at 110%) is of 2.5% of GDP, which is stillvery high.
The conclusion of this exercise is that, even if all the promised debt relief meas-ures are implemented by the end of the ESM programme, it is not realistic toexpect Greece to go back to the markets and repay its debts over the long run.Said otherwise, an orderly completion of the programme and the planned debtrelief measures are not sufficient to guarantee the membership of Greece withinthe Euro area. Further action needs to be taken.
c) A possible solution for ensuring debt sustainability
This third scenario is based on the previous one, but adds a critical change: wenow assume that Greece does not return to markets in 2019, but remains underfinancial assistance from the ESM, rolling over its debt by contracting new offi-cial loans. This process is assumed to last until 2050, after which Greece returnsto financial markets.
Figure A5. Repayment schedule under limited debt relief scenario
€ bn
Source: authors’ calculations.2017 2019 2021 2023 2025 2027 2029 2031 2033 2035 2037 2039 2041 2043 2045 2047 2049 2051 2053 2055 2057 2059
0
2
4
6
8
10
12
14ECB and NCBs EFSF EIB ESM Eurozone governments IMF Private investors

The Greek crisis: Outlook and an alternative economic policy 49
Figure A7 plots the path of the debt-to-GDP ratio under this scenario. One cansee that the debt stabilizes slightly below 100% of GDP at the end of the fore-casting horizon: this is still significantly higher than the 60% target of theStability and Growth Pact, but at least it would permit Greece to finance itself atreasonably low market interest rates.
It is interesting to note that this scenario comes at no cost for the other euro-zone members. The improvement of Greece's situation under this scenariocomes from the fact that it does not face the risk premium associated to its highdebt burden. Said otherwise, this scenario is equivalent to a form of debt mutu-alization, under which Greece's debt is transformed (until 2050) into a risk-freedebt guaranteed by the other member states. And this comes at no cost forthese states, at least under the hypothesis that Greece does not default, which isa reasonable to expect given the sustainability of the debt burden.
Of course, even though the scenario that we describe is realistic from a purelyeconomic perspective, one could still wonder whether it is from a politicalperspective. The major issue here being that Greece could consider that beingunder programme until 2050 is an unbearable loss of sovereignty, while thecreditors could be reluctant to give a debt guarantee of such an amount forsuch a long time. In particular, this means that, if this solution is to become real-istic, the management of the programme should be different from the one wehave observed so far: Greece's sovereignty should be respected, imposed
Figure A6. Limited relief scenario, debt-to-GDP ratio
In %
Source: authors’ calculations.
2012 2015 2018 2021 2024 2027 2030 2033 2036 2039 2042 2045 2048 2051 2054 205750
100
150
200
250
300

iAGS 2017 — independent Annual Growth 5th Report50
austerity should be avoided as much as possible so that Greece can recover asfast as possible from its deep recession. It also means that, in creditor countries,the institutions and political representatives should communicate on the hugeefforts already undertaken by the Greek people, and on the fact that the newarrangement comes at no cost for taxpayers.
Of course, there are many other ways to design a sustainable scenario. An alter-native one could be to increase maturities even further, or to lend at moreconcessional terms (however implying a loss to creditors in net present valueterms, even if not in face value terms).
Whatever the solution chosen, our analysis shows that there exists an economicsolution that could make Greece's debt sustainable and secure its euro member-ship. Whether there is the political will to do so still remains to be seen.
Figure A7. Sustainable scenario, debt-to-GDP ratio
In %
Source: authors’ calculations.
2012 2015 2018 2021 2024 2027 2030 2033 2036 2039 2042 2045 2048 2051 2054 205750
100
150
200
250
300

Chapter 7
GERMANY IN THE POSITION OF LEADER
OFCE-IMK
Given the size of its economy, Germany has always played a leading role in theconstruction of Europe. The country’s recent economic performance hasbolstered its position so much that Germany is now the undisputed leader of theeuro zone, giving it additional influence on Europe’s political scene, in particularrelative to France and Italy, the second and third largest economies. The analysisby the German government of the crisis in the euro area and with respect toboth the current and future state of European governance is clearly decisive.
Germany's economic success story is based on three elements. First, Germany isin a situation of almost full employment, even though the global economy hasexperienced the deepest recession since the 1930s. After the sharp blow toGermany’s economy in 2009, it quickly recovered to match and then surpass itspre-crisis state. Second, Germany has been spared the sovereign debt crisis.German bonds have benefited from their status as risk-free assets, with interestrates falling so much that they are now negative on maturities up to sevenyears. Finally, since 2001, Germany has accumulated current account surpluses,reflecting its industrial and export strength and relatively subdued importgrowth. The recent acceleration of wages has not had any impact on thecurrent account up to now.
Under the apparent success, however, Germany faces a number of structuralchallenges. These include demography, low public and private investment andsluggish productivity growth, inequality and qualitative labour market issues,and the vulnerability that comes with a large export surplus. Finally the issue ofhow German adjustment can be rendered compatible with that in the Euro Areaas a whole needs to be resolved. Ultimately Germany cannot prosper if itsneighbours remain mired in economic difficulties. It can neither unilaterallyimpose its strategy nor can it generate recovery on its own. We address theseissues in turn in this chapter.
iAGS 2017 — independent Annual Growth Survey 5th Report (Special studies on Greece and Germany)

iAGS 2017 — independent Annual Growth 5th Report52
7.1. Why / in what way has Germany been doing better than its euro area partners since 2007?
The collapse in global trade that accompanied the beginning of the GreatRecession in 2008-2009 engendered fears of a long-term downturn in Germangrowth and a rise in unemployment (Blot & Kooths, 2010). The fall in GDP wasin fact more marked in Germany than in the rest of the euro area (-5.6% in2009, compared to -4.6%), due mainly to the negative impact of foreign trade(-2.6 points against -1.3 for domestic demand). So although the acceleration ofGermany’s growth between 2004 and 2007 had been based on its dynamicexport industries, the growing share of exports in GDP (up from 23% in 1996to 43% in 2007) seemed at first to be its Achilles’ heel.
But this soon changed. On the one hand, the rebound in world trade starting in2010 boosted Germany’s recovery through the channel of foreign trade. On theother hand, growth gradually became more balanced due to domesticdemand, which strengthened after the crisis (Table 1). Germany’s growthpicked up sharply in 2010 and 2011, and it remained a locomotive for the euroarea, with GDP per capita rising faster than in the other countries (Figure 1).Furthermore, unemployment barely budged and then came down, and at theend of 2016, in November, stood at 4.1%, according to Eurostat, the lowestlevel of any euro area country. By cutting its budget deficit to below 3% of GDPin 2011 and then balancing the budget the next year, Germany was able to exitthe excessive deficit procedure relatively quickly. Finally, Germany continued toset records for its current account surplus, which was over 266 billion euros in2016, i.e. 8.5% of GDP.
Table 1. Factors contributing to German growth
Internal demand
Consump-tion
Investment External trade
Inventories GDP growth
2000-2007 0.7 0.6 0.1 0.9 0.0 1.6
2008-2009 -1.0 0.8 -0.9 -1.3 -0.9 -2.4
2010-2015 1.4 0.9 0.5 0.6 0.0 2.0
Source: Eurostat.

Germany in the position of leader 53
a) The German labour market during the crisis
Despite the worst recession since World War 2, Germany’s unemployment rateincreased only slightly, by 0.7 percentage point, at the beginning of 2009. Forthe euro area as a whole, the level rose by two points between the first quarterof 2008 and the second quarter of 2010. Furthermore, while higher unemploy-ment persisted in most of the other euro area countries, in Germany the ratebegan to fall in the third quarter of 2009 (Figure 2). Between the first quarter of2007 and the end of 2016, unemployment fell by almost 5.1 percentage pointsin Germany, whereas it rose by 1 point in the Netherlands, 1.2 points in France,5.2 points in Italy and 11 points in Spain. This contrast in the unemploymentrate is undoubtedly linked to Germany's better performance in terms of growthbut it also reflects population dynamics as well as the job-rich character ofGerman growth.
Around the years the crisis hit, Germany’s unemployment rate had benefitedfrom slower growth in its labour force, particularly relative to other Europeancountries, such as France, Spain and the United Kingdom. Between 2007 and2010, its labour force grew by only 0.1% on average per year. The working-agepopulation was declining over this period, but the labour force expanded dueto an increase in the participation rate (of women and seniors). The labour forcehas been growing faster since 2011, with an annual growth rate from 2011 of0.5%, and even reaching 0.7% in 2016.
Figure 1. Change in GDP per capita In euros
Source: Eurostat.
20000
22000
24000
26000
28000
30000
32000
34000
36000
1999 2000 2001 2002 2003 2004 2005 2006 2007 2008 2009 2010 2011 2012 2013 2014 2015
DEU
FRA
Euro area excluding DEU and FRA

iAGS 2017 — independent Annual Growth 5th Report54
The labour force participation rate is continuing to rise, but immigration haspushed up the working-age population once more (+ 0.5% between 2011 and2015). After restrictions on the free movement of workers from the new EUMember States came to an end (mainly Poland, Romania and Hungary), theleading source of immigration has been Eastern Europe, followed by the coun-tries in the crisis-ridden south of Europe, and then finally the Balkans and morerecently countries torn by war (Syria, Iraq and Afghanistan). In this recentperiod Germany has needed to create more jobs than before in order to absorbthis increase in the labour force while continuing to hold down its unemploy-ment rate.
In addition to the impact of labour force trends, the reduction in the unemploy-ment rate is greater when, for a given rate of economic growth, productivitygrowth is low. During the crisis period, in Germany an active strategy of safe-guarding employment supported by the social partners and the governmentwas part of the policy response. As a consequence, German business hoardedlabour by resorting to several measures of working-time flexibility to tempo-rarily reduce working hours like short-time work, a policy that was alsosupported by government subsidies, working time accounts and temporaryreductions in collectively agreed working hours. There was therefore no net jobdestruction during the heart of the Great Recession. As a result, per capitaproductivity fell sharply, by almost 6% in 2009 and on average by 0.04 % per
Figure 2. Changes in the unemployment rate in selected euro area countries
In points
Source: Eurostat.
-10
-5
0
5
10
15
20
2007 2008 2009 2010 2011 2012 2013 2014 2015 2016
DEU
FRA
ITA
ESP
NLD

Germany in the position of leader 55
annum between 2007 and 2011. So the slight pick-up in employment from2011 (+0.8% on average between 2007 and 2011) was enough to bring downthe unemployment rate. In the more recent period (2012-2016), per capitaproductivity rose by 0.58 % per year on average, accelerating since 2014growing by 0.8 % in 2014 and 2015 and by 0.9 % in 2016.
Over the period 2007-2016 as a whole, economic growth has been more job-rich compared to the previous decade since per capita productivity grew by anannual average of 0.2%. As for the labour force, it increased only a little fasterover the period 2007-2016 (0.4%) than from 2000 to 2007 (0.3%). Theaverage increase of 0.8% in employment between 2007 and 2016 was there-fore sufficient to lead to a rapid reduction in the unemployment rate.
On the other hand, in the most recent period, with productivity growing at0.8% and the labour force up by 0.7%, growth needed to hit at least 1.5% inorder to continue to push down the unemployment rate. This was achieved in2016, when the rate was 1.9%. But this remains an important challenge in thecurrent period when substantial numbers of immigrants must be integratedinto the labour market.
b) The public finances: Respect for the rules?
Like many European countries, Germany's public deficit deteriorated rapidlyduring the crisis. Germany started with a budgetary surplus of 0.2 GDP point in2007, but three years later ran a deficit of 4.2%, and so found itself, like manyother European countries, with an excessive deficit according to the EU’s fiscalrules.1 Due to the automatic stabilizers, the recession reduced tax revenues andpushed up public and social expenditure. Additional measures to boost theeconomy as well as plans to support the financial sector led to a further wors-ening of the public accounts. However, the deficit was subsequently quickly cutand then a surplus of 0.3% generated in 2014, at a time when France’s deficitstill exceeded the 3% threshold (Figure 3). After peaking at 81% in 2010,Germany’s government debt also began to decline, by almost 10 points in allby 2015.
1. Under the Stability and Growth Pact, a country is considered to have an excessive deficit whenthe budget deficit exceeds 3% and when this situation is not justified by exceptionalcircumstances. A decision to put the country on notice is taken by the European Council at therecommendation of the European Commission.

iAGS 2017 — independent Annual Growth 5th Report56
This improvement has enabled Germany to meet the requirements of theStability and Growth Pact as well as those of the new “debt brake“ in thecountry’s Constitution.2 This rule requires the federal government to ensurethat the structural deficit does not exceed 0.35% of GDP.3 The law, passed in2009, provides for a transition period with intermediate targets starting in2011, and with the 0.35% target to be met from 2016. In so far as it is thestructural deficit that is the constraint, the annual indebtedness can varyaccording to the country's position in the cycle; however, the use of statisticalfilters as the estimation tool suggests a significant cyclical element and thus astrong risk of inducing pro-cyclical fiscal policy (Truger and Will 2013). Finally,the law also introduces a clause that allows exceptional circumstances to betaken into account. This “debt brake“ rule introduced by the German govern-ment is in line with the Fiscal Compact,4 which requires EU Member States toenact national legislation requiring a balanced budget—limiting the structuraldeficit to 0.5% of GDP5—as well as correction mechanisms in case the target isnot met.
Figure 3. Government balance 2007-2015% of GDP
Source: Eurostat.
2. See Truger and Will (2013) for a critical overview of the debate on the debt brake and Paetz,Rietzler and Truger (2016) for a recent analysis.
3. The limit is set at 0% for the Länder from 2020 onwards.4. Fiscal chapter of the TSCG adopted in 2012 and ratified by 25 Member States.5. This limit is lifted to 1% for countries with a debt of less than 60%.
-8
-7
-6
-5
-4
-3
-2
-1
0
1
2
2007 2008 2009 2010 2011 2012 2013 2014 2015
DEUFRAEA (excluding DEU and FRA)

Germany in the position of leader 57
Between 2011 and 2016, the German federal government more than respectedits commitments, as the annual debt was consistently lower than the interme-diate targets. While the rapid improvement in the federal government's fiscalposition does coincide with the adoption of this compulsory rule, Paetz, Rietzlerand Truger (2016) show that the reduction in Germany’s deficit was due mainlyto favourable circumstances. A breakdown of the budgetary balance using thefollowing relationship sheds light on this point:
NLG(t) = Interest payment (t) + Cyclical balance (t) + Primary structural balance (t)+ one-offs (t)
Between 2010 and 2016, Germany’s fiscal position improved by 4.5 points(Table 2). How much of this was the result of decisions taken by the governmentto improve the public finances? According to the OECD’s estimate of the outputgap, which indicates the improvement or deterioration in the deficit due to thecycle, discretionary measures contributed 1.2 percentage points to the deficitreduction. This contribution is close to that of the cyclical balance (+1.1 point).The fall in the interest rate is another important factor in the reduction inGermany’s deficit. In effect, the debt service burden was cut by 1.1 percentagepoints of GDP, with the nominal rate on the debt also falling by 1.1 percentagepoints. Finally, exceptional measures have also contributed to deficit reduction,in line with the deterioration observed between 2007 and 2010.
Thus by the end of 2016, the government balance was once again at its 2007level, i.e. in surplus, suggesting that the improvement in the balance between2010 and 2016 (4.4 points) offset the deterioration experienced during therecession. It should be noted, however, that a breakdown of the deterioration inthe balance between 2007 and 2010 shows a somewhat different picture, with
Table 2. German fiscal policy from 2003 to 2016
Gdp points
Cumulated change 2003-2007 2007-2010 2010-2016* 2007-2016*
Net government lending 4.4 -4.4 4.5 0.1
Interest paymentΔ nominal rate
0.2-0.3
0.2-1.1
1.1-1.1
1.4-2.3
Cyclical balance 1.9 -2.0 1.1 -1.0
Primary structural balance 1.7 -1.6 1.2 -0.4
One-off measures 0.6 -1.1 1.1 0.1
* The figures for 2016 correspond to an OECD forecast.Source: OECD, Economic Outlook n° 99.

iAGS 2017 — independent Annual Growth 5th Report58
a 2-point increase in the deficit due to lower growth and to discretionary meas-ures, which accounted for 1.6 points. The exceptional measures (in particularsupport for the financial system) came to 1.1 points, as indicated above. Thedebt service burden played a positive role, falling by 0.2 point between 2007and 2010.
It is clear, therefore, that, looking at the crisis as a whole, Germany managed tomaster its budget deficit despite the sharp deterioration during the worst partof the crisis. Fiscal policy played a counter-cyclical role during this period, withan expansionary fiscal policy during the recession and a policy of fiscal consoli-dation once growth picked up. However, this consolidation phase was muchless pronounced than in the other euro area countries. For example, in Francean estimate based on OECD data for consolidation measures indicates that theprimary structural balance improved by 2.8 points between 2009 and 2016.6
Furthermore, Paetz et al. (2016) suggest from counterfactual simulations that ifGermany's performance in terms of growth had been less favourable, the debtbrake rule would have forced the government to take pro-cyclical measures thatwould in turn have undermined growth. In fact, fiscal consolidation in Germanywas essentially carried out prior to the crisis: there was an improvement in theprimary structural balance of 1.7 points, which made it possible to once againgenerate a fiscal surplus in 2007, whereas the deficit was 4.2% in 2004. But themacroeconomic situation, in particular the international environment, wascompletely different in the 2004-2007 period compared to the 2010-2016period. The average annual growth rate in the euro area (excluding Germany)was 2.7% between 2004 and 2007, compared to 0.6% between 2010 and2015. Germany therefore carried out the bulk of its fiscal adjustment in afavourable climate, which helped to mitigate the cost to the country in terms oflost output. In contrast, the synchronization of tight fiscal policies in the euroarea from 2010 onwards generally contributed to amplifying their negativeimpact on the area’s growth.7
One important lesson can be drawn from this analysis of the evolution ofGermany’s budget balance:
6. The choice of 2009 rather than 2010 for France is due to the fact that the figure for the deficitwas observed in 2009 in France and in 2010 in Germany. In addition, according to the OECDthe period of German fiscal consolidation was shorter. If we look only at fiscal consolidationmeasures, these come to 1.8 points in Germany between 2011 and 2014 and 3.2 points inFrance between 2011 and 2016.
7. See IMF (2010) and the iAGS 2013 report.

Germany in the position of leader 59
Fiscal consolidation is most successful in a favourable environment. An impor-tant factor is labour market performance. With rapid employment and wagegrowth tax revenues and social security contributions increase sharply whilespending on unemployment is reduced quasi automatically. The Germanexample is in sharp contrast with the developments in the European crisis coun-tries, where wage cuts and falling employment made budget consolidationalmost impossible.
In addition Germany benefitted from falling interest rates intensified by thecountry’s function as a “safe haven” in the euro crisis.
c) Current account: A country with excess savings
The large and growing trade surplus is often considered to be a sign of theGerman economy’s good health. The balance of goods and services reached243 billion euros in 2016 (7.8% of GDP), making a significant contribution tothe current account surplus (266 billion, or 5.5% of GDP). These recordsurpluses contrast with the current account deficits recorded by Germany afterreunification and up until 2001, and they are widely seen as bearing witness toGermany's renewed status as an industrial and export “hyperpower”. Changesin the real effective exchange rate since 1999 show that Germany has gained incost-competitiveness relative to its European partners, and it proved its resil-ience in the 2000s when the euro appreciated on the foreign exchange market(Figure 4). Germany actually gained export market share during the 2000s.These trade performances not only stem from an improvement of the cost-competitiveness of Germany relative to trade—and notably other euro areamembers—partners but it also results from an advantage in terms of non-costcompetitiveness, which evokes the idea of high-quality production and thebenefit of a good image, enabling its companies to hold their demand captive.8
However, price competitiveness mostly applies to exports only while the currentaccount is the balance between exports and imports. Many authors find thatthe development of exports did not account for most of the difference incurrent accounts but that the main difference were developments in imports.9
Crisis countries like Greece and Ireland had even higher percentage increases intheir nominal exports between 1999 and 2007 than Germany (Horn and
8. See ECB (2012) for an analysis at the euro area level and Le Moigne and Ragot (2015) for ananalysis of the France’s bilateral external trade deficit relative to Germany.
9. See for instance European Commission (2010), Feigl and Zuckerstätter (2012), Gaulier andVicard (2012), Wyplosz (2013) and Horn and Lindner (2016).

iAGS 2017 — independent Annual Growth 5th Report60
Lindner 2016). What led to the current account surplus in Germany were lowimports due to a weak internal demand. In the 2000s, labor market reform andausterity depressed domestic demand and thereby import demand. In manycrisis countries credit financed real estate bubbles drove domestic demand andthus imports, thereby leading to current account imbalances.
Thus, a working group on the competitiveness within in the European Systemof Central Banks finds that: “From the start of the euro until the crisis, exportgrowth adjusted for geographical and sector specific effects was only weaklycorrelated with changes in the current account or deviations in ULCs. Thissuggests that the negative correlation between the two latter variables waspartly driven by common shocks rather than current account imbalancesresulting from heterogeneous cost competitiveness. The data are consistentwith demand shocks in peripheral euro area countries moving resources fromthe traded sector to the non-traded sector, with price and wage increasesconcentrated in the nontraded sector.”
Between 1999 and 2007, Germany’s current account went from a deficit of1.4% of GDP to a surplus of 6.8% mainly due to an improvement of nearly6 percentage points in the balance of trade in goods and services (Table 3). By2016, the trade surplus was 7,8%. The bulk of the improvement was actually
Figure 4. Cost-competitiveness of four euro area countries
1999 = 100
Source: IMF. Indicators of real effective exchange rates weighted by unit labour costs.
75
100
125
150
1995 1997 1999 2001 2003 2005 2007 2009 2011 2013 2015
DEU
FRA
ITA
ESP

Germany in the position of leader 61
achieved before the crisis. The gains were nevertheless consolidated during thecrisis, even though several factors could have eroded Germany's export perfor-mance. First, the global trade shock in 2008-2009 and the slowdown in tradebetween 2012 and 2012 cut down demand for exports.10 Second, the currentrebalancing of current accounts within the euro area is partly being achieved bya relative gain in competitiveness of the countries running deficits before thecrisis, and hence by a relative deterioration in Germany’s cost-competitiveness(see Figure 4 and above). However, the major part of the adjustment of thecrisis countries is achieved by austerity induced falls in imports which has alsodecreased European demand for German exports.
The evolution of a country’s current account reflects not only the dynamics ofits competitiveness but also its position in terms of the balance of savings andinvestment. In accounting terms, a current account surplus corresponds to anexcess of domestic savings relative to investment, whereas a deficit reflects anexcess of investment relative to domestic savings. An analysis of the savings andinvestment rates of households, business and government provides a comple-mentary understanding of the dynamics of current account surpluses. In thepre-crisis period, the improvement in the current account coincided with a risein savings and a fall in total investment by agents (households, financial andnon-financial corporations and general government—HH, FC and NFC, GG).Expressed as a percentage of GDP, business savings rose by 3.6 points between1999 and 2007 and government savings by 1.3 points. With respect to house-hold investment, the fall in the period 1999-2007 needs to be seen in relationto the sluggishness of the German housing market. In fact, the recent rebound
10. See IMF (2016) for a recent analysis of the slowdown in world trade.
Table 3. Germany’s current account since 1999
Change in GDP pts
1999-2007 2007-2015
Current account 8.2 1.6Balance goods & services 5.9 0.9HH savings 0.6 0.0HH GFCF -1.7 0.2FC + NFC savings 3.6 -0.3FC + NFC investment -0.6 -0.6GG savings 1.3 0.4GG investment -0.4 0.2Source: Eurostat.

iAGS 2017 — independent Annual Growth 5th Report62
in the period 2007-2015 has been reflected in a modest increase in householdinvestment. Government investment is also picking up, although it is still low(2.1% of GDP in 2015, compared with 3.5% in France). As for business invest-ment, it has continued to decline since 2007 despite the recent improvement infinancial conditions. Thus, the record current account surplus is not only a signof a healthy economy, but also reflects the weakness of investment, which is theengine of both short-term and long-term growth, in particular investment bybusiness and general government.
7.2. What are the challenges facing the German economy?
The economic successes of Germany should not hide the challenges facingGermany. The reduction of the unemployment has benefited from the slowgrowth of the labour force. However on the long run, it will raise importantissues. Besides, even if recently growth was less determined by external factorsthan during the years 2000, the question of public investment in Germany hasbeen raised in the public debate. Finally, inequalities have significantlyincreased despite the reduction of the unemployment rate. This has been amajor concern and has led to the introduction of the minimum wage.
a) The challenge of an ageing population
As of 1 January 2017, Germany’s population stood at 82.8 million, up 0,7%from the previous year, nearly the highest since 1992. This increase hasoccurred even though the natural balance (number of births minus number ofdeaths) was still negative, by about 150,000 to 190,000 people according tothe first estimations of Statistisches Bundesamt (2017). It was thus the migra-tion balance (at least 750,000 in 2016), which was similar to the levels observedfollowing the fall of the Berlin Wall and the opening of the Iron Curtain, that hasrecently made it possible to reverse the trend of a declining population.
Recent trends should not, however, be allowed to obscure the long-termtendency. Indeed, demographic projections generally follow well-identifiedtrends, at least with respect to the fertility rate, which, although rising slightly inthe last two decades, was still only 1.5 children per woman in 2015, which ismuch too low to ensure population renewal. According to the latest populationprojections by Statistisches Bundesamt (2015), the working-age population willfall sharply as the baby-boomers retire and the cohorts entering the labourmarket are much smaller. At the beginning of 2016, Statistisches Bundesamtindicated that the current high immigration levels would have only a limited
Germany in the position of leader 63
impact on long-term population trends, even if this pushes back and limits theextent of population ageing in the short and medium term. In order to stabilizethe population aged 20 to 66 by 2040, the net immigration of this age groupwould have to be 470,000 annually. But total net immigration (i.e. includingthose under age 20) has exceeded this level only in four years since 1991. Thelarge-scale immigration observed recently is thus not sufficient to avoid a fall inthe working-age population.
Measures to promote a better work-life balance have been implemented inrecent years (reform of parental leave in 2007, the 2008 law introducing theright to a childcare place for children aged 1 to 3), and the level of women'sparticipation in the labour market has risen, from 69.2% in 2007 to 72.7% in2015 (compared with 81.8% for men in 2015). However, these measures willnot be sufficient to reverse demographic trends, and this will have importantconsequences for the public purse, mainly via social spending. Populationageing will lower the ratio of workers to pensioners and will have an impact onthe funding of pensions, which could increase by 2.6 GDP points by 2060according to European Commission calculations.11
These factors undoubtedly explain why Germany has introduced measures toextend lifetime working hours, particularly provisions for raising the retirementage. Demographic ageing will also lead to higher funding needs for health anddependency. According to the European Commission's calculations, aggregatespending related to population ageing is expected to rise by more than5.2 GDP points in Germany by 2060, compared to 3.7 points for the EuropeanUnion as a whole.
The prospect of an ageing population suggests a possible alternative, and moresanguine, interpretation of the accumulation of current account surpluses sincethe early 2000s. As illustrated above, the current account reflects the gapbetween domestic savings (private and public) and investment. According tosome theoretical approaches, positive net savings (a current account surplus) isjustified whenever an ageing population and a slowdown in long-term growthcan be expected. Germany should therefore export more in anticipation of aslowdown in its long-term growth and a future structural increase in its imports.As a corollary, the current account surplus would subside with falling growthand the concomitant reduction of the savings rate. However, this would notexplain or justify surpluses of the magnitude we have seen.
11. See European Commission (2015).

iAGS 2017 — independent Annual Growth 5th Report64
b) Does Germany need to invest more?
This analysis of the current account has also highlighted the weakness ofGerman investment, particularly on the part of business and general govern-ment. But investment is needed, whether this is a matter of financing theenergy transition, education or the country’s infrastructure. The public authori-ties play a critical role with regard to investment. While the early 1990s weremarked by a sharp increase in public investment due to reunification, the levelof gross public investment flows since 2003 has not been sufficient to compen-sate for the obsolescence of capital, which is leading to lowering the quality ofthe public infrastructure.
There has been a clear lack of engagement by the public authorities in Germany(Rietzler 2014). This is due in particular to the withdrawal of the municipalities(Figure 5), which accounted for 35% of investment expenditure in 2015. From2007 onwards, the central government and the Länder raised their level ofinvestment by 0.1 and 0.2 percentage points, but the municipalities cut theirsagain by 0.1 point, while there was no change in the investments realized bySocial security authorities.. The number of reports focusing on the need forpublic investment, especially in infrastructure (bridges, roads), has multipliedsince the late 2000s.12
Figure 5. Public investment in Germany Change in %
Source: Eurostat.
12. See DIW (2013) for instance.
-0,4
-0,3
-0,2
-0,1
0
0,1
0,2
0,3
0,4
1999-2007 2007-2015
Social security funds
Local government
State government
Central government

Germany in the position of leader 65
While since 2004 the German government has regularly announced supportmeasures, in particular in response to the European Commission's recommen-dations with respect to the imbalance in the current account, this has not yetbeen reflected in the statistics on public investment. The authorities’ manoeu-vring room could also be limited in the future by the “debt brake” rule (Trugerand Will, 2013). First, the rule adopted does not provide for an exclusion ofcapital expenditures when determining the yearly debt ceiling. Moreover, in theevent of a cyclical downturn, the rule does not give the budgetary authoritiessufficient room for manoeuvre, forcing them into pro-cyclical policies, whichcould in fact result in further adjustments in investment expenditure.
c) Labour market: Grey zones
From the early 1990’s, wage setting became progressively more decentralizedto the firm level. The number of enterprises not covered by a collectivebargaining agreement increased and trade unions loosed power in the collec-tive bargaining at the branch level. It triggered a significant increase in theshare of low wages, employees earning less than 2/3 of the median gross wage,which accounted for 24% of German employees in 2013 (compared with 9% inFrance according to Eurostat13); 5 points higher than in 1995 (Kalina andWeinkopf, 2015). In the absence until 2015 of an interprofessional minimumwage, hourly wages remained very low and 1.6 million people earned a hourlywage below 5 euros at the beginning in 2013 (Kalina and Weinkopf, 2015).
The development of part-time work, related to the increase in the female partic-ipation rate (62.1% in 1991, 72.9% in 2015 according to StatistischesBundesamt), and of temporary work (liberalized during the Hartz reforms) hasalso heightened wage inequalities: employees who worked less hours were alsothose for which the hourly wage was often weaker compared to a full-time job.
A reduction in the level of redistribution (taxation and transfers) has alsocontributed to widening income inequality (Schmid and Stein, 2013). More-over, the unfavorable evolution of income at the bottom of the distribution inthe period 1991-2010 has led to an increase in the risk of poverty in Germany,that was not mitigated by the redistribution system. A German household’s riskof being in poverty rose from 11% in 1991 to 14% in 2012 (Goebel andGrabka, 2013; Goebel, Grabka and Schröder, 2015). The risk of povertyexploded particularly among the unemployed (56% in 2010, compared to 37%
13. Structure of earnings survey

iAGS 2017 — independent Annual Growth 5th Report66
in France).14 As the Hartz reforms have restricted the conditions for qualifyingfor compensation and its duration, those who are unable to re-enter the labourmarket receive lower benefits. For people in employment, the risk of povertyincreased slightly, to 10% in 2010.
In the face of these widening inequalities, there has been a growing awarenessamong social scientists, trade unions and some politicians that the collectivebargaining system is no longer able to protect society’s weakest workers fromwage dumping and to ensure them a decent wage. So a little more than10 years after the Hartz reforms were enacted, the question arose of correctingsome of the excesses in a now more favourable macroeconomic context. In the2013 legislative elections, the minimum wage was included in all the majorparties’ programmes. The principle of a generalized statutory minimum wagewas, as the Social Democrats (SPD) wished, ultimately endorsed in the coalitionagreement between the SPD and the Christian Democrats (CDU). Theminimum wage has gradually come into force from 2015 and has helped toreduce wage disparities between the old and new Länder and between themost qualified and the least qualified employees (Amlinger, Bispinck andSchulten 2016, Chagny and Le Bayon, 2016).15
Firms have apparently limited the impact of the minimum wage on their costsby flattening the wage scales at the minimum wage level and by increasing thelabour productivity of the employees concerned (cutting their working hoursand / or intensifying the work effort). They have also passed on the higher costsin prices, especially in the new Länder. This is clearly reflected in the prices ofcertain services in these Länder (hairdressers, taxis, etc.). On the other hand, theimpact has been small at the aggregate level, with the former Länderaccounting for only 20% of Germany’s consumer price index. Furthermore, thefall in oil prices had a disinflationary impact that helped to mask any possibleinflationary effect of the minimum wage.
14. Allegre (2013).15. Gross monthly wages (excluding minijobs) rose by 3.4% in 2015 in the new Länder, compared
to 1.6% in the old Länder. Moreover, the rise in hourly wages in the new Länder was 8.6% forthe unskilled and 5.8% for the semi-skilled, while for those with an average skills level it was 4%.

Germany in the position of leader 67
7.3. Germany and Europe: Reflections on European governance
Germany is emerging from the crisis in an unquestionably stronger position,and it is more than ever playing the role of leader of the euro zone. Eventhough there are imbalances and problem areas behind these apparentsuccesses, the German model has become a benchmark for the euro area, sinceit showed the possibility of reducing unemployment while generating budgetsurpluses and remaining highly competitive, that is to say, while respecting therules of European governance. This situation has given Germany a hegemoniceconomic and political position within the euro area, which enables it to defendits interests and propose its vision of governance (Wyplosz, 2016). At the sametime, the other Member States are also tempted to ask it to assume the positionof being a locomotive for the euro area so as to drive the growth of its partnersthrough its stimulus policies.
a) Can the euro area use the same recipes as Germany?
The German government is interpreting its success as being the fruit of a formof orthodoxy and of respect for the existing rules of European governance. So ifGermany is now running a budgetary surplus, this is because the country hasmade the efforts needed to reduce its deficit and ensure the sustainability of itspublic finances. Likewise, the current account surplus is viewed as the result ofmastering competitiveness and controlling wage costs, in particular throughthe Hartz labour market reforms implemented in the early 2000s. Having identi-fied the supposed keys to success, other European countries merely have tofollow the same path.
However, although the Hartz reforms were an important turning point in thefunctioning of the German social welfare state, profound changes were alreadyunderway. Wage moderation had begun in the mid-1990s, reflecting theintroduction of greater flexibility into the German social model (Chagny, 2008).Moreover, Germany’s situation is due not only to the functioning of its labourmarket, but also to the existence of a set of complementarities that relate to theway that agents and institutions are coordinated, which define the German“model”. However, these characteristics—industry specializing in quality goodsproduced by highly skilled employees, autonomy of the social partners, long-term governance, a state guaranteeing regulated liberalism, price stability—areunique to Germany and cannot be replicated by other countries (Hall, 2015).Given this, there is no guarantee that the same reforms will produce thesame effects.

iAGS 2017 — independent Annual Growth 5th Report68
Herzog-Stein, Lindner and Zwiener (2014) show that for many years the struc-tural reforms depressed domestic demand, with an overall negative growth andemployment impact, in addition to helping to fuel the competitive disparitiesthat led to the implosion of the common currency.
It should also not be forgotten that Germany’s fiscal consolidation and labourmarket reform were undertaken before the 2007 financial crisis, i.e. in a muchmore favourable economic context. When Germany undertook its fiscal adjust-ment, it was able at that time to benefit from the more dynamic growth of theother euro area countries, which enabled it to offset at least partially the nega-tive effect of its fiscal consolidation. Starting in 2010, it is the euro area as awhole that has pursued a fiscal consolidation policy. The synchronization ofthese policies has greatly increased their recessionary effect. In these circum-stances it has been much more difficult and costly for the euro area countries toreduce their post-2010 deficits than it was for Germany after 2004. The iAGS2013 report shows that this strategy was a failure and that alternative solutionsshould have been contemplated and implemented. The success of fiscal consol-idation depends heavily on the moment that it is undertaken. As has beensuggested in Section I, Germany’s return to budgetary surpluses is the result notso much of extra efforts it has made relative to its partners as to the fact that ithas undertaken less fiscal consolidation, and thus not undermined growth. Thebulk of the effort was undertaken earlier, in a different context.
Similarly, by definition, Germany's gains in competitiveness in the first half ofthe 2000s have had as their corollary a deterioration in the competitiveness ofits trading partners, particularly those in the euro area. The real effectiveexchange rate is ultimately a measure of the relative price or cost. It follows thatnot all countries can become more competitive simultaneously. However, theone-sided strategy currently being adopted by many countries, encouraged byflawed mechanisms such as the Macroeconomic Imbalance Procedure , is basedon the implementation of labour market reforms or measures to cut labourcosts (Figure 6). This race for competitiveness will inevitably have an attenuatedimpact on growth, with the gains of some being made to the detriment ofothers. Furthermore, in a context of high unemployment, implementing astrategy like this at the level of the euro area as a whole creates and reinforcesdisinflationary pressures throughout the area.
Hence there is every reason to think that an approach that has worked in oneplace at one specific time will not work in the same way for other countries inother contexts.

Germany in the position of leader 69
b) Don’t expect too much from Germany.
Due to Germany’s macroeconomic situation and the weight of its GDP in euroarea GDP, the economic policy decisions that it takes have an impact on othercountries. Furthermore, Germany is the only large Member State that enjoysfiscal space under the Stability and Growth Pact, which would enable it to enacta fiscal stimulus that would boost demand in the euro area and thus benefit thecountries that are currently constrained by the fiscal rules. This is the approachsought not only by the euro area Member States but, recently, also by the Euro-pean Commission, which emphasised in its Annual Growth Survey (2016) thatthe orientation of fiscal policy in the aggregate euro area should be expan-sionary. Not only did this imply a German fiscal stimulus (because theaggregate orientation must be compatible with the budgetary rules in forcewhich call for consolidation in other countries; the Commission explicitly calledon countries with fiscal space to use it and to frontload public investment. Whatwe see is that Germany’s fiscal stance was mildly expansionary in 2015 and2016, in particular as a result of the measures taken to receive immigrants. Theprospect of the autumn 2017 elections could also see the emergence of stim-ulus proposals which, in the current state of the debate, would mainly focus ontax cuts.
Figure 6. Change in unit labour costs
In pts
Source: Eurostat.
-30
-20
-10
0
10
20
30
40
BEL DEU IRL GRC ESP FRA ITA NLD AUT PRT FIN
2000-20072007-20092009-2016
iAGS 2017 — independent Annual Growth 5th Report70
On the other hand, if a major fiscal stimulus were adopted, such as a publicinvestment plan as suggested in Section 2, this would benefit Germany inparticular and above all. Although the literature highlights the positive spill-overeffects (Corsetti et al., 2010; Blanchard et al., 2016), their magnitude is prob-ably limited. It does not therefore seem realistic to think that a German revivalwould solve the problem of low growth in France, Italy and Portugal. Theselimits should not however lead to giving up on the implementation of an invest-ment programme in Germany. This is still desirable in order to consolidateGermany’s growth in the short term and to boost its growth potential in thelong term. This would also end up having a positive impact on demand forexports from other euro area countries. But this could not be the sole driver ofgrowth in these countries.
The other factor supporting growth could be a more generous wage policy inGermany, which would help to reduce the euro area’s current account imbal-ances, although here, too, the effects will be limited in magnitude. The iAGSreports for 2014, 2016 and 2017 largely support this idea. Indeed, they arebased on the observation that up to now the correction of imbalances has beencarried out mainly by the countries in deficit. The higher the inflation gapbetween the surplus countries and the deficit countries, the easier it is to rebal-ance the current accounts. The main aim would be to promote a method ofcoordinating wage policies that takes into account the externalities of thesepolicies and prevents the euro area from falling into a deflationary trap. Buteven if adjustments in relative competitiveness help to reduce the imbalances,the euro area cannot rely on this strategy alone. This needs to be supplementedby a structural component, that is, by policies that favour the convergence ofproduction capacities and living standards. As was pointed out in the iAGS2017 report, restoring growth in the euro area as a whole cannot be accom-plished by a single measure, but demands a comprehensive strategy.
It should also be noted that wages in Germany have been accelerating since2011 (Figure 7). The reduction in the unemployment rate has been givingemployees greater bargaining power. Furthermore, in 2015, Germanemployees benefited from the implementation of the minimum wage (setinitially at 8.50 euros per hour, before being revised to 8.84 euros in 2017),even though the macroeconomic impact has been relatively small. Yet, it isclear that the faster growth in German unit labour costs (Figure 6) since 2009has not yet translated into a reduction in Germany’s current account surpluses.
Horn et al. (2017) simulated the impact of a higher increase of average nominalwage growth per capita than was actually the case in Germany. They study the

Germany in the position of leader 71
impact of an increase of 2.7% between 1999 and 2015 (which is equal to thesum of pre-crisis productivity growth and the ECB’s inflation target), i.e. 0.9percentage points more than what actually took place over the period. Theyfind that this would have led to somewhat higher prices but would not haveprevented real wages from rising by 0.7 percentage points per year more onaverage. However, if only wages and nothing else would have changed, thetrade balance would have decreased by only 0.7 percentage points between1999 and 2015. Since higher wages lead to an increase in income andconsumption taxes and thus higher public revenues, they use those extra reve-nues to increase higher public spending. In this scenario with an additionalfiscal boost, the trade balance would have been 1.2 percentage points lower,i.e. it would stand at 6.3% of GDP and not at the actual value of 7.5%. Overall,those simulations show, that stronger wage growth alone is probably not likelyto be effective to significantly reduce the German current account and thatthere would have to be a much stronger increase in public spending to stimu-late Germand demand to such an extent that imports are significantly increasedand the trade balance reduced.
Figure 7. Changes in wages in Germany
In %
Source: Destatis.
-2
0
2
4
6
8
10
12
1992 1994 1996 1998 2000 2002 2004 2006 2008 2010 2012 2014 2016
Real wage (deflated by consumption deflator)
Nominal wage

iAGS 2017 — independent Annual Growth 5th Report72
7.4. Conclusion
From the sick man of Europe at the early 2000, Germany has now reached aposition of leader in the euro area. The economic performance of Germany hasshown a strong resilience despite a major financial crisis, a collapse of the worldtrade in 2008-2009 and the worst global recession since the Great Depression.During the sovereign debt crisis that hit euro area countries, Germany wasconsidered as a safe haven in the euro area. Ten years after, the German unem-ployment rate is below its pre-crisis level, the current account surplus hasincreased and the net government deficit has rapidly been reduced. Eventhough, those economic successes should not hide important internal chal-lenges, it seems that Germany has reinforced its political influence on issuesregarding European governance emphasizing the importance of public debtsustainability and competitiveness. However, the recent evidence has shownthat the strategy followed by euro area countries to improve competitivenessand reinforce sustainability has failed. All countries have implemented fiscalconsolidation at the same time leading to a double-dip recession in the euroarea. The synchronized consolidation is therefore more likely to be self-defeating. Besides, euro area countries should also avoid a race for competitive-ness that will end in deflation rather than improving exports performance. Theleader’s position also implies expectations from other euro area members.However, even if Germany is the biggest country in the euro area and maycontribute to reduce macroeconomic imbalances, it cannot alone tackle alleconomic challenges faced by euro area. More coordination is needed notablythrough the adoption of a fiscal rule more favourable to public investment andthrough the adoption of a “golden rule” for wages as emphasized in the iAGS2017 report.
References
Allègre G. (2013), “France, Allemagne : pauvreté des non-travailleurs”, OFCE le blog,6 mars 2013.
Amlinger, M., R. Bispinck and T. Schulten (2016), “The German minimum wage:Experiences and perspectives after one year”, WSI Report 28, 1/2016.
Blanchard, O., C. Erceg and J. Lindé (2016), “Jump-starting the Euro Area recovery:Would a rise in core fiscal spending help the periphery?”, in NBER Macroeco-nomics Annual 2016, Volume 31. University of Chicago Press.
Blot, C. and S. Kooths (2010), “Forces et faiblesses des modèles économiques:débat franco-allemand sur la crise et ses conséquences”, in Radioscopie de

Germany in the position of leader 73
l’Allemagne, Les études IFRI, under the editorship of Louis-Marie Clouet and HansStark.
Blot, C. and S. Kooths (2010), “Zwei Wirtschaftssysteme in der Bewärhungsprobe:Die deutsch-französische Debatte über die Wirtschaftskrise und derenAuswirkungen”, Frankreich-Themen 2010, DGAP-Schriften zur InternationalenPolitik, Claire Demesmay – Katrin Sold.
Blot, C., M. Cochard, J. Creel, B. Ducoudré, D. Schweisguth and X.Timbeau (2014),“Fiscal consolidation, public debt and output dynamics in the euro area: Lessonsfrom a simple model with time-varying fiscal multiplier”, Revue d’Economie Poli-tique, 124(6): 953-989.
Chagny, O. (2008), “Retour sur les réformes du marché du travail en Allemagne”,Revue de l’IRES, no. 58, pp. 65-110.
Chagny, O. and S. Le Bayon (2016), “Allemagne. Un premier bilan de l’introductiondu salaire minimum”, Chronique internationale de l’IRES, n° 155, September.
Corsetti, G., A. Meier and G. Müller (2010), “Cross-border spillovers from fiscalstimulus”, International Journal of Central Banking, March, pp. 5-37.
DIW (2013), “Investment for more growth – An Agenda for Germany’s future”, DIWEconomic Bulletin 8.
ECB (2012), “Competitiveness and external imbalances within the euro area”, ECBOccasional Paper Series n° 139.
European Commission (2010), “Surveillance of Intra-Euro-Area Competitivenessand Imbalances”, European Economy n° 1.
European Commission (2015), “The 2015 Ageing report: economic and budgetaryprojections for the EU 28 Member States (2013-2060)”, European Economy 3.
Feigl, G. and Zuckerstätter, S. (2012), “Wettbewerbs(des)orientierung”. Materialienzu Wirtschaft und Gesellschaft N° 117.
Gaulier, G.and Vicard, V. (2012), “Current Account Imbalances in the Euro Area:Competitiveness or Demand Shock?”, Banque de France, Quarterly Selection ofArticles, H. 27, S. 5-26.
Goebel J. and M. Grabka (2013), “Rückgang der Einkommensungleichheit stockt”,DIW Wochenbericht n°46/2013.
Goebel J., M. Grabka and C. Schröder (2015), “Einkommensungleichheit inDeutschland bleibt weiterhin hoch—junge Alleinlebende und Berufseinsteigersind zunehmend von Armut bedroht”, DIW Wochenbericht n°25/2015.
Hall, P.A. (2015), “The fate of the German model”, in The German Model Seen by itsNeighbours, edited by Brigitte Unger.
Herzog-Stein, A., F. Lindner and R. Zwiener (2013), “Is the supply side all thatcounts?”, 87th Report, IMK Report, November.

iAGS 2017 — independent Annual Growth 5th Report74
Horn, G. and Lindner, F. (2016), “Die deutschen Leistungsbilanzüberschüsse: hoheWettbewerbsfähigkeit oder zu schwache Nachfrage?” Wirtschaftsdienst, Bd. 96,H. 11, S. 801-805.
iAGS (2012), Failed austerity in Europe, the way out, independent Annual GrowthSurvey 2013, First report.
iAGS (2013), From austerity to stagnation: How to avoid the deflation trap, inde-pendent Annual Growth Survey 2014, Second report.
iAGS (2015), Give recovery a chance, independent Annual Growth Survey 2016,Fourth report.
iAGS (2016), The elusive recovery, independent Annual Growth Survey 2017, 5threport.
IMF (2010), “Will it hurt? Macroeconomic effects of fiscal consolidation”, WorldEconomic Outlook, Chapter 3, October, pp. 93-124.
IMF (2016), “Global trade: what’s behind the slowdown?”, World Economic Outlook,Chapter 2, October, pp. 63-119.
Kalina T. and C. Weinkopf (2015), “Niedriglohnbeschäftigung 2013: Stagnation aufhohem Niveau”, IAQ-Report 2015-0.
Le Moigne, M. and X. Ragot (2015), “France et Allemagne: une histoire du désajust-ement européen”, Revue de l’OFCE no. 142, pp. 177-231.
Paetz C., K. Rietzler and A. Truger (2016), “The federal budget debt brake since2011”, IMK Report 117.
Rietzler K. (2014), “Anhaltender Verfall der Infrastruktur”, IMK report 94.
Schmid K. D. and U. stein (2013), “Explaining Rising Income Inequality in Germany,1991-2010”, IMK Study, n°32, September 2013.
Statistisches Bundesamt (2015), “New projection of Germany's population by2060”, Press release 153 / 2015-04-28.
Statistisches Bundesamt (2016), “Currently high immigration cannot reverse popu-lation ageing”, Press release 021 / 2016/01/20.
Statistisches Bundesamt (2017), “Bevölkerung in Deutschland voraussichtlich auf82,8 Millionen gestiegen”, Pressemitteilung 033 / 2017/0127.
Truger, A. and H. Will (2013), “The German debt-brake: A shining example for Euro-pean fiscal policy”, Revue de l’OFCE 127, pp.153-188.
Wyplosz, C. (2013), “The Eurozone Crisis and the Competitiveness Legend”. AsianEconomic Papers, Bd. 12, H. 3, S. 63-81.
Wyplosz, C. (2016), “The six flaws of the Eurozone”, Economic Policy, 31(87):559-606.


Achevé de rédiger en France, mars 2017.Coordination by Xavier Timbeau (OFCE). Ré
alis
atio
n, c
omp
ositi
on: N
ajet
te M
oum
mi (
OFC
E)