5g nr signal generation and analysis application note · 2019-12-05 · 5g nr dl & ul signal...
TRANSCRIPT
1
5G NR Signal Generation and Analysis Application Note
Products:
ı R&S®SMW200A
ı R&S®SMW-K144
ı R&S®FSW43
ı R&S®FSW-K144
ı R&S®FSW-K145
ı R&S®VSE
This application note is step by step guide on 5G New Radio (5G NR) signal generation and analysis
capabilities using the R&S®SMW200A Vector Signal Generator equipped with software option SMW-K144
(5G NR option), in combination with the R&S®FSW Signal and Spectrum Analyzer and the software
options FSW-K144 & FSW-K145 (5G NR Downlink & Uplink Signal Analysis). The R&S®VSE Vector signal
explorer has also been used for analysis purpose in parallel to the FSW-K144 & FSW-K145 software
options.
It is assumed that the reader already has a deep understanding of the 5G New Radio standard as well as
the testing aspects. If not, then please refer to the 5G eBook more a detailed overview on the
fundamentals, procedures, testing aspects of the 5G NR technology.
5G NR eBook: https://www.rohde-schwarz.com/5G-ebook.
Note:
Please find the most up-to-date document on our homepage
https://www.rohde-schwarz.com/appnote/GFM322
App
licat
ion
Not
e
Mah
mud
Nas
eef,
And
reas
Rös
sler
12.2
019 –
GF
M32
2_1e
2
Table of Contents
1 Introduction ..........................................................................................4
2 5G NR DL & UL Signal Generation and Analysis ..............................5
2.1 Downlink signal generation and analysis ................................................................. 5
2.1.1 Signal generator setting on the SMW ............................................................................ 5
2.1.2 Spectrum Analyzer setting on the FSW ......................................................................... 9
2.1.3 Spectrum Analysis on the VSE .................................................................................... 12
2.2 Uplink signal generation and analysis .................................................................... 16
2.2.1 Signal generator setting on the SMW .......................................................................... 16
2.2.2 Spectrum Analyzer setting on the FSW ....................................................................... 19
2.2.3 Spectrum Analysis setting on the VSE ........................................................................ 22
3 Measurement result for FR1 & FR2 signals ..................................... 25
3.1 FR1 Measurement Results ........................................................................................ 25
3.1.1 FR1 DL Measurement result on the FSW ................................................................... 25
3.1.2 FR1 DL Measurement result on the VSE .................................................................... 26
3.1.3 FR1 UL Measurement result on the FSW ................................................................... 27
3.1.4 FR1 UL Measurement result on the VSE .................................................................... 28
3.2 FR2 Measurement Results ........................................................................................ 29
3.2.1 FR2 DL Measurement result on the FSW ................................................................... 29
3.2.2 FR2 DL Measurement result on the VSE .................................................................... 30
3.2.3 FR2 UL Measurement result on the FSW ................................................................... 31
3.2.4 FR2 UL Measurement result on the VSE .................................................................... 32
4 Advanced Measurement Methods .................................................... 33
4.1 Phase Noise ............................................................................................................... 33
4.1.1 Performance check of PTRS signals ........................................................................... 34
4.2 DC sub carrier ............................................................................................................ 38
4.3 IF overload, Optimized EVM and Crest Factor ........................................................ 38
4.4 Capture time and Tigger setting .............................................................................. 39
4.5 Parameter/ Estimation Tracking ............................................................................... 40
4.6 Slot Allocation and Slot format ................................................................................ 41
4.7 Generate and analyze 5G NR TDD signals .............................................................. 42
4.7.1 Signal Generator configuration .................................................................................... 42
4.7.2 Spectrum Analyzer Configuration ................................................................................ 44
4.8 Evaluation Range and Display setting .................................................................... 48

3
5 Ordering Information ......................................................................... 50
Introduction
4
1 Introduction
In previous mobile technology generations, voice communication have always been
the major focus. Progressively, new services were added, e.g. text massaging in 2G,
video calls in 3G and always-on data connectivity in 4G. The upcoming generation,
5G, seeks to make further major changes to services with a wide range of
requirements. The networks are capable of providing services ranging from high data
rate mobile broadband to ultra-reliable low-latency communications.
5G is designed to support a variety of different services. 5G New Radio (NR) employs
a much higher bandwidth (up to 400 MHz per carrier) compared with 4G. 5G NR is
designed for deployment in two main frequency ranges. FR1 comprises spectrum from
410 MHz to 7.125 GHz and FR2 from 24.25 MHZ to 52.6 GHz.
In case of waveform, 5G NR retains the OFDM-based waveform just like in LTE.
However, certain fundamental differences enable the high configuration flexibility
required in this generation. 5G NR introduces flexible numerology and thus allowing
subcarrier spacing (SCS) of 15 KHz, 30 KHz, 60 KHz, 120 KHz and 240 KHz. This
leads to different symbol time durations since the SCS is inversely proportional to the
symbol duration. Therefor the number of symbol in a fixed time duration is now
variable. The synchronization signals and data channels may use a different SCS.
Moreover, the synchronization signals and broadcast signals are no longer placed in
the center of the carrier. This requires the definition of a reference point for allocation
of resources in the frequency domain.
In 5G NR, the nominal channel bandwidth per frequency band can be segmented into
smaller sub bands known as resource grids or bandwidth parts (BWP). Mixed
numerology can be an option to provide various Quality of Service (QoS) on the radio
interface. One BWP is one fixed numerology. BWPs are allocated to UEs.
This application note is a step-by-step guide on 5G New Radio (5G NR) signal
generation and analysis. The R&S®SMW200A Vector Signal Generator equipped with
software option SMW-K144 (5G NR option), SMW-K114 (OFDM Signal Generation
option) in combination with the R&S®FSW Signal and Spectrum Analyzer and the
options FSW-K144 (5G NR Downlink Signal Analysis) & FSW-K145 (5G NR Uplink
Signal Analysis) is used in this application note. The R&S®VSE Vector signal explorer
has also been used for analysis purpose in parallel to the FSW-K144 & FSW-K145
software options. The R&S®VSE Vector signal explorer is an analysis software that can
be used remotely on a user PC in a multi-user environment but with the same test
bench.
Abbreviations
The following abbreviations are used in this application note for Rohde & Schwarz
products:
▪ The R&S®SMW200A Signal Generator is referred to as SMW
▪ The R&S®FSW Signal and Spectrum Analyzer is referred to as FSW
▪ The R&S®VSE Vector signal explorer is referred to as VSE

5G NR DL & UL Signal Generation and Analysis
5
2 5G NR DL & UL Signal Generation and
Analysis
The standardization body, 3GPP creates the specification, which provides a
comprehensive definition of the complete system. More specifically, the 3GPP RAN4
and RAN5 working groups define the base station and user equipment requirements to
be tested and verified.
The radio transmission and reception (i.e. RF) requirements define the transmitter
capabilities (e.g. maximum output power and transmit quality such as EVM and
frequency error) and receiver capabilities (e.g. the sensitivity of an end-user device or
its ability to maintain a certain throughput in the presence of an interferer or blocking
signal).
The different 5G NR physical layer parameter can be generated and analyzed with
ease. This chapter will explain systematically how this is performed, for both downlink
and uplink, using the signal generator SMW and the spectrum analyzer FSW.
2.1 Downlink signal generation and analysis
This section describes a step-by-step guide on how to setup a FR1 Downlink (DL) cell
where the maximum Bandwidth is 100MHz. The signal is centered at 3.5GHz.
2.1.1 Signal generator setting on the SMW
ı To start off, open the 5G NR option from the Baseband menu on the SMW
5G NR DL & UL Signal Generation and Analysis
6
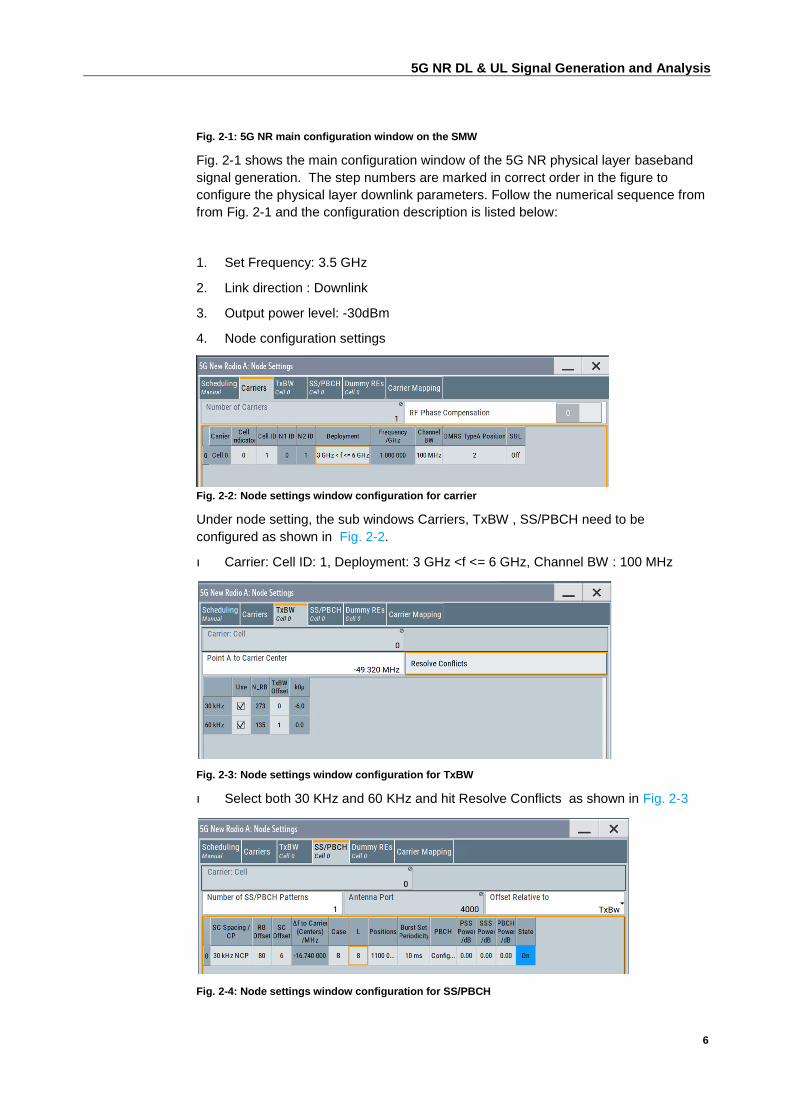
Fig. 2-1: 5G NR main configuration window on the SMW
Fig. 2-1 shows the main configuration window of the 5G NR physical layer baseband
signal generation. The step numbers are marked in correct order in the figure to
configure the physical layer downlink parameters. Follow the numerical sequence from
from Fig. 2-1 and the configuration description is listed below:
1. Set Frequency: 3.5 GHz
2. Link direction : Downlink
3. Output power level: -30dBm
4. Node configuration settings
Fig. 2-2: Node settings window configuration for carrier
Under node setting, the sub windows Carriers, TxBW , SS/PBCH need to be
configured as shown in Fig. 2-2.
ı Carrier: Cell ID: 1, Deployment: 3 GHz <f <= 6 GHz, Channel BW : 100 MHz
Fig. 2-3: Node settings window configuration for TxBW
ı Select both 30 KHz and 60 KHz and hit Resolve Conflicts as shown in Fig. 2-3
Fig. 2-4: Node settings window configuration for SS/PBCH
5G NR DL & UL Signal Generation and Analysis
7
ı Select SC spacing: 30 KHz NCP, RB offset:80, SC offset: 6, Case: B, Position:
1100 0000 as shown in Fig. 2-4
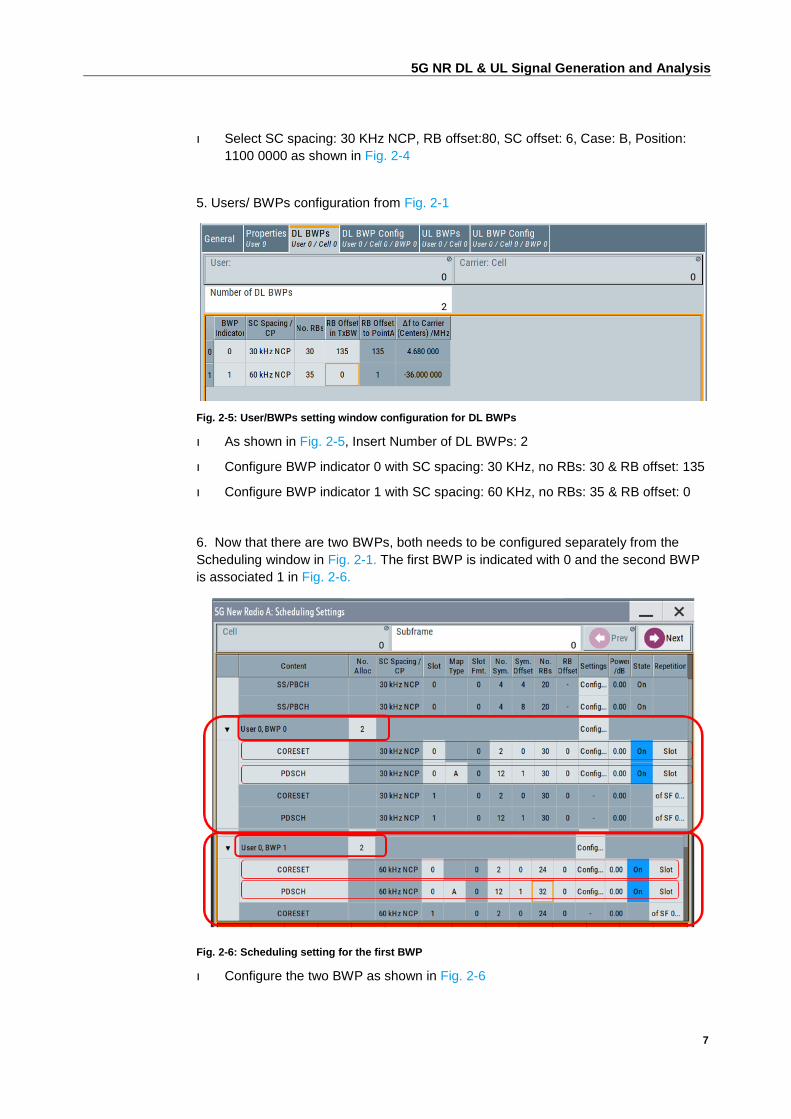
5. Users/ BWPs configuration from Fig. 2-1
Fig. 2-5: User/BWPs setting window configuration for DL BWPs
ı As shown in Fig. 2-5, Insert Number of DL BWPs: 2
ı Configure BWP indicator 0 with SC spacing: 30 KHz, no RBs: 30 & RB offset: 135
ı Configure BWP indicator 1 with SC spacing: 60 KHz, no RBs: 35 & RB offset: 0
6. Now that there are two BWPs, both needs to be configured separately from the
Scheduling window in Fig. 2-1. The first BWP is indicated with 0 and the second BWP
is associated 1 in Fig. 2-6.
Fig. 2-6: Scheduling setting for the first BWP
ı Configure the two BWP as shown in Fig. 2-6
5G NR DL & UL Signal Generation and Analysis
8
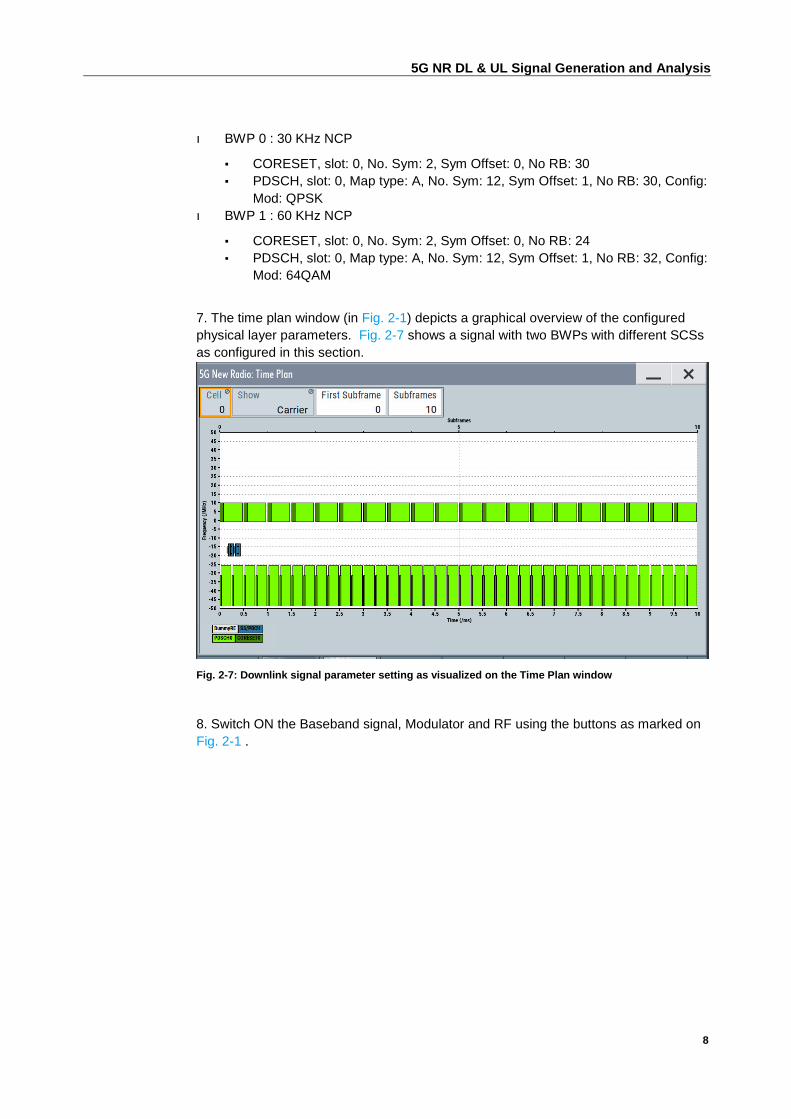
ı BWP 0 : 30 KHz NCP
▪ CORESET, slot: 0, No. Sym: 2, Sym Offset: 0, No RB: 30
▪ PDSCH, slot: 0, Map type: A, No. Sym: 12, Sym Offset: 1, No RB: 30, Config:
Mod: QPSK
ı BWP 1 : 60 KHz NCP
▪ CORESET, slot: 0, No. Sym: 2, Sym Offset: 0, No RB: 24
▪ PDSCH, slot: 0, Map type: A, No. Sym: 12, Sym Offset: 1, No RB: 32, Config:
Mod: 64QAM
7. The time plan window (in Fig. 2-1) depicts a graphical overview of the configured
physical layer parameters. Fig. 2-7 shows a signal with two BWPs with different SCSs
as configured in this section.
Fig. 2-7: Downlink signal parameter setting as visualized on the Time Plan window
8. Switch ON the Baseband signal, Modulator and RF using the buttons as marked on
Fig. 2-1 .

5G NR DL & UL Signal Generation and Analysis
9
2.1.2 Spectrum Analyzer setting on the FSW
ı To get started, switch ON the 5G NR measurement personality from MODE
Fig. 2-8: Measurement Modes selection window on the FSW
Fig. 2-9: 5G NR measurement Mode on the FSW
ı Set Frequency: 3.5 GHz as shown in Fig. 2-9
ı In the Signal description window, the signal parameter of the received signal
needs to be configured

5G NR DL & UL Signal Generation and Analysis
10
Fig. 2-10: Signal description configuration window in the 5G NR mode on the FSW
ı Signal description settings is in Fig. 2-10,
▪ Set Mode: Downlink, Number of component Carriers: 1
▪ Deploy frequency Range: 3GHz < f <=6GHz
▪ Channel Bandwidth: 100MHz
▪ Bandwidth Part: 1 BWPS and SCS 30 KHz
▪ PDSCH/PDCCH: QPSK
▪ Cell ID: 1
Fig. 2-11: Radio Frame Configuration window in the 5G NR mode on the FSW
ı From the Radio Frame Config window, the sub categories (shown in Fig. 2-11)
need to be configured
ı In the Synchronization,
▪ Select Detection: Manual, Subcarrier Spacing: 30 KHz
▪ SS/PBCH Block Pattern : CASE B
▪ Offset rel to: TxBW
▪ RB Offset: 80, Additional Subcarrier Offset: 6
5G NR DL & UL Signal Generation and Analysis
11
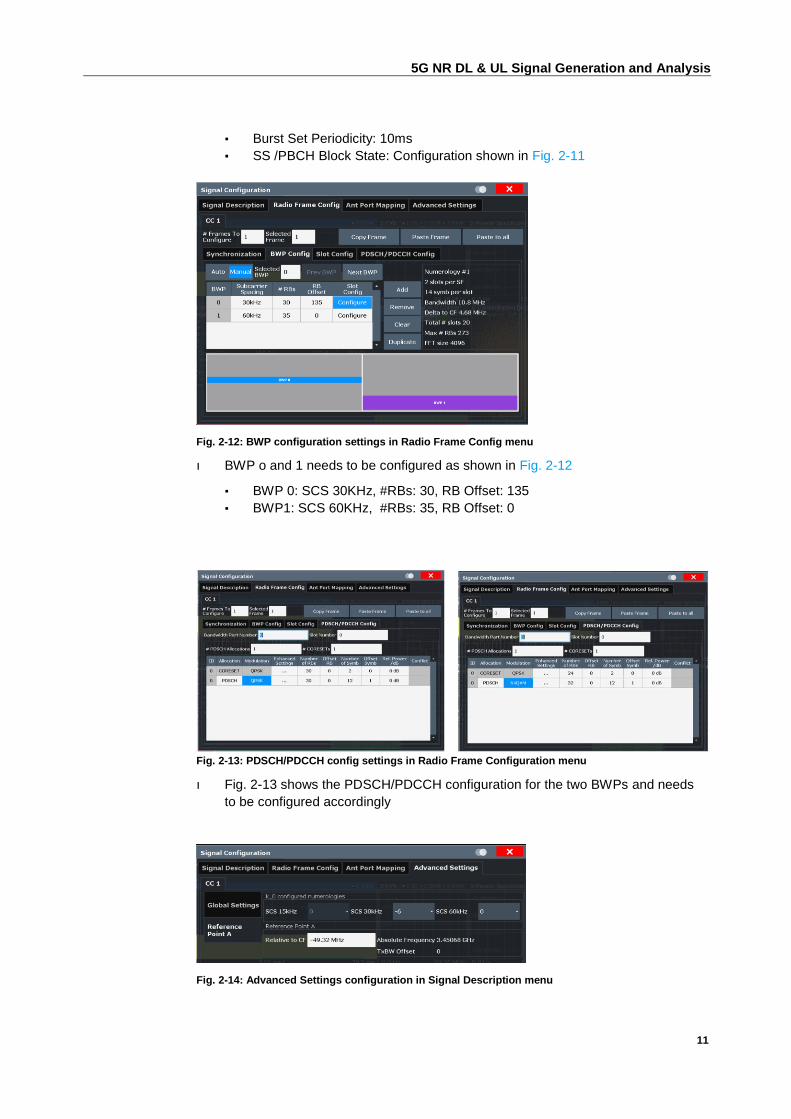
▪ Burst Set Periodicity: 10ms
▪ SS /PBCH Block State: Configuration shown in Fig. 2-11
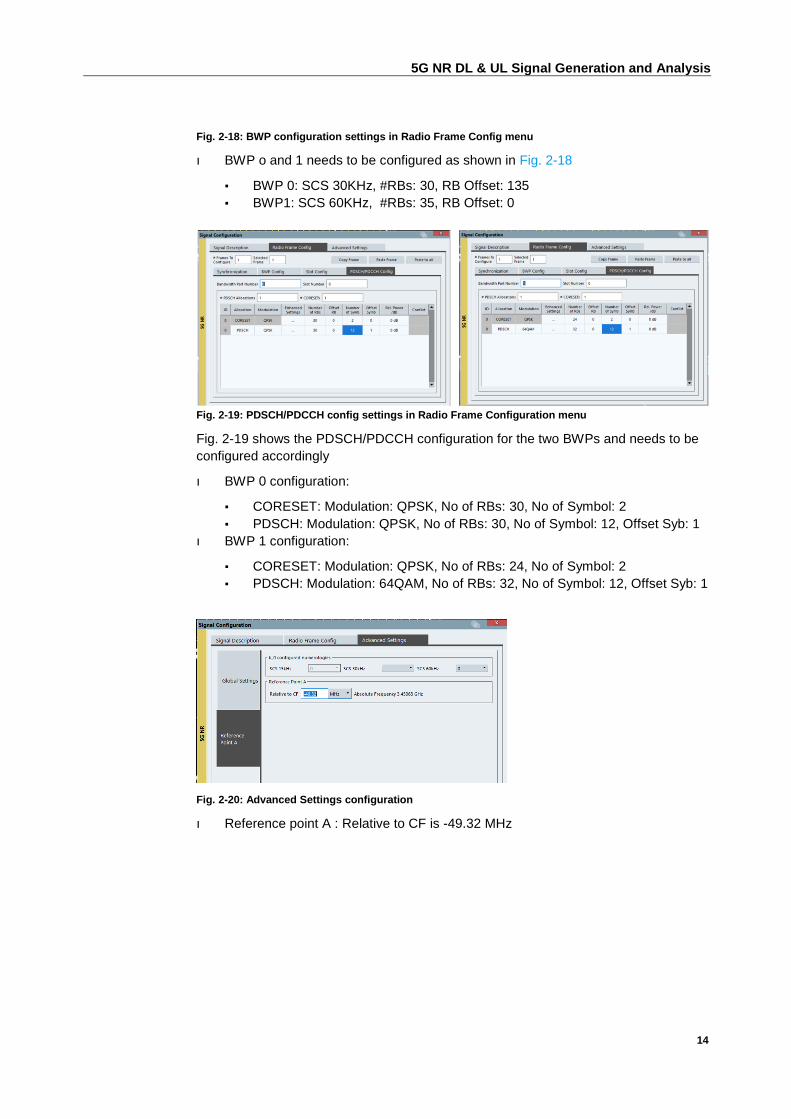
Fig. 2-12: BWP configuration settings in Radio Frame Config menu
ı BWP o and 1 needs to be configured as shown in Fig. 2-12
▪ BWP 0: SCS 30KHz, #RBs: 30, RB Offset: 135
▪ BWP1: SCS 60KHz, #RBs: 35, RB Offset: 0
Fig. 2-13: PDSCH/PDCCH config settings in Radio Frame Configuration menu
ı Fig. 2-13 shows the PDSCH/PDCCH configuration for the two BWPs and needs
to be configured accordingly
Fig. 2-14: Advanced Settings configuration in Signal Description menu

5G NR DL & UL Signal Generation and Analysis
12
ı Reference point A relative to CF is -49.32 MHz
Fig. 2-15: Measurement Display Window of the 5GNR analysis personality on the FSW
Fig. 2-1 shows the measurement display of the 5G FR1 signal at 3.5 GHz. The auto
EVM can be selected to optimize the analysis of the signal. The EVM for PDSCH
QPSK is 0.62% and PDSCH 64QAM is 0.62%.
2.1.3 Spectrum Analysis on the VSE
Configuring the 5G NR measurement personality on the VSE.
Fig. 2-16: 5G NR measurement Mode Signal Description configuration on the VSE
ı Fig. 2-16 shows the Signal Description configuration of the 5G NR measurement
modes
5G NR DL & UL Signal Generation and Analysis
13
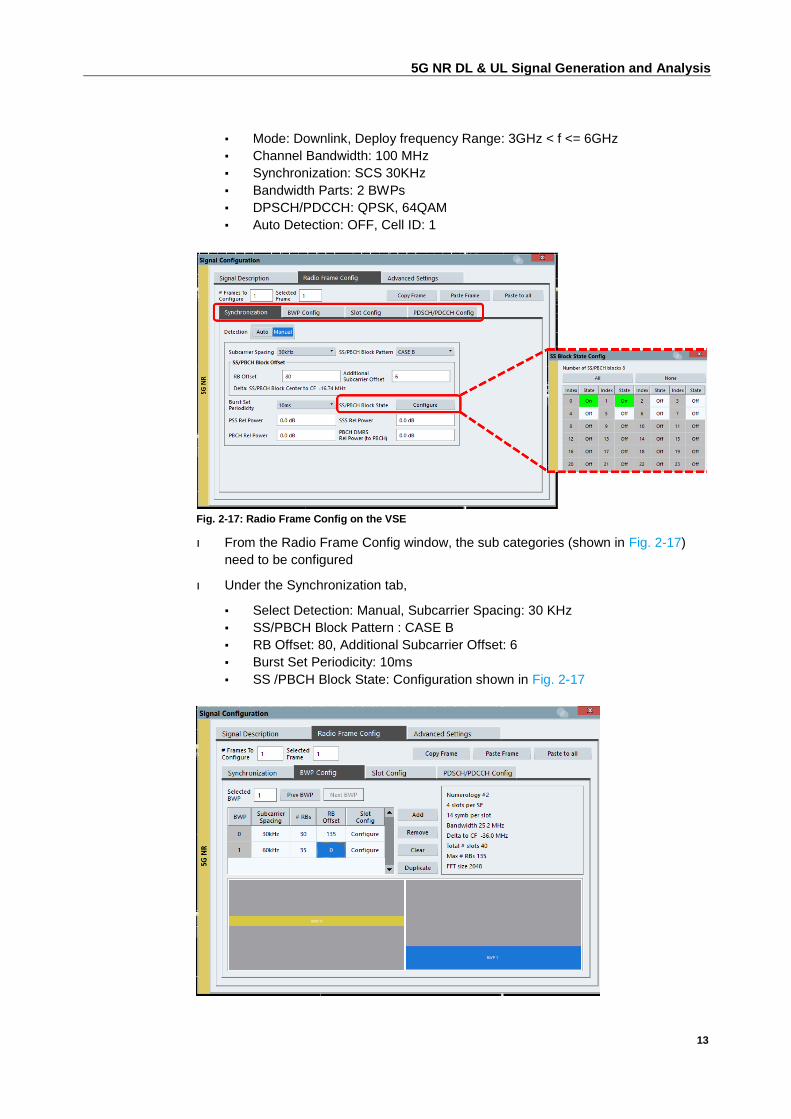
▪ Mode: Downlink, Deploy frequency Range: 3GHz < f <= 6GHz
▪ Channel Bandwidth: 100 MHz
▪ Synchronization: SCS 30KHz
▪ Bandwidth Parts: 2 BWPs
▪ DPSCH/PDCCH: QPSK, 64QAM
▪ Auto Detection: OFF, Cell ID: 1
Fig. 2-17: Radio Frame Config on the VSE
ı From the Radio Frame Config window, the sub categories (shown in Fig. 2-17)
need to be configured
ı Under the Synchronization tab,
▪ Select Detection: Manual, Subcarrier Spacing: 30 KHz
▪ SS/PBCH Block Pattern : CASE B
▪ RB Offset: 80, Additional Subcarrier Offset: 6
▪ Burst Set Periodicity: 10ms
▪ SS /PBCH Block State: Configuration shown in Fig. 2-17
5G NR DL & UL Signal Generation and Analysis
14
Fig. 2-18: BWP configuration settings in Radio Frame Config menu
ı BWP o and 1 needs to be configured as shown in Fig. 2-18
▪ BWP 0: SCS 30KHz, #RBs: 30, RB Offset: 135
▪ BWP1: SCS 60KHz, #RBs: 35, RB Offset: 0
Fig. 2-19: PDSCH/PDCCH config settings in Radio Frame Configuration menu
Fig. 2-19 shows the PDSCH/PDCCH configuration for the two BWPs and needs to be
configured accordingly
ı BWP 0 configuration:
▪ CORESET: Modulation: QPSK, No of RBs: 30, No of Symbol: 2
▪ PDSCH: Modulation: QPSK, No of RBs: 30, No of Symbol: 12, Offset Syb: 1
ı BWP 1 configuration:
▪ CORESET: Modulation: QPSK, No of RBs: 24, No of Symbol: 2
▪ PDSCH: Modulation: 64QAM, No of RBs: 32, No of Symbol: 12, Offset Syb: 1
Fig. 2-20: Advanced Settings configuration
ı Reference point A : Relative to CF is -49.32 MHz
5G NR DL & UL Signal Generation and Analysis
15
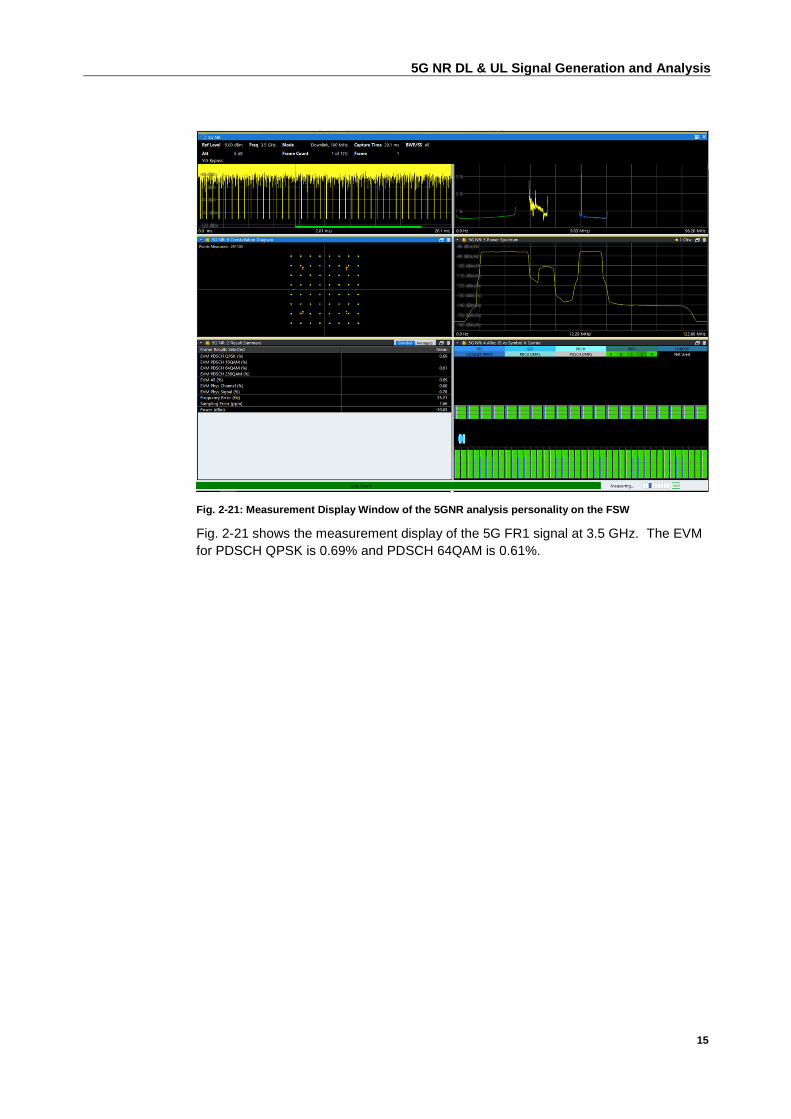
Fig. 2-21: Measurement Display Window of the 5GNR analysis personality on the FSW
Fig. 2-21 shows the measurement display of the 5G FR1 signal at 3.5 GHz. The EVM
for PDSCH QPSK is 0.69% and PDSCH 64QAM is 0.61%.

5G NR DL & UL Signal Generation and Analysis
16
2.2 Uplink signal generation and analysis
2.2.1 Signal generator setting on the SMW
Fig. 2-22: 5G NR main uplink configuration window on the SMW
Fig. 2-22 shows the main configuration window of the 5G NR physical layer baseband
signal generation. The steps numbers are marked in correct order in the figure to
configure the physical layer uplink parameters. Following Fig. 2-22:
1. Set Frequency: 3.5 GHz
2. Link direction : Uplink
3. Output power level: -10dBm
4. Node configuration settings from Fig. 2-22
Fig. 2-23: Node settings window configuration for carrier
Under node setting, the sub windows Carriers, TxBW needs to be configured as shown
in Fig. 2-23.
5G NR DL & UL Signal Generation and Analysis
17
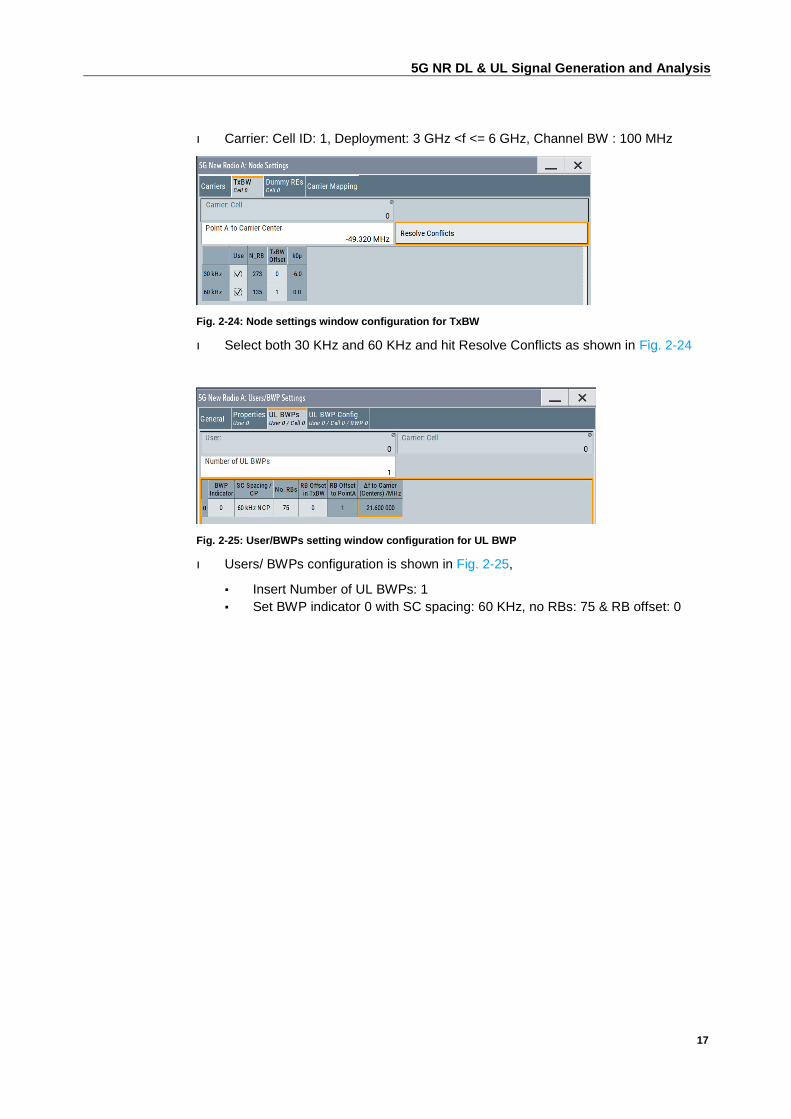
ı Carrier: Cell ID: 1, Deployment: 3 GHz <f <= 6 GHz, Channel BW : 100 MHz
Fig. 2-24: Node settings window configuration for TxBW
ı Select both 30 KHz and 60 KHz and hit Resolve Conflicts as shown in Fig. 2-24
Fig. 2-25: User/BWPs setting window configuration for UL BWP
ı Users/ BWPs configuration is shown in Fig. 2-25,
▪ Insert Number of UL BWPs: 1
▪ Set BWP indicator 0 with SC spacing: 60 KHz, no RBs: 75 & RB offset: 0
5G NR DL & UL Signal Generation and Analysis
18
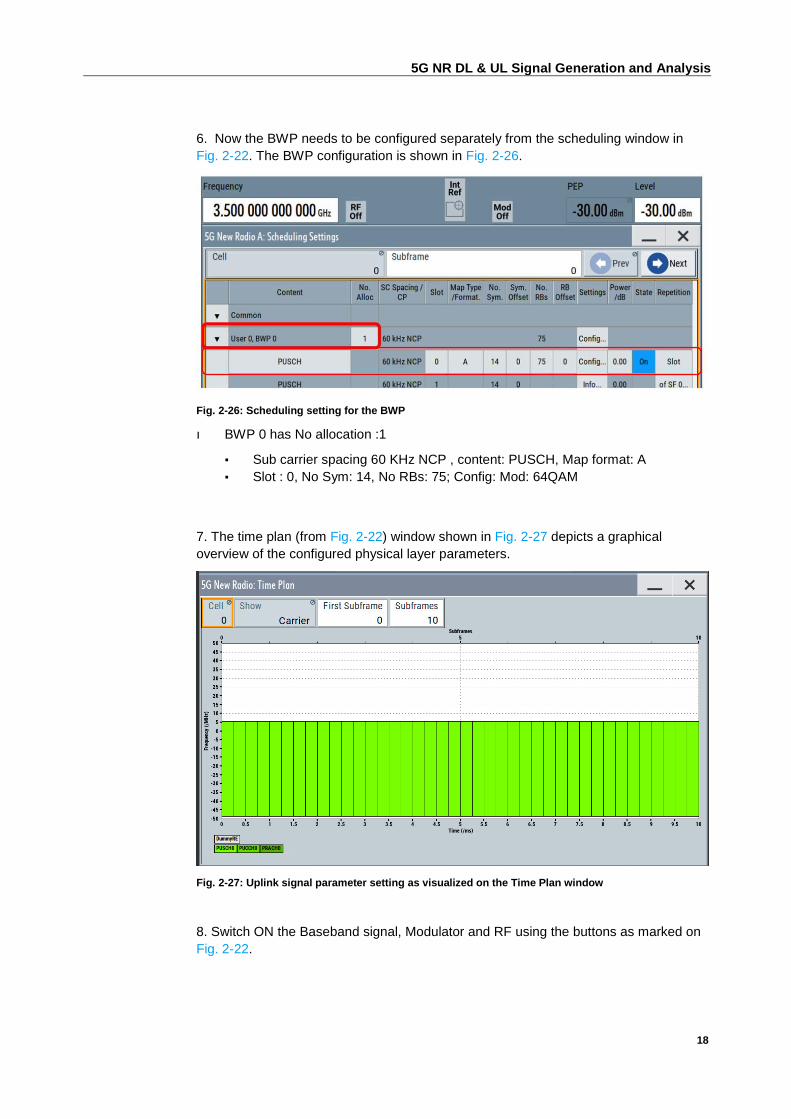
6. Now the BWP needs to be configured separately from the scheduling window in
Fig. 2-22. The BWP configuration is shown in Fig. 2-26.
Fig. 2-26: Scheduling setting for the BWP
ı BWP 0 has No allocation :1
▪ Sub carrier spacing 60 KHz NCP , content: PUSCH, Map format: A
▪ Slot : 0, No Sym: 14, No RBs: 75; Config: Mod: 64QAM
7. The time plan (from Fig. 2-22) window shown in Fig. 2-27 depicts a graphical
overview of the configured physical layer parameters.
Fig. 2-27: Uplink signal parameter setting as visualized on the Time Plan window
8. Switch ON the Baseband signal, Modulator and RF using the buttons as marked on
Fig. 2-22.

5G NR DL & UL Signal Generation and Analysis
19
2.2.2 Spectrum Analyzer setting on the FSW
ı To get started, switch ON the 5G NR measurement personality from MODE
Fig. 2-28: Measurement Modes selection window on the FSW
Fig. 2-29: 5G NR measurement Mode on the FSW
ı Set Frequency: 3.5 GHz as shown in Fig. 2-29
ı In the Signal description window, the signal parameter of the received signal
needs to be configured
5G NR DL & UL Signal Generation and Analysis
20
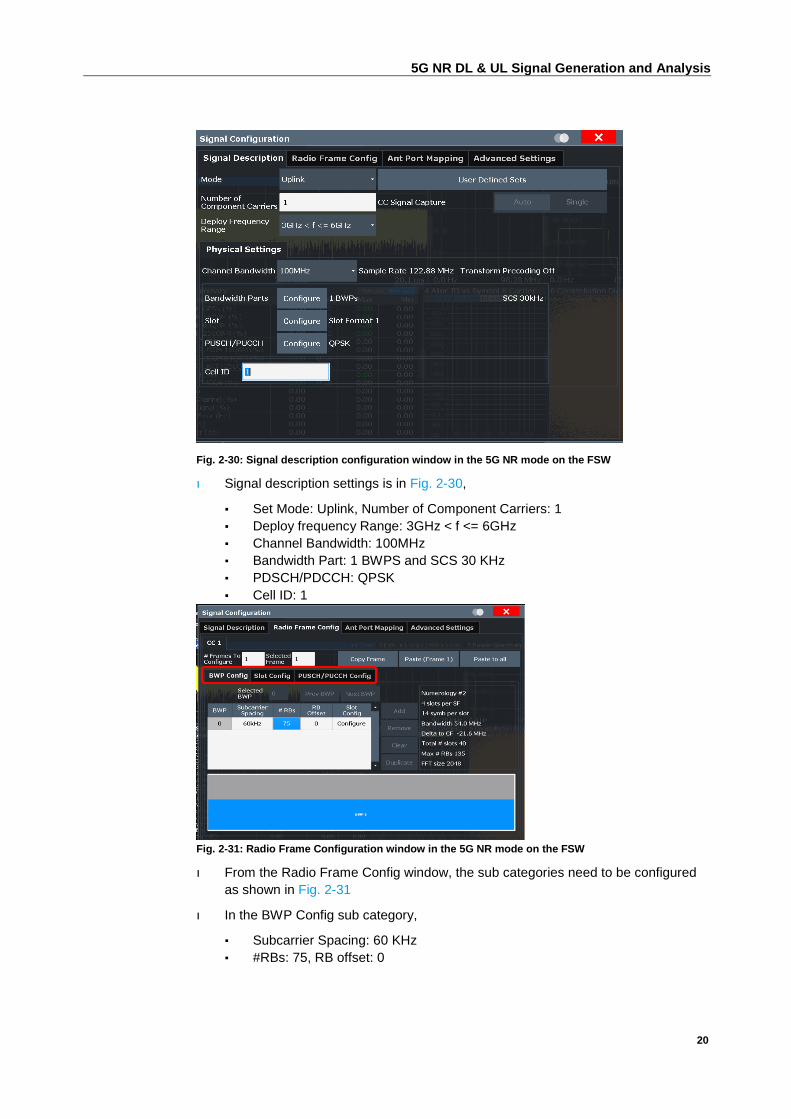
Fig. 2-30: Signal description configuration window in the 5G NR mode on the FSW
ı Signal description settings is in Fig. 2-30,
▪ Set Mode: Uplink, Number of Component Carriers: 1
▪ Deploy frequency Range: 3GHz < f <= 6GHz
▪ Channel Bandwidth: 100MHz
▪ Bandwidth Part: 1 BWPS and SCS 30 KHz
▪ PDSCH/PDCCH: QPSK
▪ Cell ID: 1
Fig. 2-31: Radio Frame Configuration window in the 5G NR mode on the FSW
ı From the Radio Frame Config window, the sub categories need to be configured
as shown in Fig. 2-31
ı In the BWP Config sub category,
▪ Subcarrier Spacing: 60 KHz
▪ #RBs: 75, RB offset: 0
5G NR DL & UL Signal Generation and Analysis
21
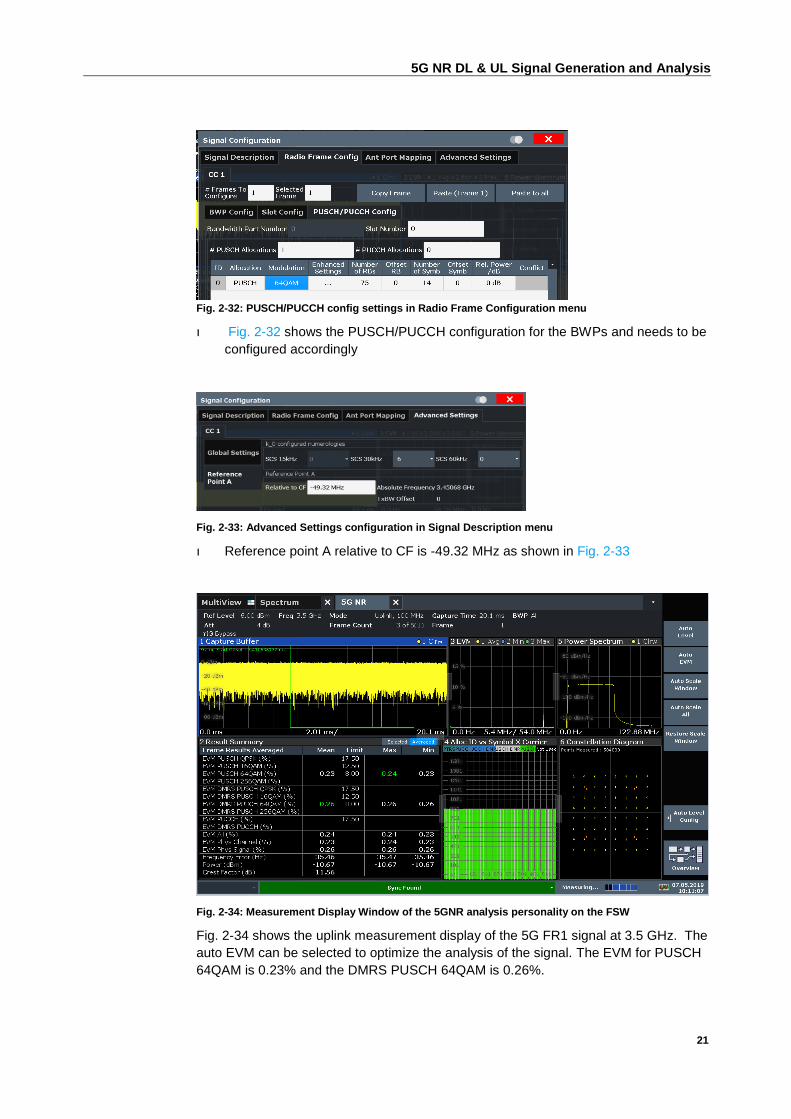
Fig. 2-32: PUSCH/PUCCH config settings in Radio Frame Configuration menu
ı Fig. 2-32 shows the PUSCH/PUCCH configuration for the BWPs and needs to be
configured accordingly
Fig. 2-33: Advanced Settings configuration in Signal Description menu
ı Reference point A relative to CF is -49.32 MHz as shown in Fig. 2-33
Fig. 2-34: Measurement Display Window of the 5GNR analysis personality on the FSW
Fig. 2-34 shows the uplink measurement display of the 5G FR1 signal at 3.5 GHz. The
auto EVM can be selected to optimize the analysis of the signal. The EVM for PUSCH
64QAM is 0.23% and the DMRS PUSCH 64QAM is 0.26%.

5G NR DL & UL Signal Generation and Analysis
22
2.2.3 Spectrum Analysis setting on the VSE
Configuring the 5G NR measurement personality on the VSE.
Fig. 2-35: 5G NR measurement Mode Signal Description configuration on the VSE
ı Fig. 2-35 shows the Signal Description configuration of the 5G NR measurement
modes
▪ Mode: Uplink, Deploy frequency Range: 3GHz < f <= 6GHz
▪ Channel Bandwidth: 100 MHz
▪ Synchronization: SCS 60KHz
▪ Bandwidth Parts: 1 BWPs
▪ PUSCH/PUCCH: 64QAM
▪ Cell ID: 1
Fig. 2-36: Radio Frame Config on the VSE

5G NR DL & UL Signal Generation and Analysis
23
ı From the Radio Frame Config window, the sub categories (shown in Fig. 2-36)
need to be configured
ı Under the BWP Config tab,
▪ Subcarrier Spacing: 60 KHz
▪ #RBs: 75, RB offset: 0
Fig. 2-37: PUSCH/PUCCH configuration settings in Radio Frame Config menu
ı PUSCH/PUCCH needs to be configured as shown in Fig. 2-37
▪ PUSCH 0, Mod: 64QAM, #RBs: 75, RB Offset: 0, #Symbols: 14, Offset
Symb: 0
Fig. 2-38: Advanced Settings configuration
ı Reference point A : Relative to CF is -49.32 MHz as shown in Fig. 2-38
5G NR DL & UL Signal Generation and Analysis
24
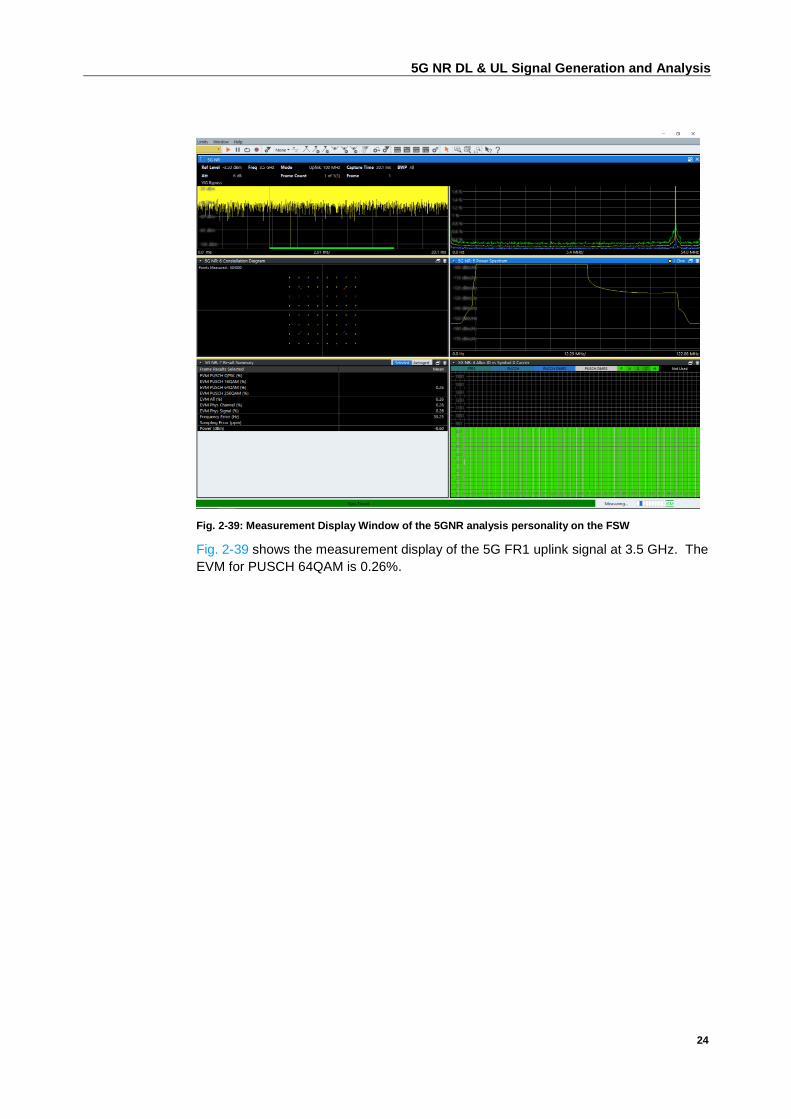
Fig. 2-39: Measurement Display Window of the 5GNR analysis personality on the FSW
Fig. 2-39 shows the measurement display of the 5G FR1 uplink signal at 3.5 GHz. The
EVM for PUSCH 64QAM is 0.26%.

Measurement result for FR1 & FR2 signals
25
3 Measurement result for FR1 & FR2 signals
This chapter is a summary of the measurement results for the signal quality of the
generated 5G NR uplink and downlink signals. The signals are centered at 3.5 GHz in
the FR1 band and at 26 GHz in FR2 band. The same signal has been used and the
measurement result are analyzed using the FSW on device software as well as the
VSE signal analysis software. The measurements are performed for both uplink and
downlink signals.
3.1 FR1 Measurement Results
This chapter is a summary of the measurement results for the signal quality of the
generated 5G NR uplink and downlink signals. The signals are centered at 3.5 GHz in
the FR1 band and at 26 GHz in FR2 band. The same signal has been used and the
measurement result are analyzed using the FSW on device software as well as the
VSE signal analysis software. And is the case for both uplink and downlink signals.
3.1.1 FR1 DL Measurement result on the FSW
Signal Description:
Frequency: 3.5 GHz (Downlink); Bandwidth: 100 MHz
SC spacing: 30 KHz NCP, RB offset: 80, SC offset: 6, Case: B, Position: 1100 0000
BWP 1: indicator 0 with SC spacing: 30 KHz, no RBs: 30 & RB offset: 135, Mod: QPSK
BWP2: indicator 1 with SC spacing: 60 KHz, no RBs: 35 & RB offset: 0, Mod: 64QAM
Fig. 3-1: Measurement Results of the 5GNR FR1 downlink signal at 3.5 GHz on the FSW
Fig. 3-1 shows the measurement display of the 5G FR1 downlink signal at 3.5 GHz.
The auto EVM can be selected to optimize the analysis of the signal. The EVM for
PDSCH QPSK is 0.62% and PDSCH 64QAM is 0.62%.

Measurement result for FR1 & FR2 signals
26
3.1.2 FR1 DL Measurement result on the VSE
Signal Description:
Frequency: 3.5 GHz (Downlink); Bandwidth: 100 MHz
SC spacing: 30 KHz NCP, RB offset: 80, SC offset: 6, Case: B, Position: 1100 0000
BWP 1: indicator 0 with SC spacing: 30 KHz, no RBs: 30 & RB offset: 135, Mod: QPSK
BWP2: indicator 1 with SC spacing: 60 KHz, no RBs: 35 & RB offset: 0, Mod: 64QAM
Fig. 3-2: Measurement Results of the 5GNR FR1 downlink signal at 3.5 GHz on the VSE
Fig. 3-2 shows the measurement display of the 5G FR1 downlink signal at 3.5 GHz.
The auto EVM can be selected to optimize the analysis of the signal. The EVM for
PDSCH QPSK is 0.69% and PDSCH 64QAM is 0.61%.
Measurement result for FR1 & FR2 signals
27
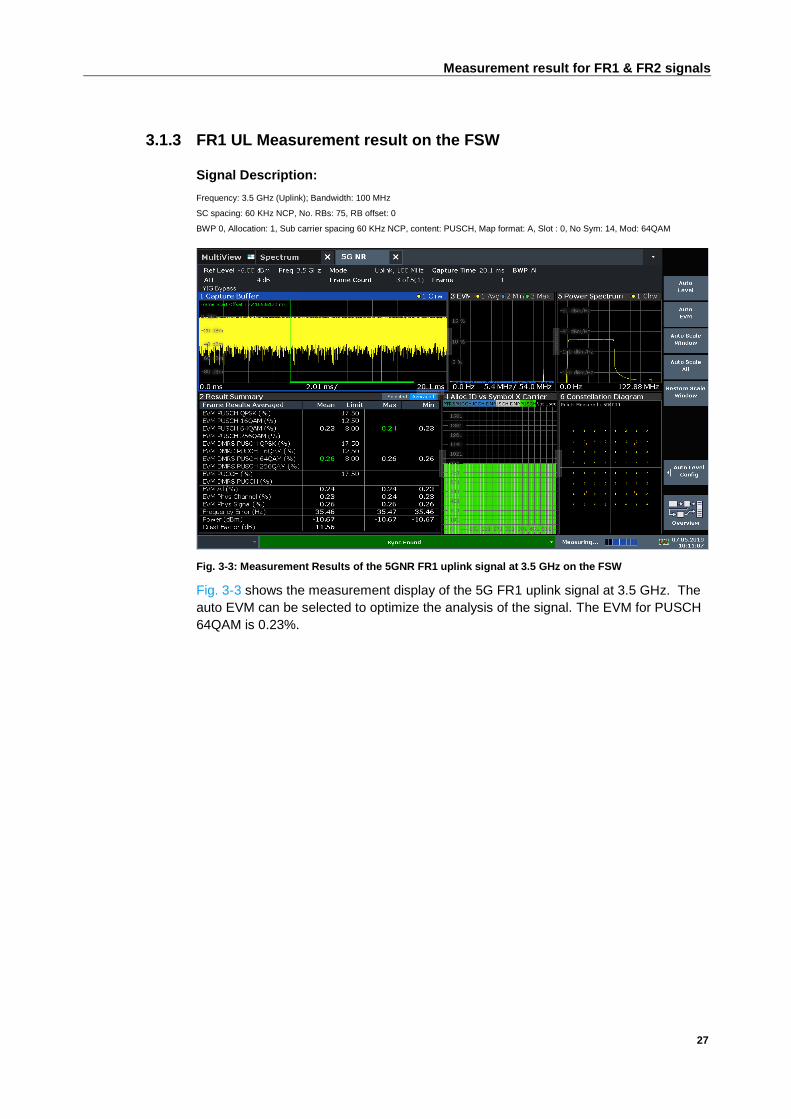
3.1.3 FR1 UL Measurement result on the FSW
Signal Description:
Frequency: 3.5 GHz (Uplink); Bandwidth: 100 MHz
SC spacing: 60 KHz NCP, No. RBs: 75, RB offset: 0
BWP 0, Allocation: 1, Sub carrier spacing 60 KHz NCP, content: PUSCH, Map format: A, Slot : 0, No Sym: 14, Mod: 64QAM
Fig. 3-3: Measurement Results of the 5GNR FR1 uplink signal at 3.5 GHz on the FSW
Fig. 3-3 shows the measurement display of the 5G FR1 uplink signal at 3.5 GHz. The
auto EVM can be selected to optimize the analysis of the signal. The EVM for PUSCH
64QAM is 0.23%.

Measurement result for FR1 & FR2 signals
28
3.1.4 FR1 UL Measurement result on the VSE
Signal Description:
Frequency: 3.5 GHz (Uplink); Bandwidth: 100 MHz
SC spacing: 60 KHz NCP, No. RBs: 75, RB offset: 0
BWP 0, Allocation: 1, Sub carrier spacing 60 KHz NCP, content: PUSCH, Map format: A, Slot : 0, No Sym: 14, Mod: 64QAM
Fig. 3-4: Measurement Results of the 5GNR FR1 uplink signal at 3.5 GHz on the VSE
Fig. 3-4 shows the measurement display of the 5G FR1 uplink signal at 3.5 GHz. The
auto EVM can be selected to optimize the analysis of the signal. The EVM for PUSCH
64QAM is 0.26%.
Measurement result for FR1 & FR2 signals
29
3.2 FR2 Measurement Results
3.2.1 FR2 DL Measurement result on the FSW
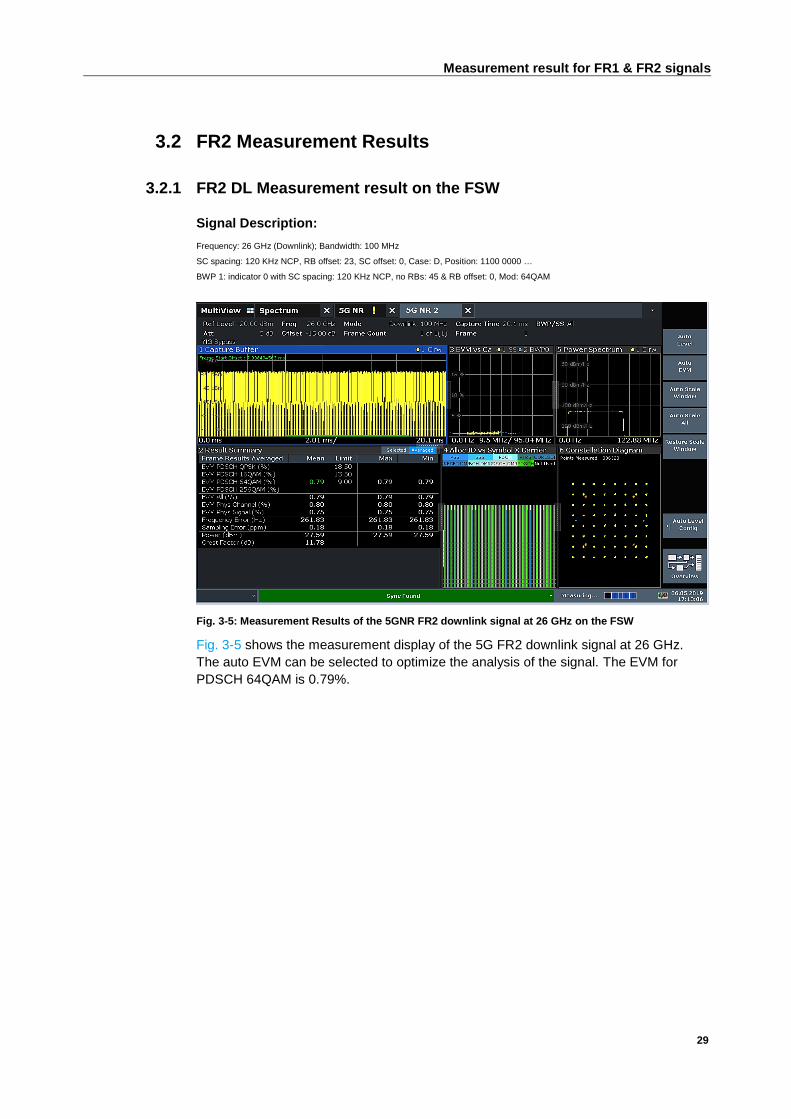
Signal Description:
Frequency: 26 GHz (Downlink); Bandwidth: 100 MHz
SC spacing: 120 KHz NCP, RB offset: 23, SC offset: 0, Case: D, Position: 1100 0000 …
BWP 1: indicator 0 with SC spacing: 120 KHz NCP, no RBs: 45 & RB offset: 0, Mod: 64QAM
Fig. 3-5: Measurement Results of the 5GNR FR2 downlink signal at 26 GHz on the FSW
Fig. 3-5 shows the measurement display of the 5G FR2 downlink signal at 26 GHz.
The auto EVM can be selected to optimize the analysis of the signal. The EVM for
PDSCH 64QAM is 0.79%.
Measurement result for FR1 & FR2 signals
30
3.2.2 FR2 DL Measurement result on the VSE
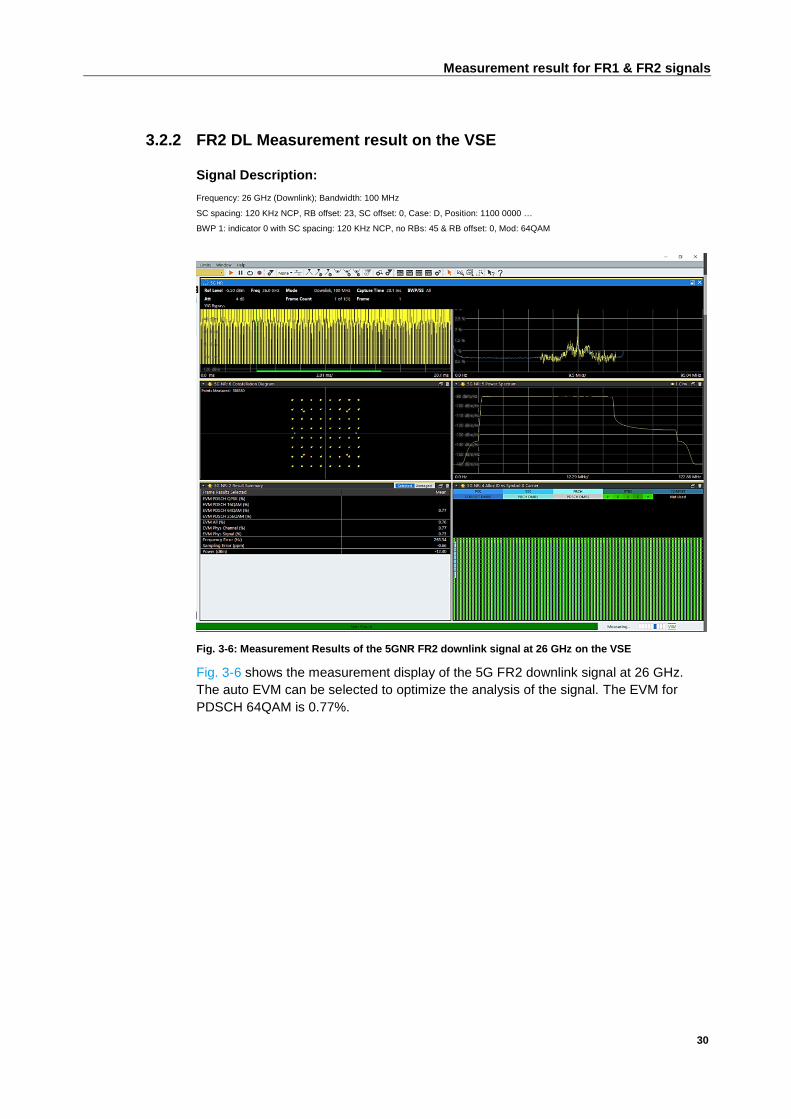
Signal Description:
Frequency: 26 GHz (Downlink); Bandwidth: 100 MHz
SC spacing: 120 KHz NCP, RB offset: 23, SC offset: 0, Case: D, Position: 1100 0000 …
BWP 1: indicator 0 with SC spacing: 120 KHz NCP, no RBs: 45 & RB offset: 0, Mod: 64QAM
Fig. 3-6: Measurement Results of the 5GNR FR2 downlink signal at 26 GHz on the VSE
Fig. 3-6 shows the measurement display of the 5G FR2 downlink signal at 26 GHz.
The auto EVM can be selected to optimize the analysis of the signal. The EVM for
PDSCH 64QAM is 0.77%.
Measurement result for FR1 & FR2 signals
31
3.2.3 FR2 UL Measurement result on the FSW
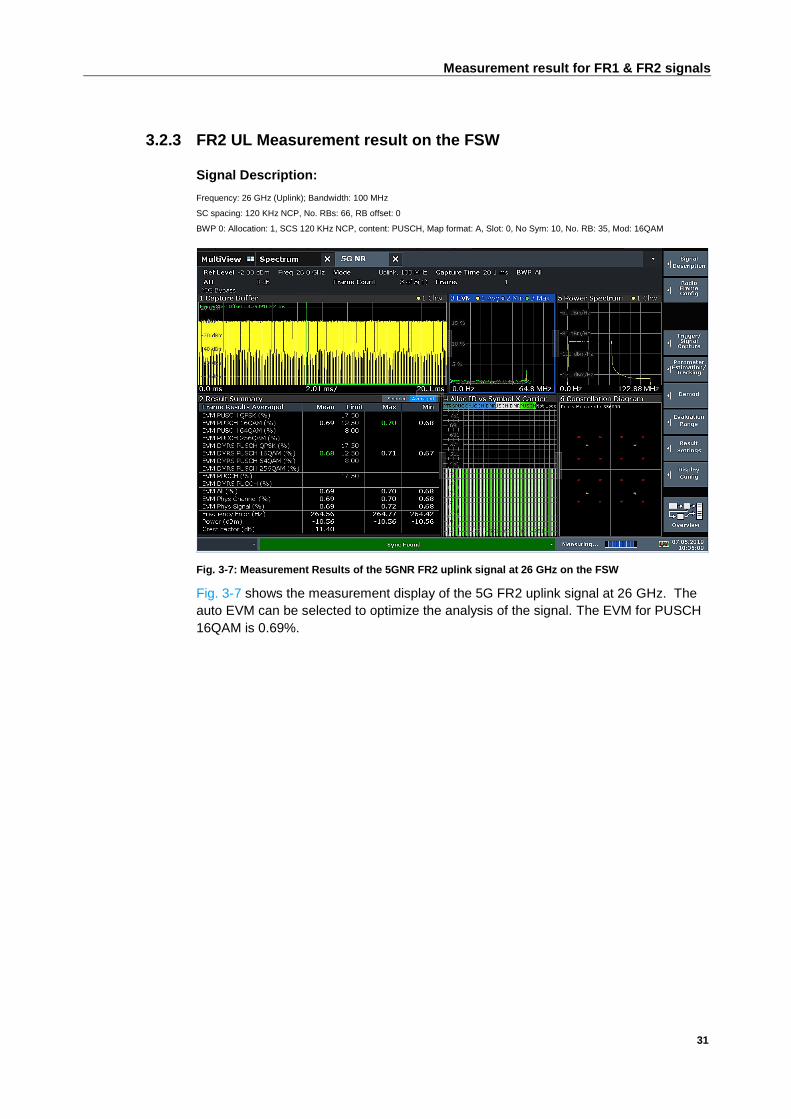
Signal Description:
Frequency: 26 GHz (Uplink); Bandwidth: 100 MHz
SC spacing: 120 KHz NCP, No. RBs: 66, RB offset: 0
BWP 0: Allocation: 1, SCS 120 KHz NCP, content: PUSCH, Map format: A, Slot: 0, No Sym: 10, No. RB: 35, Mod: 16QAM
Fig. 3-7: Measurement Results of the 5GNR FR2 uplink signal at 26 GHz on the FSW
Fig. 3-7 shows the measurement display of the 5G FR2 uplink signal at 26 GHz. The
auto EVM can be selected to optimize the analysis of the signal. The EVM for PUSCH
16QAM is 0.69%.
Measurement result for FR1 & FR2 signals
32
3.2.4 FR2 UL Measurement result on the VSE
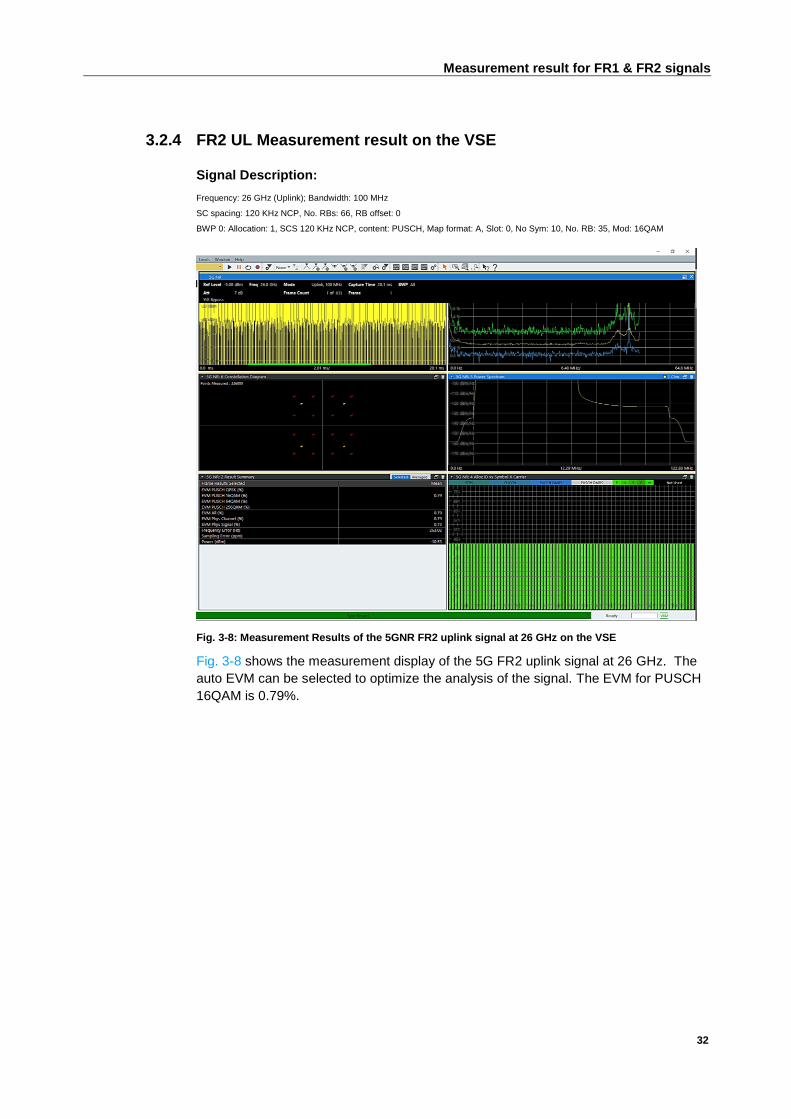
Signal Description:
Frequency: 26 GHz (Uplink); Bandwidth: 100 MHz
SC spacing: 120 KHz NCP, No. RBs: 66, RB offset: 0
BWP 0: Allocation: 1, SCS 120 KHz NCP, content: PUSCH, Map format: A, Slot: 0, No Sym: 10, No. RB: 35, Mod: 16QAM
Fig. 3-8: Measurement Results of the 5GNR FR2 uplink signal at 26 GHz on the VSE
Fig. 3-8 shows the measurement display of the 5G FR2 uplink signal at 26 GHz. The
auto EVM can be selected to optimize the analysis of the signal. The EVM for PUSCH
16QAM is 0.79%.

Advanced Measurement Methods
33
4 Advanced Measurement Methods
4.1 Phase Noise
Wireless communication at mmW frequencies provide many challenges. Phase noise
effects are very significant at those frequencies. The two type of errors due to phase
noise are Common Phase Error (CPE) and Inter-Carrier Interference (ICI).
ICI is addressed through wider subcarrier spacing (SCS): Data and control channel
could utilize 60 or 120 KHz and synchronization Signal Block (SSB) can utilize the 120
or 240 KHz.
The CPE is addressed by adding Phase Tracking Reference Signal (PTRS). The
PTRS is optional in the standard and can be applied both in the downlink and as well
in the uplink. This should be implemented in the receiver to compensate for the CPE.
Nevertheless, in order to emulate the phase noise in the development phase, in the
AWGN block of the SMW, there is a configurable sub block for Phase Noise.
Fig. 4-1: Phase noise configuration window on the SMW vector signal generator
Fig. 4-1 shows the window to configure phase noise. On the right side of this window,
there is a numerical representation model and on the left side, there is a graphical
representation model.
The frequencies and the corresponding phase noise parameters can be adjusted here.
The profile can be saved and loaded here. After activation, the current signal quality
will be adjusted with the controlled phase noise setting. This enables the testing of
performance of the DUT behavior under different emulated phase noise settings.
Advanced Measurement Methods
34
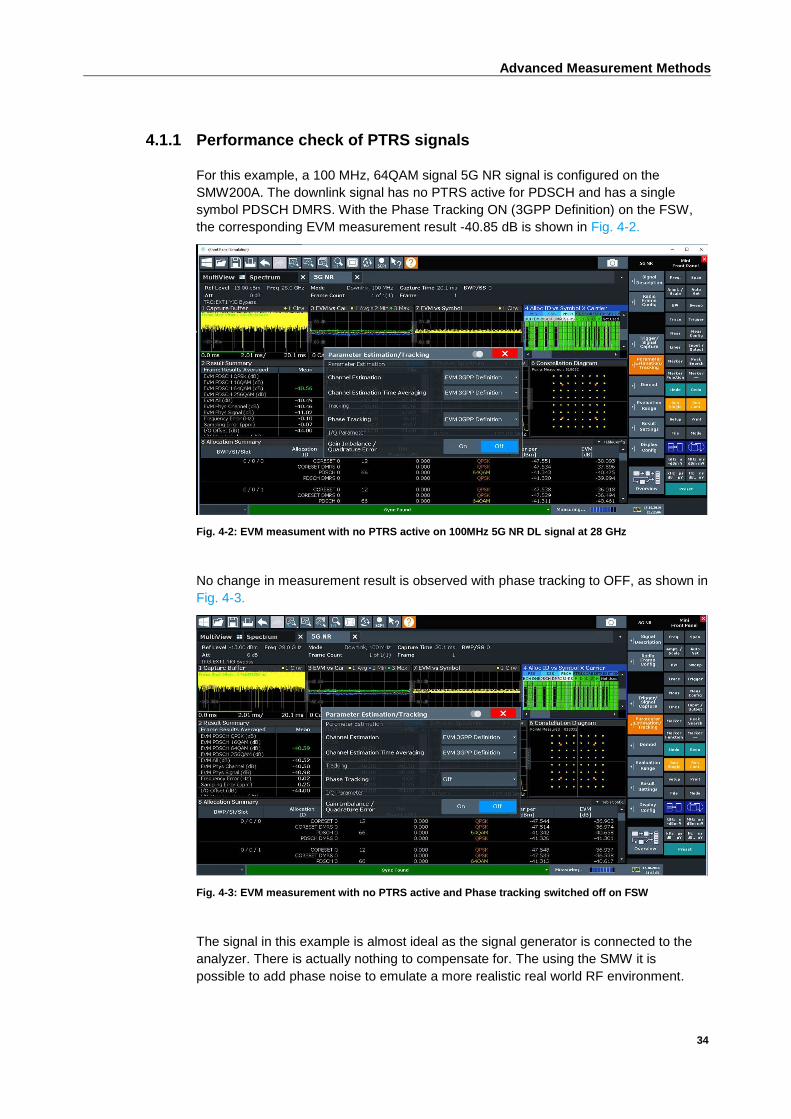
4.1.1 Performance check of PTRS signals
For this example, a 100 MHz, 64QAM signal 5G NR signal is configured on the
SMW200A. The downlink signal has no PTRS active for PDSCH and has a single
symbol PDSCH DMRS. With the Phase Tracking ON (3GPP Definition) on the FSW,
the corresponding EVM measurement result -40.85 dB is shown in Fig. 4-2.
Fig. 4-2: EVM measument with no PTRS active on 100MHz 5G NR DL signal at 28 GHz
No change in measurement result is observed with phase tracking to OFF, as shown in
Fig. 4-3.
Fig. 4-3: EVM measurement with no PTRS active and Phase tracking switched off on FSW
The signal in this example is almost ideal as the signal generator is connected to the
analyzer. There is actually nothing to compensate for. The using the SMW it is
possible to add phase noise to emulate a more realistic real world RF environment.
Advanced Measurement Methods
35
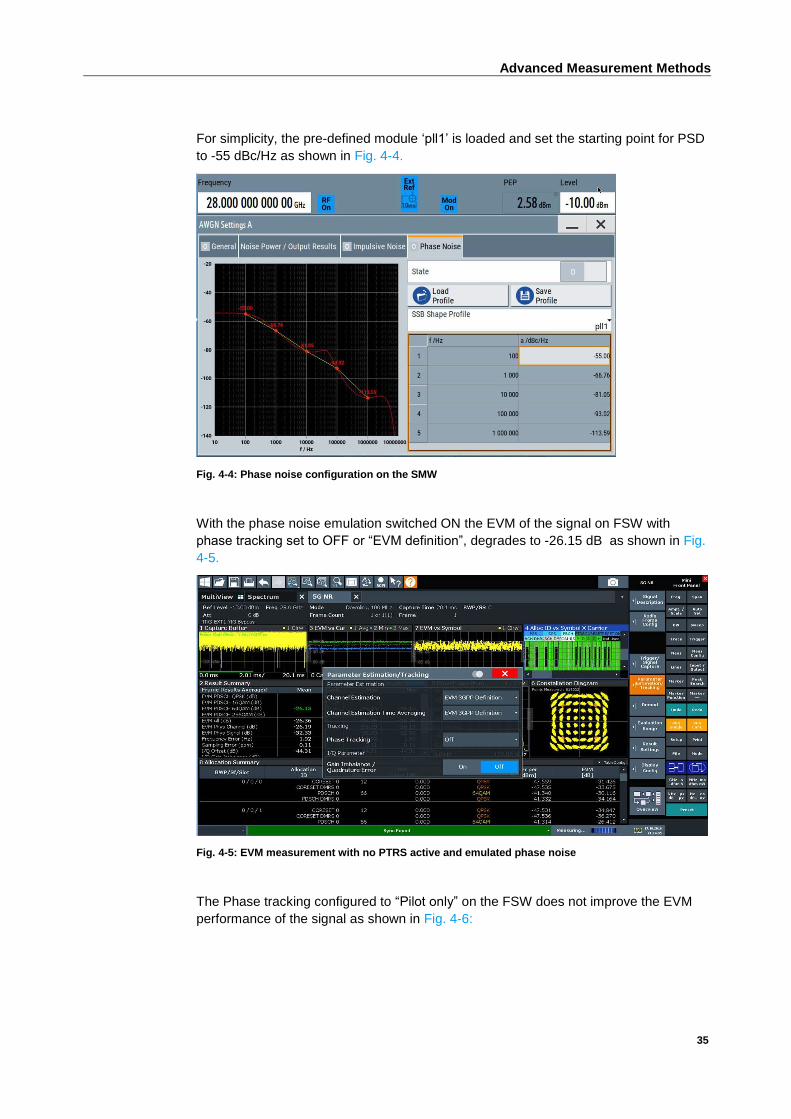
For simplicity, the pre-defined module ‘pll1’ is loaded and set the starting point for PSD
to -55 dBc/Hz as shown in Fig. 4-4.
Fig. 4-4: Phase noise configuration on the SMW
With the phase noise emulation switched ON the EVM of the signal on FSW with
phase tracking set to OFF or “EVM definition”, degrades to -26.15 dB as shown in Fig.
4-5.
Fig. 4-5: EVM measurement with no PTRS active and emulated phase noise
The Phase tracking configured to “Pilot only” on the FSW does not improve the EVM
performance of the signal as shown in Fig. 4-6:
Advanced Measurement Methods
36
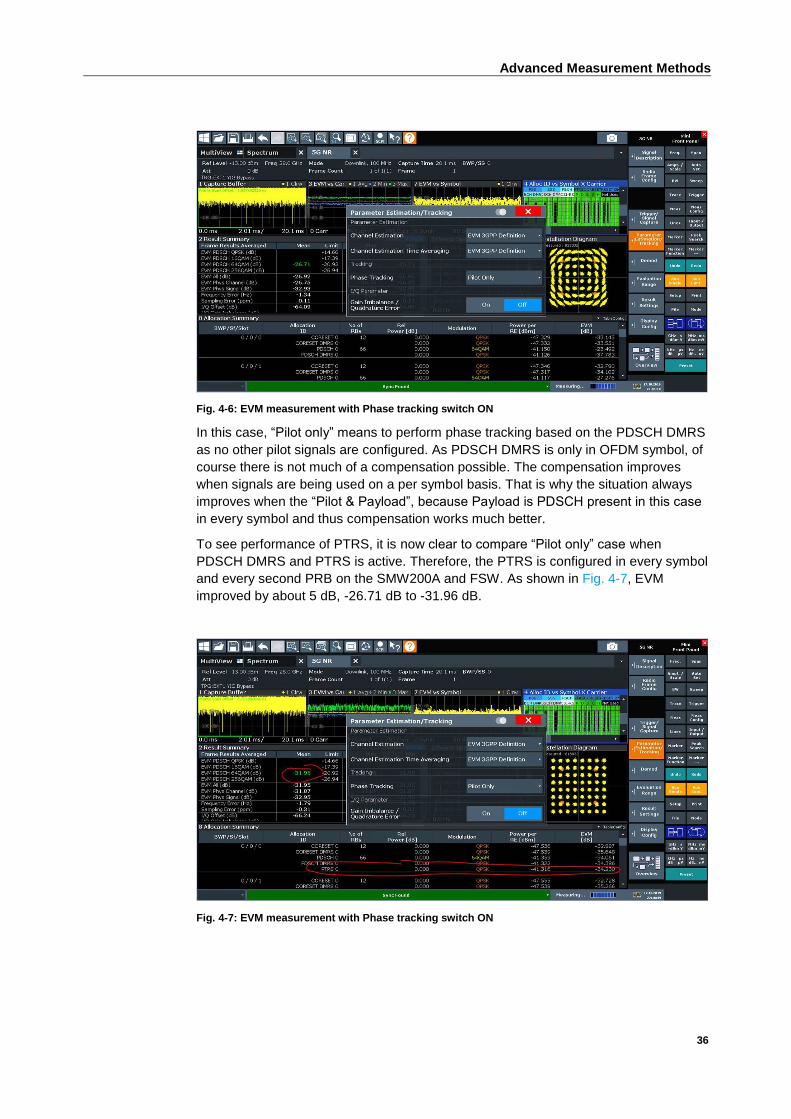
Fig. 4-6: EVM measurement with Phase tracking switch ON
In this case, “Pilot only” means to perform phase tracking based on the PDSCH DMRS
as no other pilot signals are configured. As PDSCH DMRS is only in OFDM symbol, of
course there is not much of a compensation possible. The compensation improves
when signals are being used on a per symbol basis. That is why the situation always
improves when the “Pilot & Payload”, because Payload is PDSCH present in this case
in every symbol and thus compensation works much better.
To see performance of PTRS, it is now clear to compare “Pilot only” case when
PDSCH DMRS and PTRS is active. Therefore, the PTRS is configured in every symbol
and every second PRB on the SMW200A and FSW. As shown in Fig. 4-7, EVM
improved by about 5 dB, -26.71 dB to -31.96 dB.
Fig. 4-7: EVM measurement with Phase tracking switch ON
Advanced Measurement Methods
37
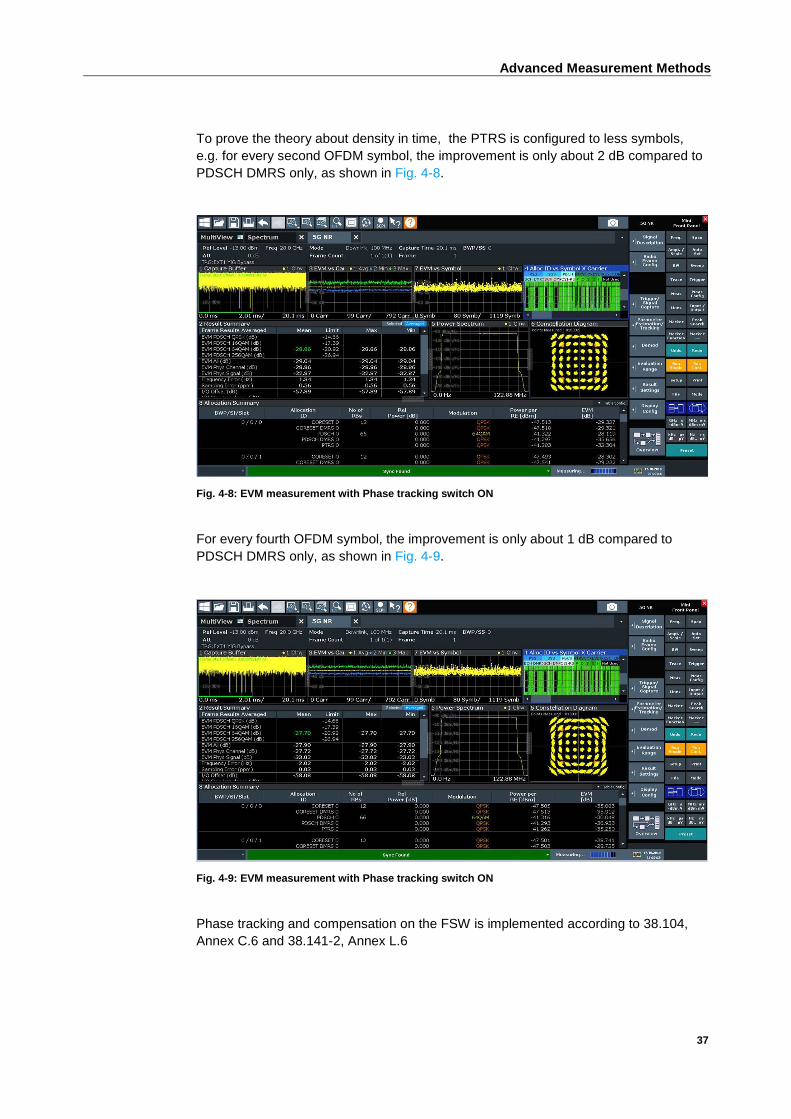
To prove the theory about density in time, the PTRS is configured to less symbols,
e.g. for every second OFDM symbol, the improvement is only about 2 dB compared to
PDSCH DMRS only, as shown in Fig. 4-8.
Fig. 4-8: EVM measurement with Phase tracking switch ON
For every fourth OFDM symbol, the improvement is only about 1 dB compared to
PDSCH DMRS only, as shown in Fig. 4-9.
Fig. 4-9: EVM measurement with Phase tracking switch ON
Phase tracking and compensation on the FSW is implemented according to 38.104,
Annex C.6 and 38.141-2, Annex L.6
Advanced Measurement Methods
38
4.2 DC sub carrier
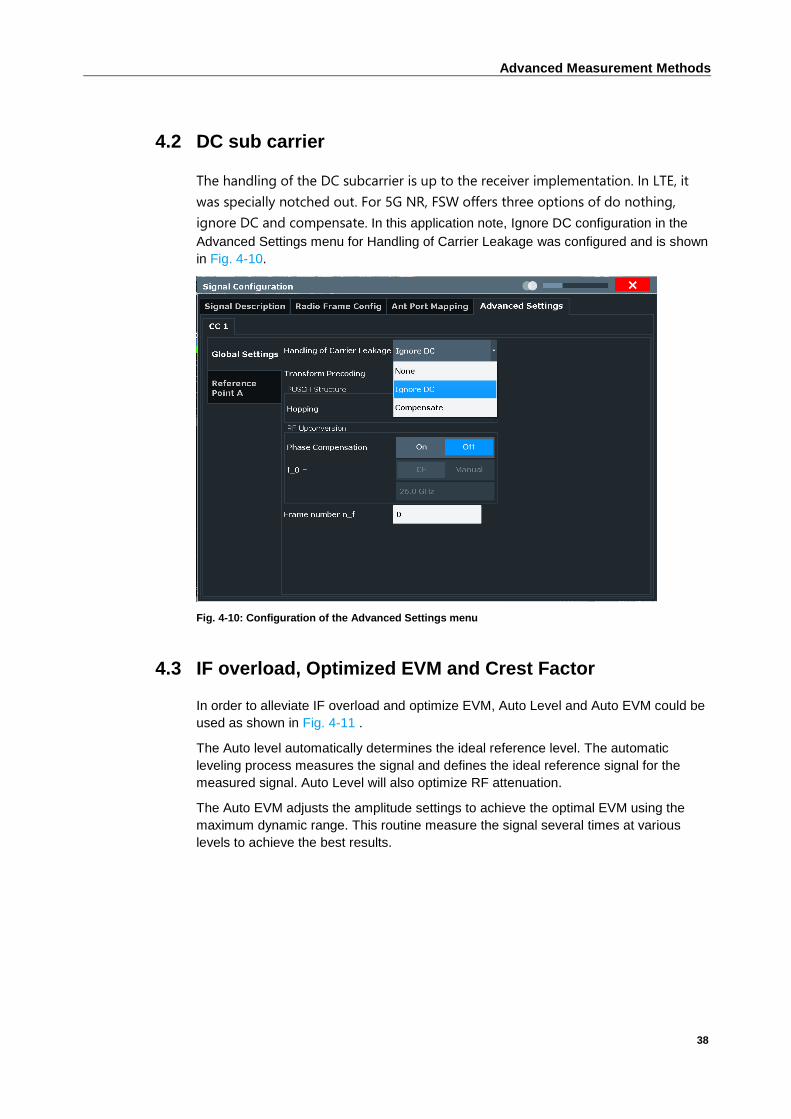
The handling of the DC subcarrier is up to the receiver implementation. In LTE, it
was specially notched out. For 5G NR, FSW offers three options of do nothing,
ignore DC and compensate. In this application note, Ignore DC configuration in the
Advanced Settings menu for Handling of Carrier Leakage was configured and is shown
in Fig. 4-10.
Fig. 4-10: Configuration of the Advanced Settings menu
4.3 IF overload, Optimized EVM and Crest Factor
In order to alleviate IF overload and optimize EVM, Auto Level and Auto EVM could be
used as shown in Fig. 4-11 .
The Auto level automatically determines the ideal reference level. The automatic
leveling process measures the signal and defines the ideal reference signal for the
measured signal. Auto Level will also optimize RF attenuation.
The Auto EVM adjusts the amplitude settings to achieve the optimal EVM using the
maximum dynamic range. This routine measure the signal several times at various
levels to achieve the best results.

Advanced Measurement Methods
39
Fig. 4-11: Auto Set configuration window
4.4 Capture time and Tigger setting
Fig. 4-12: Signal and Trigger configuration window
In order to analyze the signal faster and only the part of the signal that is of interest,
i.e. for signal capturing length less than the default 20.1ms, the settings can be
configured for the Trigger and Signal capture window as shown in Fig. 4-12. The
capture time can be set as desired (for example here is set to 5 ms). The trigger
source is set as IF power and the corresponding lF power lever and time offset is
configured as shown.

Advanced Measurement Methods
40
Fig. 4-13: Segmented Capture configuration window
In order to measure and analyze a particular section of the frame, the segmented
capture window can be configured and the segment length can be predefined and
analyzed. The settings are shown in Fig. 4-13 and segment length of 5ms is shown in
the example.
4.5 Parameter/ Estimation Tracking
In order to optimize and compensate measurement results for various errors, the
parameter/estimation tracking feature can be used. The channel estimation can be
configured for Pilot and payload, linear interpolation or according to the 3GPP EVM
specification. As a measure of good practice for the channel estimation setting, the
pilot and payload can be configured, which performs the channel estimation by
examining both the reference signal and the payload resource elements. The linear
interpolation can also be configured but in this case, the channel estimation is
performed by interpolating the missing information.
Fig. 4-14: Parameter Estimation/ Tracking menu configuration
Fig. 4-14 shows the tracking configuration menu. The channel estimation time
averaging can be performed for each allocation or every 10ms according to the 3GPP
definition. For phase tracking, there is a possibility of choosing between 3 options.
Phase tracking with "pilot only" will enable phase estimation using only the reference
signal. The "Pilot and Payload" option uses the reference and the payload resource

Advanced Measurement Methods
41
elements for phase estimation and lastly the 3GPP EVM Definition is according to the
3GPP specification.
4.6 Slot Allocation and Slot format
5G NR supports FDD and TDD in the duplex mode.
Slot formats are a fundamentally new concept in 5G NR. Unlike LTE, 5G NR doesnot
have defined UL-DL configurations. In 5G NR there are 62 different slot formats
defined. They help to realize different downlink and uplink allocations, particularly in
time division duplex (TDD) mode.
Based on an example with 120 kHz subcarrier spacing, the chapter explains some
unique characteristics compared to TD-LTE, such as the mismatch between required
periodicity and subframe duration.
FDD uses only slot format "0" (downlink) or slot format "1" (uplink) which is dependent
on direction. In case of TDD, the information is provided via RRC signaling or by
Downlink Control Information DCI (Slot format indicator) transmitted on PDCCH.
As an example, for FR2 TDD-UL-DL configuration,
▪ SCS: 120KHz, Periodicity (ms): 1.25, NrDL slots: 7, NrDL Sym: 6, NrUL slots:
2 and NrULSym: 4
Based on this information,
Fig. 4-15: Slot allocation for FR2 TDD-UL-DL 5G NR configuration
A slot is 14 symbols and Subframe is 1ms. However, the periodicity is 1.25ms. This
means the subframe boundaries and periodicity do not align and makes signal
configuration more challenging. The flexible special slot in Fig. 4-15 contains 6 DL
symbols, followed by 4 flexible symbols and 4 UL symbols.

Advanced Measurement Methods
42
4.7 Generate and analyze 5G NR TDD signals
In this chapter, the generation of the uplink portion of a 5G NR TDD signal is
explained. The 5G NR signal uses a subcarrier spacing of 120 kHz by applying a
periodicity of 1.25 ms and is generated with the SMW vector signal generator. Detailed
signal analysis is performed using the FSW signal and spectrum analyzer. Fig. 4-16
shows the TDD frame structure.
Fig. 4-16: 5G NR Uplink TDD frame structure
The configuration steps are explained for setting up the frame structure shown in Fig.
4-16. The frame comprises of 2 subframes. In the first subframes, slot #7 is special slot
with 6 DL symbols, 4 blank symbols and 4 UL symbols. The second sub frame has 2
UL slots (slot #2 & #3) and slot #1 is a special flexible slot.
4.7.1 Signal Generator configuration
Fig. 4-17: Subframe 0 configuration for 5G NR TDD UL
Fig. 4-17 shows the signal generation configuration of the first subframe. In this case,
the first 7 DL slots are left blank. Slot #7 is configured with Map format B. Out of the 14
symbols in slot #8, the first 10 symbols are left blank and 4 UL symbols are configured
with a symbol offset of 10 symbols.
Advanced Measurement Methods
43
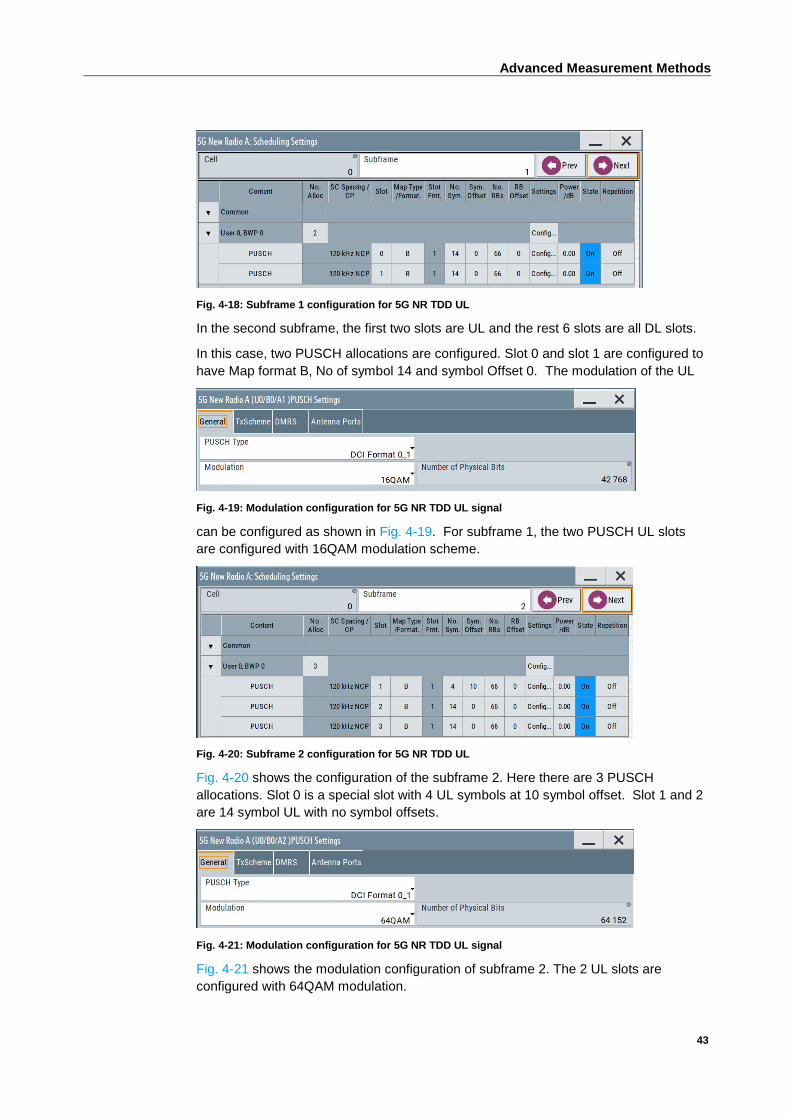
Fig. 4-18: Subframe 1 configuration for 5G NR TDD UL
In the second subframe, the first two slots are UL and the rest 6 slots are all DL slots.
In this case, two PUSCH allocations are configured. Slot 0 and slot 1 are configured to
have Map format B, No of symbol 14 and symbol Offset 0. The modulation of the UL
Fig. 4-19: Modulation configuration for 5G NR TDD UL signal
can be configured as shown in Fig. 4-19. For subframe 1, the two PUSCH UL slots
are configured with 16QAM modulation scheme.
Fig. 4-20: Subframe 2 configuration for 5G NR TDD UL
Fig. 4-20 shows the configuration of the subframe 2. Here there are 3 PUSCH
allocations. Slot 0 is a special slot with 4 UL symbols at 10 symbol offset. Slot 1 and 2
are 14 symbol UL with no symbol offsets.
Fig. 4-21: Modulation configuration for 5G NR TDD UL signal
Fig. 4-21 shows the modulation configuration of subframe 2. The 2 UL slots are
configured with 64QAM modulation.
Advanced Measurement Methods
44
4.7.2 Spectrum Analyzer Configuration
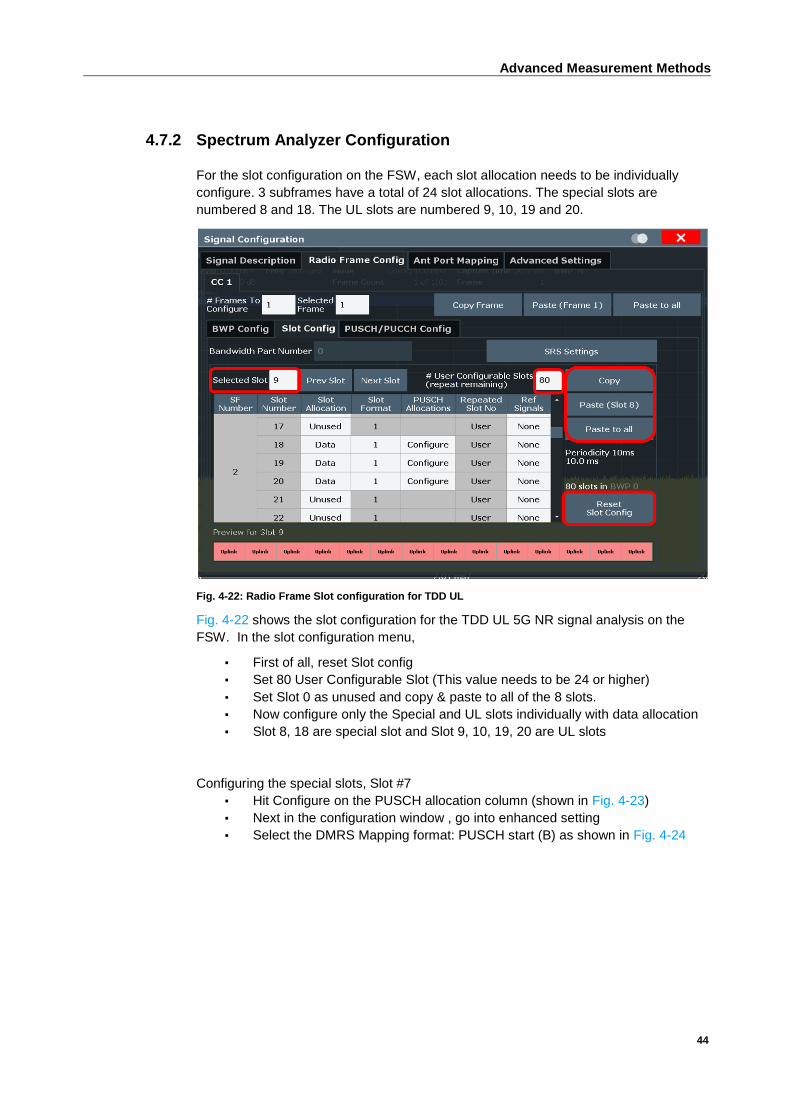
For the slot configuration on the FSW, each slot allocation needs to be individually
configure. 3 subframes have a total of 24 slot allocations. The special slots are
numbered 8 and 18. The UL slots are numbered 9, 10, 19 and 20.
Fig. 4-22: Radio Frame Slot configuration for TDD UL
Fig. 4-22 shows the slot configuration for the TDD UL 5G NR signal analysis on the
FSW. In the slot configuration menu,
▪ First of all, reset Slot config
▪ Set 80 User Configurable Slot (This value needs to be 24 or higher)
▪ Set Slot 0 as unused and copy & paste to all of the 8 slots.
▪ Now configure only the Special and UL slots individually with data allocation
▪ Slot 8, 18 are special slot and Slot 9, 10, 19, 20 are UL slots
Configuring the special slots, Slot #7
▪ Hit Configure on the PUSCH allocation column (shown in Fig. 4-23)
▪ Next in the configuration window , go into enhanced setting
▪ Select the DMRS Mapping format: PUSCH start (B) as shown in Fig. 4-24

Advanced Measurement Methods
45
Fig. 4-23: 5G NR TDD UL slot configuration
Fig. 4-24: PUSCH enhanced settings configuration window
Advanced Measurement Methods
46
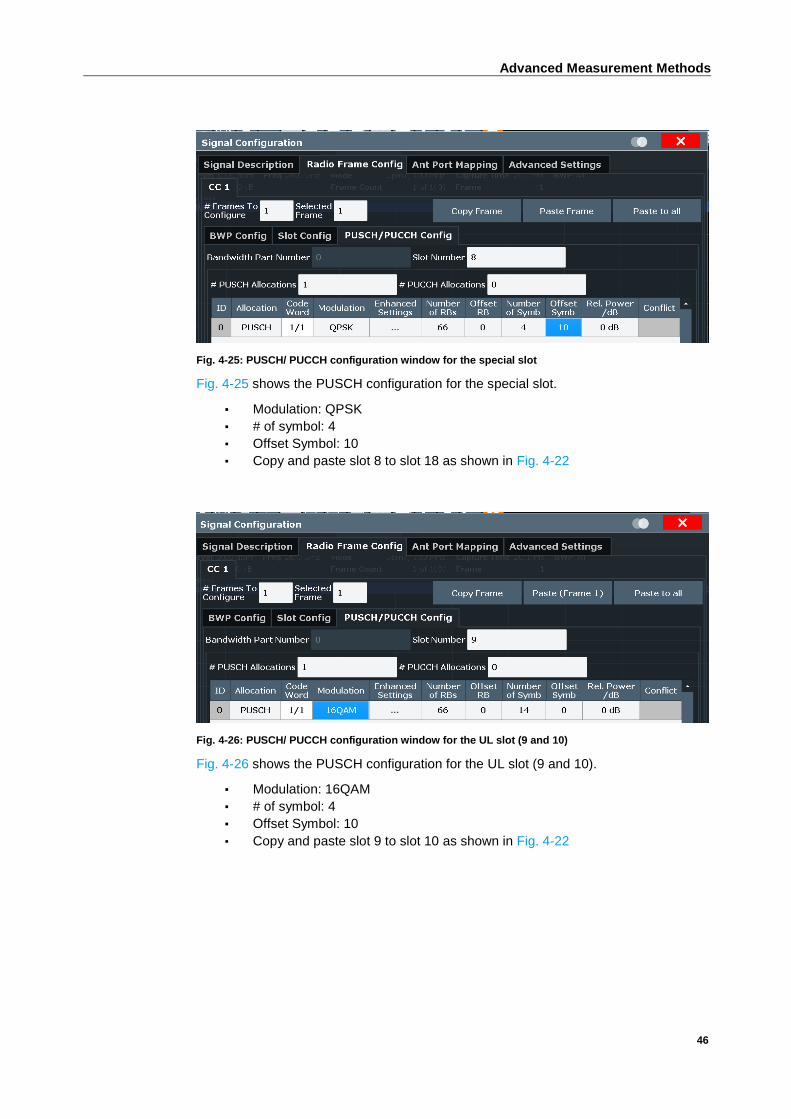
Fig. 4-25: PUSCH/ PUCCH configuration window for the special slot
Fig. 4-25 shows the PUSCH configuration for the special slot.
▪ Modulation: QPSK
▪ # of symbol: 4
▪ Offset Symbol: 10
▪ Copy and paste slot 8 to slot 18 as shown in Fig. 4-22
Fig. 4-26: PUSCH/ PUCCH configuration window for the UL slot (9 and 10)
Fig. 4-26 shows the PUSCH configuration for the UL slot (9 and 10).
▪ Modulation: 16QAM
▪ # of symbol: 4
▪ Offset Symbol: 10
▪ Copy and paste slot 9 to slot 10 as shown in Fig. 4-22
Advanced Measurement Methods
47
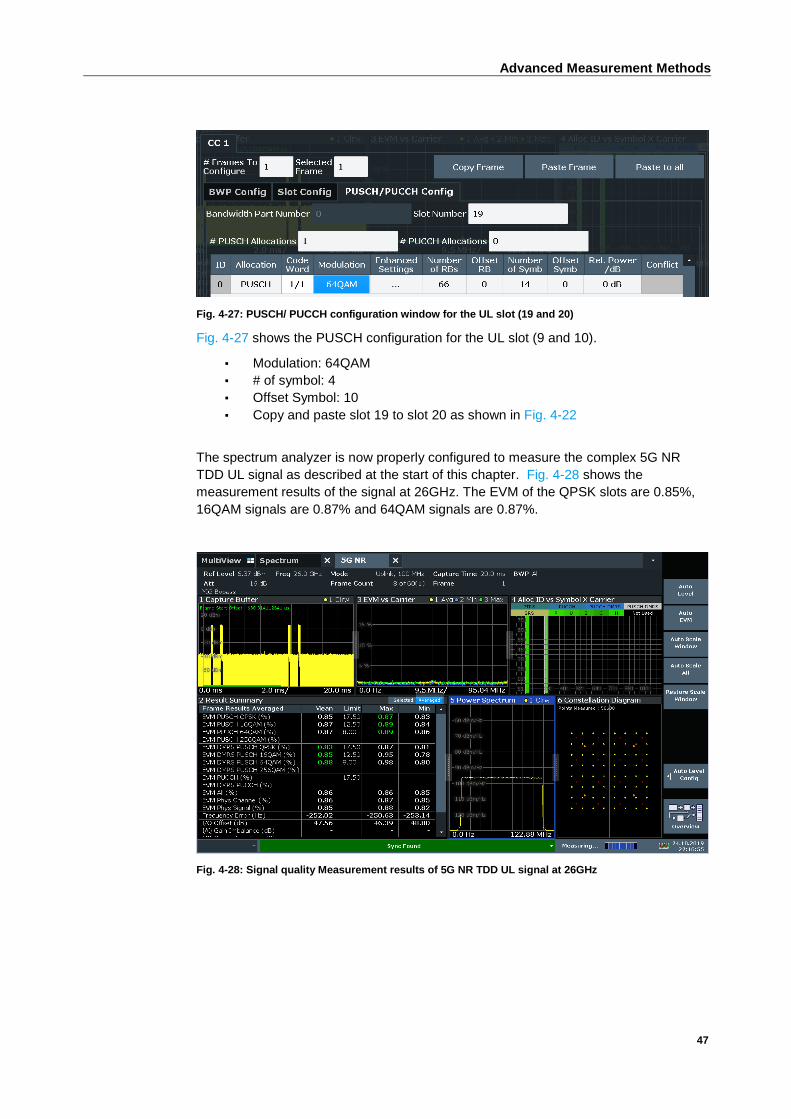
Fig. 4-27: PUSCH/ PUCCH configuration window for the UL slot (19 and 20)
Fig. 4-27 shows the PUSCH configuration for the UL slot (9 and 10).
▪ Modulation: 64QAM
▪ # of symbol: 4
▪ Offset Symbol: 10
▪ Copy and paste slot 19 to slot 20 as shown in Fig. 4-22
The spectrum analyzer is now properly configured to measure the complex 5G NR
TDD UL signal as described at the start of this chapter. Fig. 4-28 shows the
measurement results of the signal at 26GHz. The EVM of the QPSK slots are 0.85%,
16QAM signals are 0.87% and 64QAM signals are 0.87%.
Fig. 4-28: Signal quality Measurement results of 5G NR TDD UL signal at 26GHz
Advanced Measurement Methods
48
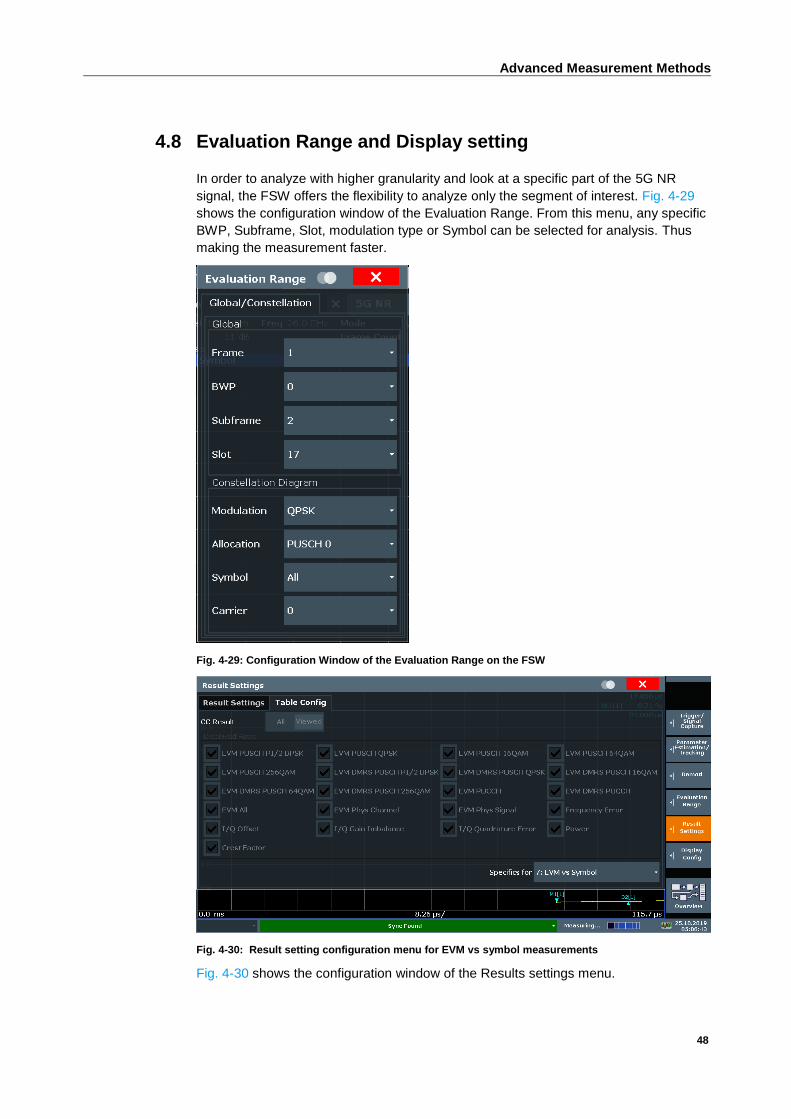
4.8 Evaluation Range and Display setting
In order to analyze with higher granularity and look at a specific part of the 5G NR
signal, the FSW offers the flexibility to analyze only the segment of interest. Fig. 4-29
shows the configuration window of the Evaluation Range. From this menu, any specific
BWP, Subframe, Slot, modulation type or Symbol can be selected for analysis. Thus
making the measurement faster.
Fig. 4-29: Configuration Window of the Evaluation Range on the FSW
Fig. 4-30: Result setting configuration menu for EVM vs symbol measurements
Fig. 4-30 shows the configuration window of the Results settings menu.
Advanced Measurement Methods
49
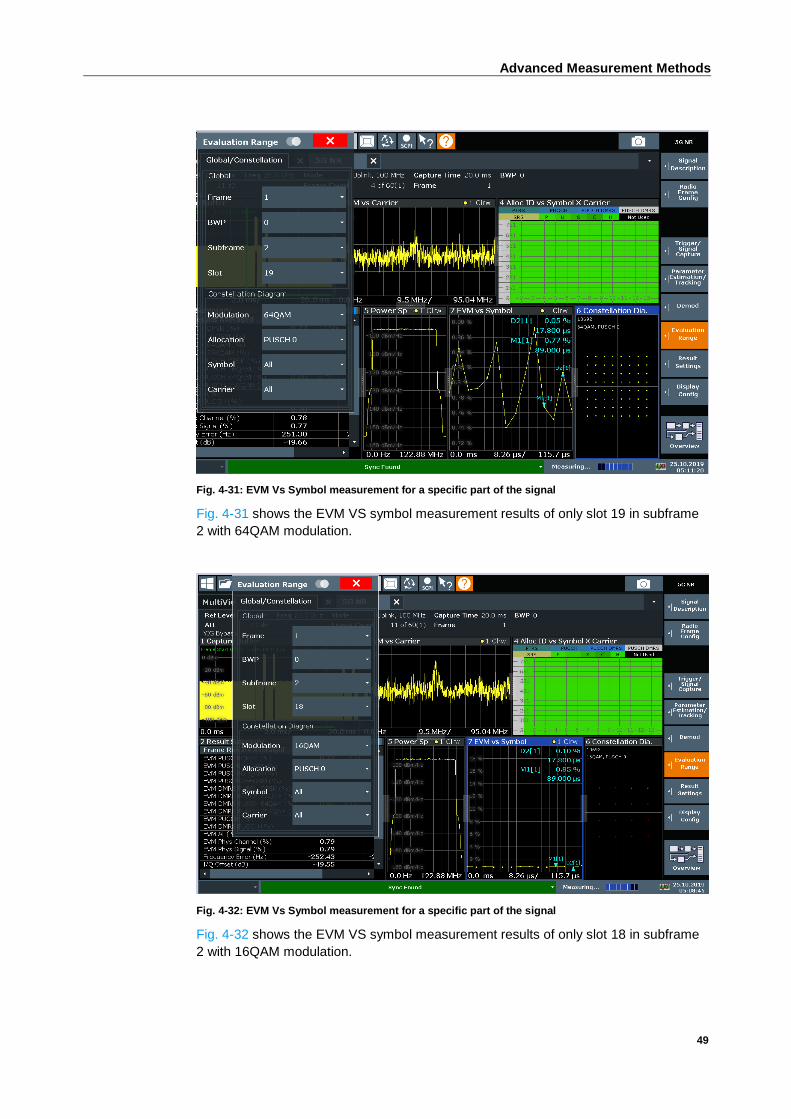
Fig. 4-31: EVM Vs Symbol measurement for a specific part of the signal
Fig. 4-31 shows the EVM VS symbol measurement results of only slot 19 in subframe
2 with 64QAM modulation.
Fig. 4-32: EVM Vs Symbol measurement for a specific part of the signal
Fig. 4-32 shows the EVM VS symbol measurement results of only slot 18 in subframe
2 with 16QAM modulation.

Ordering Information
50
5 Ordering Information
Designation Type Order No.
Signal- and Spectrum Analyzer 2
Hz to 43 GHz
R&S®FSW43 1331.5003.43
OCXO, precision frequency
reference
R&S®FSW-B4 1313.0703.02
Resolution bandwidth >10MHz
(HW opt.)
R&S®FSW-B8 1313.2464.02
High pass filter (SL) R&S®FSW-B13 1313.0761.02
Digital Baseband Interface (SL) R&S®FSW-B17 1313.0784.02
SSD 128 GB, with FW, for IPC11
CPU board, Win 10
R&S®FSW-B18 1313.0790.10
RF preamplifier, 30dB, 100kHz to
43GHz
R&S®FSW-B24 1313.0832.43
Extension to 160 MHz signal
analysis bandwidth
R&S®FSW-B160 1325.4850.14
3GPP 5G-NR DL Measurements R&S®FSW-K144 1338.3606.02
3GPP 5G-NR UL Measurements R&S®FSW-K145 1338.3612.02
Vector signal generator, base unit R&S®SMW200A 1412.0000.02
Frequency range: 100kHz to
40GHz, for RF path A
R&S®SMW-B140 1413.0604.02
Frequency range: 100 kHz to 7. 5
GHz
R&S®SMW-B207 1434.7350.02
Baseband main module, one I/Q
path to RF section (
R&S®SMW-B13 1413.2807.02
Baseband generator with realtime
coder and ARB
R&S®SMW-B10 1413.1200.02
5G New Radio R&S®SMW-K144 1414.4990.02
VSE BASIC EDITIION (PR) VSE 1345.1011.06
License dongle for PC software FSPC 1310.0002.03
3GPP 5G-NR DL/UL
Measurements
VSE-K144 1309.9574.06

Rohde & Schwarz
The Rohde & Schwarz electronics group offers
innovative solutions in the following business fields:
test and measurement, broadcast and media, secure
communications, cybersecurity, radiomonitoring and
radiolocation. Founded more than 80 years ago, this
independent company has an extensive sales and
service network and is present in more than 70
countries.
The electronics group is among the world market
leaders in its established business fields. The
company is headquartered in Munich, Germany. It
also has regional headquarters in Singapore and
Columbia, Maryland, USA, to manage its operations
in these regions.
Regional contact
Europe, Africa, Middle East +49 89 4129 12345 [email protected] North America 1 888 TEST RSA (1 888 837 87 72) [email protected] Latin America +1 410 910 79 88 [email protected] Asia Pacific +65 65 13 04 88 [email protected]
China +86 800 810 82 28 |+86 400 650 58 96 [email protected]
Sustainable product design
ı Environmental compatibility and eco-footprint
ı Energy efficiency and low emissions
ı Longevity and optimized total cost of ownership
This application note and the supplied programs
may only be used subject to the conditions of use
set forth in the download area of the Rohde &
Schwarz website.
Version GFM322_1e | R&S®5G NR Signal Generation and
Analysis
R&S® is a registered trademark of Rohde & Schwarz GmbH & Co.
KG; Trade names are trademarks of the owners.
Rohde & Schwarz GmbH & Co. KG
Mühldorfstraße 15 | 81671 Munich, Germany
Phone + 49 89 4129 - 0 | Fax + 49 89 4129 – 13777
www.rohde-schwarz.com
PA
D-T
-M: 3573.7
380.0
2/0
3.0
0/E
N