55 rankine lecture
TRANSCRIPT

55th Rankine Lecture
Hazard, Risk and Reliability
in Geotechnical Practice
(Adapted 2015 Rankine Lecture)
by
Suzanne Lacasse
NGI, Oslo Norway
Geotechniekdag 2015 Breda, Nederland

2 key questions
• How can reliability and risk concepts help to ensure
adequate safety while achieving cost-effective designs?
• What are the advantages and challenges of the hazard,
risk and reliability approach?
Strategy in answering these questions
Present examples that are so convincing that they will
make you want to use some of the methods.
Show that probabilistic and deterministic analyses are, in
many cases, necessary complements to each other.

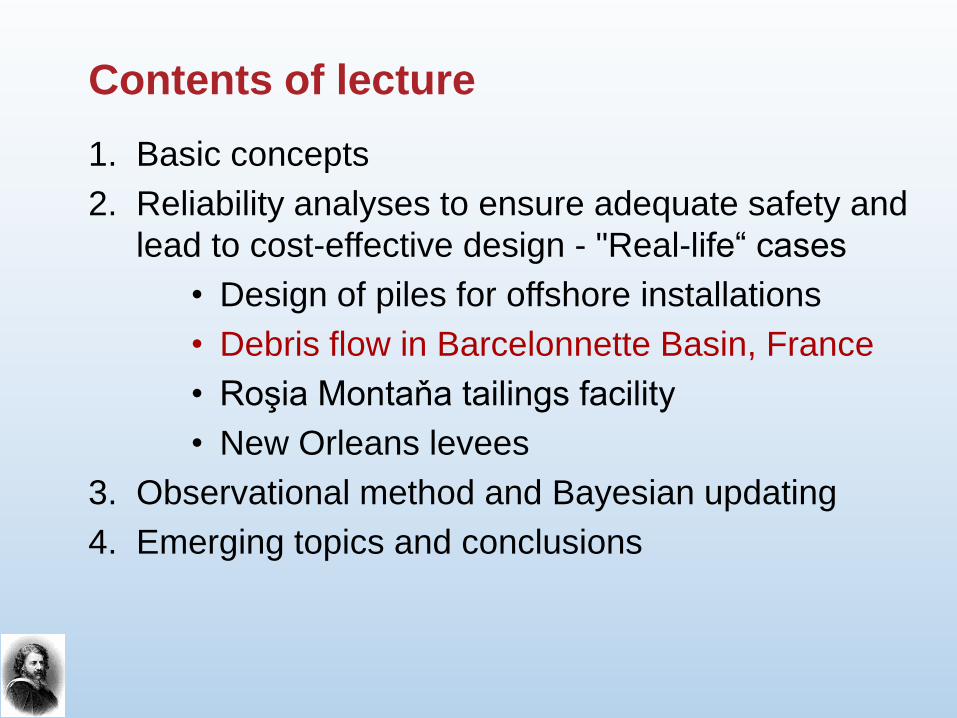
Contents of lecture
1. Basic concepts
2. Reliability analyses to ensure adequate safety and
lead to cost-effective design - "Real-life“ cases
• Design of piles for offshore installations
• Debris flow in Barcelonnette Basin, France
• Roşia Montaňa tailings facility
• New Orleans levees
3. Observational method and Bayesian updating
4. Emerging topics and conclusions

Basic definitions
H = Hazard (temporal probability of a threat)
V = Vulnerability of element(s) at risk
U = Utility (or value) of element(s) at risk
Risk = f ( H, V, U )
Risk = f (Hazard and
consequences)
Munkedal Sweden 2006
Thin layer of quick clay was not detected
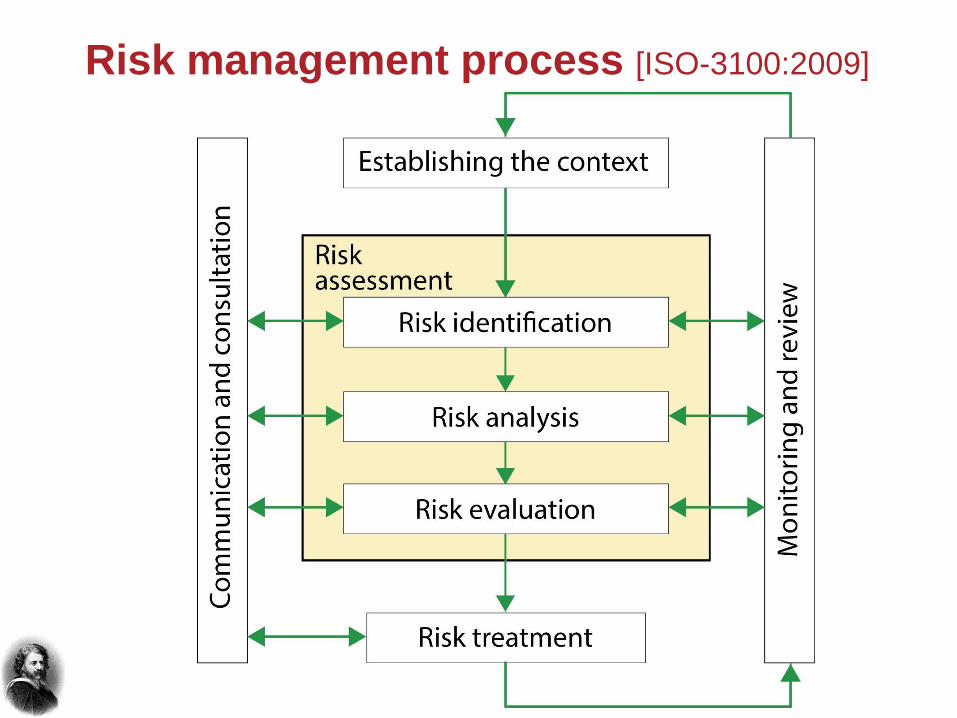
Risk management process [ISO-3100:2009]
ISO’s definition of risk
"Risk is the effect of uncertainties on objectives"
New ISO FDIS 2394 (March 2015)
«General principles on reliability for structures»
• Spells out the purpose of the reliability
approach: ensure a uniform margin of safety
(i.e. probability of failure)
• Requires “risk-informed design”.
• Outlines the increasing need to “calibrate” the
codes (i.e. safety factors)
Annex D Reliability of geotechnical structures
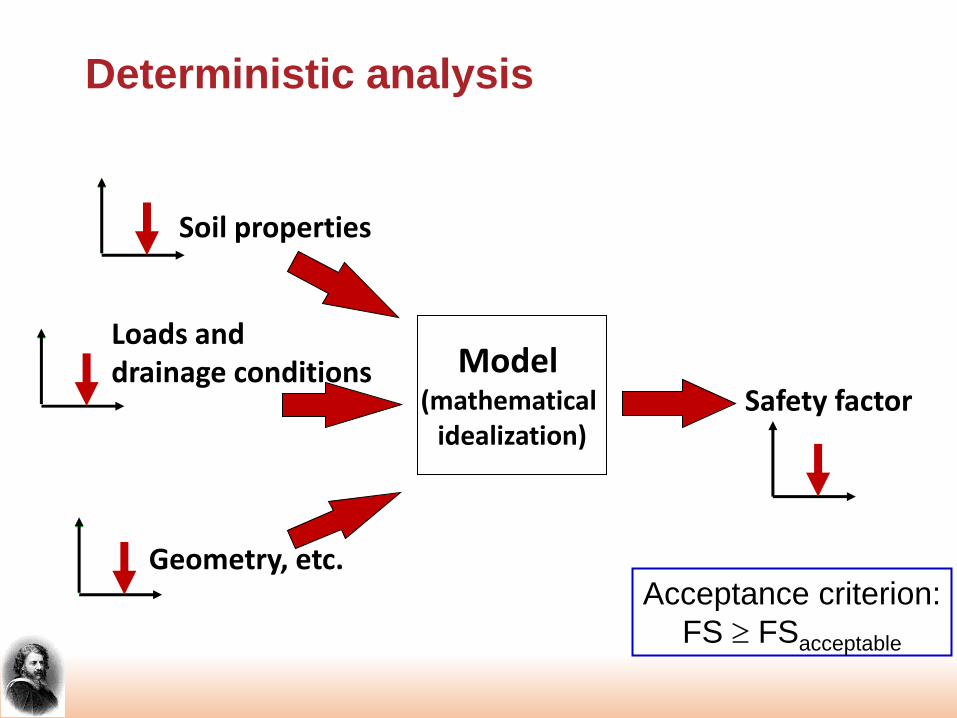
Deterministic analysis
Model (mathematical
idealization)
Soil properties
Loads and drainage conditions
Geometry, etc.
Safety factor
Acceptance criterion:
FS FSacceptable

Model (idealization
including uncertainty)
Soil properties
Loads and drainage conditions
Geometry etc.
Safety margin
Probability of failure (Pf) Reliability index (), …
Probabilistic analysis
Acceptance criterion:
acceptable
Pf < Pf tolerable/acceptable

Factor of safety and probability of failure
We need to be aware that
the Pf is never zero!
2

Contents of lecture
1. Basic concepts
2. Reliability analyses to ensure adequate safety and
lead to cost-effective design - "Real-life“ cases
• Design of piles for offshore installations
• Debris flow in Barcelonnette Basin, France
• Roşia Montaňa tailings facility
• New Orleans levees
3. Observational method and Bayesian updating
4. Emerging topics and conclusions


Motivation
• Guidelines require the same level of safety for
the new CPT-based pile capacity design
methods as for the older API method.
• The designer is required to select an
"appropriate" safety factor when using the new
CPT-methods.
• The designer can choose to:
1) be conservative and apply a "high" safety
factor or
2) document the level of safety (“probability of
failure").
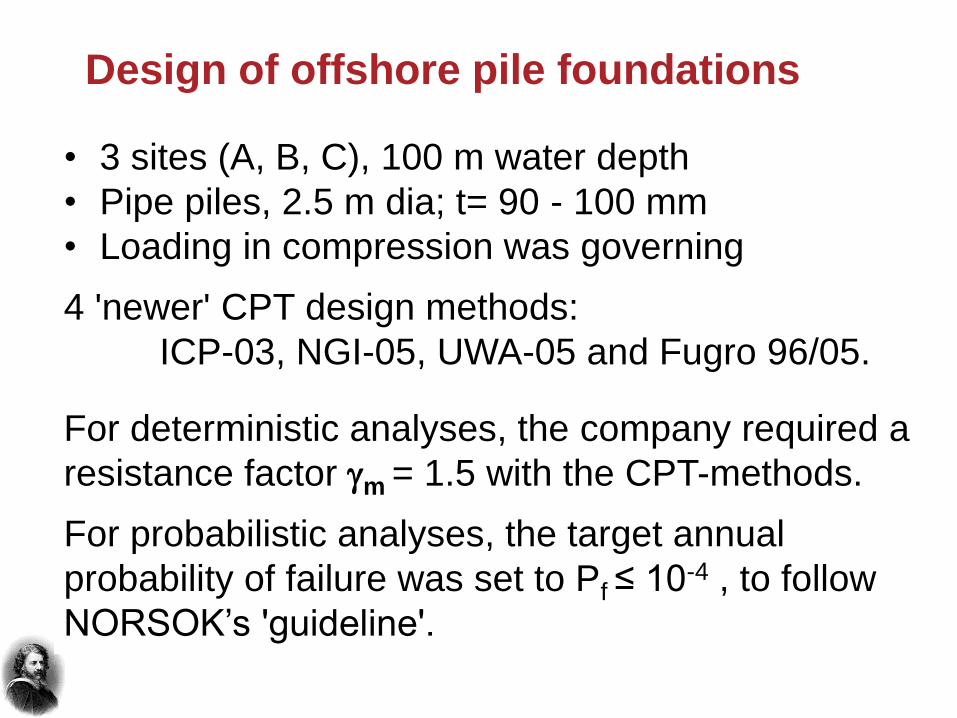
• 3 sites (A, B, C), 100 m water depth
• Pipe piles, 2.5 m dia; t= 90 - 100 mm
• Loading in compression was governing
4 'newer' CPT design methods:
ICP-03, NGI-05, UWA-05 and Fugro 96/05.
For deterministic analyses, the company required a
resistance factor gm = 1.5 with the CPT-methods.
For probabilistic analyses, the target annual
probability of failure was set to Pf ≤ 10-4 , to follow
NORSOK’s 'guideline'.
Design of offshore pile foundations

Axial loads on an offshore pile
Static Cyclic

Probabilistic analysis with FORM
Failure domain
Joint PDF
Resistance
Safe domain
Load Limit state
One defines a performance function e.g. G(X) = R - L ,
where G(X) ≥ 0 means satisfactory performance
G(X) < 0 means failure
X is a vector of basic random variables (resistance, load
effects, geometry and model uncertainty).

Undrained shear strength, Su
UU
Site A “clay site”

Deterministic
Qult with
characteristic
shear
strength
parameters,
Site B
100 175

Model uncertainty in skin friction - pile load test Predicted and measured capacities (diapile= 2.0 m)

Axial pile capacity and annual Pf
Penetr. depth
Qult char
(MN) Qult mean
(MN) Annual Pf - FORM, Q LN
75 m 78 98 2.1 10-5
80 m 84 104 2.3 10-5
90 m 97 119 1.2 10-6
Site A Clay
(NGI-05 method)
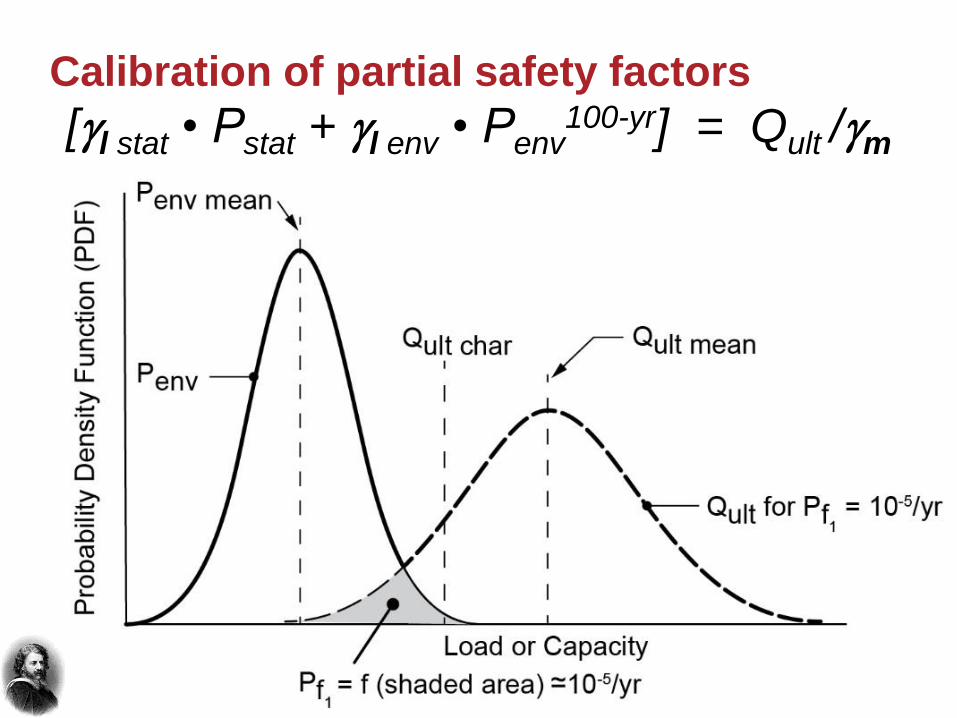
Calibration of partial safety factors
[gl stat • Pstat + gl env • Penv100-yr] = Qult /gm

Calibration of partial safety factors

Consequence for required pile
penetration depths at 3 sites
Method
Required pile penetration depths
Site A
(clay)
Site B
(sand)
Site C
(clay and sand)
NGI-05 90 m to
75 m
51 m to
27 m
45 m to
36 m
Reduction of the deterministic pile penetration depth
(NGI-05 method), because it was documented that
Pf < 10-4/yr.

Added value of reliability analysis?
The probabilistic design with target annual Pf of
10-4 resulted in very significant savings,
compared to the deterministic design.
The reliability approach allows one to design
with a uniform margin of safety and to
"calibrate" the safety factors prescribed in
codes.
The newer CPT-based design methods are
more reliable than the API method.
The results are most affected by the model
uncertainties, especially for piles in sand.
Contents of lecture
1. Basic concepts
2. Reliability analyses to ensure adequate safety and
lead to cost-effective design - "Real-life“ cases
• Design of piles for offshore installations
• Debris flow in Barcelonnette Basin, France
• Roşia Montaňa tailings facility
• New Orleans levees
3. Observational method and Bayesian updating
4. Emerging topics and conclusions

A
B
Faucon
catchment Debris flow Faucon catchment
What is the thickness and the
velocity of the debris if the
landslide reaches the village?
(Type A prediction)
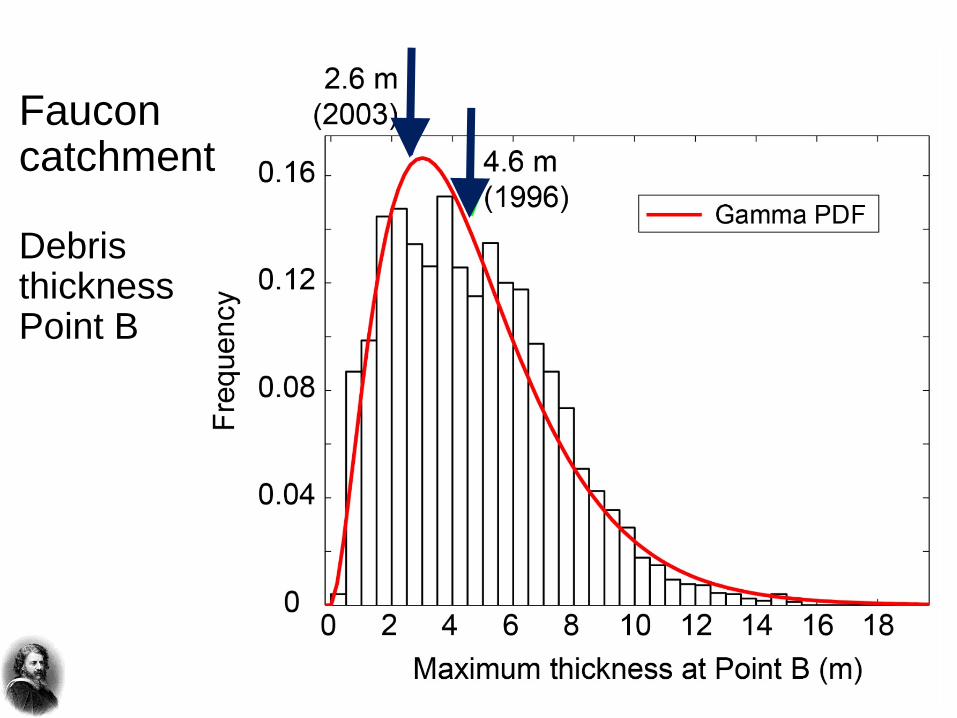
Faucon catchment Debris thickness Point B

Faucon catchment Debris velocity Point B

Added value of Monte Carlo analysis?
Monte-Carlo simulation is an excellent tool if
the mean and standard deviation are of main
interest. For modelling the "tails" of the PDF
(very low Pf), one needs a very large number
of simulations.
MCS can be used to "experiment" and develop
new calculation procedures or to model
behaviour, for example accounting for strain-
softening in limit equilibrium analyses.

Contents of lecture
1. Basic concepts
2. Reliability analyses to ensure adequate safety and
lead to cost-effective design - "Real-life“ cases
• Design of piles for offshore installations
• Debris flow in Barcelonnette Basin, France
• Roşia Montaňa tailings facility
• New Orleans levees
3. Observational method and Bayesian updating
4. Emerging topics and conclusions

Roşia Montaňa
Design of tailings management facility TMF –
the Corna Dam

The Baia Mare tailings dam failure
in Romania (2000) released
cyanide in the water, killing tons of
fish and poisoning the drinking
water of 2 M people in Hungary.
The Aznalcóllar tailings dam failure
in Spain (1998) released 68 Mm3
contaminated material in the
environment.
The Mount Polley tailings dam
failure (2014): tailings with Se, As
++ escaped: largest environmental
disaster in Canada.
31
Tailings dam Consequence scenarios
Baia Mare
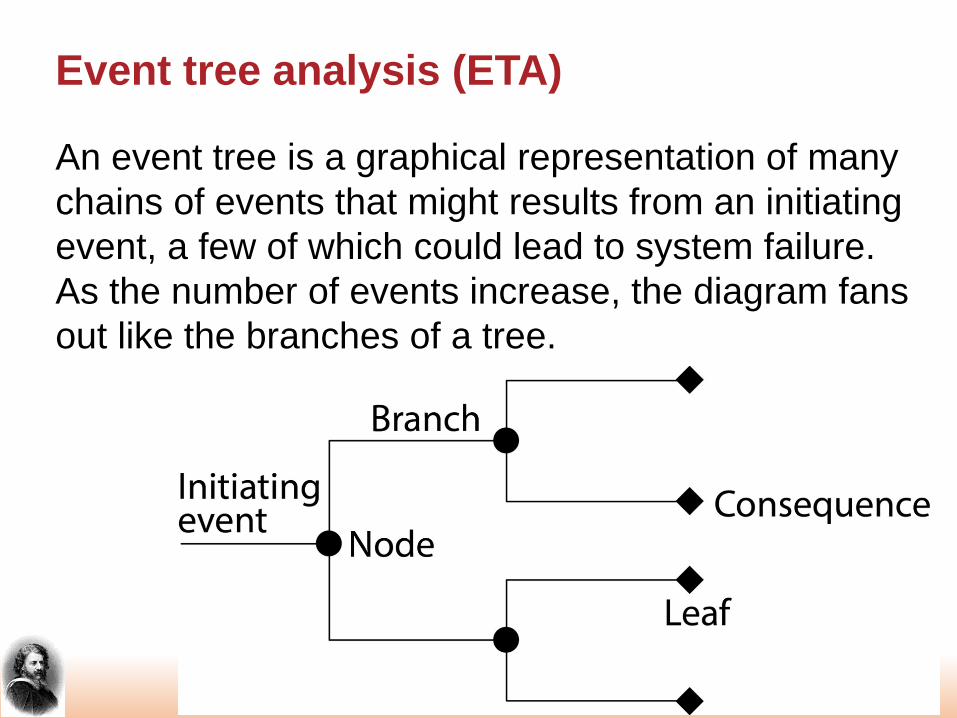
Event tree analysis (ETA)
An event tree is a graphical representation of many
chains of events that might results from an initiating
event, a few of which could lead to system failure.
As the number of events increase, the diagram fans
out like the branches of a tree.

Roşia Montaňa – TMF
Failure mode screening
What would happen to the TMF, the population and the
neighbouring environment if
− an earthquake struck
− unusually intense rainfalls occurred
− a slide occurred from the hillsides into the tailings
pond
− the dam crest slumped
− two or more of the above occurred at the same time
− …
All plausible triggers/events were examined.

• Assembled dam, geotechnical and risk experts
from USA, Norway, Canada and Romania.
• Looked at the failure modes from the start of
construction to the closure of the facility, and
established the scenarios where the TMF could
release tailings and water. Quantified how often
each scenario could happen.
• Looked at consequences from "No consequence"
to "Small release of tailings" to "Catastrophic
tailings release and contamination downstream"
to "Loss of life".
Roşia Montaňa – TMF
How was the evaluation done?

Roşia Montaňa – TMF
Failure scenarios – Starter Dam
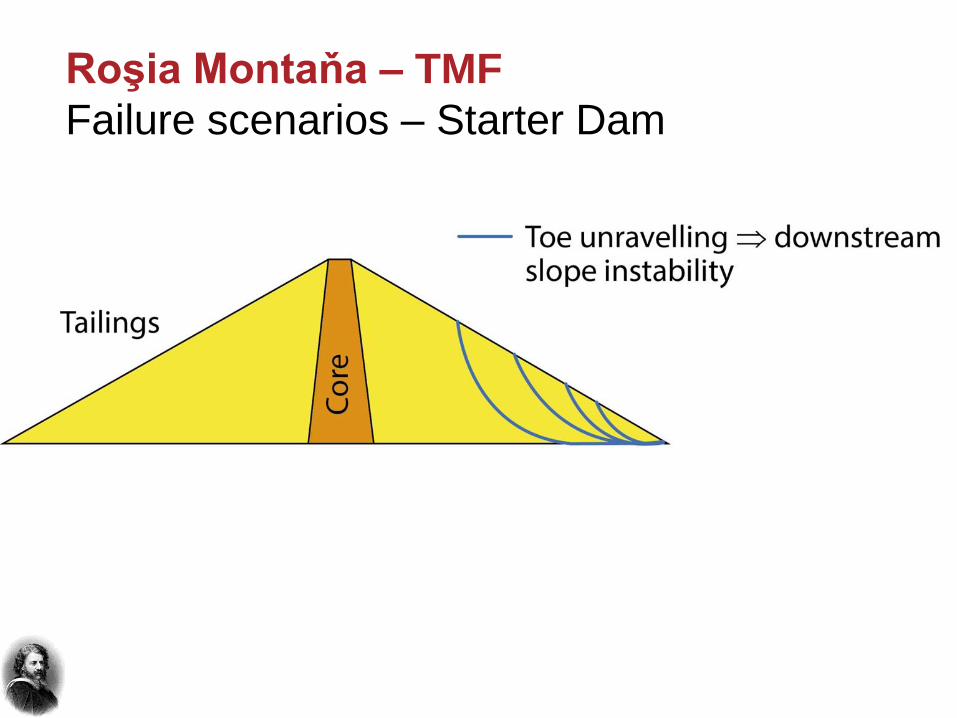
Roşia Montaňa – TMF
Failure scenarios – Starter Dam
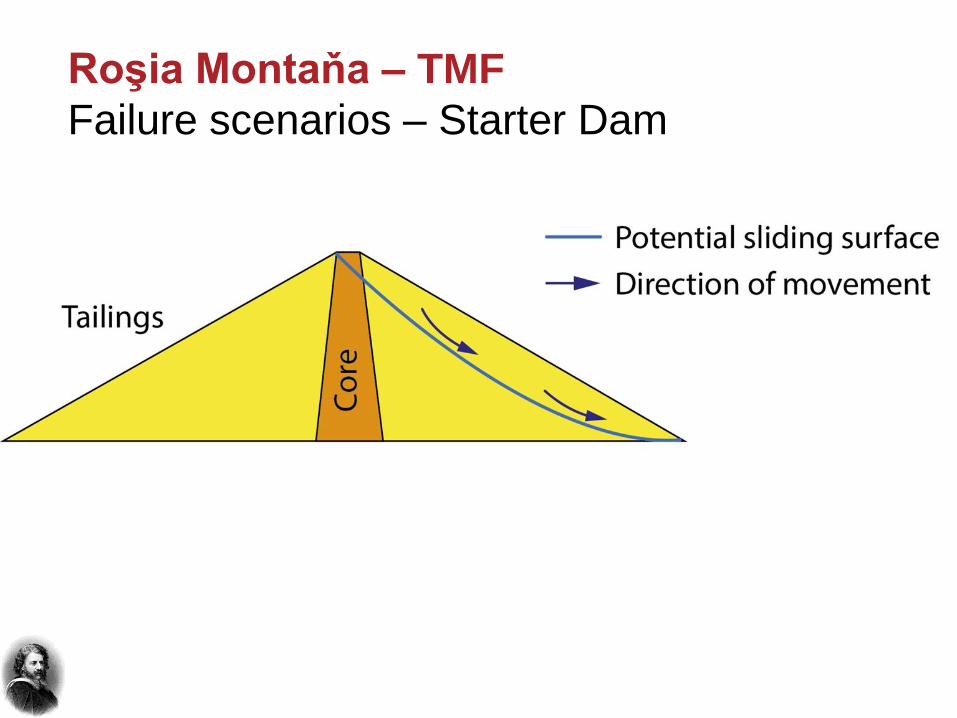
Roşia Montaňa – TMF
Failure scenarios – Starter Dam

Roşia Montaňa – TMF
Failure scenarios – completed Corna Dam
Slumping

Roşia Montaňa – TMF
Failure scenarios – completed Corna Dam

Roşia Montaňa – TMF
Failure scenarios – completed Corna Dam
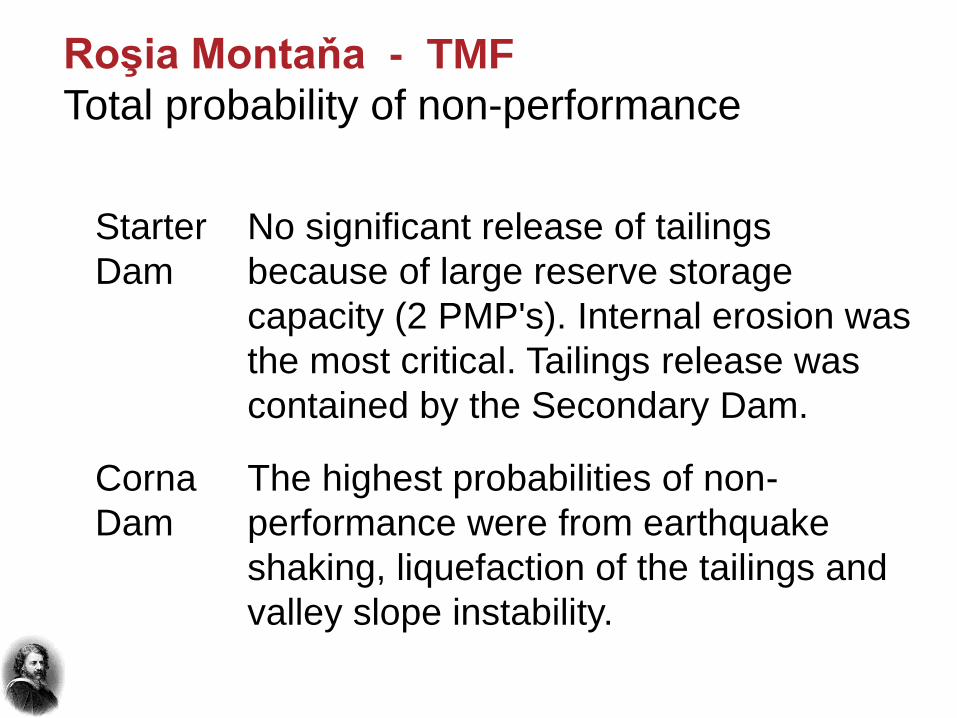
Roşia Montaňa - TMF
Total probability of non-performance
Starter
Dam
No significant release of tailings
because of large reserve storage
capacity (2 PMP's). Internal erosion was
the most critical. Tailings release was
contained by the Secondary Dam.
Corna
Dam
The highest probabilities of non-
performance were from earthquake
shaking, liquefaction of the tailings and
valley slope instability.

If dam breach occurs:
Tailings would flow about 200 meters past Secondary Dam
Escape volume: 250,000 m3 tailings and 26,000 m3 of water
Water discharge into nearby Abrud river showed limited
cyanide levels above regulated standards in close vicinity
only, during low flow period only (1/3 of the year).
Roşia Montaňa – TMF
Physical impacts

TMF at Rosia Montana Other tailings dams
Once in 1,000 yrs
Once in 1,000,000 yrs
Addition of probabilities for all scenarios
The highest probability of a breach occurring: once in
1,000,000 years. The TMF is therefore significantly safer
than other existing dams containing tailings.
Roşia Montaňa – TMF
Water retention dams Tailings dams
James(2015)
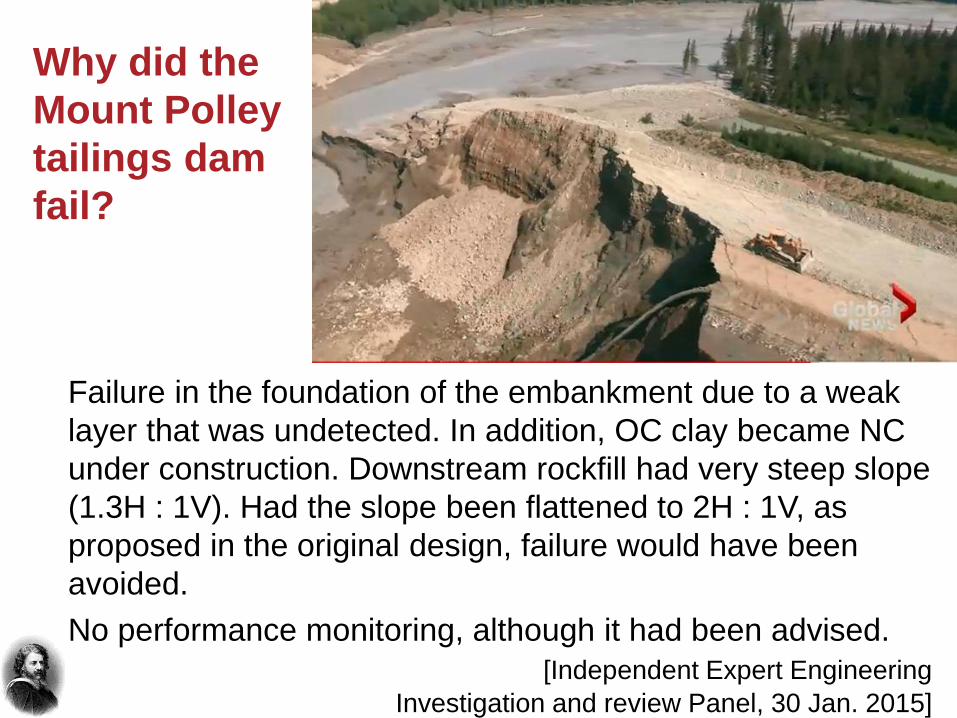
Why did the
Mount Polley
tailings dam
fail?
Failure in the foundation of the embankment due to a weak
layer that was undetected. In addition, OC clay became NC
under construction. Downstream rockfill had very steep slope
(1.3H : 1V). Had the slope been flattened to 2H : 1V, as
proposed in the original design, failure would have been
avoided.
No performance monitoring, although it had been advised.
[Independent Expert Engineering
Investigation and review Panel, 30 Jan. 2015]
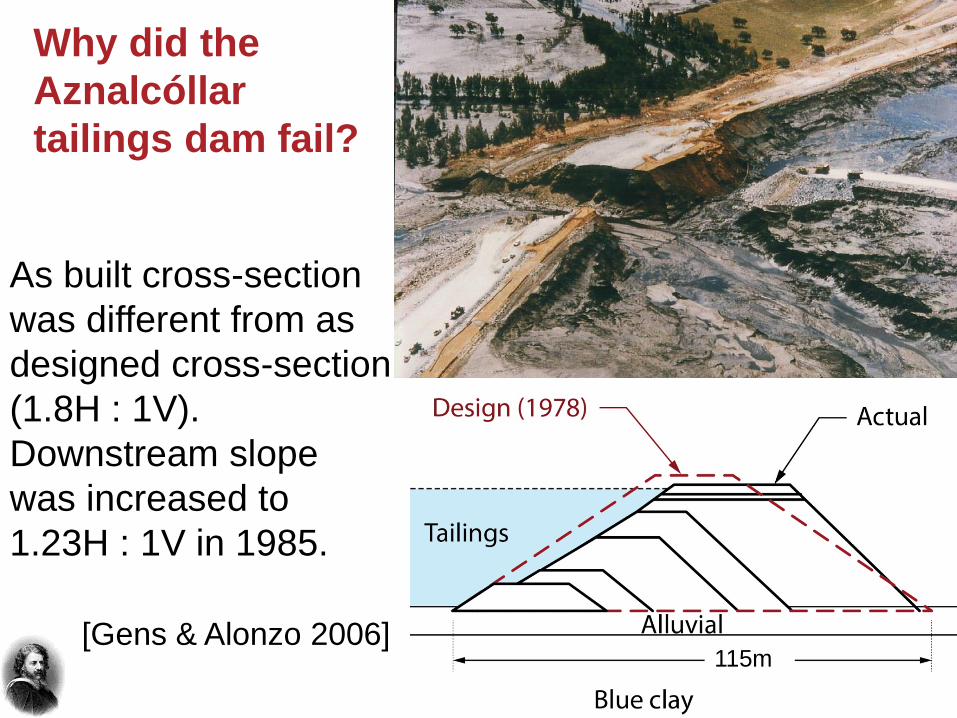
Why did the
Aznalcóllar
tailings dam fail?
As built cross-section
was different from as
designed cross-section
(1.8H : 1V).
Downstream slope
was increased to
1.23H : 1V in 1985.
[Gens & Alonzo 2006] 115m
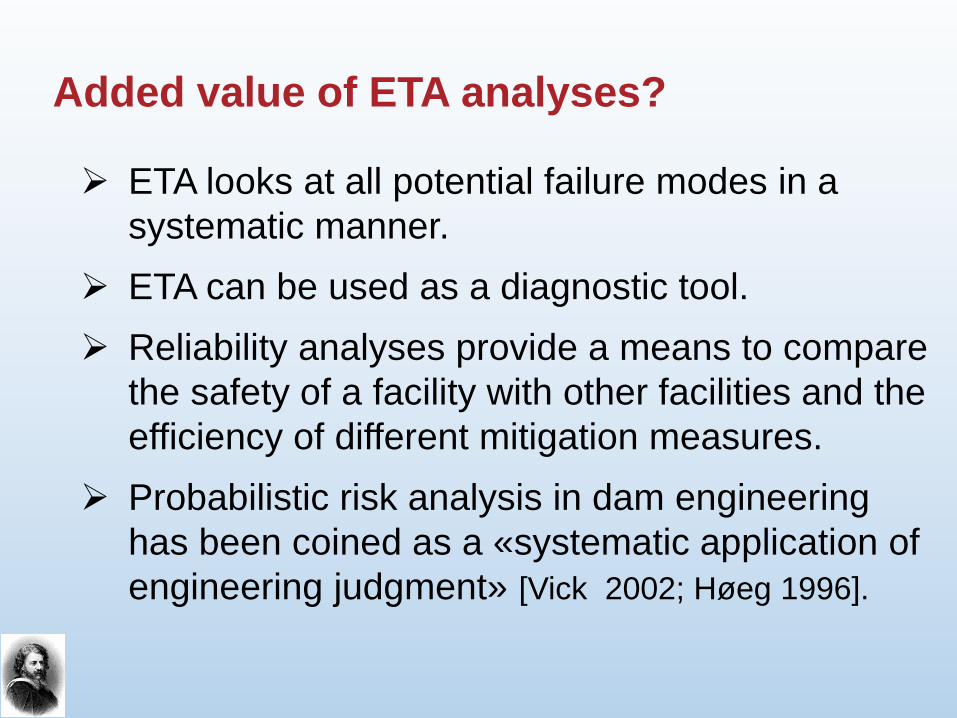
Added value of ETA analyses?
ETA looks at all potential failure modes in a
systematic manner.
ETA can be used as a diagnostic tool.
Reliability analyses provide a means to compare
the safety of a facility with other facilities and the
efficiency of different mitigation measures.
Probabilistic risk analysis in dam engineering
has been coined as a «systematic application of
engineering judgment» [Vick 2002; Høeg 1996].

• Time and budget constraints and competition on price
bring down the budget for site investigations and design
to a minimum, even when there are important
uncertainties.
• When a major failure occurs, there seems to be unlimited
budget for site investigations (lab and in situ), analyses
and expert advice (Mount Polley review report: an
impressive quantity of tests and analyses in 5 months).
How do we convince clients that:
• More site investigations and more time are needed for
design.
• Observational method is the best "insurance".
• Reliability assessments will provide more insight.
A paradox of our profession

Contents of lecture
1. Basic concepts
2. Reliability analyses to ensure adequate safety and
lead to cost-effective design - "Real-life“ cases
• Design of piles for offshore installations
• Debris flow in Barcelonnette Basin, France
• Roşia Montaňa tailings facility
• New Orleans levees
3. Observational method and Bayesian updating
4. Emerging topics and conclusions
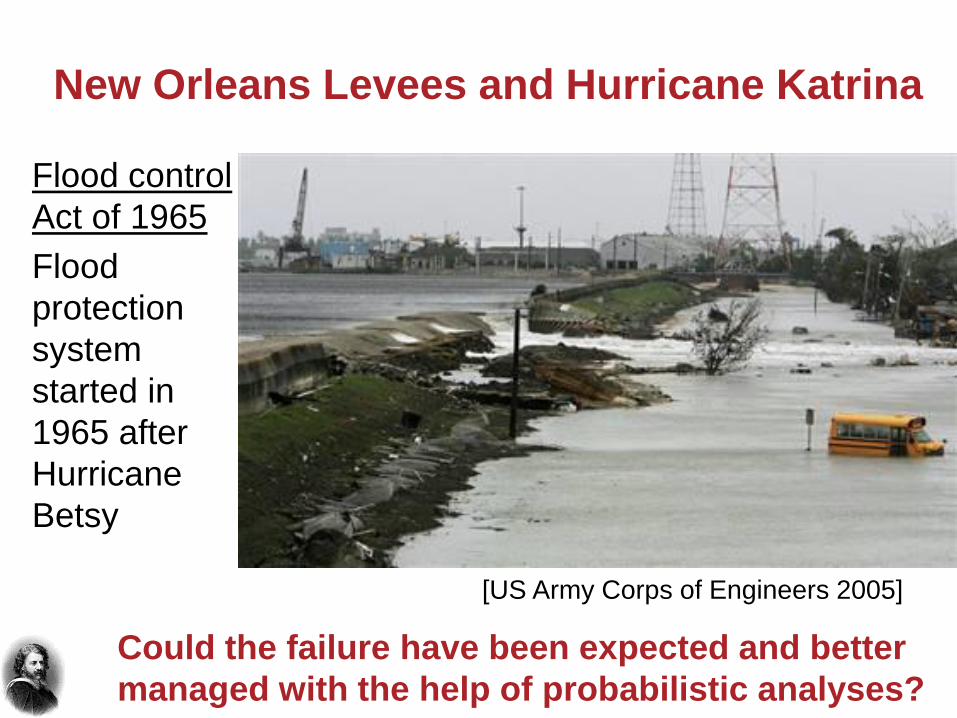
Flood control
Act of 1965
Flood
protection
system
started in
1965 after
Hurricane
Betsy
New Orleans Levees and Hurricane Katrina
Could the failure have been expected and better
managed with the help of probabilistic analyses?
[US Army Corps of Engineers 2005]
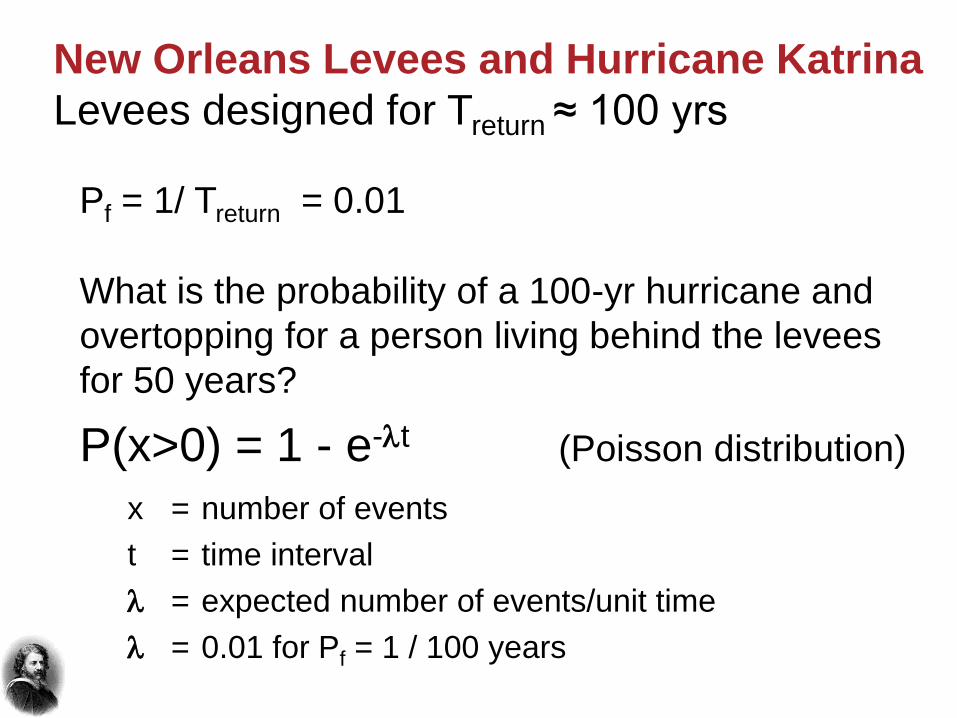
New Orleans Levees and Hurricane Katrina
Levees designed for Treturn ≈ 100 yrs
Pf = 1/ Treturn = 0.01
What is the probability of a 100-yr hurricane and
overtopping for a person living behind the levees
for 50 years?
P(x>0) = 1 - e-lt (Poisson distribution)
x = number of events
t = time interval
l = expected number of events/unit time
l = 0.01 for Pf = 1 / 100 years
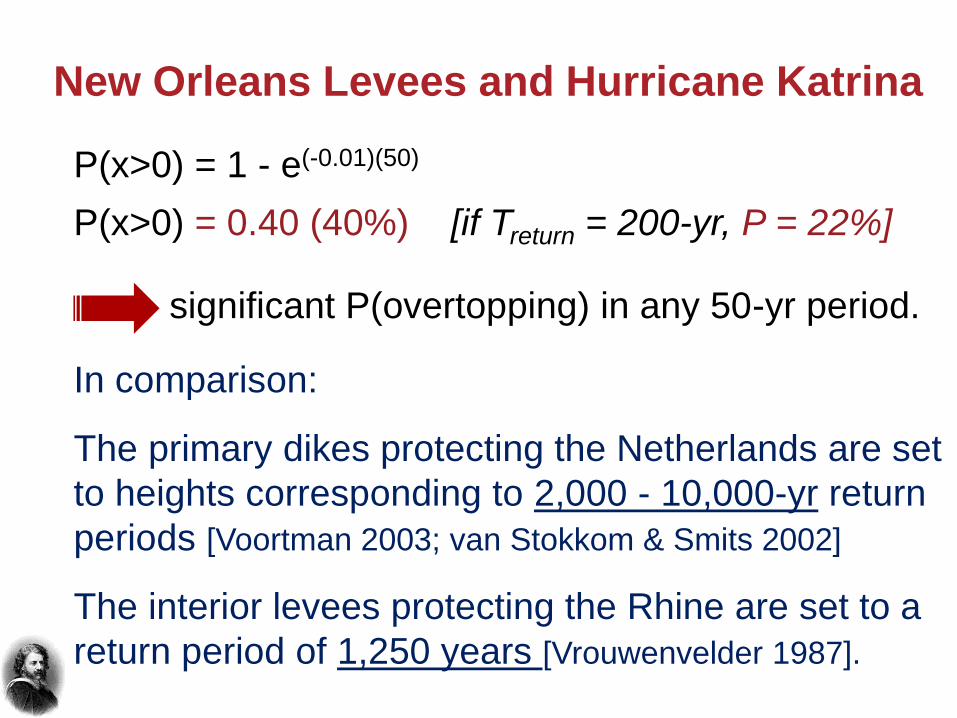
New Orleans Levees and Hurricane Katrina
P(x>0) = 1 - e(-0.01)(50)
P(x>0) = 0.40 (40%) [if Treturn = 200-yr, P = 22%]
significant P(overtopping) in any 50-yr period.
In comparison:
The primary dikes protecting the Netherlands are set
to heights corresponding to 2,000 - 10,000-yr return
periods [Voortman 2003; van Stokkom & Smits 2002]
The interior levees protecting the Rhine are set to a
return period of 1,250 years [Vrouwenvelder 1987].
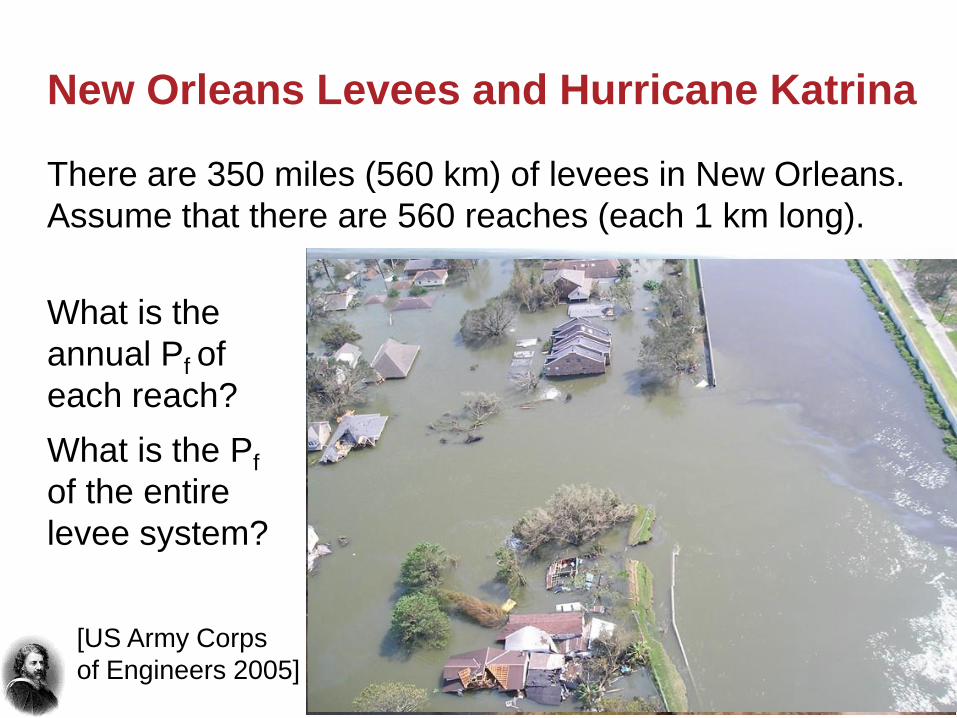
What is the
annual Pf of
each reach?
What is the Pf
of the entire
levee system?
New Orleans Levees and Hurricane Katrina
Looking south
There are 350 miles (560 km) of levees in New Orleans.
Assume that there are 560 reaches (each 1 km long).
[US Army Corps
of Engineers 2005]
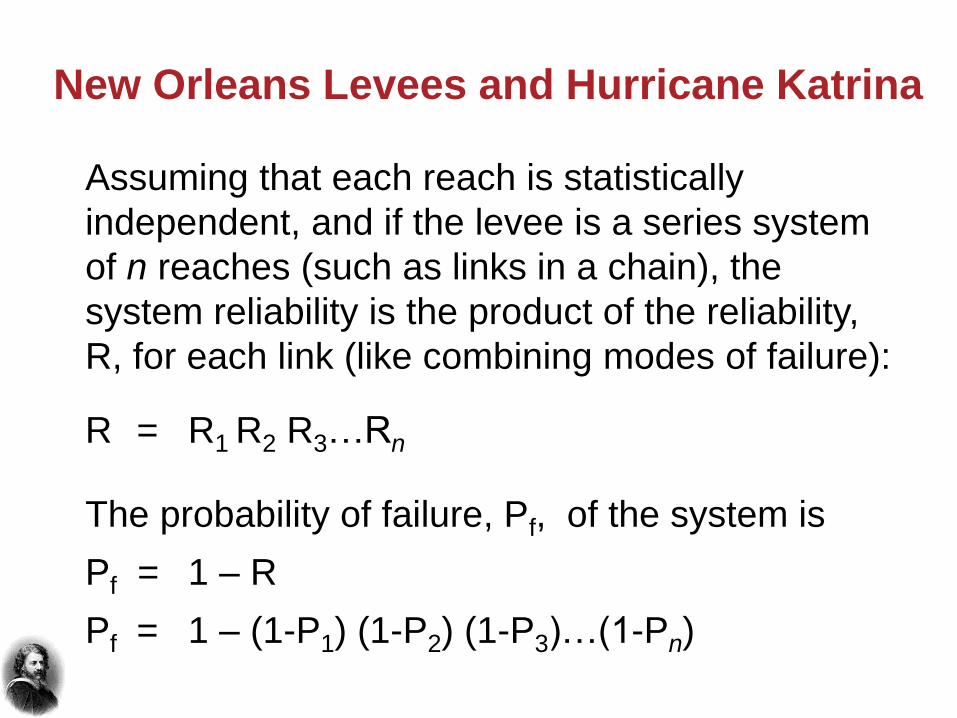
Assuming that each reach is statistically
independent, and if the levee is a series system
of n reaches (such as links in a chain), the
system reliability is the product of the reliability,
R, for each link (like combining modes of failure):
R = R1 R2 R3…Rn
The probability of failure, Pf, of the system is
Pf = 1 – R
Pf = 1 – (1-P1) (1-P2) (1-P3)…(1-Pn)
New Orleans Levees and Hurricane Katrina

The probability of at least one failure in the levee
system is:
New Orleans Levees and Hurricane Katrina
No. of
reaches
Reach length
(km)
Povertopping
(each reach)
Pf
(system)
560 1000 m 0.01 0.99
280 2000 m 0.01 0.94
1020 500 m 0.01 ≈1.00
No. of
reaches
Reach length
(km)
Povertopping
(each reach)
Pf
(system)
560 1000 m 0.01 0.99
280 2000 m 0.01 0.94
1020 500 m 0.01 ≈1.00
560 1000 m 0.001 0.43
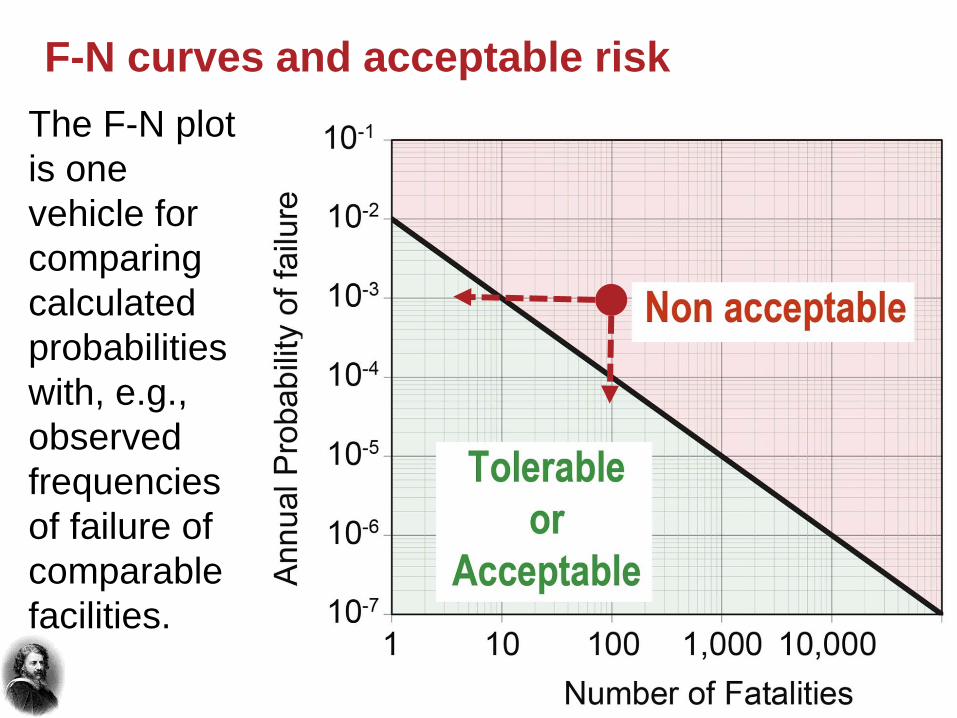
F-N curves and acceptable risk
The F-N plot
is one
vehicle for
comparing
calculated
probabilities
with, e.g.,
observed
frequencies
of failure of
comparable
facilities.

2005
"Hurricane
Protection
System"
2011
"Hurricane
Storm
Damage
Risk
Reduction
System"
New Orleans Levees and Hurricane Katrina
Risk diagrams (F-N curves) [Gilbert 2014]
2011

Why is the risk higher for the N-O levees?
What is considered as “tolerable” is not an abso-
lute, but relative to the context of the costs and the
feasibility of reducing the risk. It was considered not
feasible to achieve lower risk for a long levee
system in an urban area [after Gilbert 2015].
Emerging question:
Should one have used part of the $18 billion USD
on measures to evacuate people in advance of a
storm, to avoid fatalities, even with overtopping?
New Orleans Levees and Hurricane Katrina
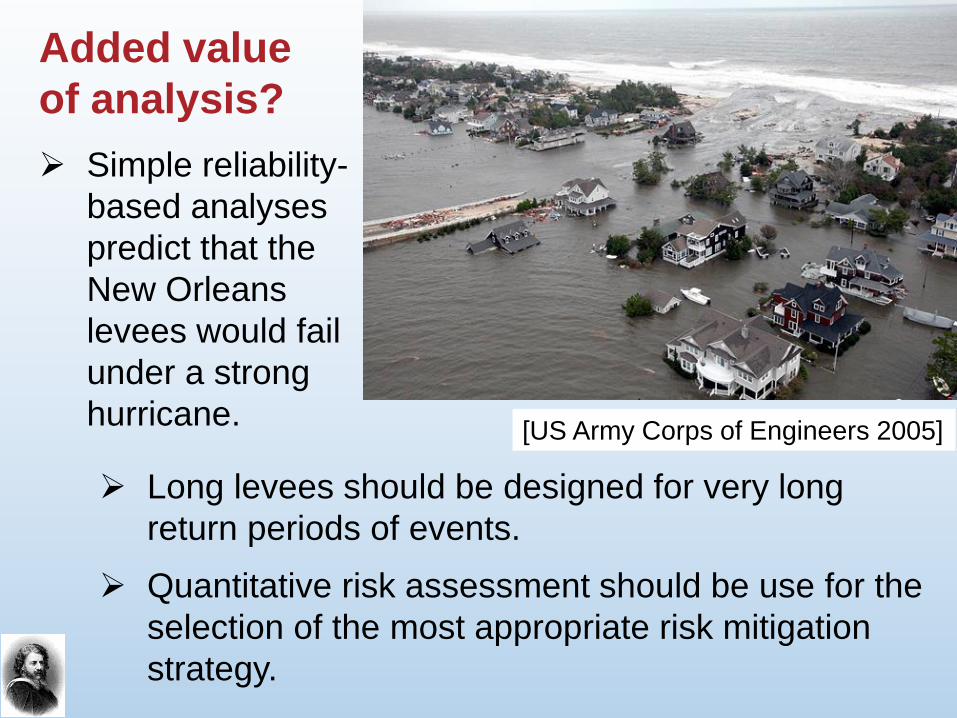
Added value
of analysis?
Simple reliability-
based analyses
predict that the
New Orleans
levees would fail
under a strong
hurricane.
Long levees should be designed for very long
return periods of events.
Quantitative risk assessment should be use for the
selection of the most appropriate risk mitigation
strategy.
[US Army Corps of Engineers 2005]

Contents of lecture
1. Basic concepts
2. Reliability analyses to ensure adequate safety and
lead to cost-effective design - "Real-life“ cases
• Design of piles for offshore installations
• Debris flow in Barcelonnette Basin, France
• Roşia Montaňa tailings facility
• New Orleans levees
3. Observational method and Bayesian updating
4. Emerging topics and conclusions
The observational method
Failures usually occur due to a combination of
factors. One recurring factor is the construction not
following the original script, or changes in design
underway that were not included in the original
design.
This reinforces the importance of and the need for
the observational method [Terzaghi and Peck 1948;
Peck1969 Rankine Lecture].

The observational method (the abridged version)
Exploration
Most probable conditions and most unfavourable
conceivable deviations
Design based on a “working hypothesis”
anticipated under most probable conditions
Selection of quantities to be observed
Calculation of values under most unfavourable
conditions
Selection in advance of course of action for every
forseeable deviation
Measurement
Modification of design

Bayesian updating – a tool for geotechnics
Bayes' theorem provides a framework to allow
updating of prior estimates with new information.
Bayes' theorem is the essential means of
adjusting one's estimates in light of new
evidence.
Bayesian thinking was for instance used by Alan
Turing in solving the German Enigma code during
WWII (cf. the movie The Imitation Game).

Bayesian approach to estimate annual
probability of slope failure Pf [Nadim et al 2013]
Probability distribution of Pf
“r” slides observed during “n” years:
Expected value of Pf after “n” of years of
observations with no sliding:
f (Pf ) = k Pfr (1 – Pf )
n – r
E[Pf ] = (r +1 ) / (n + 2)
No slides during 1,000 yrs E[ Pf ] 1.0 10-3 /yr
No slides during 8,000 yrs E[ Pf ] 1.3 10-4 /yr
No slides during 18,000 yrs E[ Pf ] 0.6 10-4 /yr
E[Pf ] = 1/(n + 2)
Probability distribution of Pf
“r” slides observed during “n” years:
Expected value of Pf after “n” of years of
observations with no sliding:
f (Pf ) = k Pfr (1 – Pf )
n – r
E[Pf ] = (r +1 ) / (n + 2)
E[Pf ] = 1/(n + 2)
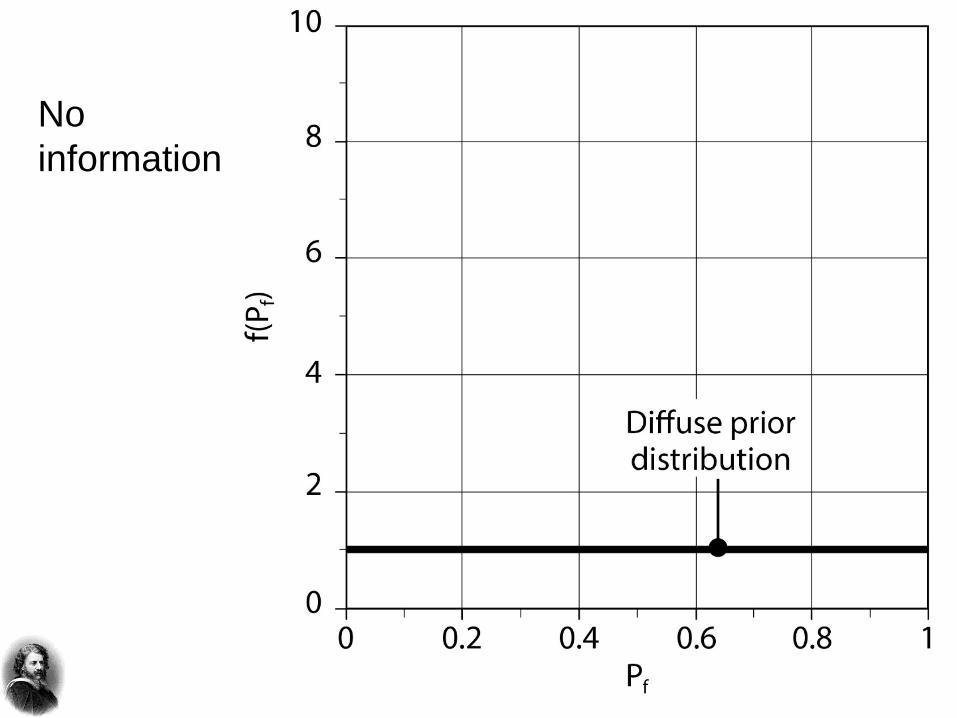
No
information

No
slope failure
in the past
year (1 yr)

No
slope failure
in the past
3 years

No
slope failure
in the past
8 years
[Nadim
et al 2013]
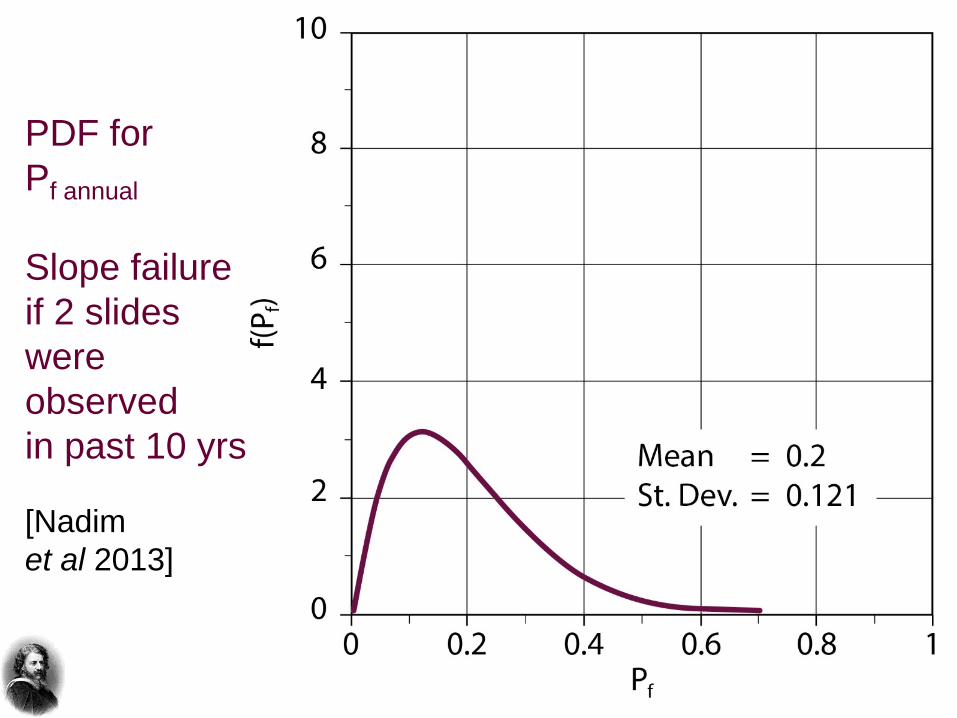
PDF for
Pf annual
Slope failure
if 2 slides
were
observed
in past 10 yrs
[Nadim
et al 2013]

Contents of lecture
1. Basic concepts
2. Reliability analyses to ensure adequate safety and
lead to cost-effective design - "Real-life“ cases
• Design of piles for offshore installations
• Debris flow in Barcelonnette Basin, France
• Roşia Montaňa tailings facility
• New Orleans levees
3. Observational method and Bayesian updating
4. Emerging topics and conclusions
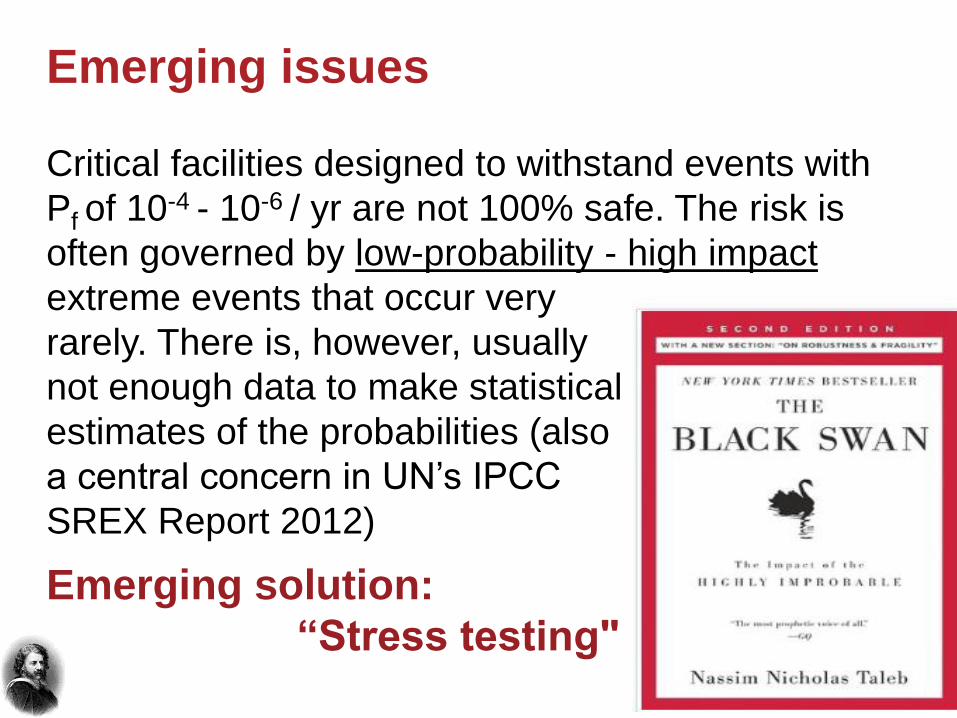
Critical facilities designed to withstand events with
Pf of 10-4 - 10-6 / yr are not 100% safe. The risk is
often governed by low-probability - high impact
extreme events that occur very
rarely. There is, however, usually
not enough data to make statistical
estimates of the probabilities (also
a central concern in UN’s IPCC
SREX Report 2012)
Emerging solution:
“Stress testing"
Emerging issues

Flooding in
June 2008 Debris flows
Sept. 2008
Flooding
July 2013
Zhang, Zhang & Huang 2014)
Landslides
May 2008
Cascading hazards and risks
Beichuan, China
[Zhang et al 2014]

Cascading hazards and multi-risks
How can one consider the interactions among
different threats in a systematic way, including
the uncertainties?
Compared to single risk analysis, the
examination of multiple risks poses a range of
challenge be-cause of the different
characteristics of the hazards.
Emerging solution:
"Bayesian networks" (quantitative)
Emerging issues
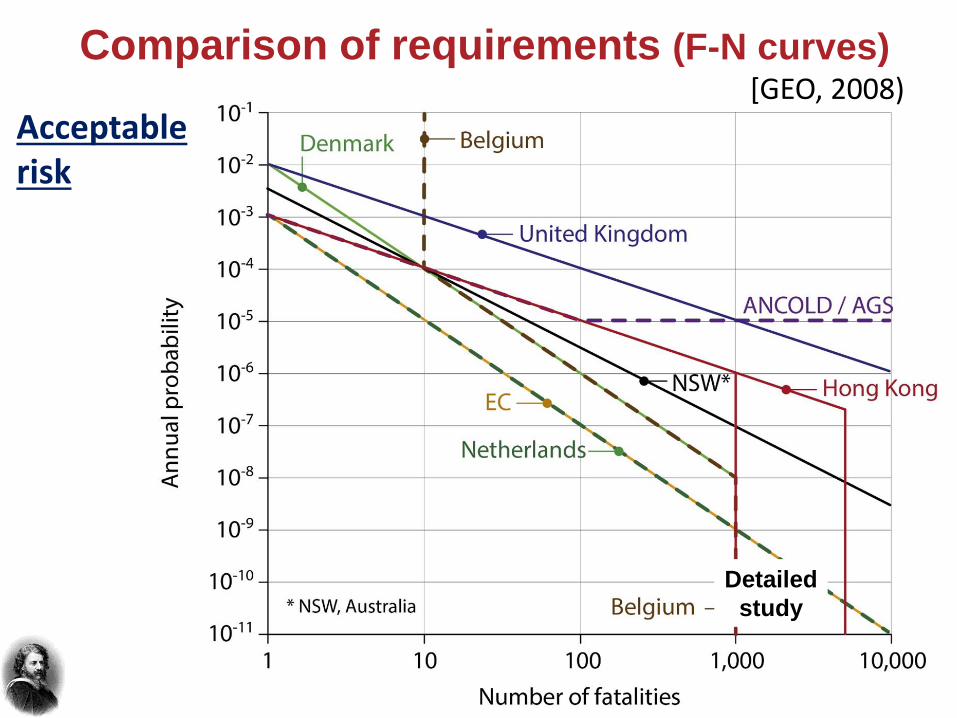
Comparison of requirements (F-N curves) [GEO, 2008)
Detailed
study
Acceptable risk

Communication
Being a good communicator is today one of the
most empowering skill that we as engineers can
acquire. Being able to communicate presupposes
under-standing the subject, and preparing
beforehand!
Quantitative assessment of hazard and conse-
quences reveals the risk-creating factors and the
need for remedial changes. It encourages foresight
rather than hindsight.
Emerging issues

Vulnerability of the geotechnical engineer
From the standpoint of accountability, the
geotechnical engineer finds himself in a particularly
vulnerable spot.
He/she works at the interface of natural conditions
and man-made structures. Often he/she has little
hard information and his/her judgment is
continuously taxed.
He/she is called upon to identify and define
situations that are potentially hazardous and to at
least initiate a decision process as to whether the
hazards are acceptable or not.

Reliability analyses
Reliability approaches do not remove
uncertainty nor do they alleviate the need for
judgment. They provide a way to quantify the
uncertainties and to handle them consistently.
Reliability approaches also provide the basis for
comparing alternatives.
Site investigations, laboratory test programmes,
limit equilibrium and deformation analyses,
instrumentation and monitoring and engineering
judgment are necessary parts of the reliability
approach.
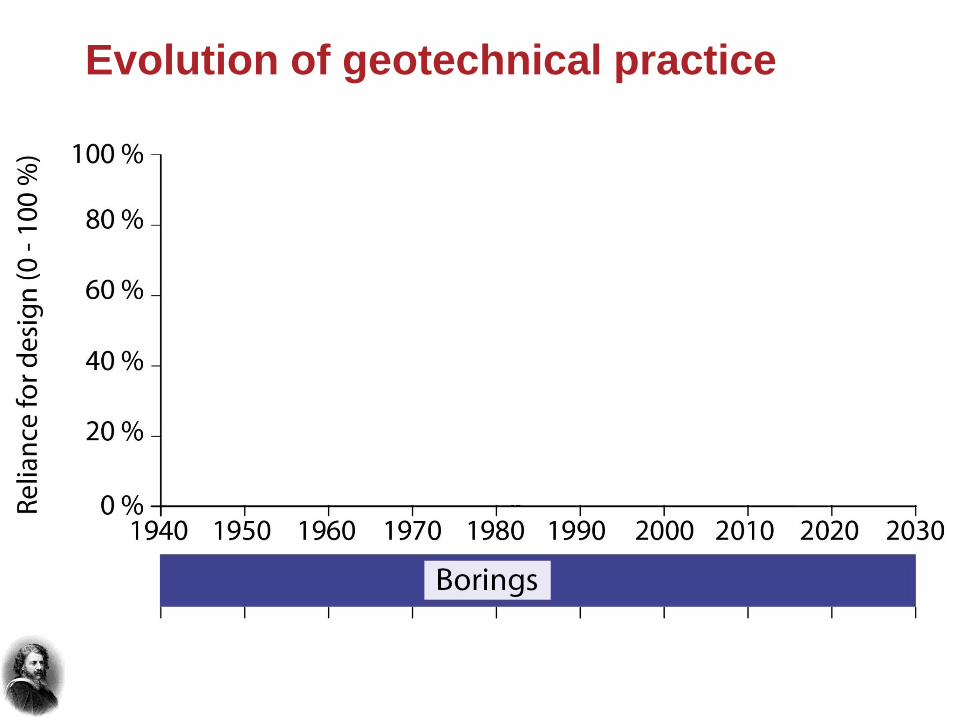
Evolution of geotechnical practice

Evolution of geotechnical practice

Risk and probability tools have reached a
degree of maturity and breadth that make them
effective to use in practice. They provide more
insight than deterministic analyses alone. They
help reduce uncertainty and focus on safety and
cost-effectiveness.
Integrating deterministic and probabilistic
analyses in a complementary manner brings
together the best of our profession, including the
required engineering judgment from the geo-
practitioners and the mathematics from the risk
specialists.
Deterministic and probabilistic analyses

Uncertainties
In all
geotechnical
assessments,
one needs to
deal with
uncertainties,
either
implicitly or
explicitly.
E18 expressway in Norway, February 2015
Slide in quick clay causing bridge collapse
[Photo: SVV 2015]
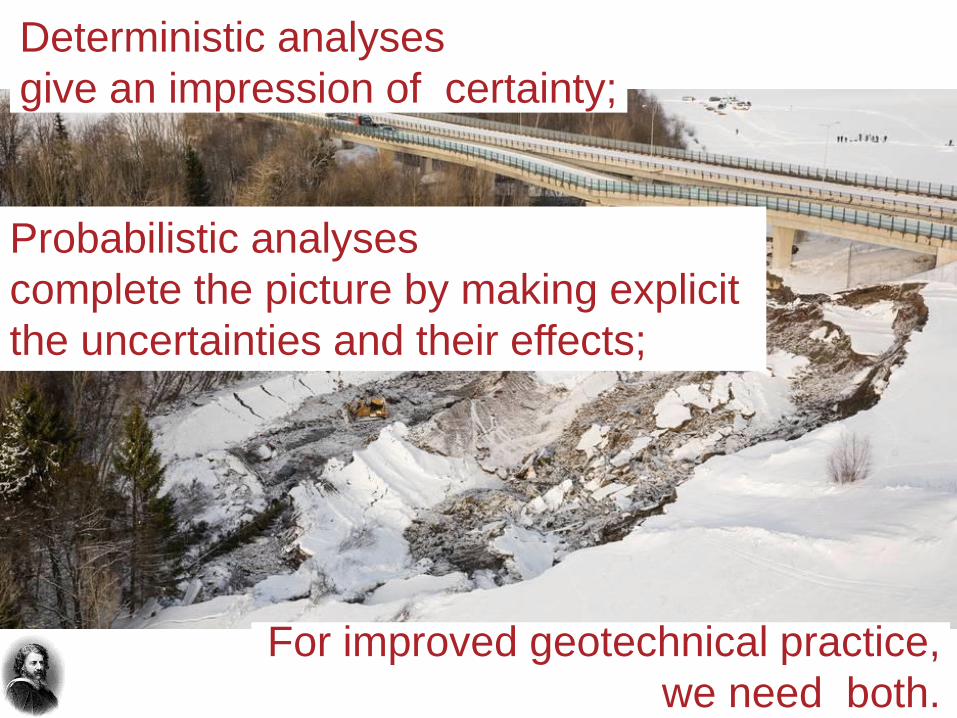
For improved geotechnical practice,
we need both.
Probabilistic analyses
complete the picture by making explicit
the uncertainties and their effects;
Deterministic analyses
give an impression of certainty;

“Doubt is an uncomfortable
condition, but certainty is a
ridiculous one.”
Voltaire
(1694-1778)
“A woman's guess is much more
accurate than a man's certainty”.
Rudyard Kipling
(1865-1936)