5.3 human population growth · 8 7 6 5 4 3 2 1 0 1 2 3 4 5 6 7 8 8 7 6 5 4 3 2 1 0 1 2 3 4 5 6 7 8...
TRANSCRIPT

Lesson 5.3 • Workbook A • Copyright © by Pearson Education, Inc., or its affi liates. All Rights Reserved.75
Name Class Date
5.3 Human Population Growth
Lesson Objectives Discuss the trend of human population growth.
Explain why population growth rates differ in countries throughout the world.
Lesson Summary
Historical Overview The size of the human population has increased over time.
For most of human existence, limiting factors such as the scarcity of food kept death ▶rates high.
As civilization advanced, agriculture, industry, improved nutrition, sanitation, and ▶medicine reduced death rates. Birthrates stayed high in most places. This led to exponential growth.
Today, the human population continues to grow exponentially, although the doubling ▶time has slowed.
Patterns of Human Population Growth Demography is the scientific study of human populations. Demographers try to predict how human populations will change over time.
Over the past century, population growth in developed countries slowed. As death ▶rates dropped, birthrates dropped also. Demographers call this shift the demographic transition. Most people live in countries that have not undergone the demographic transition.
An age-structure graph shows how many people of each gender are in each age group in a ▶population. Demographers use such graphs to predict how a population will change. More people of reproductive age usually means faster growth.
Many factors, including disease, will affect human population growth in the twenty-first ▶century. Current data suggest the human population will grow more slowly over the next 50 years than it did for the last 50 years.
Historical OverviewFor Questions 1–5, write True if the statement is true. If the statement is false, change the underlined word or words to make the statement true.
1. Over the last 1000 years, the size of the human population has decreased.
2. Since the 1800s, human population growth has been logistic.
3. The human population has increased because birthrates have dropped.
4. The combination of low death rates and high birthrates led to exponential growth.
5. Charles Darwin suggested that human populations are regulated by war, famine, and disease.
increased
death rates
exponential
True
Thomas Malthus
013368718X_CH05_067-080.indd 9 1/5/09 11:57:17 AM
Lesson 5.3 • Workbook A • Copyright © by Pearson Education, Inc., or its affi liates. All Rights Reserved.76
Name Class Date
The Demographic Transition
Time (years)
High
Low
Birt
h/D
eath
Rat
es
= Birthrate= Death rate
Stage I The birthrate and death rate are equally high.
Stage II Stage III
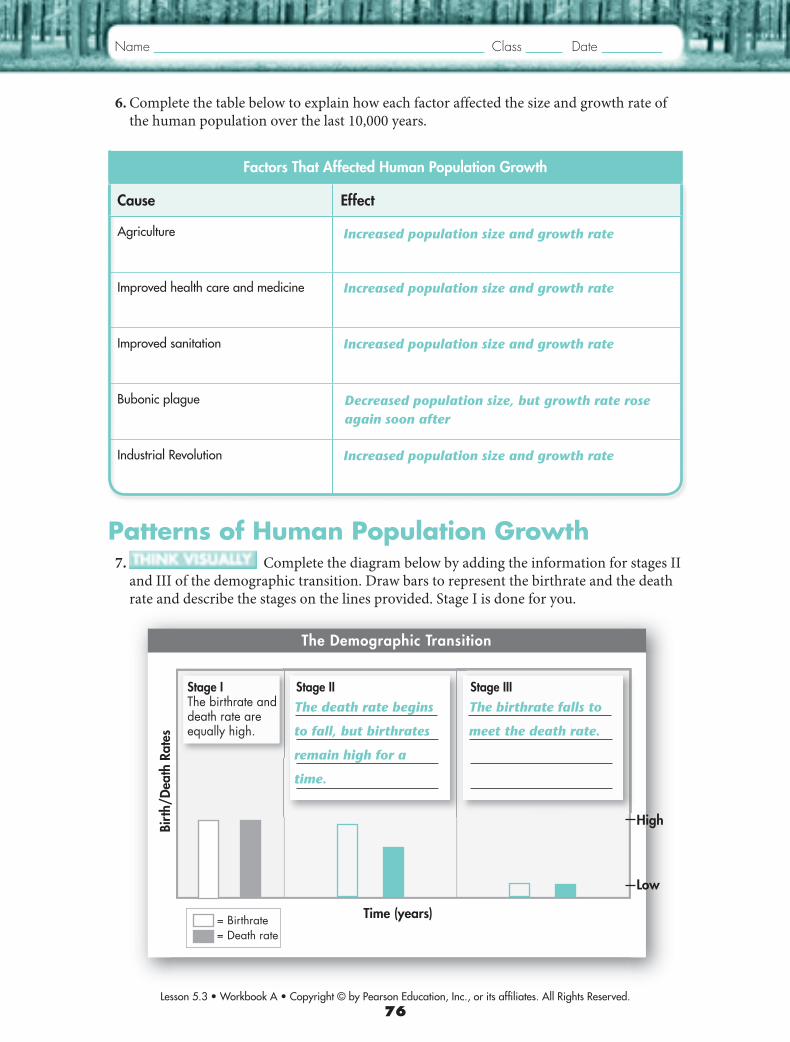
6. Complete the table below to explain how each factor affected the size and growth rate of the human population over the last 10,000 years.
Patterns of Human Population Growth 7. Complete the diagram below by adding the information for stages II
and III of the demographic transition. Draw bars to represent the birthrate and the death rate and describe the stages on the lines provided. Stage I is done for you.
Factors That Affected Human Population Growth
Cause Effect
Agriculture
Improved health care and medicine
Improved sanitation
Bubonic plague
Industrial Revolution
Decreased population size, but growth rate rose again soon after
Increased population size and growth rate
Increased population size and growth rate
Increased population size and growth rate
Increased population size and growth rate
The death rate begins
to fall, but birthrates
remain high for a
time.
The birthrate falls to
meet the death rate.
013368718X_CH05_067-080.indd 10 1/5/09 11:57:18 AM

Lesson 5.3 • Workbook A • Copyright © by Pearson Education, Inc., or its affi liates. All Rights Reserved.77
Name Class Date
80+
75–79
70–74
65–69
60–64
55–59
50–54
45–49
40–44
35–39
30–34
25–29
20–24
15–19
10–14
5–9
0–4
80+
75–79
70–74
65–69
60–64
55–59
50–54
45–49
40–44
35–39
30–34
25–29
20–24
15–19
10–14
5–9
0–4
8 7 6 5 4 3 2 1 0 1 2 3 4 5 6 7 8 8 7 6 5 4 3 2 1 0 1 2 3 4 5 6 7 8
Ag
e (y
ears
)
Percentage of Population Percentage of Population
Ag
e (years)Age Distribution
Males Females FemalesMalesU.S. POPULATION RWANDA POPULATION
Use these age structure diagrams to answer Questions 8–11.
8. Which country has gone through the demographic transition? How do you know?
9. Which country do you predict will experience a slow and steady growth rate in the near future? Why?
10. Which country is most likely to grow exponentially in the near future? Why?
11. Suggest three factors that might slow population growth in Rwanda.
12. Explain why human population size is likely to increase in the twenty-first century, but not as rapidly as it did in the twentieth century.
The United States appears to have undergone the demographic transition because it
has larger numbers of older people. The birthrate and death rate are both low.
The United States will grow slowly because it has smaller numbers of
young people of reproductive age.
Rwanda will because it has large numbers of young people of reproductive age.
SAMPLE ANSWER: Three factors that might slow population growth in Rwanda are war,
food shortages, and disease.
Some countries are still experiencing exponential growth, but the growth rate has
slowed in a number of countries. All countries, however—even those undergoing the
demographic transition—still have a higher birthrate than death rate.
013368718X_CH05_067-080.indd 11 1/5/09 11:57:22 AM

Name Class Date
Chapter 5 • Workbook A • Copyright © by Pearson Education, Inc., or its affi liates. All Rights Reserved.78
Chapter Vocabulary ReviewCrossword Puzzle Complete the puzzle by entering the term that matches each numbered description. For two-word answers, leave a blank space between words. For an answer with a hyphen, include the hyphen.
Across 1. a limiting factor that affects populations no
matter what their size
4. the number of males and females of each age in a population
7. moving out of the population’s range
8. a growth pattern in which population size stabilizes at a maximum limit
10. moving into a population’s range
11. a shift from high birthrates and death rates to low birthrates and death rates
12. the number of individuals per unit area
Down 2. the larger a population gets, the faster it
grows
3. a type of limiting factor that does not affect small, scattered populations very much
5. the maximum number of individuals of a species that an environment can support
6. a factor that controls the growth of a population
9. the study of human populations
1 2
3
4 5
6 7
8
9
10
11
12
D
D
E
E
NS L G
A
C
E N
I
W
PE
-
T N
D
Y I I
NT M
E A E
N T I R
N F P M
T O T A
H
R Y P
Y
E C C G
R
L
H
X
EI I R
Y
P G C D
G
A
T
ON
D I G
T
O
N
M
S I
A
UP
G
T
G
LO
R
Y
E
AP
A
-
T
P
I
S
I
H
I
N
T
O
I
M
D
R
N
C
M I
E
U
P
T
G
E
E
I T
S
I
S
A
I
E
T
ED
R
R
N
I
O
T
T
O
N
U
N
A
T
T
N
I
I
C
O N
O
I
L
ME
N
D
R
S
N
T
I
R
013368718X_CH05_067-080.indd 12 1/5/09 11:57:25 AM
Name Class Date
Learning
Continued on next page ▶
Name Class Date
Chapter 5 • Workbook A • Copyright © by Pearson Education, Inc., or its affi liates. All Rights Reserved.79
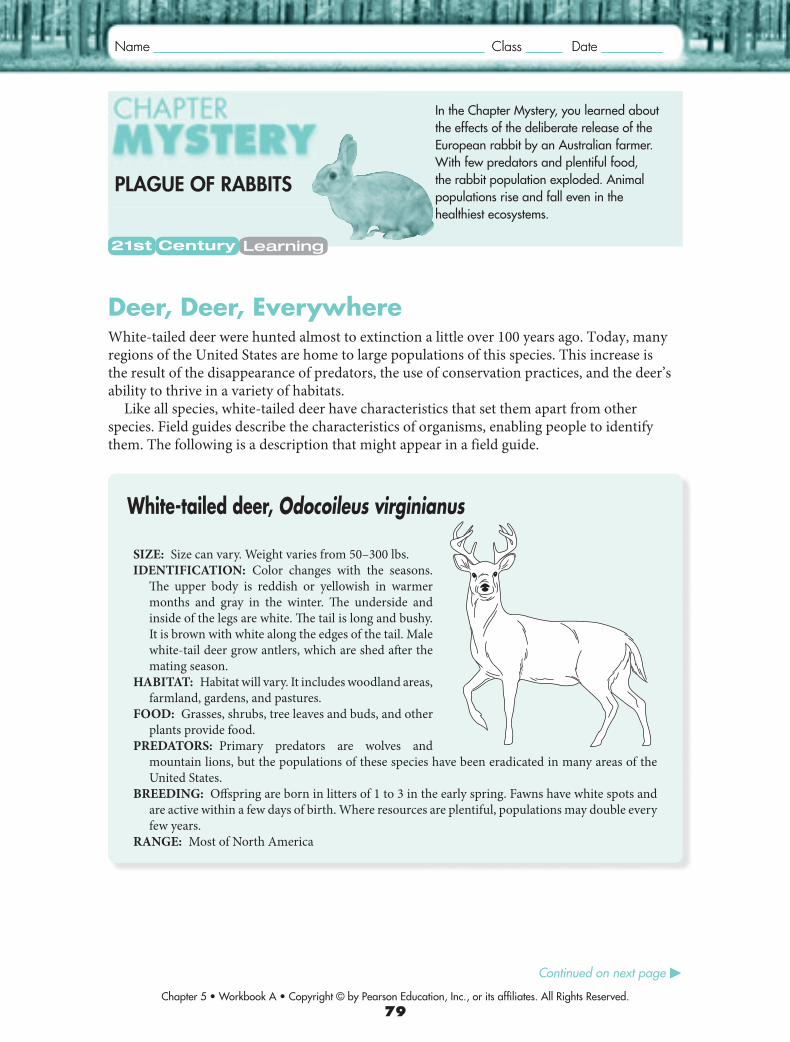
SIZE: Size can vary. Weight varies from 50–300 lbs.
IDENTIFICATION: Color changes with the seasons.
Th e upper body is reddish or yellowish in warmer
months and gray in the winter. Th e underside and
inside of the legs are white. Th e tail is long and bushy.
It is brown with white along the edges of the tail. Male
white-tail deer grow antlers, which are shed aft er the
mating season.
HABITAT: Habitat will vary. It includes woodland areas,
farmland, gardens, and pastures.
FOOD: Grasses, shrubs, tree leaves and buds, and other
plants provide food.
PREDATORS: Primary predators are wolves and
mountain lions, but the populations of these species have been eradicated in many areas of the
United States.
BREEDING: Off spring are born in litters of 1 to 3 in the early spring. Fawns have white spots and
are active within a few days of birth. Where resources are plentiful, populations may double every
few years.
RANGE: Most of North America
White-tailed deer, Odocoileus virginianus
In the Chapter Mystery, you learned about the effects of the deliberate release of the European rabbit by an Australian farmer. With few predators and plentiful food, the rabbit population exploded. Animal populations rise and fall even in the healthiest ecosystems.
PLAGUE OF RABBITS
Deer, Deer, EverywhereWhite-tailed deer were hunted almost to extinction a little over 100 years ago. Today, many regions of the United States are home to large populations of this species. This increase is the result of the disappearance of predators, the use of conservation practices, and the deer’s ability to thrive in a variety of habitats.
Like all species, white-tailed deer have characteristics that set them apart from other species. Field guides describe the characteristics of organisms, enabling people to identify them. The following is a description that might appear in a field guide.
013368718X_CH05_067-080.indd 13 1/5/09 11:57:28 AM
Name Class Date
Chapter 5 • Workbook A • Copyright © by Pearson Education, Inc., or its affi liates. All Rights Reserved.80
Themes Science and Health Literacy
Answer the following questions.
1. Based on the field guide excerpt, what animals prey on deer?
2. How might the habitat conditions in which deer thrive play a role in increasing their numbers?
3. How many offspring do white-tailed deer have each year? How might these numbers influence their population?
4. What do you think might happen if expanding human development led to a serious decrease in the amount of food available to white-tailed deer?
Controlling Deer Populations Learning
The skills used in this activity include information and media literacy; critical thinking and systems thinking; problem identification, formulation, and solution; and self-direction.
Work in a group to determine why white-tailed deer populations are increasing and to find out about the different techniques to manage these populations. Consult state and government Web sites, science articles, and newspaper articles. Present your findings in a report that describes the advantages and disadvantages of different methods of control. You might also want to present opposing viewpoints on the approach. Use maps, charts, and diagrams in your presentation.
Evaluate students’ presentation based on the data and facts and their sources.
The maps, charts, and diagrams should support and extend the information in the
oral report.
SAMPLE ANSWER: Deer can thrive in a variety of habitats, and this adaptability prob-
ably plays a role in increasing their numbers.
SAMPLE ANSWER: Wolves and mountain lions are the deer’s primary predators. Accord-
ing to the field guide, they no longer live in many areas where deer live.
White-tailed deer have one to three fawns each year. In the absence of predators
and the presence of plentiful food, deer populations can increase rapidly.
SAMPLE ANSWER: I think there would be competition for the reduced amount of vegeta-
tion, and eventually the population would decrease.
013368718X_CH05_067-080.indd 14 1/5/09 11:57:31 AM